Estimating Occupational Exposure to VOCs, SVOCs, Particles and Participant Survey Reported Symptoms in Central Thailand Rice Farmers Using Multiple Sampling Techniques
Abstract
:1. Introduction
2. Materials and Methods
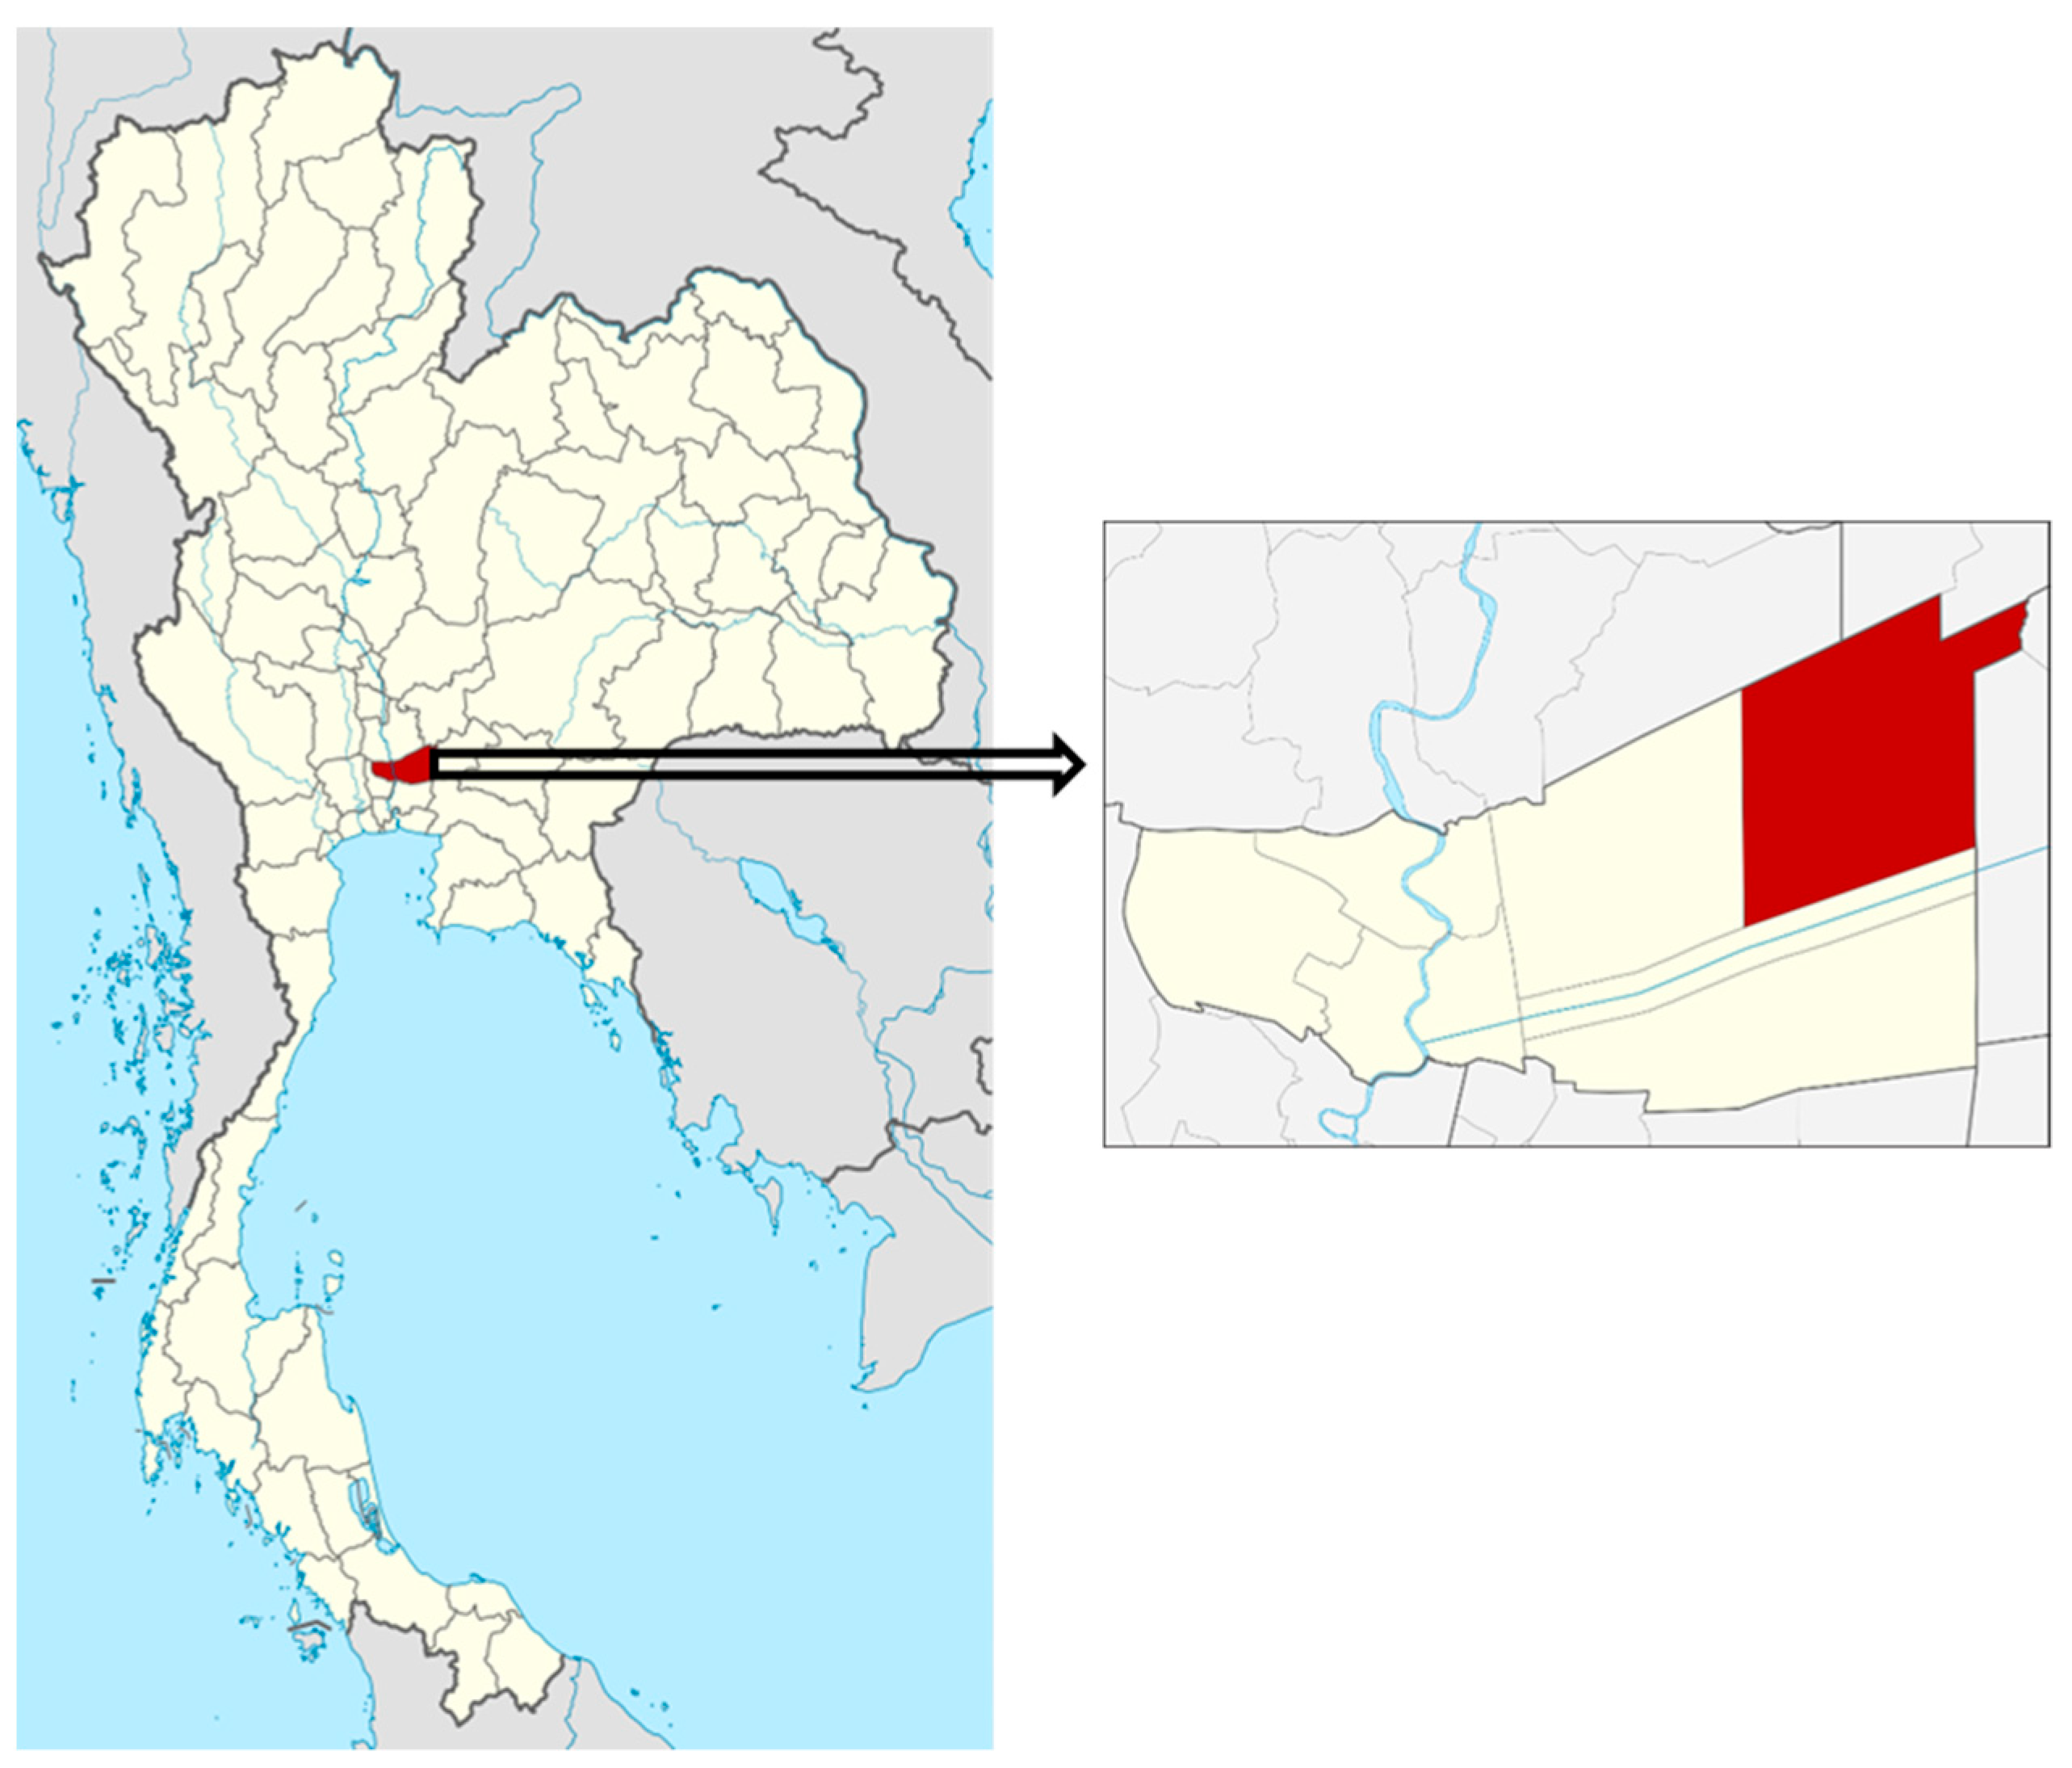
2.1. Study Site
2.2. Study Design
2.3. Participants
2.4. Materials and Methods
2.4.1. Questionnaire
2.4.2. Air Sampling Instruments
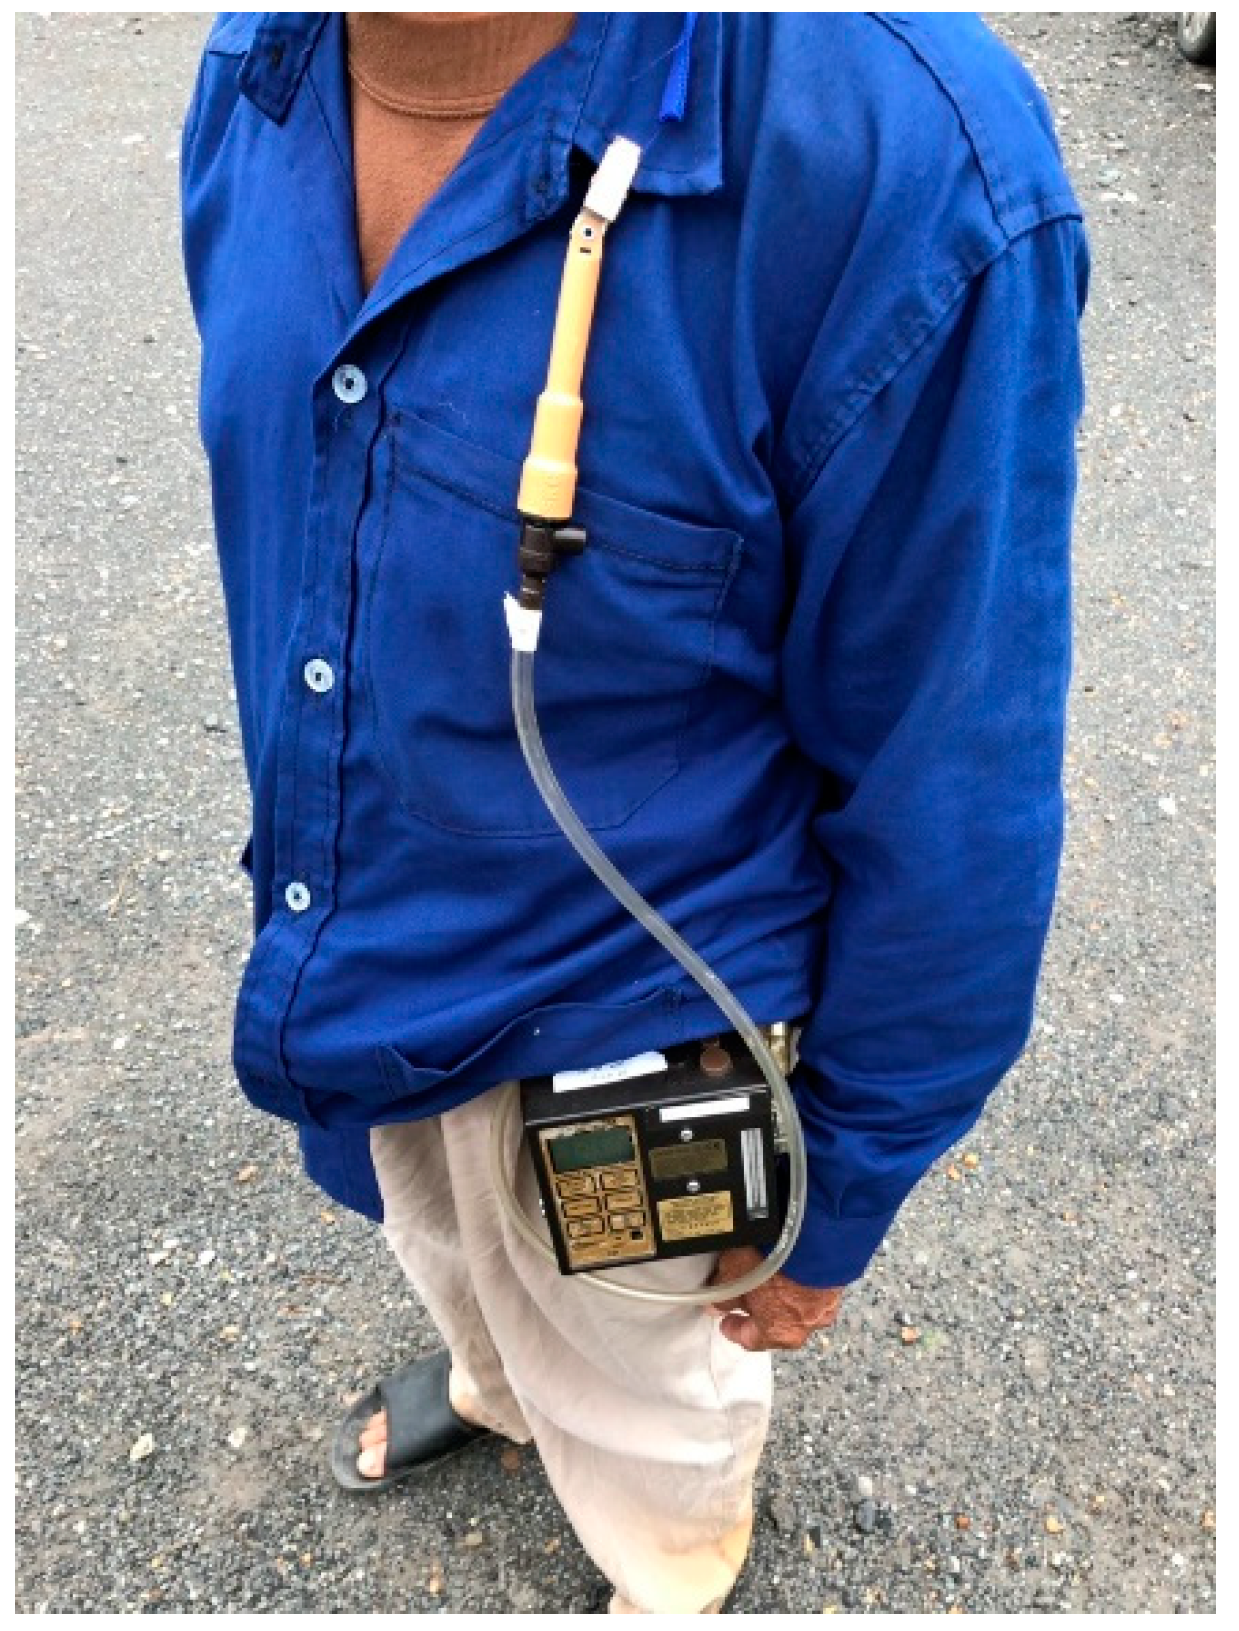
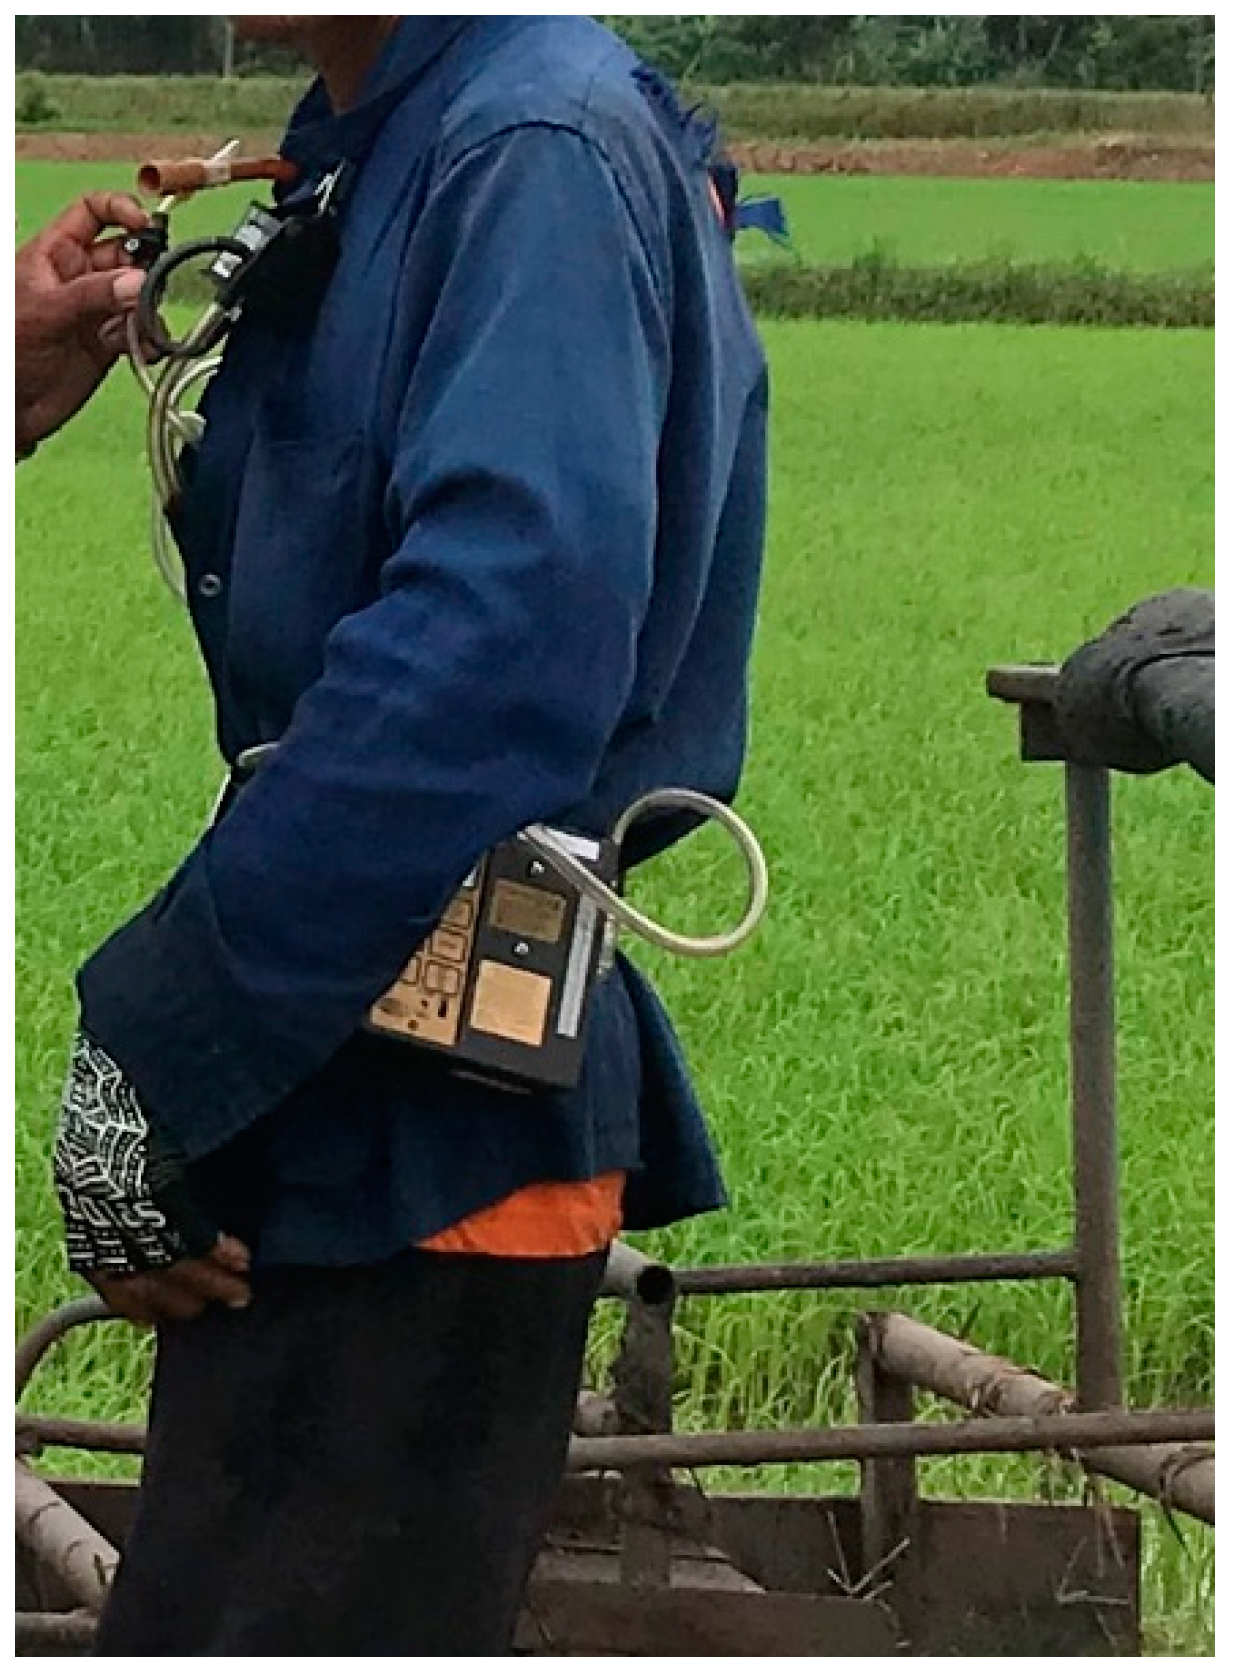
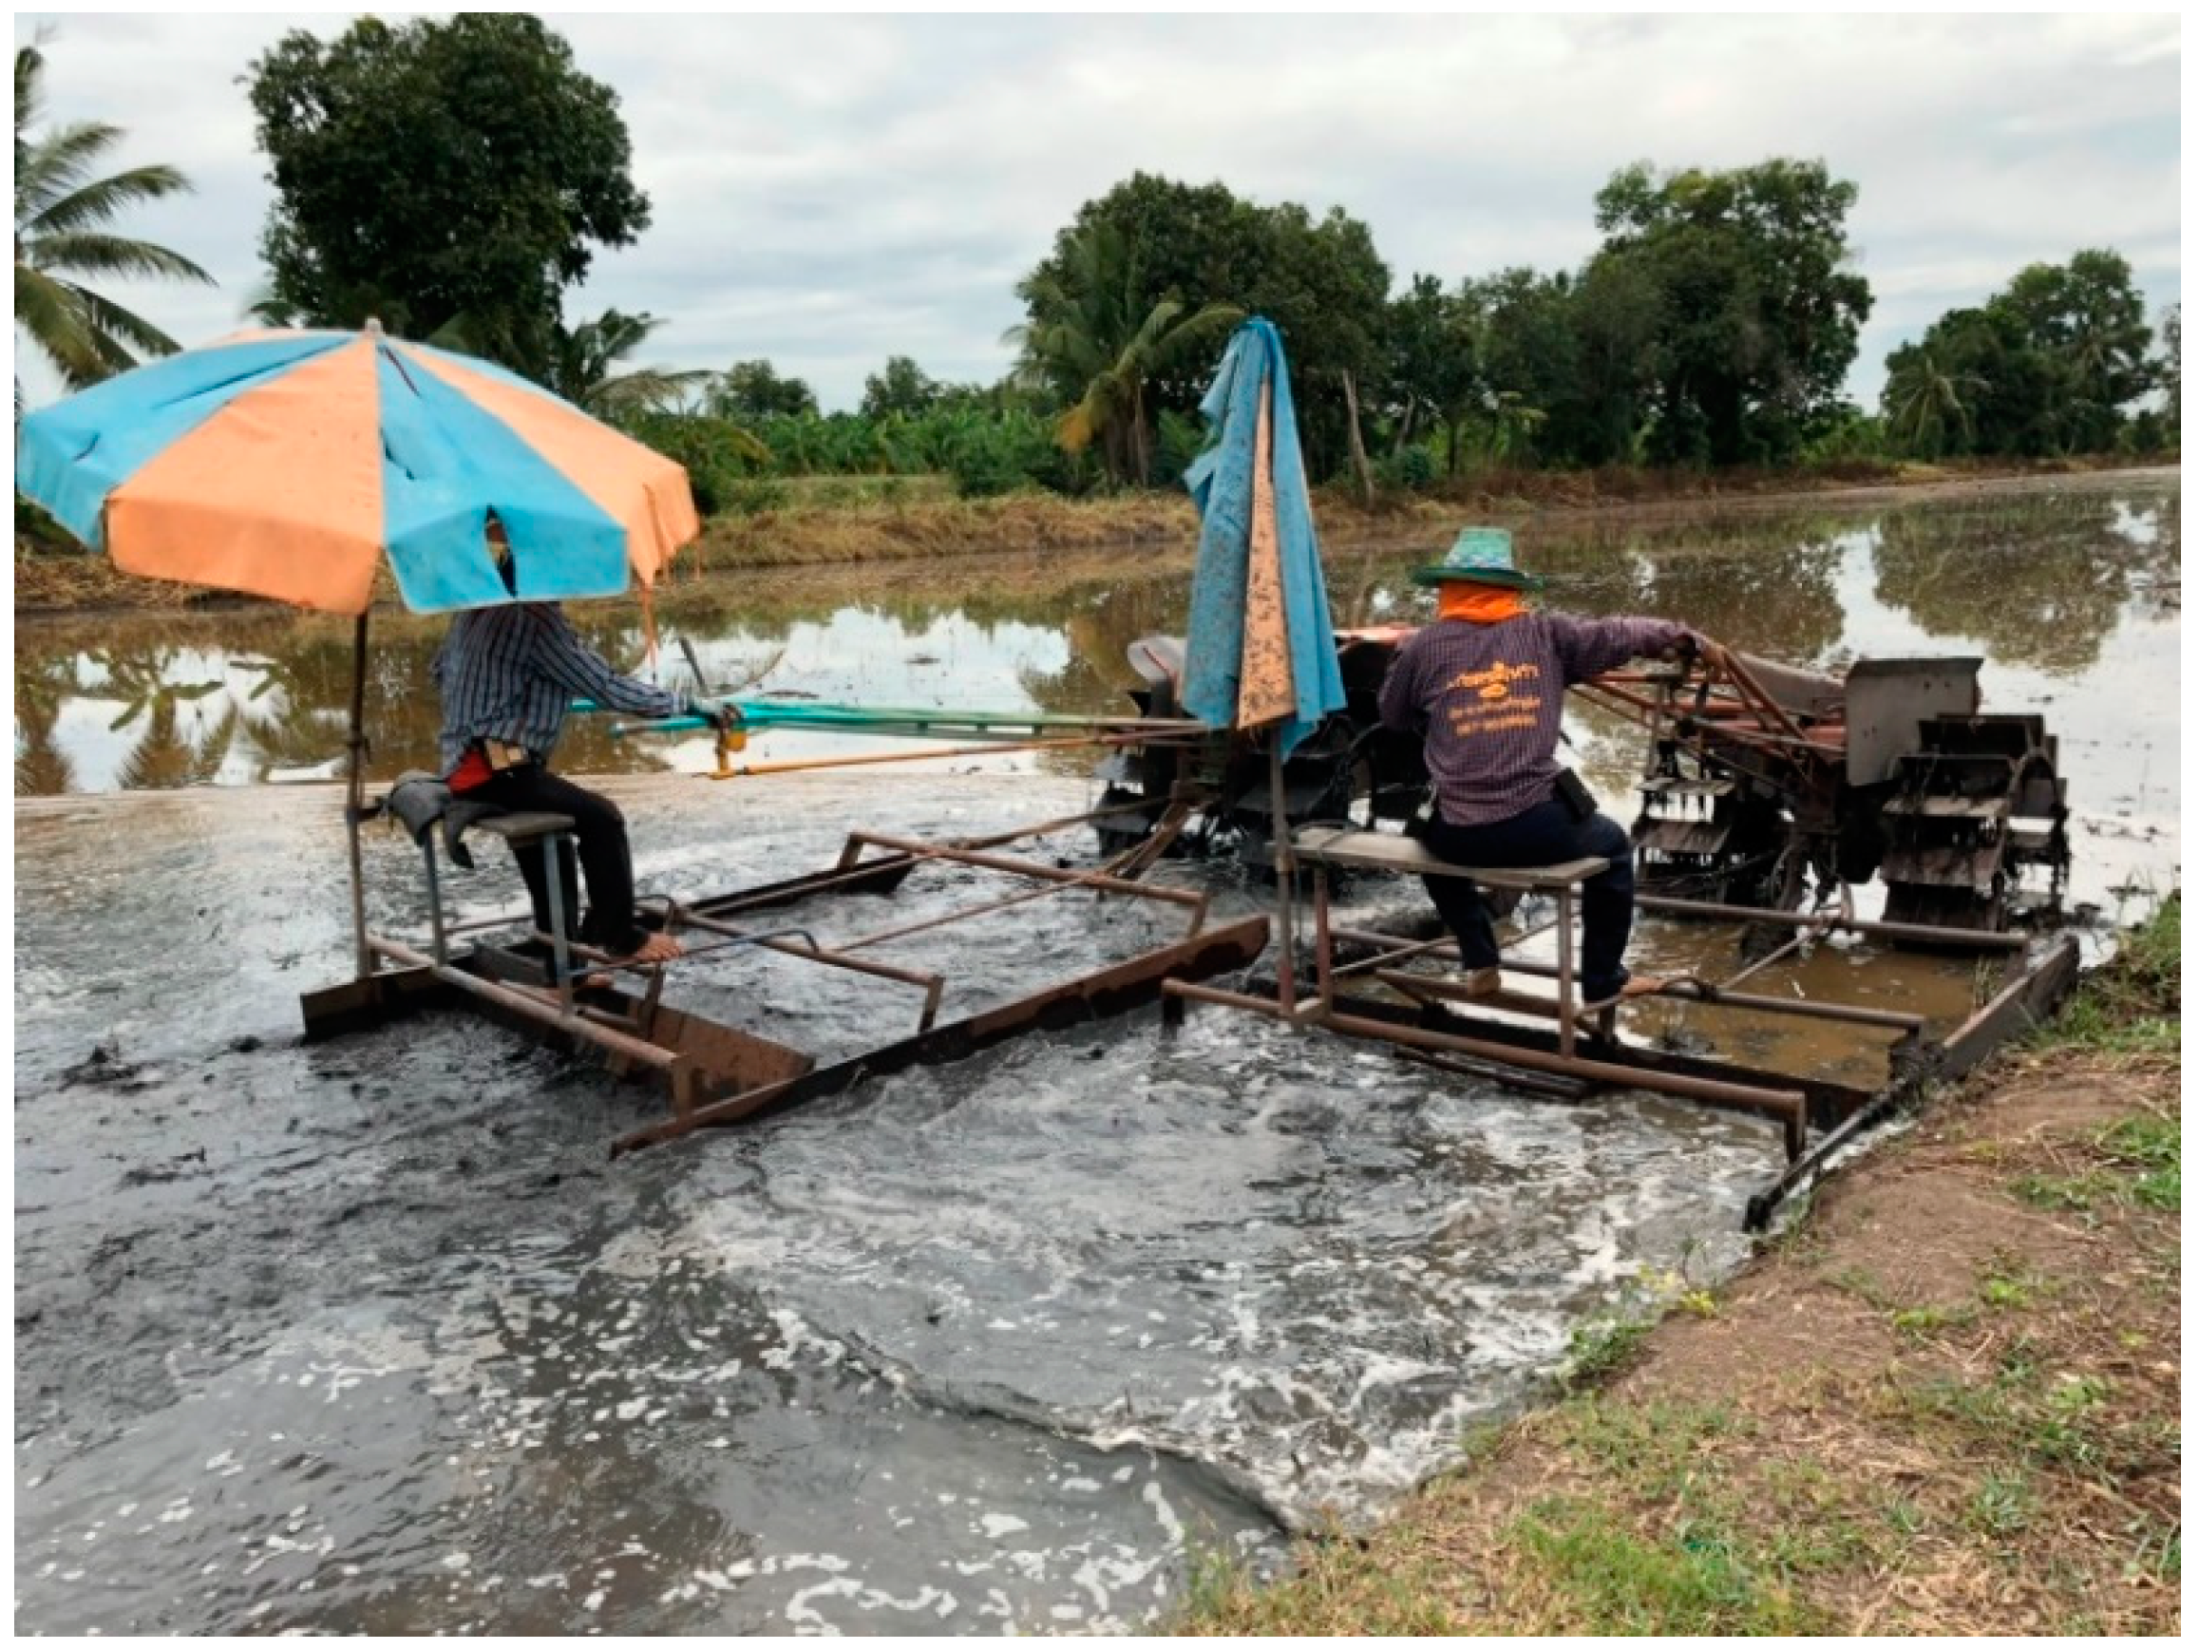
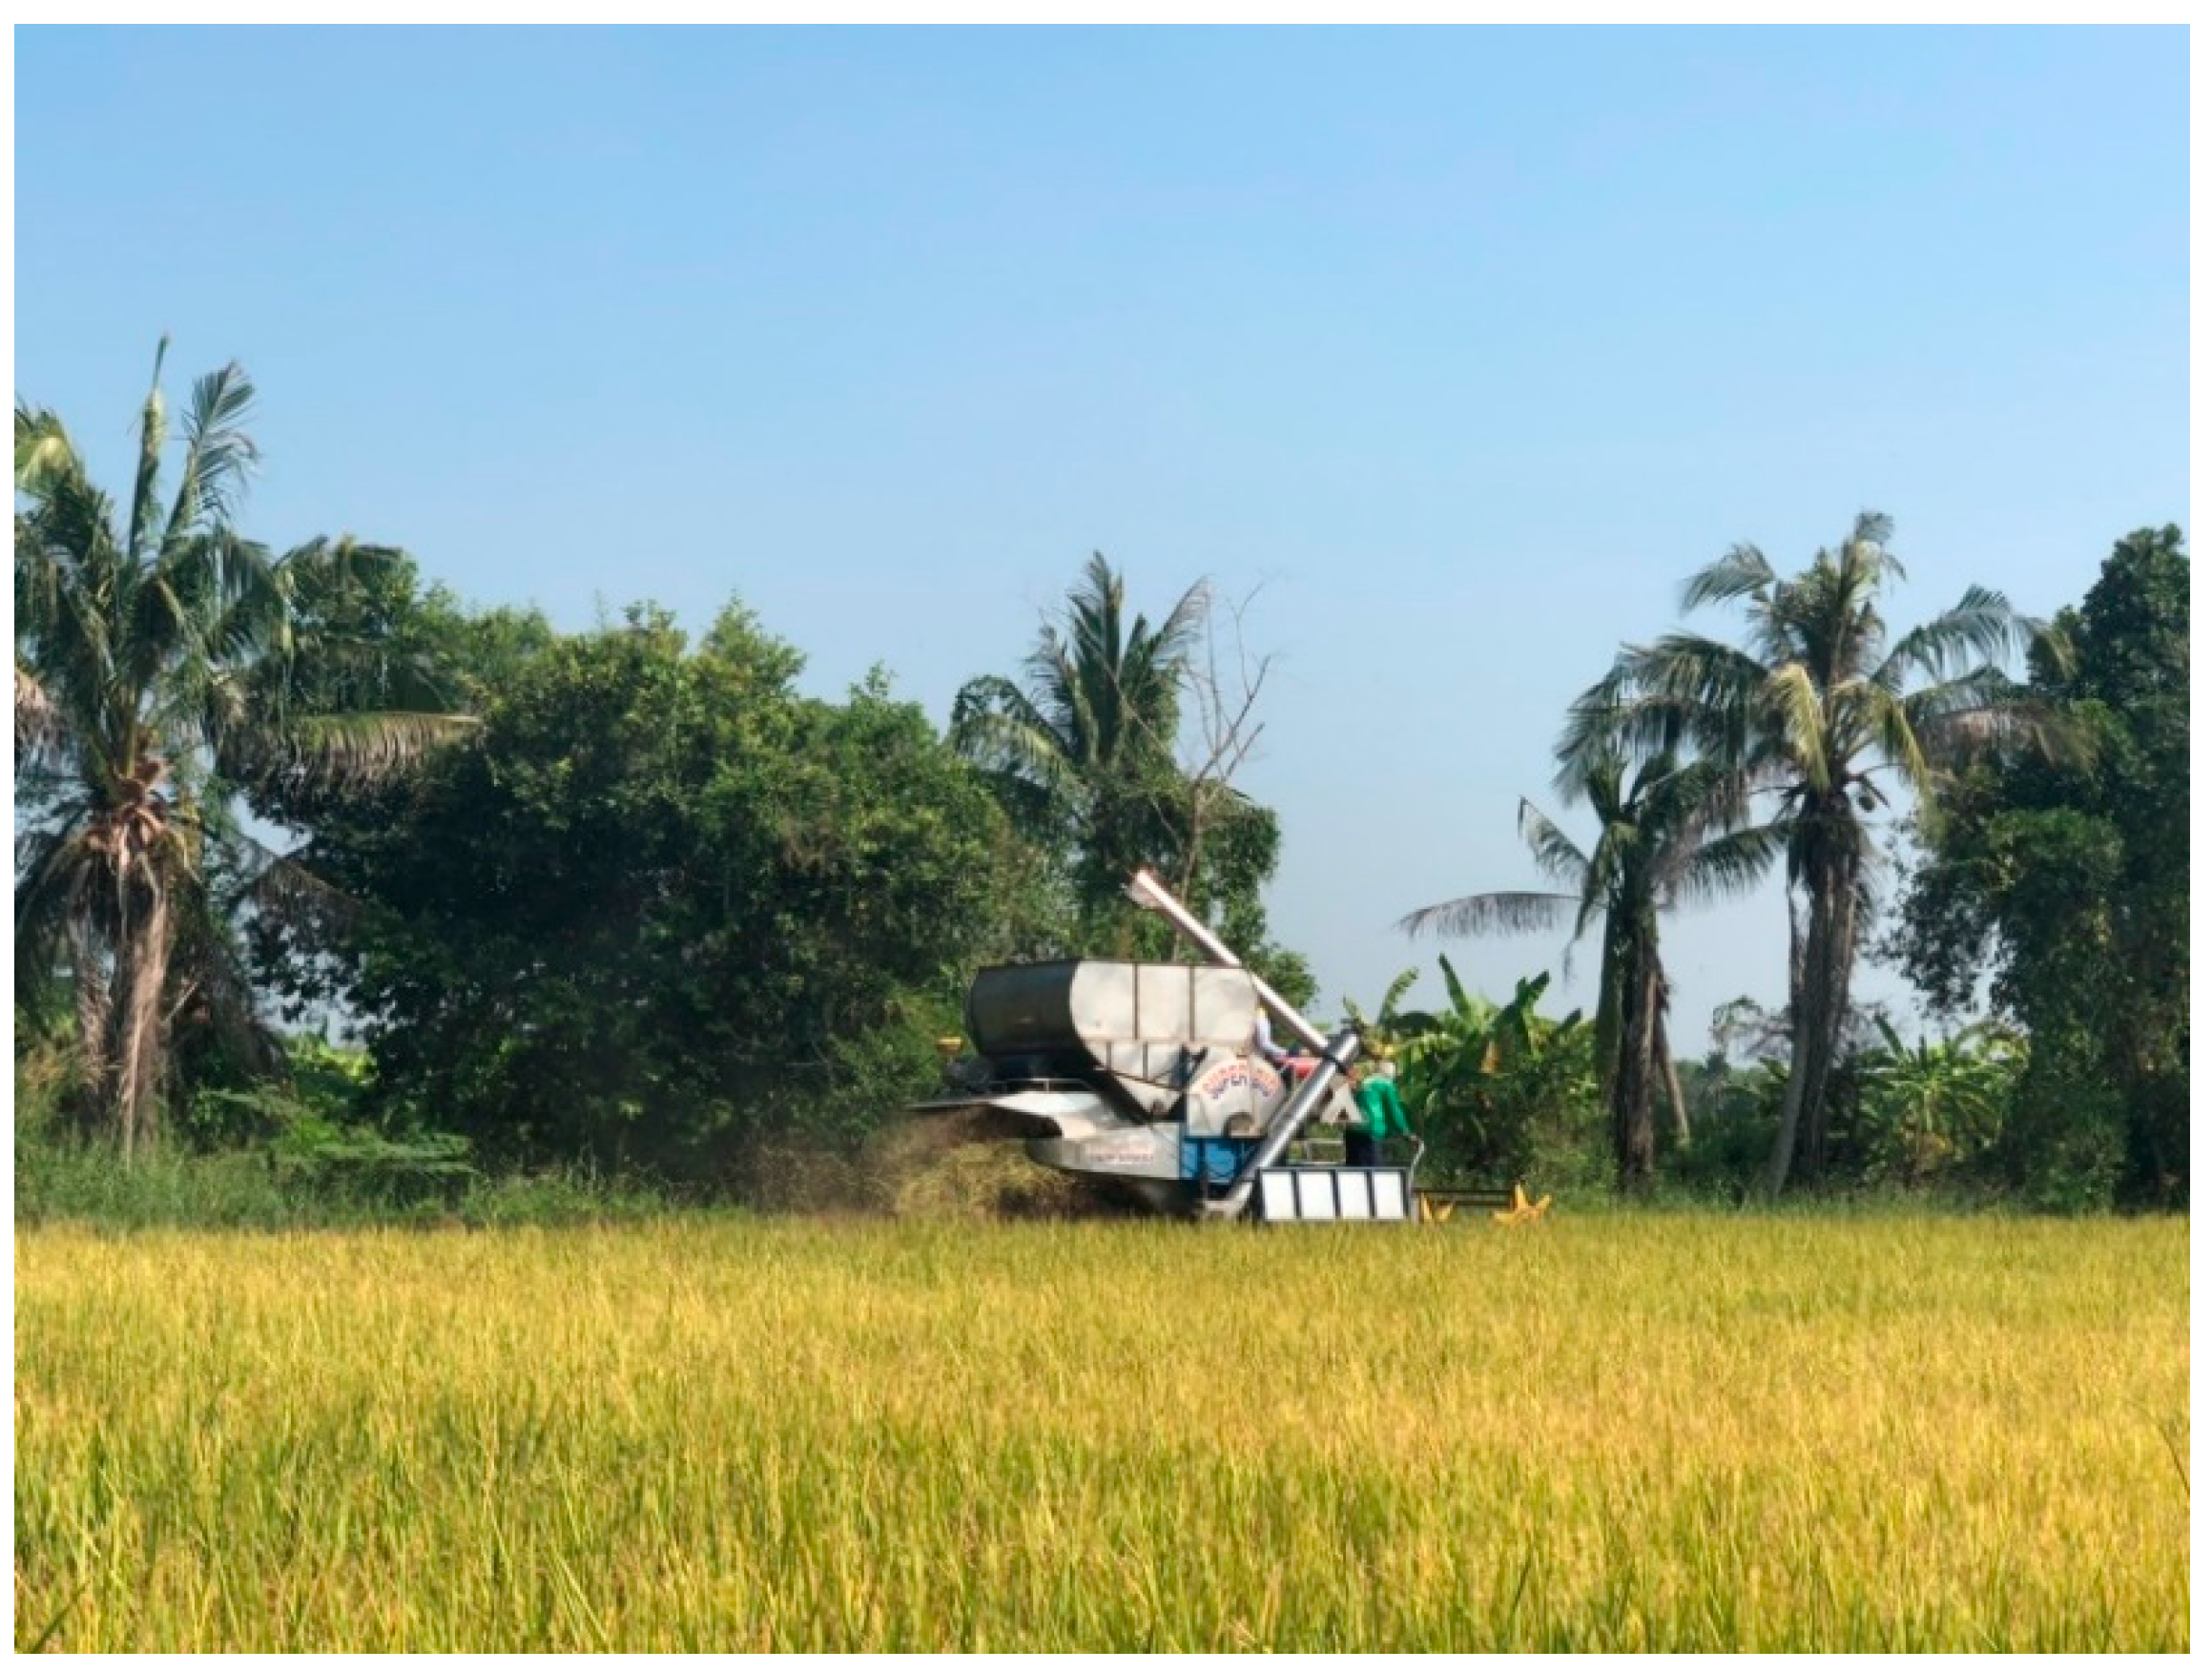
- Absorbent tube. NIOSH method #1501 was employed for VOC sampling and analysis [30]. Each personal sampling pump—SKC 224-PCXR8 with a representative sampler, 100 mg/50 mg coconut shell charcoal tube, in line was calibrated to obtain the flow rate of 0.2 L/min. The sampler equipment was attached to the farmer’s clothing in their breathing zone as shown in Figure 2. The air sampling was run while the farmer worked on their tasks, recalibration was conducted immediately after the air sampling ended, and the average flow rate before and after air collection was used for concentration calculation. The samples were capped and packed for shipment to the laboratory, where they were stored in the refrigerator at 4 °C until analysis within 30 days of sampling.
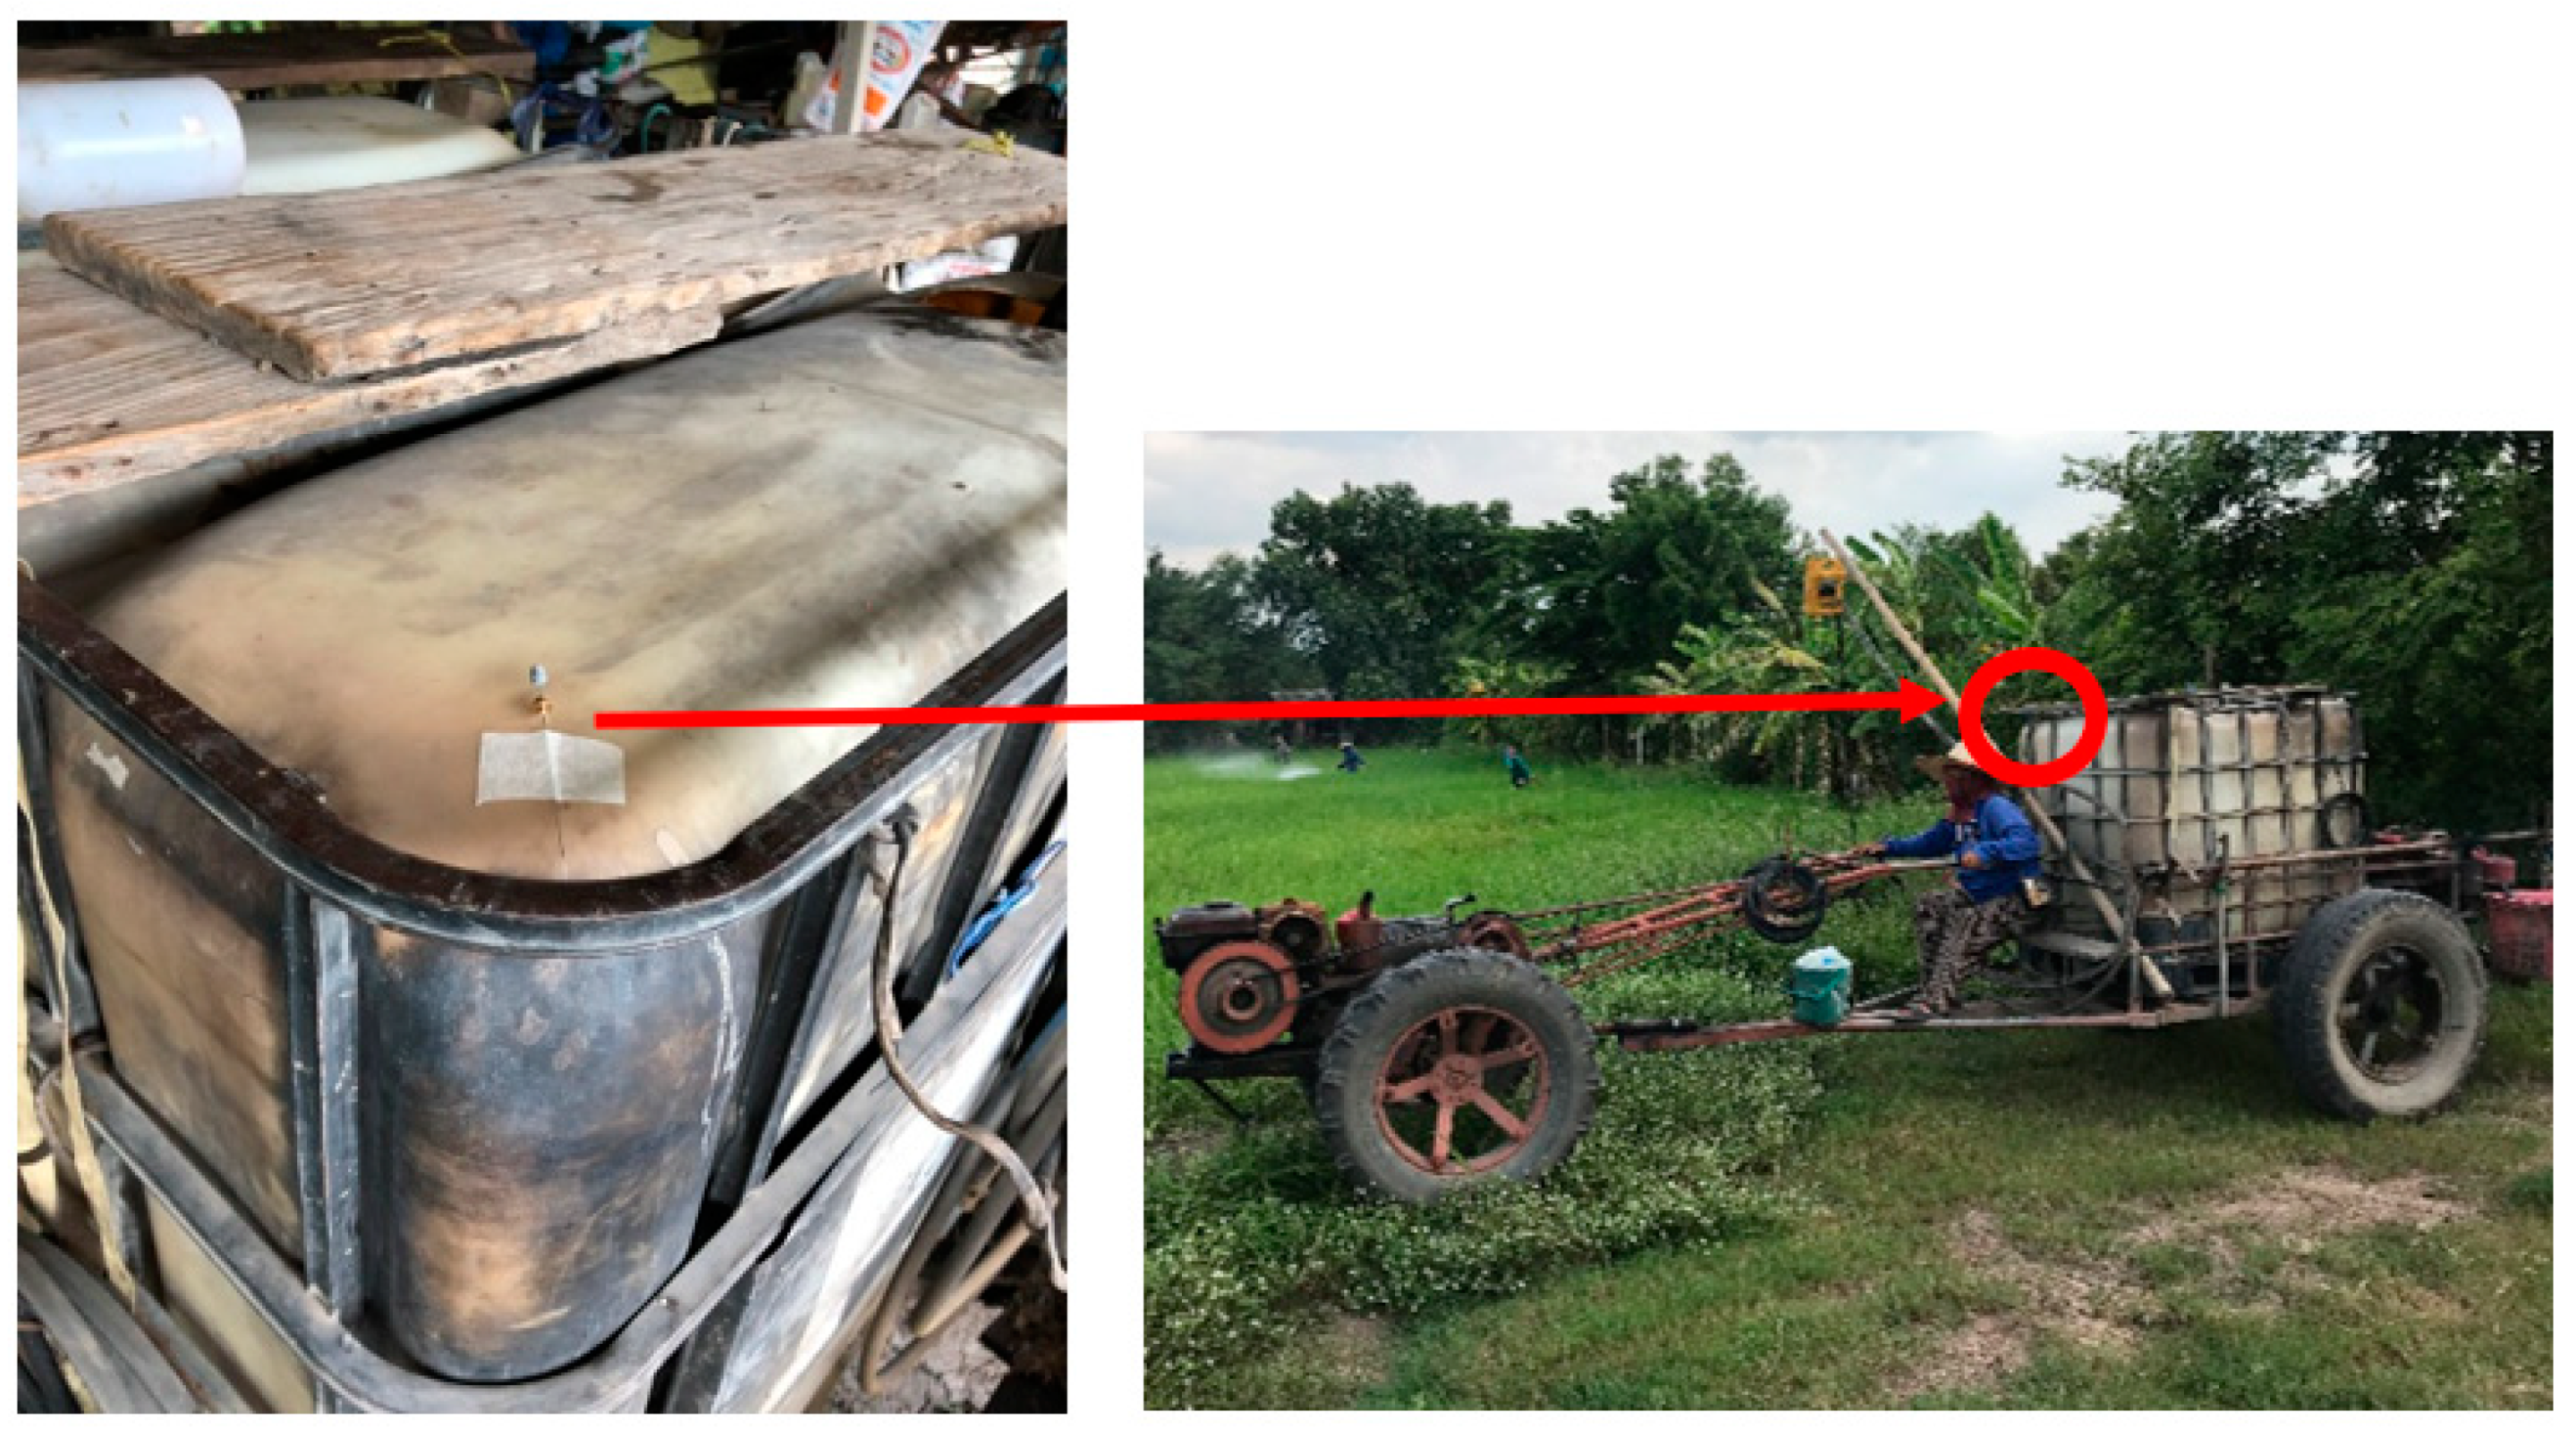
- Solid-Phase Micro-Extraction (SPME). The SPME, a passive but quick and universal sampling technique, does not require a pump or the use of organic solvents for analyte extraction and is used for the determination of various classes of pesticides and other VOCs and SVOCs in aqueous media or in other samples [31]. It is sensitive and convenient for field or laboratory use since equilibrium is quickly attained by adjusting factors including temperature, fiber type and exposure time, volume of sample, salt concentration, pH, and agitation [32]. For this study a 50/30 µm Divinylbenzene/Carboxen/Polydimethylsiloxane (DVB/CAR/PDMS), StableFlex/SS (2 cm), Manual Holder, gray fiber (SUPELCO, PA) fiber was used. The Solid-Phase Micro-Extraction (SPME) samples were placed beside farmers when in a sitting position while working and was exposed to the air beside the farmer’s working area, as shown in Figure 3. At the completion of sampling, the SPME fiber was retracted into the needle, putting the top of the fiber and the tip of the needle at the same position. The SPME fiber was stored in a glass tube with plastic caps and packed for shipment. All samples were then transported from the field by the researchers.
2.4.3. Air Sample Analyses
3. Results
4. Discussion
5. Conclusions
Author Contributions
Funding
Institutional Review Board Statement
Informed Consent Statement
Acknowledgments
Conflicts of Interest
References
- Clausnitzer, H.; Singer, M. Intensive land preparation emits respirable dust. Calif. Agric. 1997, 51, 27–30. [Google Scholar] [CrossRef]
- Kjelgaard, J.; Sharratt, B.; Sundram, I.; Lamb, B.; Claiborn, C.; Saxton, K.; Chandler, D. PM10 emission from agricultural soils on the Columbia Plateau: Comparison of dynamic and time-integrated field-scale measurements and entrainment mechanisms. Agric. For. Meteorol. 2004, 125, 259–277. [Google Scholar] [CrossRef]
- Erisman, J.W.; Bleeker, A.; Hensen, A.; Vermeulen, A. Agricultural air quality in Europe and the future perspectives. Atmos. Environ. 2008, 42, 3209–3217. [Google Scholar] [CrossRef] [Green Version]
- Qiu, G.; Pattey, E. Estimating PM10 emissions from spring wheat harvest using an atmospheric tracer technique. Atmos. Environ. 2008, 42, 8315–8321. [Google Scholar] [CrossRef]
- Taneepanichskul, N.; Norkaew, S.; Siriwong, W.; Robson, M. Health effects related to pesticide using and practicing among chilli-growing farmers, northeastern, Thailand. J. Med. Med. Sci. 2012, 3, 319–325. [Google Scholar]
- Norkaew, S.; Taneepanichskul, N.; Siriwong, W.; Siripattanakul, S.; Robson, M. Indirect Exposure of Farm and Non-Farm Families in an Agricultural Community, Ubonratchathani Province, Thailand. J. Health Res. 2013, 27, 79–84. [Google Scholar]
- Cassel, T.; Trzepla-Nabaglo, K.; Flocchini, R. PM10 emission factors for harvest and tillage of row crops. In Proceedings of the 12th International Emission Inventory Conference, San Diego, CA, USA, 28 April–1 May 2003. [Google Scholar]
- Liu, K.; Di, J.; Zhang, Y. Health risk assessment of benzene series emission by gasoline engine with three way catalytic converter. J. Environ. Health 2009, 26, 31–32. [Google Scholar]
- Hansmeier, A.R.; Meindersma, G.W.; de Haan, A.B. Desulfurization and denitrogenation of gasoline and diesel fuels by means of ionic liquids. Green Chem. 2011, 13, 1907–1913. [Google Scholar] [CrossRef]
- Beyler, C. Flammability limits of premixed and diffusion flames. In SFPE Handbook of Fire Protection Engineering; Springer: Berlin/Heidelberg, Germany, 2016; pp. 529–553. [Google Scholar]
- von Stackelberg, K.; Buonocore, J.; Bhave, P.V.; Schwartz, J.A. Public health impacts of secondary particulate formation from aromatic hydrocarbons in gasoline. Environ. Health 2013, 12, 192013. [Google Scholar] [CrossRef] [Green Version]
- World Health Organization. 7 million premature deaths annually linked to air pollution. Available online: https://www.who.int/news/item/25-03-2014-7-million-premature-deaths-annually-linked-to-air-pollution (accessed on 23 January 2018).
- Laden, F.; Schwartz, J.; Speizer, F.E.; Dockery, D.W. Reduction in fine particulate air pollution and mortality: Extended follow-up of the Harvard Six Cities study. Am. J. Respir. Crit. Care Med. 2006, 173, 667–672. [Google Scholar] [CrossRef] [PubMed]
- Hopke, P.K. The use of source apportionment for air quality management and health assessments. J. Toxicol. Environ. Health Part A 2008, 71, 555–563. [Google Scholar] [CrossRef]
- Kelly, R.J. Occupational medicine implications of engineered nanoscale particulate matter. J. Chem. Health Saf. 2009, 16, 24–39. [Google Scholar] [CrossRef] [Green Version]
- Laumbach, R.J.; Kipen, H.M. Respiratory health effects of air pollution: Update on biomass smoke and traffic pollution. J. Allergy Clin. Immunol. 2012, 129, 3–11. [Google Scholar] [CrossRef] [PubMed] [Green Version]
- Ruzer, L.S.; Harley, N.H. Aerosols Handbook: Measurement, Dosimetry, and Health Effects; CRC Press: Boca Raton, FL, USA, 2012. [Google Scholar]
- Leech, J.A.; Nelson, W.C.; Burnett, R.T.; Aaron, S.; Raizenne, M.E. It’s about time: A comparison of Canadian and American time–activity patterns. J. Expo. Sci. Environ. Epidemiol. 2002, 12, 427. [Google Scholar] [CrossRef] [PubMed] [Green Version]
- Adgate, J.; Ramachandran, G.; Pratt, G.; Waller, L.; Sexton, K. Longitudinal variability in outdoor, indoor, and personal PM 2.5 exposure in healthy non-smoking adults. Atmos. Environ. 2003, 37, 993–1002. [Google Scholar] [CrossRef]
- Lai, H.; Kendall, M.; Ferrier, H.; Lindup, I.; Alm, S.; Hänninen, O.; Jantunen, M.; Mathys, P.; Colvile, R.; Ashmore, M. Personal exposures and microenvironment concentrations of PM2. 5, VOC, NO2 and CO in Oxford, UK. Atmos. Environ. 2004, 38, 6399–6410. [Google Scholar] [CrossRef]
- Brasche, S.; Bischof, W. Daily time spent indoors in German homes–baseline data for the assessment of indoor exposure of German occupants. Int. J. Hyg. Environ. Health 2005, 208, 247–253. [Google Scholar] [CrossRef]
- Auvermann, B.W.; Hiranuma, N.; Heflin, K.; Marek, G.W. Open-path transmissometry for measurement of visibility impairment by fugitive emissions from livestock facilities. In Proceedings of the 2004 ASAE Annual Meeting, Ottawa, ON, Canada, 1–4 August 2004; p. 1. [Google Scholar]
- Bhat, A.; Kumar, A. Particulate characteristics and emission rates during the injection of class B biosolids into an agricultural field. Sci. Total. Environ. 2012, 414, 328–334. [Google Scholar] [CrossRef]
- Claiborn, C. Agriculture and air quality—airborne particulate matter. In Proceedings of the Workshop on Agricultural Air Quality, Washington, DC, USA, 5–8 June 2006; pp. 355–356. [Google Scholar]
- Pathumthani Agricultural Extention. Agricultural Database 2016/2017; Pathumthani Agricultural Extention: Pathumthani, Thailand, 2017. [Google Scholar]
- Office of The Permanent Secretary for Ministry of Agriculture and Cooperatives. Pathumthani Data Base; Office of The Permanent Secretary for Ministry of Agriculture and Cooperatives: Bangkok, Thailand, 2018.
- Wikimedia. Thailand Pathum Thani Locator Map. 2018. Available online: https://commons.wikimedia.org/wiki/File:Thailand_Pathum_Thani_locator_map.svg (accessed on 29 August 2021).
- Wikipedia. Nong Suea District. 2019. Available online: https://en.wikipedia.org/wiki/Nong_Suea_District (accessed on 25 August 2021).
- Issa, Y.; Sham’a, F.A.; Nijem, K.; Bjertness, E.; Kristensen, P. Pesticide use and opportunities of exposure among farmers and their families: Cross-sectional studies 1998-2006 from Hebron governorate, occupied Palestinian territory. Environ. Health 2010, 9, 63. [Google Scholar] [CrossRef] [PubMed] [Green Version]
- The National Institute for Occupational Safety and Health (NIOSH). Hydrocarbons, Aromatic: Method 1501. In Manual of Analytical Methods; National Institute of Occupational Safety and Health: Cincinnati, OH, USA, 1997. [Google Scholar]
- Tankiewicz, M.; Morrison, C.; Biziuk, M. Multi-residue method for the determination of 16 recently used pesticides from various chemical groups in aqueous samples by using DI-SPME coupled with GC–MS. Talanta 2013, 107, 1–10. [Google Scholar] [CrossRef]
- Bojko, B.; Cudjoe, E.; Gómez-Ríos, G.A.; Gorynski, K.; Jiang, R.; Reyes-Garcés, N.; Risticevic, S.; Silva, É.A.; Togunde, O.; Vuckovic, D. SPME–Quo vadis? Anal. Chim. Acta 2012, 750, 132–151. [Google Scholar] [CrossRef] [PubMed]
- Tursumbayeva, M.; Koziel, J.A.; Maurer, D.L.; Kenessov, B.; Rice, S. Development of Time-Weighted Average Sampling of Odorous Volatile Organic Compounds in Air with Solid-Phase Microextraction Fiber Housed inside a GC Glass Liner: Proof of Concept. Molecules 2019, 24, 406. [Google Scholar] [CrossRef] [Green Version]
- Occupational Safety and Health Administration (OSHA). Methylene Chloride; OSHA: Washington, DC, USA, 2003.
- Occupational Safety and Health Administration (OSHA). Substance Safety Data Sheet, Benzene; OSHA: Washington, DC, USA.
- New Jersey Department of Health. Benzene, (1-Methylethyl); New Jersey Department of Health: Trenton, NJ, USA, 2008.
- The National Institute for Occupational Safety and Health (NIOSH). 1,3,5-Trimethylbenzene; NIOSH: Atlanta, GA, USA, 2019.
- The National Institute for Occupational Safety and Health (NIOSH). NAPHTHALENE; NIOSH: Atlanta, GA, USA, 2011.
- The National Institute for Occupational Safety and Health (NIOSH). Appendix G: 1989 Air Contaminants Update Project—Exposure Limits NOT in Effect; NIOSH: Atlanta, GA, USA, 2018.
- Stiles, R.; Yang, I.; Lippincott, R.L.; Murphy, E.; Buckley, B. Potential sources of background contaminants in solid phase extraction and microextraction. J. Sep. Sci. 2007, 30, 1029–1036. [Google Scholar] [CrossRef] [PubMed]
- Stiles, R.; Yang, I.; Lippincott, R.L.; Murphy, E.; Buckley, B. Measurement of drinking water contaminants by solid phase microextraction initially quantified in source water samples by the USGS. Environ. Sci. Technol. 2008, 42, 2976–2981. [Google Scholar] [CrossRef]
- Fung, A.G.; Yamaguchi, M.S.; McCartney, M.M.; Aksenov, A.A.; Pasamontes, A.; Davis, C.E. SPME-based mobile field device for active sampling of volatiles. Microchem. J. 2019, 146, 407–413. [Google Scholar] [CrossRef]
- Zhao, G.; Yin, G.; Inamdar, A.; Luo, J.; Zhang, N.; Yang, I.; Buckley, B.; Bennett, J. Volatile organic compounds emitted by filamentous fungi isolated from flooded homes after Hurricane Sandy show toxicity in a Drosophila bioassay. Indoor Air 2017, 27, 518–528. [Google Scholar] [CrossRef]
- Sawoszczuk, T.; Syguła-Cholewińska, J.; del Hoyo-Meléndez, J.M. Optimization of headspace solid phase microextraction for the analysis of microbial volatile organic compounds emitted by fungi: Application to historical objects. J. Chromatogr. A 2015, 1409, 30–45. [Google Scholar] [CrossRef]
- Garcia-Alcega, S.; Nasir, Z.A.; Ferguson, R.; Whitby, C.; Dumbrell, A.J.; Colbeck, I.; Gomes, D.; Tyrrel, S.; Coulon, F. Fingerprinting outdoor air environment using microbial volatile organic compounds (MVOCs)–A review. TrAC Trends Anal. Chem. 2017, 86, 75–83. [Google Scholar] [CrossRef] [Green Version]
- Cheng, W.-H.; Huang, H.-L.; Chen, K.-S.; Chang, Y.-J. Quantification of VOC emissions from paint spraying on a construction site using solid phase microextraction devices. J. Environ. Sci. Health Part A 2017, 52, 1158–1163. [Google Scholar] [CrossRef]
- The National Institute for Occupational Safety and Health (NIOSH). Particulates Not Otherwise Regulated; NIOSH: Atlanta, GA, USA, 2019.
- Eddleston, M.; Karalliedde, L.; Buckley, N.; Fernando, R.; Hutchinson, G.; Isbister, G.; Konradsen, F.; Murray, D.; Piola, J.C.; Senanayake, N. Pesticide poisoning in the developing world—a minimum pesticides list. Lancet 2002, 360, 1163–1167. [Google Scholar] [CrossRef]
- Norkaew, S.; Siriwong, W.; Siripattanakul, S.; Robson, M. Knowledge, attitude, and practice (KAP) of using personal protective equipment (PPE) for chilli-growing farmers in Huarua Sub-District, Mueang District, Ubonrachathani Province, Thailand. J. Health Res. 2010, 24, 93–100. [Google Scholar]
- Punkhun, S.; Norkaew, S. Knowledge, attitudes, and practices (KAP) related to blood cholinesterase level among tobacco farmers in Northern Thailand. Hum. Ecol. Risk Assess. Int. J. 2020, 26, 283–294. [Google Scholar] [CrossRef]
- Kachaiyaphum, P.; Howteerakul, N.; Sujirarat, D.; Siri, S.; Suwannapong, N. Serum cholinesterase levels of Thai chilli-farm workers exposed to chemical pesticides: Prevalence estimates and associated factors. J. Occup. Health 2010, 52, 89–98. [Google Scholar] [CrossRef] [Green Version]
- Yassin, M.; Mourad, T.A.; Safi, J. Knowledge, attitude, practice, and toxicity symptoms associated with pesticide use among farm workers in the Gaza Strip. Occup. Environ. Med. 2002, 59, 387–393. [Google Scholar] [CrossRef] [Green Version]
- Salameh, P.R.; Baldi, I.; Brochard, P.; Saleh, B.A. Pesticides in Lebanon: A knowledge, attitude, and practice study. Environ. Res. 2004, 94, 1–6. [Google Scholar] [CrossRef]
- Mekonnen, Y.; Agonafir, T. Pesticide sprayers’ knowledge, attitude and practice of pesticide use on agricultural farms of Ethiopia. Occup. Med. 2002, 52, 311–315. [Google Scholar] [CrossRef] [Green Version]
- Taneepanichskul, N.; Norkaew, S.; Siriwong, W.; Robson, M.G. Pesticide Application and Safety Behaviour among Male and Female Chilli-Growing Farmers in Hua Rua Sub-District, Ubon Ratchathani Province, Thailand. J. Health Res. 2012, 26, 193–197. [Google Scholar]
- Wesseling, C.; Keifer, M.; Ahlbom, A.; McConnell, R.; Moon, J.-D.; Rosenstock, L.; Hogstedt, C. Long-term neurobehavioral effects of mild poisonings with organophosphate and n-methyl carbamate pesticides among banana workers. Int. J. Occup. Environ. Health 2002, 8, 27–34. [Google Scholar] [CrossRef]
- Norkaew, S.; Lertmaharit, S.; Wilaiwan, W.; Siriwong, W.; Pérez, H.M.; Robson, M.G. An association between organophosphate pesticides exposure and Parkinsonism amongst people in an agricultural area in Ubon Ratchathani Province, Thailand. Rocz. Państwowego Zakładu Hig. 2015, 66, 21–26. [Google Scholar]
- Gostner, J.M.; Zeisler, J.; Alam, M.T.; Gruber, P.; Fuchs, D.; Becker, K.; Neubert, K.; Kleinhappl, M.; Martini, S.; Überall, F. Cellular reactions to long-term volatile organic compound (VOC) exposures. Sci. Rep. 2016, 6, 1–14. [Google Scholar] [CrossRef]
- Sankoh, A.I.; Whittle, R.; Semple, K.T.; Jones, K.C.; Sweetman, A.J. An assessment of the impacts of pesticide use on the environment and health of rice farmers in Sierra Leone. Environ. Int. 2016, 94, 458–466. [Google Scholar] [CrossRef] [Green Version]
- Audi, C.; Baïz, N.; Maesano, C.N.; Ramousse, O.; Reboulleau, D.; Magnan, A.; Caillaud, D.; Annesi-Maesano, I. Serum cytokine levels related to exposure to volatile organic compounds and PM2. 5 in dwellings and workplaces in French farmers—A mechanism to explain nonsmoking COPD. Int. J. Chronic Obstr. Pulm. Dis. 2017, 12, 1363. [Google Scholar] [CrossRef] [Green Version]
- Li, R.; Chen, W.; Xiu, A.; Zhao, H.; Zhang, X.; Zhang, S.; Tong, D.Q. A comprehensive inventory of agricultural atmospheric particulate matters (PM10 and PM2. 5) and gaseous pollutants (VOCs, SO2, NH3, CO, NOx and HC) emissions in China. Ecol. Indic. 2019, 107, 105609. [Google Scholar] [CrossRef]
- Ge, J.C.; Kim, H.Y.; Yoon, S.K.; Choi, N.J. Reducing volatile organic compound emissions from diesel engines using canola oil biodiesel fuel and blends. Fuel 2018, 218, 266–274. [Google Scholar] [CrossRef]
- WorldWeatherOnline. Pathum Thani Historical Weather. 2020. Available online: https://www.worldweatheronline.com/pathum-thani-weather-history/pathum-thani/th.aspx (accessed on 20 July 2021).
- Kovats, R.S.; Hajat, S.; Wilkinson, P. Contrasting patterns of mortality and hospital admissions during hot weather and heat waves in Greater London, UK. Occup. Environ. Med. 2004, 61, 893–898. [Google Scholar] [CrossRef] [PubMed] [Green Version]
- Hajat, S.; O’Connor, M.; Kosatsky, T. Health effects of hot weather: From awareness of risk factors to effective health protection. Lancet 2010, 375, 856–863. [Google Scholar] [CrossRef]
- Strong, L.L.; Thompson, B.; Coronado, G.D.; Griffith, W.C.; Vigoren, E.M.; Islas, I. Health symptoms and exposure to organophosphate pesticides in farmworkers. Am. J. Ind. Med. 2004, 46, 599–606. [Google Scholar] [CrossRef] [PubMed]
- Halvani, G.H.; Jafari Nodoushan, R.; Halvani, E. Evaluation of respiratory symptoms and lung function disorders of farmers in Yazd Province. J. Community Health Res. 2019, 8, 177–185. [Google Scholar] [CrossRef]
- Ngowi, A.; Mbise, T.; Ijani, A.; London, L.; Ajayi, O. Smallholder vegetable farmers in Northern Tanzania: Pesticides use practices, perceptions, cost and health effects. Crop Prot. 2007, 26, 1617–1624. [Google Scholar] [CrossRef] [PubMed] [Green Version]
- Ribeiro, M.G.; Colasso, C.G.; Monteiro, P.P.; Pedreira Filho, W.R.; Yonamine, M. Occupational safety and health practices among flower greenhouses workers from Alto Tietê region (Brazil). Sci. Total. Environ. 2012, 416, 121–126. [Google Scholar] [CrossRef]

| Characteristics | Frequency | Percentage |
|---|---|---|
| Age (years old) | ||
| <30 | 2 | 6.7 |
| 31–40 | 3 | 10.0 |
| 41–50 | 10 | 33.3 |
| 51–60 | 9 | 30.0 |
| >60 | 6 | 20.0 |
| Min = 23 Max = 78 | ||
| Mean + SD: 50 + 12.7 | ||
| Education | ||
| None | 1 | 3.3 |
| Primary School | 17 | 56.7 |
| Secondary School | 6 | 20.0 |
| High School | 5 | 16.7 |
| Bachelor’s Degree and above | 1 | 3.3 |
| Family income (Baht/Year) | ||
| <50,000 | 5 | 16.7 |
| 50,001–100,000 | 14 | 46.6 |
| 100,000–150,000 | 6 | 20.0 |
| >150,000 | 5 | 16.7 |
| Smoking | ||
| Never | 6 | 20.0 |
| Used to smoke | 7 | 23.3 |
| Currently smoking | 17 | 56.7 |
| Congenital or underlying disease | ||
| Yes | 13 | 43.3 |
| No | 17 | 56.7 |
| Currently on any medication | ||
| Yes | 9 | 30.0 |
| No | 21 | 70.0 |
| Agriculture experiences (Year(s)) | ||
| <10 | 11 | 36.7 |
| 11–20 | 7 | 23.3 |
| 21–30 | 6 | 20.0 |
| >30 | 6 | 20.0 |
| Years using mechanical applications (Year(s)) | ||
| Tractor | ||
| <10 | 12 | 40.0 |
| 11–20 | 8 | 26.7 |
| 21–30 | 6 | 20.0 |
| >30 | 4 | 13.3 |
| Mechanical knapsack sprayer | ||
| <10 | 12 | 40.0 |
| 11–20 | 9 | 30.0 |
| 21–30 | 5 | 16.7 |
| >30 | 4 | 13.3 |
| Characteristics | Frequency | Percentage |
|---|---|---|
| Farm area (rai(s)) | ||
| <10 | 17 | 56.7 |
| 11–20 | 6 | 20.0 |
| 21–30 | 2 | 6.6 |
| >30 | 5 | 16.7 |
| (1 rai = 1600 square meters) | ||
| Duration of working (h/time) | ||
| Land preparation | ||
| <1 | - | - |
| 1–2 | 14 | 46.7 |
| >2 | 16 | 53.3 |
| Pesticide spraying | ||
| <1 | 30 | 100.0 |
| 1–2 | - | - |
| >2 | - | - |
| Harvest | ||
| <1 | - | - |
| 1–2 | 26 | 86.7 |
| >2 | 4 | 13.3 |
| Number of annual mechanical applications (time(s)/Year) | ||
| Tractor | ||
| <10 | 13 | 43.3 |
| 11–20 | 13 | 43.3 |
| 21–30 | 3 | 10.0 |
| >30 | 1 | 3.3 |
| Mechanical backpack sprayer | ||
| <10 | 7 | 23.3 |
| 11–20 | 12 | 40.0 |
| 21–30 | 2 | 6.6 |
| >30 | 9 | 30.0 |
| Handling and work practice | ||
| Follows all product instructions | 27 | 90.0 |
| Checks tools before use | 30 | 100.0 |
| Prepares mechanical applications at home | 26 | 86.7 |
| Stores mechanical applicators at home | 26 | 86.7 |
| Cleans spraying equipment after work | 29 | 96.7 |
| Takes a meal at work place | 12 | 40.0 |
| Smokes while applying pesticides | 6 | 20.0 |
| Considers the safety period | 28 | 93.3 |
| PPE usage | ||
| Gloves | ||
| Rubber | 26 | 86.7 |
| Fabric | 26 | 86.7 |
| Long | 26 | 86.7 |
| Short | 26 | 86.7 |
| Mask | 26 | 86.7 |
| Boots | 24 | 80.0 |
| Hat | 29 | 96.7 |
| Short sleeved shirt | 5 | 16.7 |
| Long sleeved shirt | 29 | 96.7 |
| Short sleeved pants | 2 | 6.6 |
| Long sleeved Pants | 28 | 93.3 |
| Activities | Chemicals | Concentration | OEL |
|---|---|---|---|
| Land preparation (n = 30) | Methlylene Chloride | ≤10% at OEL | PEL = 25 ppm [34] |
| 1, 1, 1 Trichloro Ethane | TWA = 350 ppm a | ||
| Benzene | TWA = 1 ppm [35] | ||
| Ethylbenzene | TWA = 100 ppm a | ||
| o-Xylene | TWA = 100 ppm a | ||
| m-Xylene | TWA = 100 ppm a | ||
| p-Xylene | TWA = 100 ppm a | ||
| Styrene | TWA = 50 ppm a | ||
| 1-Methyl Ethyl Benzene | TWA = 50 ppm [36] | ||
| 1, 3, 5-Trimethyl Benzene | TWA = 25 ppm [37] | ||
| 1, 4-Dichloro Benzene | TWA = 75 ppm a | ||
| Naphthalene | ≤50% at OEL | TWA = 10 ppm [38] | |
| Tert-Butyl Benzene | No occupational exposure limits a | ||
| 1-Methyl Propyle Benzene | |||
| 1, 2, 3 Trichloro Benzene | |||
| Pesticide application (n = 30) | Methlylene Chloride | ≤10% at OEL | PEL = 25 ppm [34] |
| 1, 1, 1 Trichloro Ethane | TWA = 350 ppm a | ||
| Ethylbenzene | TWA = 100 ppm a | ||
| o-Xylene | TWA = 100 ppm a | ||
| m-Xylene | TWA = 100 ppm a | ||
| p-Xylene | TWA = 100 ppm a | ||
| Styrene | TWA = 50 ppm a | ||
| 1-Methyl Ethyl Benzene | TWA = 50 ppm [36] | ||
| 1, 3, 5-Trimethyl Benzene | TWA = 25 ppm [37] | ||
| Naphthalene | ≤50% at OEL | TWA = 10 ppm [38] | |
| Tert-Buty1 Benzene | No occupational exposure limits a | ||
| 1-Methyl Propyle Benzene | |||
| 1, 2, 3 Trichloro Benzene | |||
| Harvesting (n = 30) | 1, 1, 1 Trichloro Ethane | ≤10% at OEL | TWA = 350 ppm a |
| Ethylbenzene | TWA = 100 ppm a | ||
| o-Xylene | TWA = 100 ppm a | ||
| m-Xylene | TWA = 100 ppm a | ||
| p-Xylene | TWA = 100 ppm a | ||
| 1-Methyl Ethyl Benzene | TWA = 50 ppm [36] | ||
| 1, 3, 5-Trimethyl Benzene | TWA = 25 ppm [37] | ||
| Naphthalene | ≤50% at OEL | TWA = 10 ppm [38] | |
| Tert-Butyl Benzene | No occupational exposure limits a | ||
| 1-Methyl Propyle Benzene | |||
| 1, 2, 3 Trichloro Benzene | |||
| SPME Samples | |||
|---|---|---|---|
| Activities | Chemicals | Charcoal Tube Found | Comparison to Charcoal Tube Concentration |
| Pesticide application (n = 3) | 1, 2 Dichloro Ethaene | ND | |
| Methlylene Chloride | Detected | Higher | |
| Trichloro Methane | ND | ||
| Toluene | ND | ||
| Dibromo Chloro Methane | ND | ||
| 1, 2 Dibromo Ethane | ND | ||
| Ethylbenzene | Detected | Higher | |
| o-Xylene | Detected | Lower | |
| m-Xylene | Detected | Lower | |
| p-Xylene | Detected | Higher | |
| Styrene | Detected | Higher | |
| 1-Methyl Ethyl Benzene | Detected | Higher | |
| 1-Chloro-2-Methy-lBenzene | ND | ||
| 1, 3, 5-Trimethyl Benzene | Detected | Higher | |
| 1, 3-Dichloro Benzene | ND | ||
| 1, 4-Dichloro Benzene | Detected | Lower | |
| 1, 3, 5 Trichloro Benzene | ND | ||
| 1, 3 Dichloro Propane | ND | ||
| 1, 2 Dibromo-3-Chloro Propane | ND | ||
| Propyl Benzene | ND | ||
| 1-Chloro-3-Methyl-Benzene | ND | ||
| 1-Ethyl-3-Methyl Benzene | ND | ||
| Tert-Butyl Benzene | Detected | Lower | |
| 1-Methyl Propyle Benzene | Detected | Lower | |
| Butyl Benzene | ND | ||
| Harvesting (n = 1) | Methlylene Chloride | ND | |
| 1, 2 Dichloro Propane | ND | ||
| Toluene | ND | ||
| Ethylbenzene | Detected | Higher | |
| o-Xylene | Detected | Lower | |
| m-Xylene | Detected | Lower | |
| p-Xylene | Detected | Higher | |
| Stylene | Detected | Higher | |
| 1, 3, 5-Trimethyl Benzene | Detected | Higher | |
| 1, 3 Dichloro Propane | ND | ||
| Propyl Benzene | ND | ||
| 1-Chloro1-3-Methyl-Benzene | ND | ||
| Farming Activities | No. of Sample | Percent Measurable | Avg. Respirable Dust Conc. (Range) (mg/m3) |
|---|---|---|---|
| Land preparation | 30 | 73.3% | 0.03 (0.00–0.34) |
| Pesticide application | 30 | 13.3% | 0.00 (0.00–0.09) |
| Harvesting | 30 | 100% | 0.49 (0.04–1.83) |
| Symptoms | Frequency | Percentage |
|---|---|---|
| Skin Symptoms | ||
| Skin rash/itching/burning | 6 | 20.0 |
| Tingling/numbness of hands | 9 | 30.0 |
| muscular twitching and cramps | 8 | 26.7 |
| Respiratory Symptoms | ||
| Chest pain | 4 | 13.3 |
| Cough | 13 | 43.3 |
| Running nose | 13 | 43.3 |
| Difficulties in breathing | 12 | 40.0 |
| Shortness of breath | 7 | 23.3 |
| Irritation of the throat | 12 | 40.0 |
| Central Nervous System Symptoms | ||
| Excessive sweating | 9 | 30.0 |
| Nausea | 15 | 50.0 |
| Vomiting/Dizziness | 6 | 20.0 |
| Excessive salivation | 2 | 6.7 |
| Abdominal pain/Stomachache | 4 | 13.3 |
| Headache | 13 | 43.3 |
| Eye Symptoms | ||
| Lacrimation | 10 | 33.3 |
| Irritation | 13 | 43.3 |
| Blurred Vision | 10 | 33.3 |
| Neuro Muscular Symptoms | ||
| Difficulty in seeing | 6 | 20.0 |
| Restlessness | 9 | 30.0 |
| Difficulty in failing asleep | 6 | 20.0 |
| Trembling of hands | 5 | 16.7 |
| Irritability | 6 | 20.0 |
| Anxiety/anxiousness | 5 | 16.7 |
| Memory Problems | 6 | 20.0 |
Publisher’s Note: MDPI stays neutral with regard to jurisdictional claims in published maps and institutional affiliations. |
© 2021 by the authors. Licensee MDPI, Basel, Switzerland. This article is an open access article distributed under the terms and conditions of the Creative Commons Attribution (CC BY) license (https://creativecommons.org/licenses/by/4.0/).
Share and Cite
Norkaew, S.; Phanprasit, W.; Robson, M.G.; Woskie, S.; Buckley, B.T. Estimating Occupational Exposure to VOCs, SVOCs, Particles and Participant Survey Reported Symptoms in Central Thailand Rice Farmers Using Multiple Sampling Techniques. Int. J. Environ. Res. Public Health 2021, 18, 9288. https://doi.org/10.3390/ijerph18179288
Norkaew S, Phanprasit W, Robson MG, Woskie S, Buckley BT. Estimating Occupational Exposure to VOCs, SVOCs, Particles and Participant Survey Reported Symptoms in Central Thailand Rice Farmers Using Multiple Sampling Techniques. International Journal of Environmental Research and Public Health. 2021; 18(17):9288. https://doi.org/10.3390/ijerph18179288
Chicago/Turabian StyleNorkaew, Saowanee, Wantanee Phanprasit, Mark Gregory Robson, Susan Woskie, and Brian T. Buckley. 2021. "Estimating Occupational Exposure to VOCs, SVOCs, Particles and Participant Survey Reported Symptoms in Central Thailand Rice Farmers Using Multiple Sampling Techniques" International Journal of Environmental Research and Public Health 18, no. 17: 9288. https://doi.org/10.3390/ijerph18179288
APA StyleNorkaew, S., Phanprasit, W., Robson, M. G., Woskie, S., & Buckley, B. T. (2021). Estimating Occupational Exposure to VOCs, SVOCs, Particles and Participant Survey Reported Symptoms in Central Thailand Rice Farmers Using Multiple Sampling Techniques. International Journal of Environmental Research and Public Health, 18(17), 9288. https://doi.org/10.3390/ijerph18179288


