
Earlier Flowering of Betula pendula Roth in Augsburg, Germany, Due to Higher Temperature, NO2 and Urbanity, and Relationship with Betula spp. Pollen Season

 , ,
, , 
Abstract
:1. Introduction
2. Materials and Methods
2.1. Environmental Factors
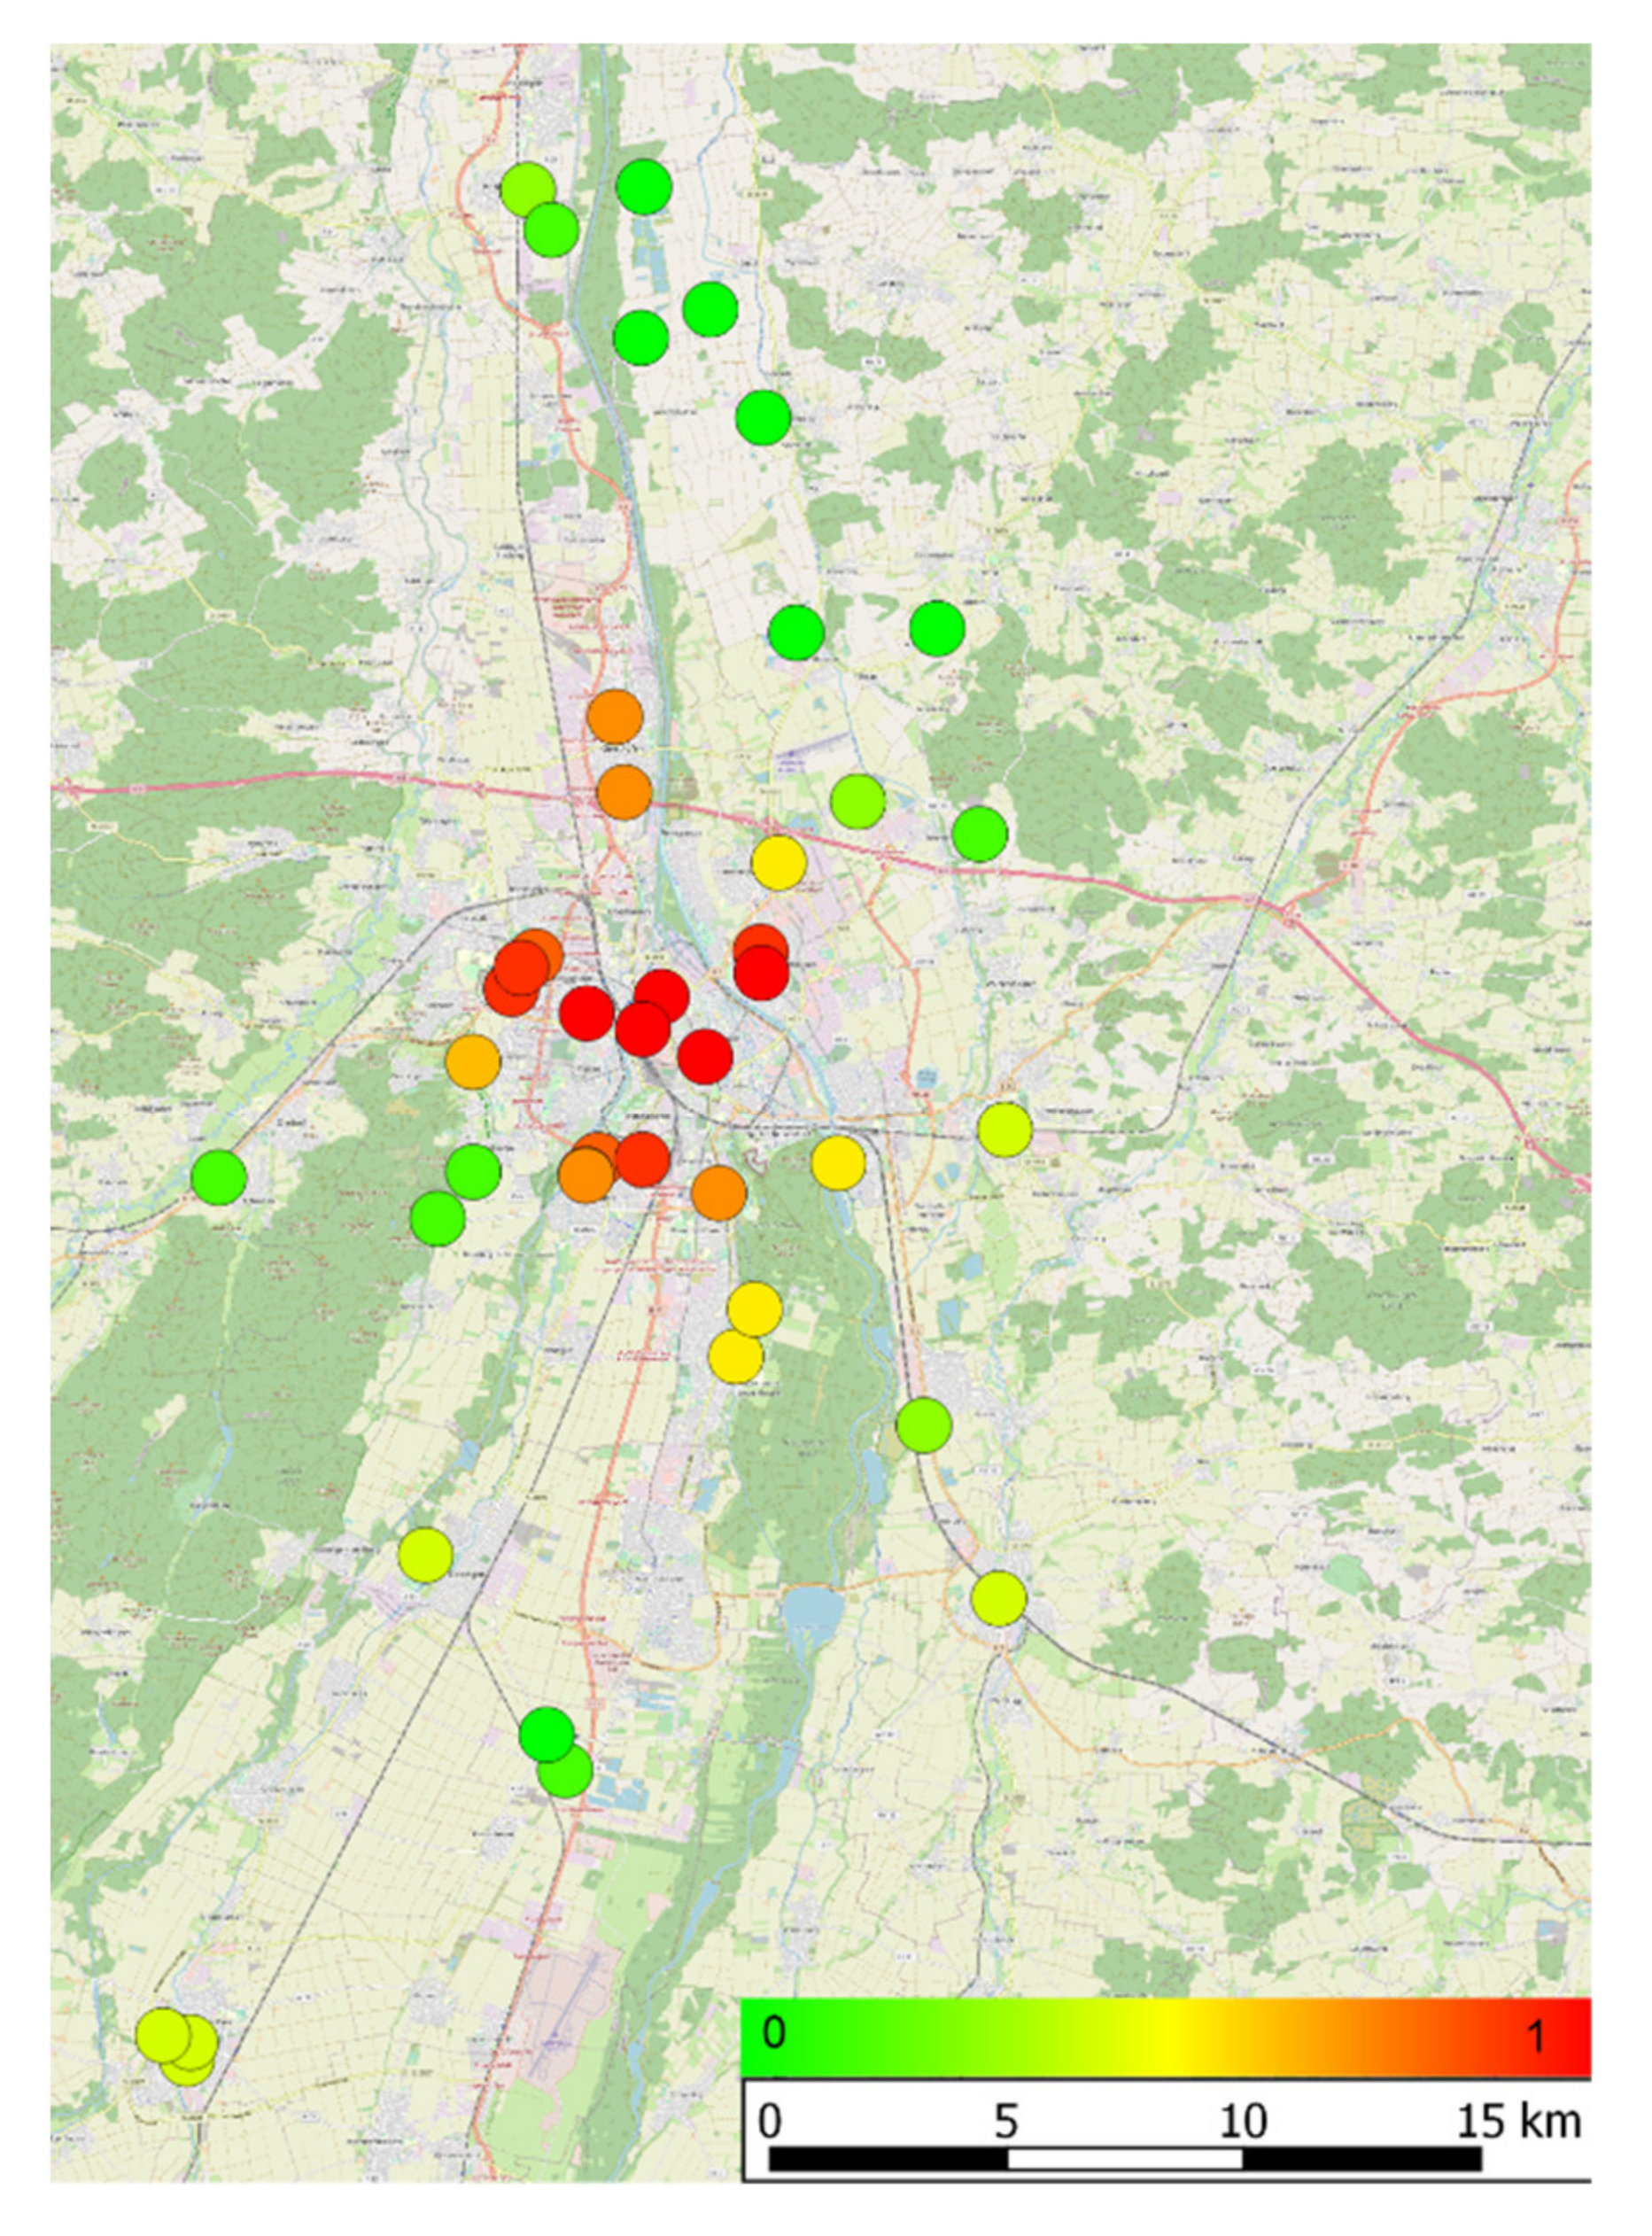
2.1.1. Urbanity Index
2.1.2. Air Quality Measurements
2.1.3. Meteorological Parameters
2.1.4. Pedological and Geological Parameters
2.1.5. Surroundings
2.2. Aerobiological Monitoring in Augsburg
2.3. Phenological Flowering Observations of Betula Pendula
2.4. Data Analysis
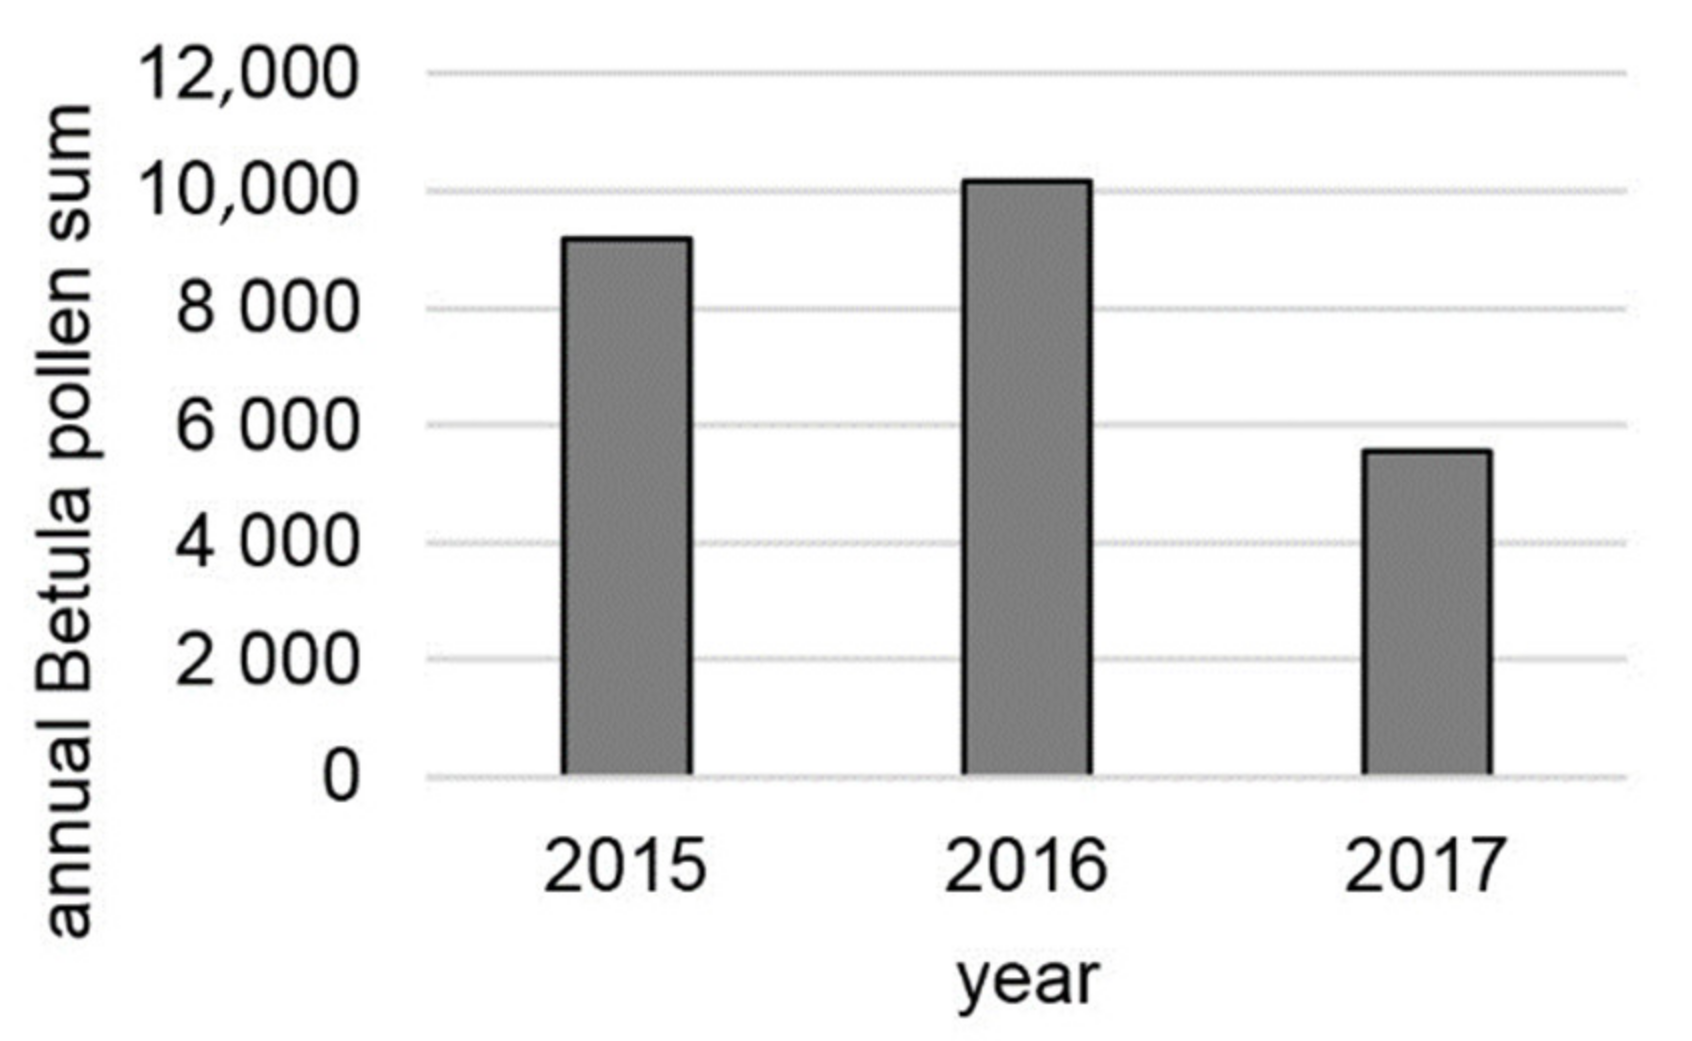
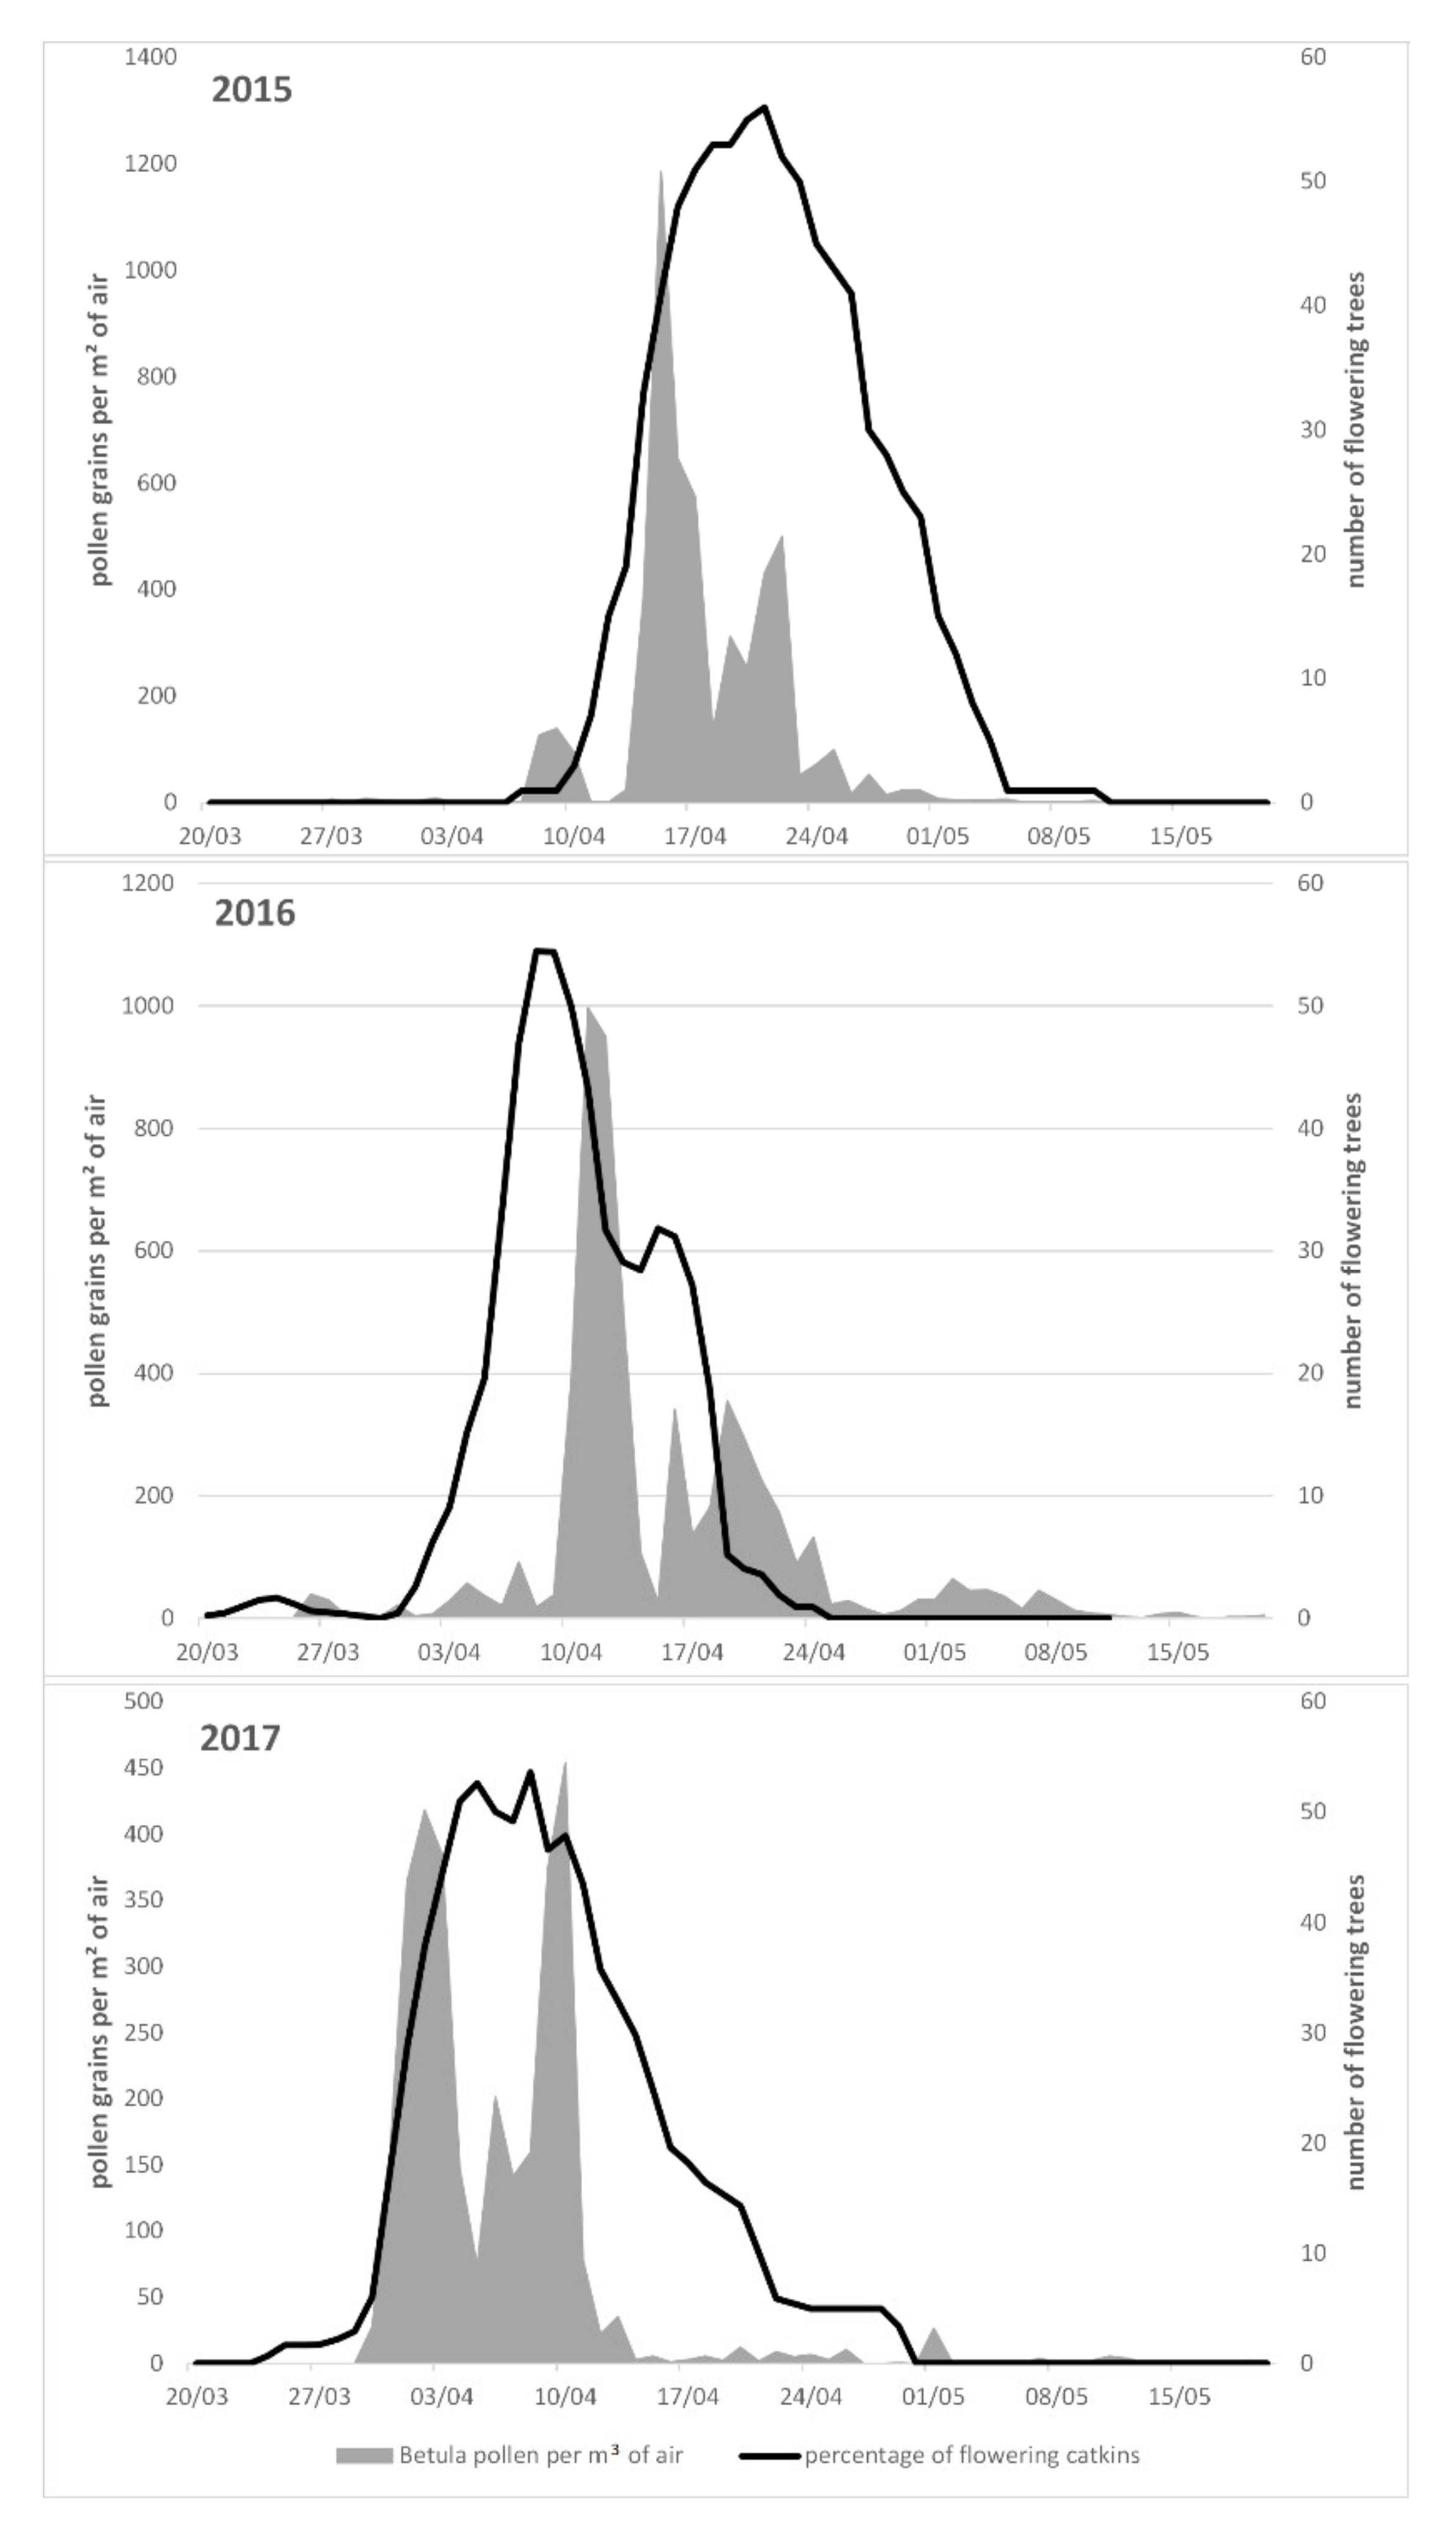
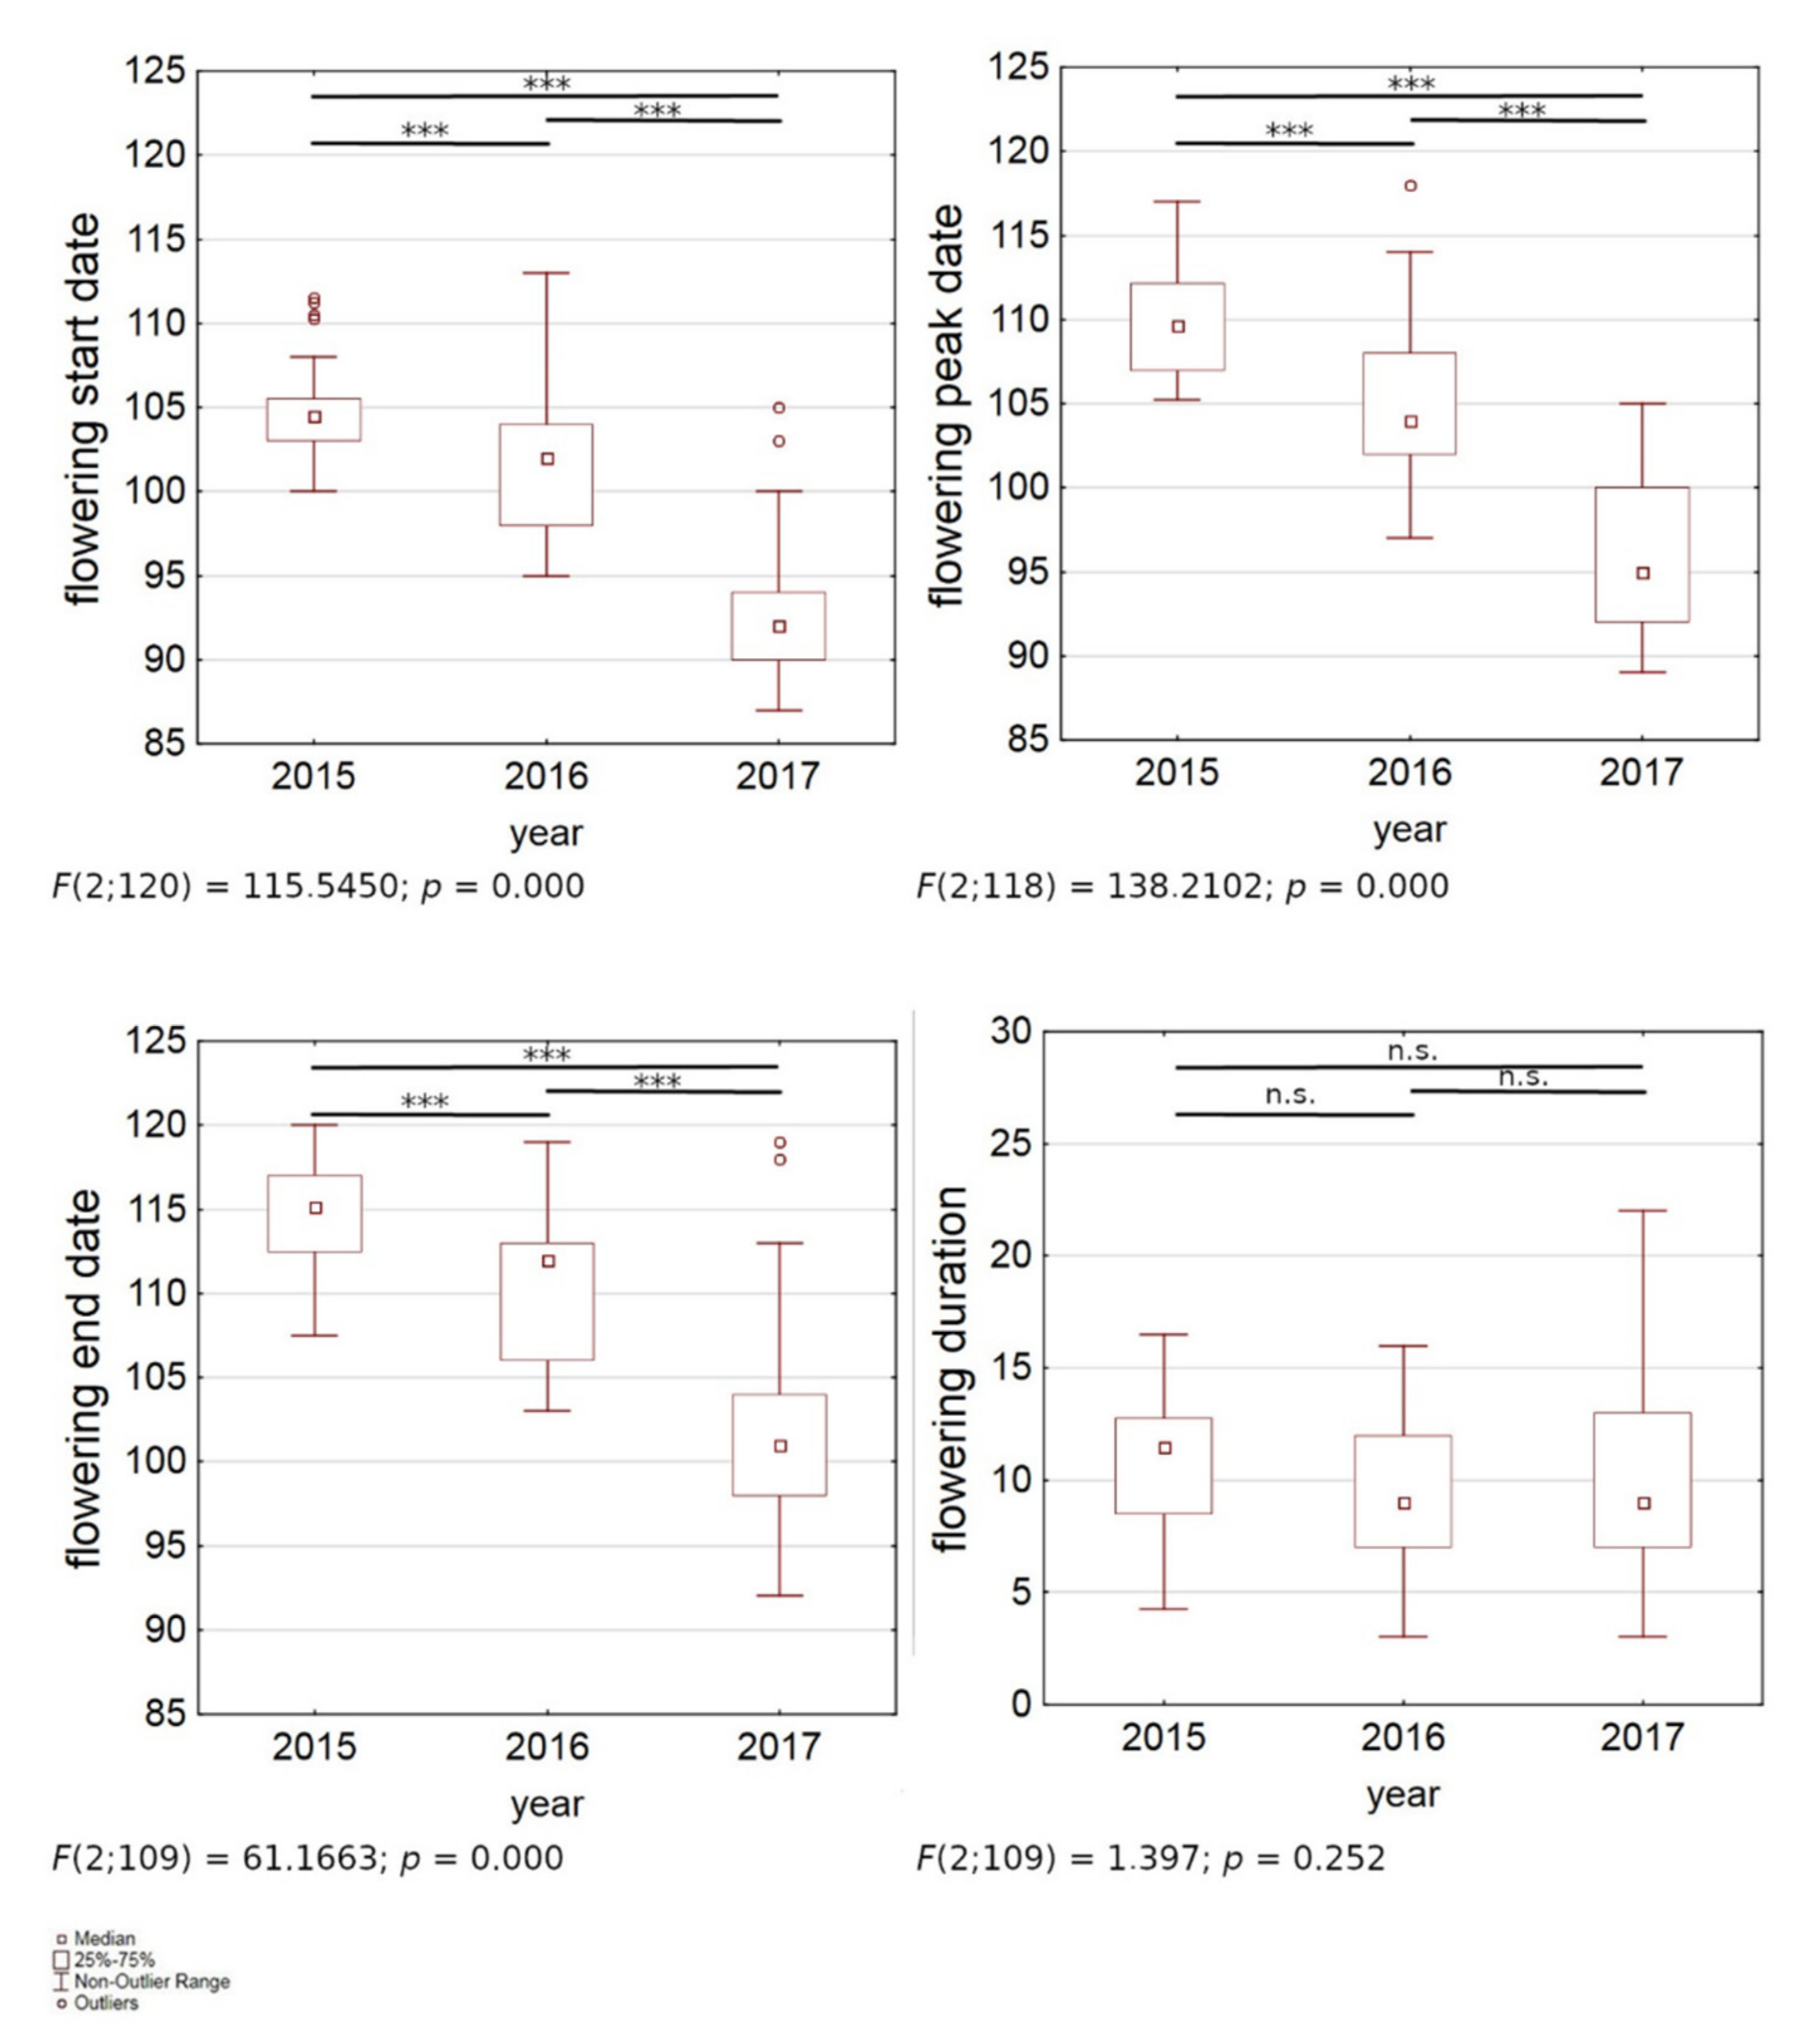
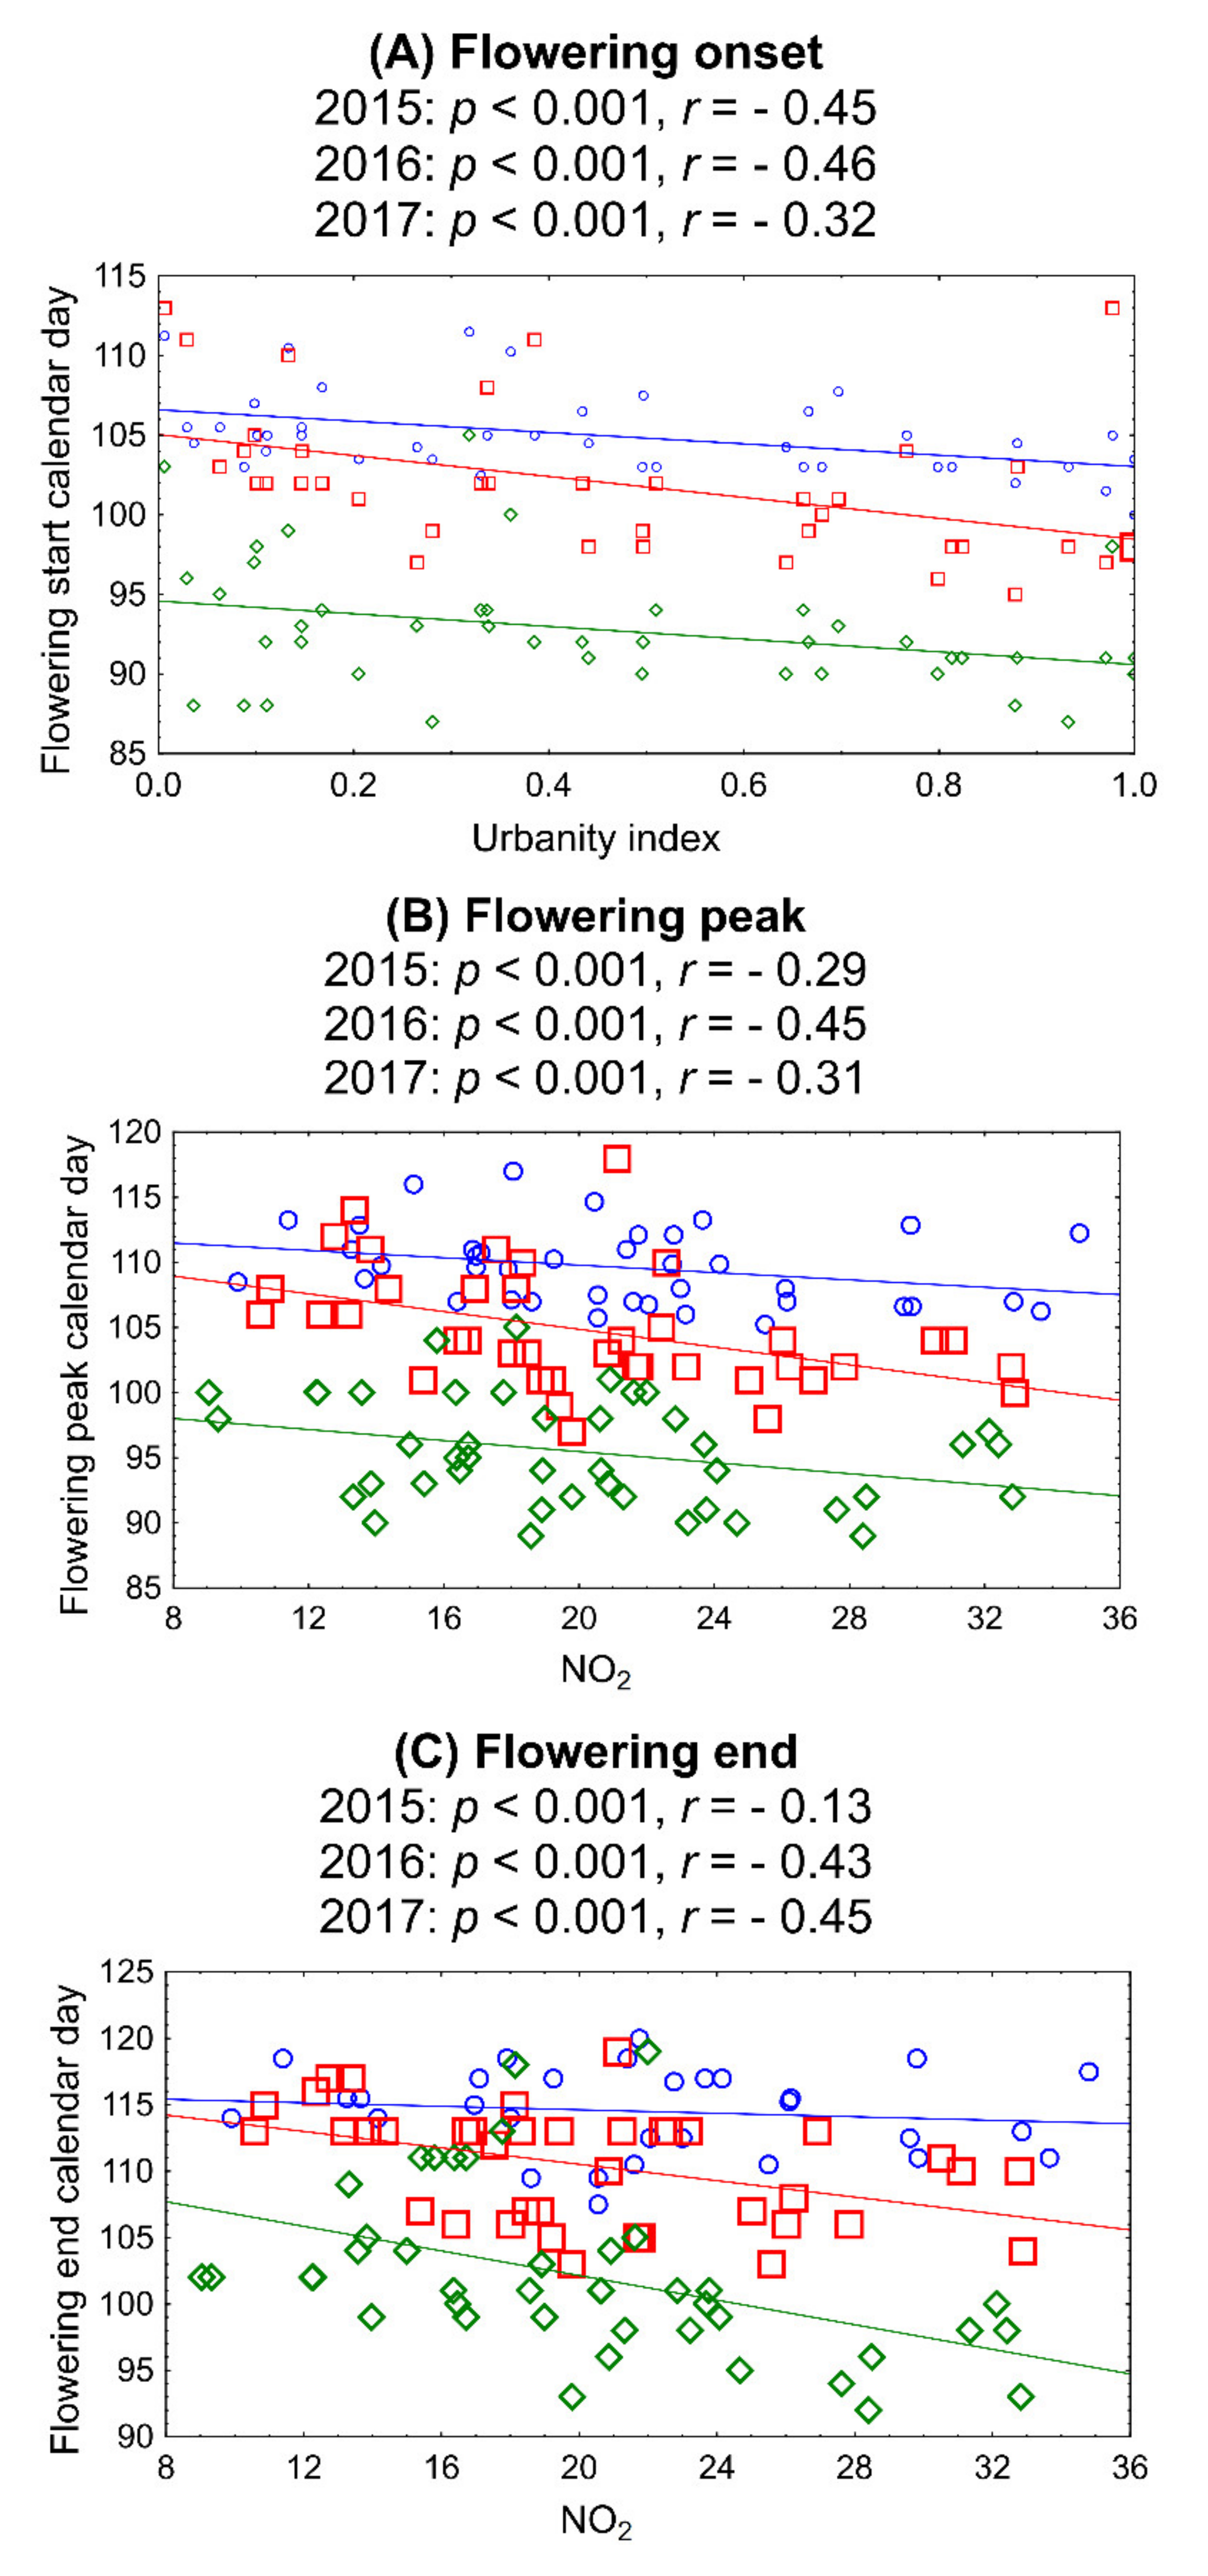
3. Results
4. Discussion
5. Conclusions
Author Contributions
Funding
Institutional Review Board Statement
Informed Consent Statement
Data Availability Statement
Conflicts of Interest
References
- D’Amato, G.; Cecchi, L.; Bonini, S.; Nunes, C.; Annesi-Maesano, I.; Behrendt, H.; Liccardi, G.; Popov, T.; van Cauwenberge, P. Allergenic pollen and pollen allergy in Europe. Allergy 2007, 62, 976–990. [Google Scholar] [CrossRef]
- Pawankar, R.; Canonica, G.W.; Holgate, S.; Lockey, R. WAO White Book on Allergy: Update 2013; World Allergy Organization: Milwaukee, WI, USA, 2013. [Google Scholar]
- Bieber, T.; Akdis, C.; Lauener, R.; Traidl-Hoffmann, C.; Schmid-Grendelmeier, P.; Schäppi, G.; Allam, J.-P.; Apfelbacher, C.; Augustin, M.; Beck, L.; et al. Global Allergy Forum and 3rd Davos Declaration 2015: Atopic dermatitis/Eczema: Challenges and opportunities toward precision medicine. Allergy 2016, 71, 588–592. [Google Scholar] [CrossRef] [PubMed]
- European Academy of Allergy and Clinical Immunology. Advocacy Manifesto: Tackling the Allergy Crisis in Europe—Concerted Policy Action Needed. Available online: https://www.veroval.info/-/media/diagnostics/files/knowledge/eaaci_advocacy_manifesto.pdf (accessed on 22 June 2015).
- Haftenberger, M.; Laußmann, D.; Ellert, U.; Kalcklösch, M.; Langen, U.; Schlaud, M.; Schmitz, R.; Thamm, M. Prävalenz von Sensibilisierungen gegen Inhalations- und Nahrungsmittelallergene: Ergebnisse der Studie zur Gesundheit Erwachsener in Deutschland (DEGS1). Bundesgesundheitsblatt-Gesundheitsforschung-Gesundheitsschutz 2013, 56, 687–697. [Google Scholar] [CrossRef] [PubMed] [Green Version]
- World Health Organisation. 9 Out of 10 People Worldwide Breathe Polluted Air, but More Countries Are Taking Action; World Health Organisation: Geneva, Switzerland, 2018. [Google Scholar]
- Krzyzanowski, M.; Cohen, A. Update of WHO air quality guidelines. Air Qual. Atmos. Health 2008, 1, 7–13. [Google Scholar] [CrossRef] [Green Version]
- Morgenstern, V.; Zutavern, A.; Cyrys, J.; Brockow, I.; Gehring, U.; Koletzko, S.; Bauer, C.P.; Reinhardt, D.; Wichmann, H.-E.; Heinrich, J. Respiratory health and individual estimated exposure to traffic-related air pollutants in a cohort of young children. Occup. Environ. Med. 2007, 64, 8–16. [Google Scholar] [CrossRef] [PubMed] [Green Version]
- Brauer, M.; Hoek, G.; Smit, H.A.; de Jongste, J.C.; Gerritsen, J.; Postma, D.S.; Kerkhof, M.; Brunekreef, B. Air pollution and development of asthma, allergy and infections in a birth cohort. Eur. Respir. J. 2007, 29, 879–888. [Google Scholar] [CrossRef]
- Muzalyova, A.; Brunner, J.O.; Traidl-Hoffmann, C.; Damialis, A. Pollen allergy and health behavior: Patients trivializing their disease. Aerobiologia 2019, 35, 327–341. [Google Scholar] [CrossRef]
- Linneberg, A.; Dam Petersen, K.; Hahn-Pedersen, J.; Hammerby, E.; Serup-Hansen, N.; Boxall, N. Burden of allergic respiratory disease: A systematic review. Clin. Mol. Allergy 2016, 14, 12. [Google Scholar] [CrossRef] [Green Version]
- Behrendt, H.; Becker, W.M.; Fritzsche, C.; Sliwa-Tomczok, W.; Tomczok, J.; Friedrichs, K.H.; Ring, J. Air pollution and allergy: Experimental studies on modulation of allergen release from pollen by air pollutants. Int. Arch. Allergy Immunol. 1997, 113, 69–74. [Google Scholar] [CrossRef]
- Ziello, C.; Sparks, T.H.; Estrella, N.; Belmonte, J.; Bergmann, K.C.; Bucher, E.; Brighetti, M.A.; Damialis, A.; Detandt, M.; Galán, C.; et al. Changes to airborne pollen counts across Europe. PLoS ONE 2012, 7, e34076. [Google Scholar] [CrossRef]
- Lake, I.R.; Jones, N.R.; Agnew, M.; Goodess, C.M.; Giorgi, F.; Hamaoui-Laguel, L.; Semenov, M.A.; Solmon, F.; Storkey, J.; Vautard, R.; et al. Climate Change and Future Pollen Allergy in Europe. Environ. Health Perspect. 2017, 125, 385–391. [Google Scholar] [CrossRef]
- Latałowa, M.; Miętus, M.; Uruska, A. Seasonal variations in the atmospheric Betula pollen in Gdańsk (southern Baltic coast) in relation to meteorological parameters. Aerobiologia 2002, 18, 33–43. [Google Scholar] [CrossRef]
- Stach, A.; Emberlin, J.; Smith, M.; Adams-Groom, B.; Myszkowska, D. Factors that determine the severity of Betula spp. pollen seasons in Poland (Poznań and Krakow) and the United Kingdom (Worcester and London). Int. J. Biometeorol. 2008, 52, 311–321. [Google Scholar] [CrossRef] [PubMed]
- Ziska, L.H.; Gebhard, D.E.; Frenz, D.A.; Faulkner, S.; Singer, B.D.; Straka, J.G. Cities as harbingers of climate change: Common ragweed, urbanization, and public health. J. Allergy Clin. Immunol. 2003, 111, 290–295. [Google Scholar] [CrossRef] [PubMed] [Green Version]
- Menzel, A.; Fabian, P. Growing season extended in Europe. Nature 1999, 397, 659. [Google Scholar] [CrossRef]
- Wielgolaski, F.-E. Starting dates and basic temperatures in phenological observations of plants. Int. J. Biometeorol. 1999, 42, 158–168. [Google Scholar] [CrossRef]
- Hock, R.; Rasul, G.; Adler, C.; Cáceres, B.; Gruber, S.; Hirabayashi, Y.; Jackson, M.; Kääb, A.; Kang, S.; Kutuzov, S.; et al. High Mountain Areas. In IPCC Special Report on the Ocean and Cryosphere in a Changing Climate; Intergovernmental Panel on Climate Change: Geneva, Switzerland, 2019. [Google Scholar]
- Deutscher Wetterdienst. Wetter und Klima vor Ort: Augsburg. Available online: https://www.dwd.de/DE/wetter/wetterundklima_vorort/bayern/augsburg/_node.html (accessed on 12 October 2019).
- Gioulekas, D.; Papakosta, D.; Damialis, A.; Spieksma, F.; Giouleka, P.; Patakas, D. Allergenic pollen records (15 years) and sensitization in patients with respiratory allergy in Thessaloniki, Greece. Allergy 2004, 59, 174–184. [Google Scholar] [CrossRef]
- Galán, C.; García-Mozo, H.; Vázquez, L.; Ruiz, L.; De La Guardia, C.D.; Domínguez-Vilches, E. Modeling Olive Crop Yield in Andalusia, Spain. Agron. J. 2008, 100, 98–104. [Google Scholar] [CrossRef] [Green Version]
- Chuine, I.; Cour, P.; Rousseau, D.D. Selecting models to predict the timing of flowering of temperate trees: Implications for tree phenology modelling. Plant Cell Environ. 1999, 22, 1–13. [Google Scholar] [CrossRef] [Green Version]
- Estrella, N.; Menzel, A.; Krämer, U.; Behrendt, H. Integration of flowering dates in phenology and pollen counts in aerobiology: Analysis of their spatial and temporal coherence in Germany (1992–1999). Int. J. Biometeorol. 2006, 51, 49–59. [Google Scholar] [CrossRef] [PubMed]
- Peñuelas, J.; Rutishauser, T.; Filella, I. Ecology. Phenology feedbacks on climate change. Science 2009, 324, 887–888. [Google Scholar] [CrossRef] [Green Version]
- Piao, S.; Liu, Q.; Chen, A.; Janssens, I.A.; Fu, Y.; Dai, J.; Liu, L.; Lian, X.; Shen, M.; Zhu, X. Plant phenology and global climate change: Current progresses and challenges. Glob. Chang. Biol. 2019, 25, 1922–1940. [Google Scholar] [CrossRef]
- IPCC. Climate Change 2007: Synthesis Report; Contribution of Working Groups I, II and III to the Fourth Assessment Report of the Intergovernmental Panel on Climate Change; IPCC: Geneva, Switzerland, 2007.
- IPCC (Ed.) Climate Change 2014: Synthesis Report; Intergovernmental Panel on Climate Change: Geneva, Switzerland, 2015; ISBN 978-92-9169-143-2.
- Atkinson, M.D. Betula Pendula Roth (B. Verrucosa Ehrh.) and B. Pubescens Ehrh. J. Ecol. 1992, 80, 837. [Google Scholar] [CrossRef]
- Beck, P.; Caudullo, G.; Rigo, D.; Tinner, W. Betula pendula, Betula pubescens and other birches in Europe: Distribution, habitat, usage and threats. In European Atlas of Forest Tree Species; European Commission: Brussels, Belgium, 2016. [Google Scholar] [CrossRef]
- European Environment Agency. Biogeographical Regions in Europe. Available online: https://www.eea.europa.eu/data-and-maps/figures/biogeographical-regions-in-europe-2 (accessed on 12 October 2019).
- Jochner, S.C.; Sparks, T.H.; Estrella, N.; Menzel, A. The influence of altitude and urbanisation on trends and mean dates in phenology (1980-2009). Int. J. Biometeorol. 2012, 56, 387–394. [Google Scholar] [CrossRef] [PubMed]
- European Environment Agency. CORINE Land Cover (CLC) 2006; European Environment Agency: Kopenhagen, Denmark, 2013.
- Emberlin, J.; Mullins, J.; Corden, J.; Millington, W.; Brooke, M.; Savage, M.; Jones, S. The trend to earlier birch pollen seasons in the U.K.: A biotic response to changes in weather conditions? Grana 1997, 36, 29–33. [Google Scholar] [CrossRef]
- Worrall, J. Phenology and the changing seasons. Nature 1999, 399, 101. [Google Scholar] [CrossRef] [Green Version]
- Food and Agriculture Organization of the United Nations. World Reference Base for Soil Resources 2014: International Soil Classification System for Naming Soils and Creating Legends for Soil Maps; FAO: Rome, Italy, 2014; ISBN 978-92-5-108369-7. [Google Scholar]
- Bayerische Vermessungsverwaltung. BayernAtlas: Geobasisdaten; Bayerische Vermessungsverwaltung: München, Germany, 2019. [Google Scholar]
- Kramer, P.J.; Boyer, J.S. Water Relations of Plants and Soils; Academic Press: San Diego, CA, USA, 1983; ISBN 0124250602. [Google Scholar]
- International Organization for Standardization. Geotechnical Investigation and Testing—Identification and Classification of Soil; ISO 14688; International Organization for Standardization (ISO): Geneva, Switzerland, 2017. [Google Scholar]
- Köstler, J.N.; Brückner, E.; Bibelriether, H. Die Wurzeln der Waldbäume: Untersuchungen zur Morphologie der Waldbäume in Mitteleuropa; Paul Parey: Hamburg, Germany, 1968. [Google Scholar]
- Galán, C.; Smith, M.; Thibaudon, M.; Frenguelli, G.; Oteros, J.; Gehrig, R.; Berger, U.; Clot, B.; Brandao, R. Pollen monitoring: Minimum requirements and reproducibility of analysis. Aerobiologia 2014, 30, 385–395. [Google Scholar] [CrossRef]
- Hirst, J.M. An automatic volumetric spore trap. Ann. Appl. Biol. 1952, 39, 257–265. [Google Scholar] [CrossRef]
- Nilsson, S.; Persson, S. Tree pollen spectra in the stockholm region (sweden), 1973–1980. Grana 1981, 20, 179–182. [Google Scholar] [CrossRef]
- Meier, U. (Ed.) Growth Stages of Mono- and Dicotyledonous Plants: BBCH Monograph = Entwicklungsstadien Mono- und Dikotyler Pflanzen; Blackwell-Wiss.-Verl.: Berlin, Germany, 1997; ISBN 3826331524. [Google Scholar]
- Koch, E. (Ed.) Final Scientific Report of COST 725—Establishing a European Dataplatform for Climatological Applications; COST Office: Brussels, Belgium, 2009; ISBN 9789289800488. [Google Scholar]
- Damialis, A.; Charalampopoulos, A.; Lazarina, M.; Diamanti, E.; Almpanidou, V.; Maraidoni, A.M.; Symeonidou, A.; Staikidou, E.; Syropoulou, E.; Leontidou, K.; et al. Plant flowering mirrored in airborne pollen seasons? Evidence from phenological observations in 14 woody taxa. Atmos. Environ. 2020, 240, 117708. [Google Scholar] [CrossRef]
- Latorre, F.; Bianchi, M.M. Relationships between flowering development of Ulmus pumila and Fraxinus excelsior and their airborne pollen. Grana 1998, 32, 233–238. [Google Scholar] [CrossRef]
- Spano, D.; Cesaraccio, C.; Duce, P.; Snyder, R.L. Phenological stages of natural species and their use as climate indicators. Int. J. Biometeorol. 1999, 42, 124–133. [Google Scholar] [CrossRef]
- Sparks, T.H.; Jeffree, E.P.; Jeffree, C.E. An examination of the relationship between flowering times and temperature at the national scale using long-term phenological records from the UK. Int. J. Biometeorol. 2000, 44, 82–87. [Google Scholar] [CrossRef]
- Ghasemifard, H.; Ghada, W.; Estrella, N.; Lüpke, M.; Oteros, J.; Traidl-Hoffmann, C.; Damialis, A.; Buters, J.; Menzel, A. High post-season Alnus pollen loads successfully identified as long-range transport of an alpine species. Atmos. Environ. 2020, 231, 117453. [Google Scholar] [CrossRef]
- Piotrowska, K. Pollen production in selected species of anemophilous plants. Acta Agrobot. 2008, 61, 41–52. [Google Scholar] [CrossRef]
- Organisation for Economic Cooperation and Development. Safety Assessment of Transgenic Organisms, Volume 2: OECD Consensus Documents; OECD: Paris, France, 2006; ISBN 9789264095397. [Google Scholar]
- Kasprzyk, I. Flowering phenology and airborne pollen grains of chosen tree taxa in Rzeszów (SE Poland). Aerobiologia 2003, 19, 113–120. [Google Scholar] [CrossRef]
- Malaspina, T.T.; Cecchi, L.; Morabito, M.; Onorari, M.; Domeneghetti, M.P.; Orlandini, S. Influence of meteorological conditions on male flower phenology of Cupressus sempervirens and correlation with pollen production in Florence. Trees 2007, 21, 507–514. [Google Scholar] [CrossRef]
- Jato, V.; Dopazo, A.; Aira, M.J. Influence of precipitation and temperature on airborne pollen concentration in Santiago de Compostela (Spain). Grana 2002, 41, 232–241. [Google Scholar] [CrossRef]
- Menzel, A. Plant Phenological Anomalies in Germany and their Relation to Air Temperature and NAO. Clim. Chang. 2003, 57, 243–263. [Google Scholar] [CrossRef]
- Straub, A.; Berger, K.; Breitner, S.; Cyrys, J.; Geruschkat, U.; Jacobeit, J.; Kühlbach, B.; Kusch, T.; Philipp, A.; Schneider, A.; et al. Statistical modelling of spatial patterns of the urban heat island intensity in the urban environment of Augsburg, Germany. Urban Clim. 2019, 29, 100491. [Google Scholar] [CrossRef]
- Eller, A.S.D.; Soper, F.M.; Sparks, J.P. The influence of elevated CO2 on phenology of Arabidopsis thaliana (Brassicaceae) is altered by common air pollutants (NO2 and O3) and soil nitrogen. J. Torrey Bot. Soc. 2020, 147, 156. [Google Scholar] [CrossRef]
- Jochner, S.; Markevych, I.; Beck, I.; Traidl-Hoffmann, C.; Heinrich, J.; Menzel, A. The effects of short- and long-term air pollutants on plant phenology and leaf characteristics. Environ. Pollut. 2015, 206, 382–389. [Google Scholar] [CrossRef] [PubMed]
- Schleip, C.; Sparks, T.H.; Estrella, N.; Menzel, A. Spatial variation in onset dates and trends in phenology across Europe. Clim. Res. 2009, 39, 249–260. [Google Scholar] [CrossRef]
- Jochner, S.; Höfler, J.; Beck, I.; Göttlein, A.; Ankerst, D.P.; Traidl-Hoffmann, C.; Menzel, A. Nutrient status: A missing factor in phenological and pollen research? J. Exp. Bot. 2013, 64, 2081–2092. [Google Scholar] [CrossRef] [PubMed] [Green Version]
- Ziello, C.; Böck, A.; Estrella, N.; Ankerst, D.; Menzel, A. First flowering of wind-pollinated species with the greatest phenological advances in Europe. Ecography 2012, 35, 1017–1023. [Google Scholar] [CrossRef]
- Geng, X.; Fu, Y.H.; Hao, F.; Zhou, X.; Zhang, X.; Yin, G.; Vitasse, Y.; Piao, S.; Niu, K.; De Boeck, H.J.; et al. Climate warming increases spring phenological differences among temperate trees. Glob. Chang. Biol. 2020, 26, 5979–5987. [Google Scholar] [CrossRef]
- Menzel, A.; Yuan, Y.; Matiu, M.; Sparks, T.; Scheifinger, H.; Gehrig, R.; Estrella, N. Climate change fingerprints in recent European plant phenology. Glob. Chang. Biol. 2020, 26, 2599–2612. [Google Scholar] [CrossRef] [Green Version]


| Parameter | Categorisation |
|---|---|
| open water bodies (e.g., lake, river) | no/yes |
| non-biological sealing | no/gravel/concrete/wall/mixed |
| street | no/yes |
| sealed areas | no/low (<50%)/high (>50%) |
| diversity of plants in the herbaceous layer | no/low diversity (agricultural fields)/medium div. (meadow, garden)/high div. (multiple environments) |
| diversity of trees and shrubs | no/Betula/mixed incl. Betula/mixed, other/shrubs |
| shading of the tree | no/low/medium/high |
| positions of buildings | cardinal directions from the tree |
| Year | Flowering Trait | |||
|---|---|---|---|---|
| Start | Peak | End | Duration | |
| 2015 | 0.95 (104 ± 2) | 0.50 (109 ± 2) | 0.17 (115 ± 3) | ns |
| 2016 | 0.99 (102 ± 4) | 0.70 (105 ± 5) | 0.51 (110 ± 4) | 0.23 (10 ± 3) |
| 2017 | 0.96 (93 ± 4) | 0.72 (95 ± 4) | 0.54 (102 ± 6) | ns |
| Average | 0.97 (99 ± 6) | 0.85 (102 ± 7) | 0.71 (108 ± 7) | ns |
Publisher’s Note: MDPI stays neutral with regard to jurisdictional claims in published maps and institutional affiliations. |
© 2021 by the authors. Licensee MDPI, Basel, Switzerland. This article is an open access article distributed under the terms and conditions of the Creative Commons Attribution (CC BY) license (https://creativecommons.org/licenses/by/4.0/).
Share and Cite
Kolek, F.; Plaza, M.D.P.; Leier-Wirtz, V.; Friedmann, A.; Traidl-Hoffmann, C.; Damialis, A. Earlier Flowering of Betula pendula Roth in Augsburg, Germany, Due to Higher Temperature, NO2 and Urbanity, and Relationship with Betula spp. Pollen Season. Int. J. Environ. Res. Public Health 2021, 18, 10325. https://doi.org/10.3390/ijerph181910325
Kolek F, Plaza MDP, Leier-Wirtz V, Friedmann A, Traidl-Hoffmann C, Damialis A. Earlier Flowering of Betula pendula Roth in Augsburg, Germany, Due to Higher Temperature, NO2 and Urbanity, and Relationship with Betula spp. Pollen Season. International Journal of Environmental Research and Public Health. 2021; 18(19):10325. https://doi.org/10.3390/ijerph181910325
Chicago/Turabian StyleKolek, Franziska, Maria Del Pilar Plaza, Vivien Leier-Wirtz, Arne Friedmann, Claudia Traidl-Hoffmann, and Athanasios Damialis. 2021. "Earlier Flowering of Betula pendula Roth in Augsburg, Germany, Due to Higher Temperature, NO2 and Urbanity, and Relationship with Betula spp. Pollen Season" International Journal of Environmental Research and Public Health 18, no. 19: 10325. https://doi.org/10.3390/ijerph181910325