Analysis of Tradable Water Volumes of Industry in Water-Rich Areas of China: A Case Study of Changsha City


Abstract
:1. Introduction
2. The Theories of the TWV and ITWV
2.1. Analysis of the TWV Based on Property Rights Theory
2.2. Preliminary Judgment of Water-Rights Trading Subjects Based on ITWV and ITCV
3. Methods
3.1. Calculation of the ITWC
3.2. Regional Initial Water-Rights Volumes and Industrial Initial Water-Rights Volumes under Different Runoff Frequencies
3.3. Forecast of Industrial Water Demand
4. Study Area and Data
4.1. Study Area
4.2. Data Sources
5. Results and Discussions
5.1. Regional Initial Water-Rights Volumes under Different Runoff Frequencies in 2030
5.2. The ITWC of Agriculture under Different Runoff Frequencies in Changsha City in 2030
5.2.1. Agricultural Initial Water-Rights Volumes under Different Runoff Frequencies in Changsha City in 2030
5.2.2. Forecast of Agricultural Water Demand in Changsha City in 2030
5.2.3. Calculation of Agricultural ITWV under Different Runoff Frequencies in Changsha City in 2030
5.2.4. Analysis of Agricultural ITWV under Different Runoff Frequencies in Changsha City in 2030
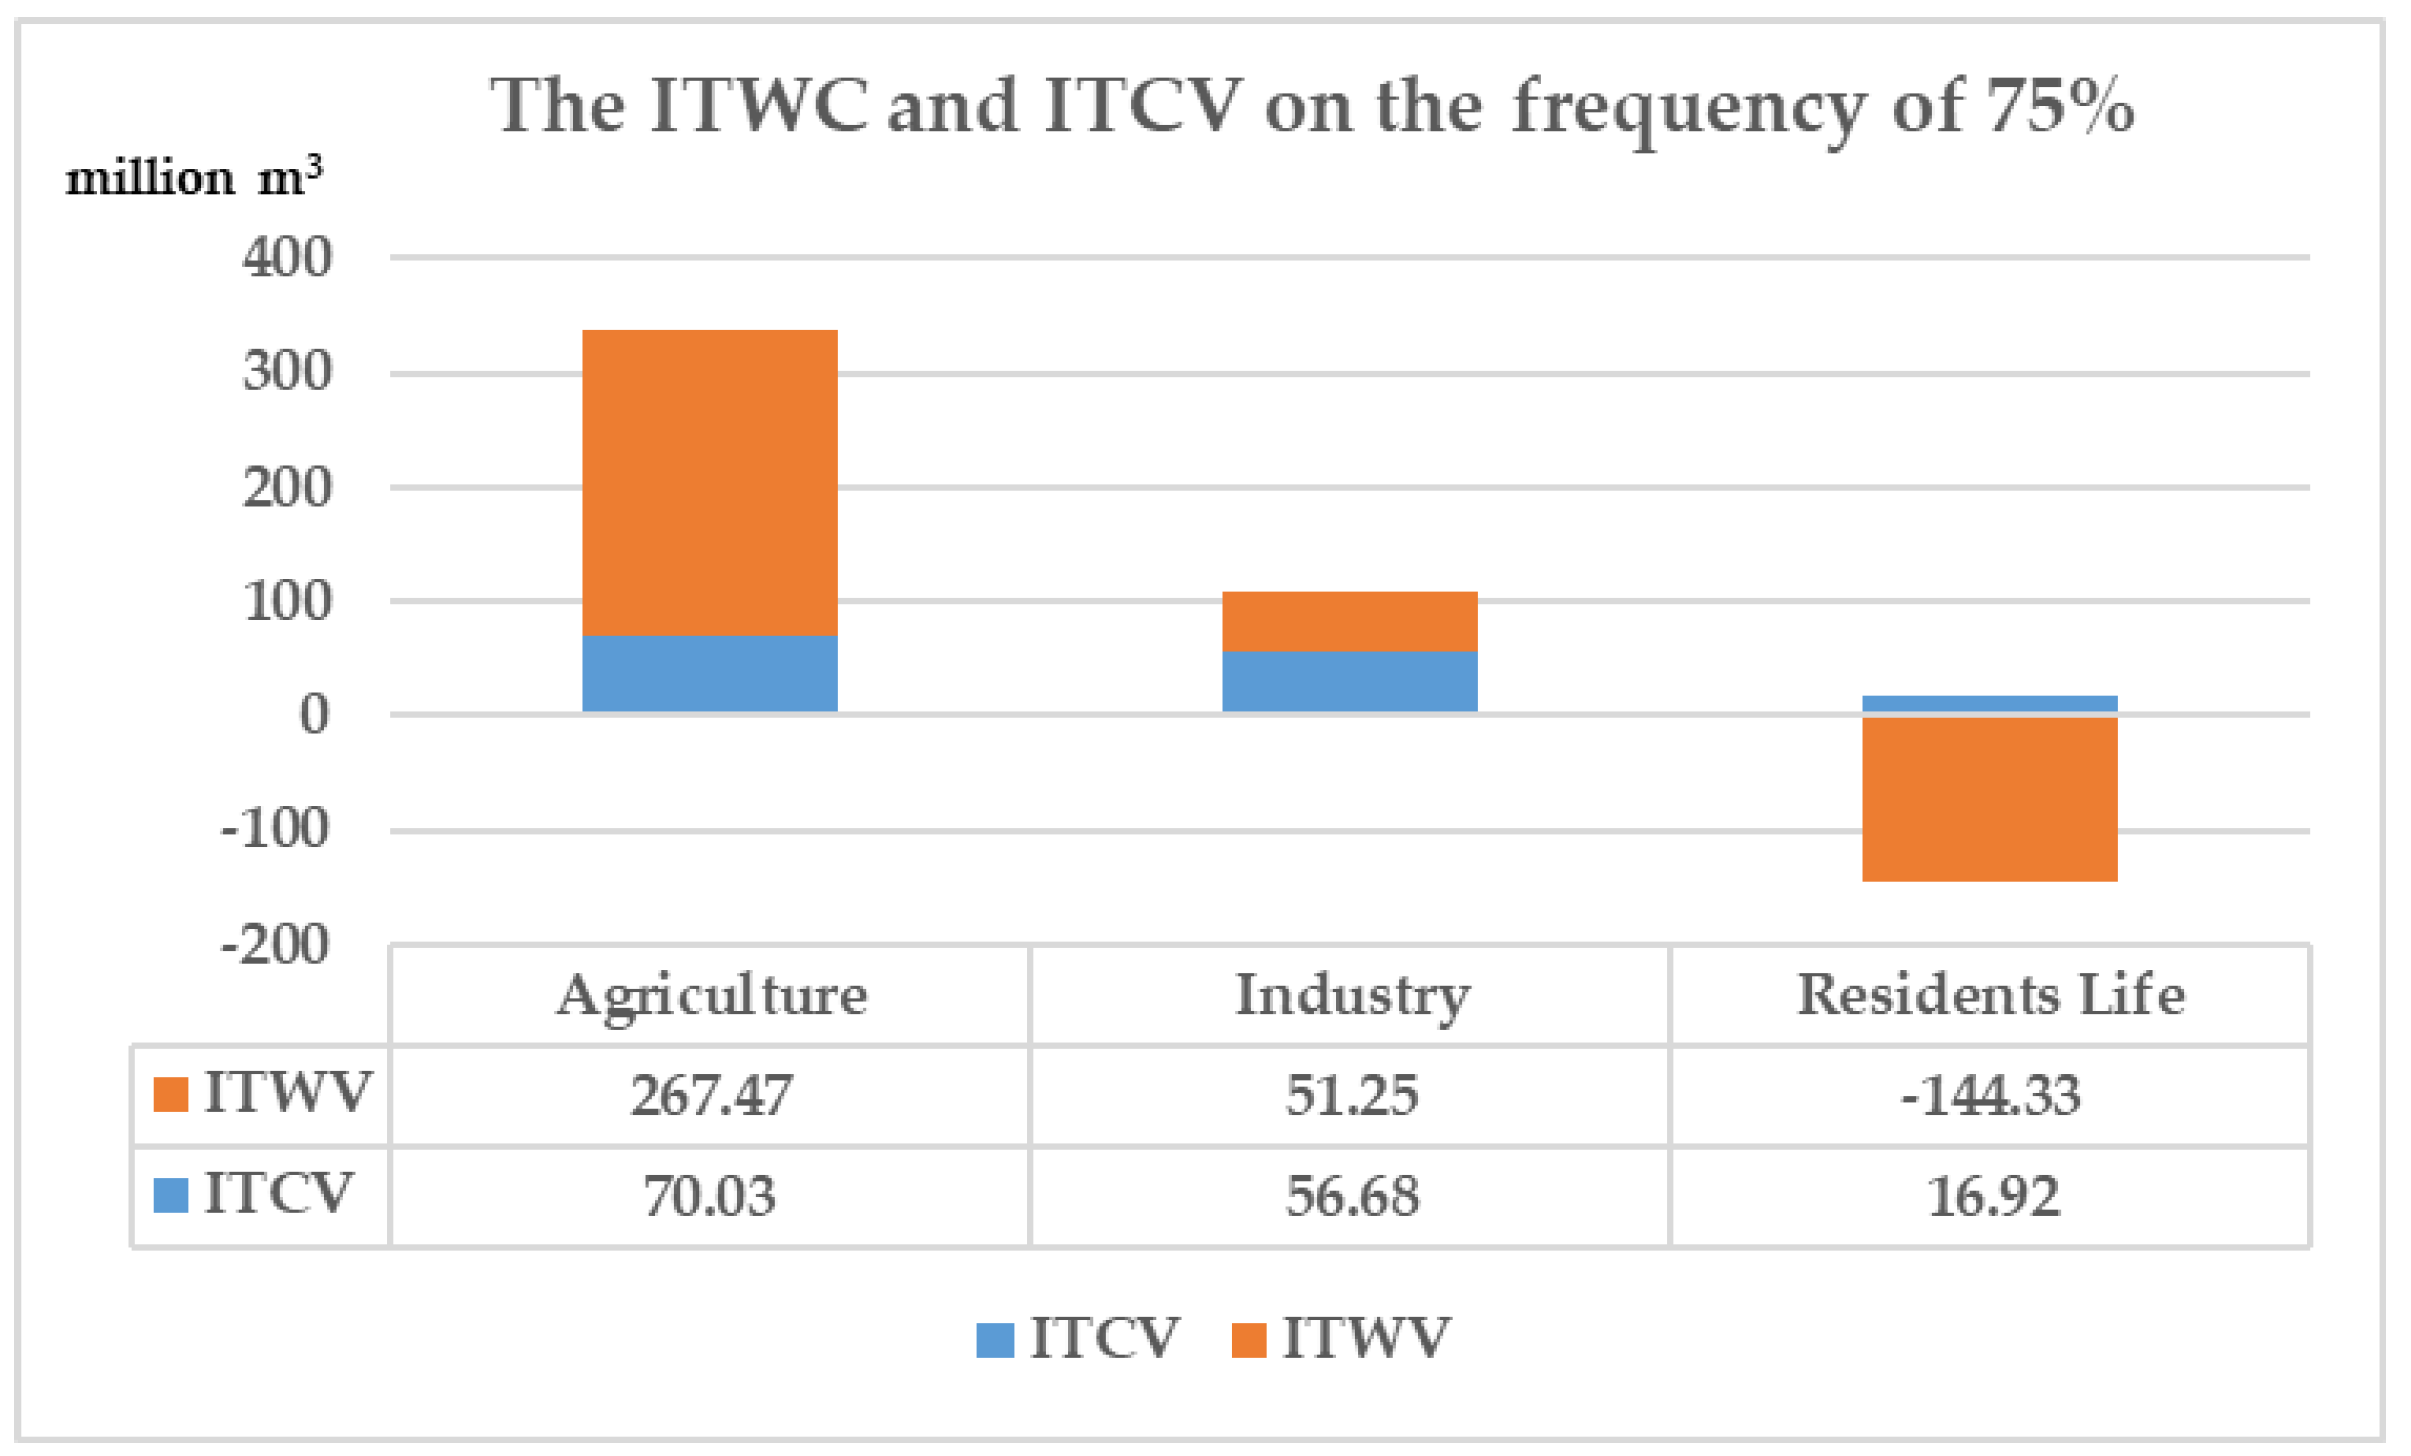
- In 2030, under the frequency of 50% and 75%, the ITWV of agriculture in Changsha city is 611.48 million m3 and 267.47 million m3 respectively, which are greater than the agricultural ITCV of 87.23 million m3 and 70.03 million m3. It shows that the agricultural initial water-rights volumes can meet water demand, but also have more residual water. It could be as the transferor of water-rights transaction to participate in the water-rights transaction and transform the resource benefits into economic benefits.
- In 2030, under the frequency of 90%, the ITWV of agriculture in Changsha city is −38.22 million m3, which indicates that the initial agricultural water rights can no longer meet its water demand, and agricultural production may be affected, which is not conducive to ensuring regional food production and social stability. However, due to the absolute value of agricultural ITWV is less than the ITCV of 54.75 million m3, it shows that the water-saving potential of agriculture can make up for this part of water shortage. Agricultural departments could take measures to adjust agricultural planting structure, improve the effective use coefficient of farmland irrigation water, and reduce the irrigation quota to improve the water-saving potential and meet the agricultural water demand.
5.3. The ITWC of Industry under Different Runoff Frequencies in Changsha City in 2030
5.3.1. Industrial Initial Water-Rights Volumes under Different Runoff Frequencies in Changsha City in 2030
5.3.2. Forecast of Industrial Water Demand in Changsha City in 2030
5.3.3. Calculation of Industrial ITWV under Different Runoff Frequencies in Changsha City in 2030
5.3.4. Analysis of Industrial ITWV under Different Runoff Frequencies in Changsha City in 2030
- In 2030, under the frequency of 50%, industrial ITWV of Changsha city is 329.69 million m3, which is greater than industrial ITCV of 70.6 million m3. It shows that industrial initial water-rights volumes can meet its water demand, and there is a relatively surplus water, which can be adjusted to other industries or regions as the transferor of water-rights transaction.
- In 2030, under frequency of 75%, industrial ITWV of Changsha city is 51.25 million m3, but less than industrial ITCV of 56.68 million m3. This indicates that although the initial industrial water-rights volumes can meet its water demand, the residual water is not enough to sell to the transferee. Therefore, this part of the water can be reserved and used to support industrial development or to deal with pollution and other unconventional use of water.
- In 2030, under frequency of 90%, industrial ITWV of Changsha city is −196.18 million m3, and its absolute value is greater than the ITCV of 44.31 million m3, which represents that industrial initial water-rights quantities cannot meet its water demand, and industrial water shortage easily leads to the decline of output value. Therefore, industry can be considered to be the transferee to solve the problem of water shortage through water-rights transaction.
5.4. The ITWC of Resident Life under Different Runoff Frequencies in Changsha City in 2030
5.4.1. Domestic Initial Water-Rights Volumes under Different Runoff Frequencies in Changsha City in 2030
5.4.2. Forecast of Domestic Water Demand in Changsha City in 2030
5.4.3. Calculation of Domestic ITWV under Different Runoff Frequencies in Changsha City in 2030
5.4.4. Analysis of Domestic ITWV under Different Runoff Frequencies in Changsha City in 2030
5.5. Analysis of Water-Resource Management in Changsha City in 2030 under Different Runoff Frequencies
5.6. Comparison with Other Analyses about the ITWV
6. Conclusions
- In 2030, under the frequency of 50% and 75%, the ITWV of agricultural in Changsha city is 611.48 million m3 and 267.47 million m3, which is larger than the ITCV of agriculture, so agriculture can be considered to be the transferor of water-rights transaction; under the frequency of 90%, the ITWV of agriculture in Changsha city is −38.23 million m3, and its absolute value is within the range of agricultural ITCV, which indicates that agriculture can take various measures to improve water-saving potential to meet water demand.
- In 2030, under the frequency of 50%, industrial ITWV of Changsha city is 329.69 million m3, which is larger than industrial ITCV, so industry can be considered to be the transferor of water-rights transaction; under the frequency of 75%, industrial ITWV of Changsha city is 51.25 million m3, less than the ITCV, which can be considered the water for self-use; under frequency of 90%, industrial ITWV of Changsha city is −196.18 million m3, and its absolute value is beyond the range of the ITCV, which indicates that industry can consider as the transferee of water-rights transaction to participate in transaction to meet water demand.
- In 2030, under the frequency of 50%, 75% and 90%, the domestic ITWV in Changsha city is −61.24 million m3, −144.33 million m3 and −218.17 million m3 respectively, and the absolute values of the ITWV are all greater than the ITCV. Therefore, the domestic initial water rights cannot meet the demand of domestic water. Therefore, the problem of insufficient domestic water can be solved through water-rights trading.
- Water-resource management in Changsha city should combine water conservation with water-rights trading, take the construction of a conservation-oriented society as one of the objectives of urban development, and use scientific measures to widely promote water conservation. At the same time, the government should make water-rights trading an important way to effectively solve the shortage of water resources, actively participate in the reform of water-rights markets, flexibly use market mechanisms to deal with water shortage, and ensure regional development.
Author Contributions
Funding
Institutional Review Board Statement
Informed Consent Statement
Conflicts of Interest
Abbreviations
| TWC | Tradable water volumes |
| ITWC | Tradable water volumes of industry |
| ITCV | Tradable control volumes of industry |
| GM (1,1) | Grey model (1,1) |
References
- World Water Development Report. 2020. Available online: https://www.unwater.org/publications/world-water-development-report-2020/ (accessed on 7 January 2021).
- Breviglieri, G.V.; Do Sol Osório, G.I.; Puppim De Oliveira, J.A. Understanding the emergence of water market institutions: Learning from functioning water markets in three countries. Water Policy 2018, 20, 1075–1091. [Google Scholar] [CrossRef]
- Howitt, R.E. Empirical analysis of water market institutions: The 1991 California water market. Resour. Energy Econ. 1994, 16, 357–371. [Google Scholar] [CrossRef]
- Settre, C.; Wheeler, S.A. Environmental water governance in the Murray-Darling Basin of Australia: The movement from regulation and engineering to economic-based instruments. Handb. Environ. Sustain. Financ. 2016, 67–91. [Google Scholar] [CrossRef]
- Bauer, C.J. Bringing water markets down to earth: The political economy of water rights in Chile, 1976–1995. World Dev. 1997, 25, 639–656. [Google Scholar] [CrossRef]
- Easter, K.W.; Rosegrant, M.W.; Dinar, A. Markets for Water: Potential and Performance; Springer Science & Business Media: Berlin, Germany, 1998; pp. 35–76. [Google Scholar]
- Bjornlund, H. Formal and informal water markets: Drivers of sustainable rural communities. Water Resour. Res. 2004, 40, 187. [Google Scholar] [CrossRef] [Green Version]
- Grafton, Q.; Landry, C.; Libecap, G.D.; McGlennon, S.; O’Brien, R.J. An Integrated Assessment of Water Markets: Australia, Chile, China, South Africa and the USA; National Bureau of Economic Research: Cambridge, MA, USA, 2010. [Google Scholar]
- Lewis, D.; Zheng, H. How could water markets like Australia’s work in China? Int. J. Water Resour. Dev. 2019, 4, 638–658. [Google Scholar] [CrossRef]
- Hu, A.G.; Wang, Y.H. Discussion on reform of water allocation system from the water right trade between Dongyang City and Yiwu City. China Water Resour. 2001, 6, 35–37. [Google Scholar]
- Shen, M.H. Water rights transaction and government innovation-a case study of water rights transaction in Dongyang and Yiwu. Manag. World 2005, 6, 45–56. [Google Scholar]
- Liu, G.; Wang, H.M.; Xu, L.Z. Construction practice of water rights transaction in the Yellow River basin of Inner Mongolia. China Water Resour. 2018, 853, 47–50. [Google Scholar]
- Wei, F.N. Gansu: Exploring the reform of water rights in Shule River Basin. China Water Resour. 2018, 19, 58–60. [Google Scholar]
- Hong, C.H.; Huang, B.S.; Qiu, J.; Lei, H.C.; Huang, F.H.; Lu, Y.T. Water rights transaction practice in Dongjiang River Basin-take interregional water rights trading as an example between Huizhou and Guangzhou. Guangdong Water Resour. Hydropower 2018, 274, 14–17. [Google Scholar]
- Tian, G.L. Comparison of the experiences of water rights reform in pilot provinces and its countermeasures. Environ. Prot. 2018, 639, 29–36. [Google Scholar]
- Zhang, J.L. Study on the Potential Evaluation and Trading Model of Trans-Regional Water Rights in Henan Province. Master’s Thesis, Zhengzhou University, Zhengzhou, China, 2019. [Google Scholar]
- Zhao, Q.; Liu, X.X.; Jiang, Y.X. Building ecological water conservancy and promoting green development-experience and enlightenment from Shenwu irrigation area of the yellow river in Inner Mongolia Autonomous Region. J. Water Resour. Econ. 2019, 37, 20–22, 31, 76. [Google Scholar]
- Liu, Y.J.; Shi, Y.B.; Zhang, B. Study on current status and advancing measures of water right trading in China. China Water Resour. 2016, 21, 1–2, 5. [Google Scholar]
- Development Research Centre of the State Council—World Bank Research Group on “Water Governance in China”. Progress of water rights reform in China and countermeasures and suggestions. Dev. Res. 2018, 382, 6–10. [Google Scholar]
- Zhang, J.B.; Zhu, X.M. Research on the trading potential of water rights along the Yellow River in Inner Mongolia. Water Resour. Dev. Res. 2019, 19, 20–44. [Google Scholar]
- Urquiza, A.; Billi, M. Water markets and social–ecological resilience to water stress in the context of climate change: An analysis of the Limarí Basin, Chile. Environ. Dev. Sustain. Multidiscip. Approach Theory Pract. Sustain. Dev. 2020, 3, 1929–1951. [Google Scholar] [CrossRef]
- Chen, X.N.; Wu, F.P.; Li, F.; Zhao, Y. Analysis of tradable water quantity in Hetao Irrigation District of Inner Mongolia under the high-quality development mode. China Popul. Resour. Environ. (accepted).
- Zhou, Y.; Li, H.R. Construction of water rights trading system in southern water-rich region: Case of Jiangxi Province. Yangtze River 2017, 48, 37–40. [Google Scholar]
- Tian, G.L. The practical dilemma and countermeasures of water right system reform in water-rich area of South China. Water Resour. Dev. Res. 2017, 17, 8–12. [Google Scholar]
- Wu, F.P.; Yu, Q.W.; Shen, J.Y.; Zhang, L.N. Theoretical framework of market-oriented pricing mechanism for water rights transaction. China Popul. Resour. Environ. 2018, 28, 17–25. [Google Scholar]
- Marino, M.; Kemper, K.E. Institutional frameworks in successful water markets. Brazil, Spain, and Colorado. Papers 1999, 76, 65–66. [Google Scholar]
- Chen, H. World water rights system and water exchange market. Tribune Soc. Sci. 2012, 1, 134–161. [Google Scholar]
- Matthews, O.P.; Scuderi, L.; Brookshire, D.S.; Gregory, K.; Campana, M. Marketing western water: Can a process based geo-graphic information system improve reallocation decisions? Nat. Resour. J. 2001, 1, 329–342. [Google Scholar]
- Berbel, J.; Esteban, E. Droughts as a catalyst for water policy change. Analysis of Spain, Australia (MDB), and California. Glob. Environ. Chang. 2019, 58, 101969. [Google Scholar] [CrossRef]
- Dellapenne, J.W. The law of water allocation in the southeastern states at the opening of the twenty-first century. Univ. Ark. Little Rock Law Rev. 2002, 3, 9–37. [Google Scholar]
- Zhang, Y.X.; Xun, Y.P. Concept of urban water rights trading mechanism in northwest arid region. Water Resour. Protect. 2008, 1, 76–80. [Google Scholar]
- Dou, M.; Wang, Y.Y.; Li, P. An analysis of the theoretical framework of water rights under the strictest water resources management system. China Popul. Resour. Environ. 2014, 24, 132–137. [Google Scholar]
- Li, P.; Dou, M.; Zhao, P.P. Water rights transactions mechanism adapting the demand of the Strictest Water Resources Management. Yellow River 2014, 8, 52–56. [Google Scholar]
- Tan, L. Research on the Calculation Model of Dual Water Rights Transaction Price Driven by Agricultural Water-Saving in Irrigated Areas. Master’s Thesis, Zhengzhou University, Zhengzhou, China, 2019; pp. 17–20. [Google Scholar]
- Lu, X.X. New Institutional Economics in the West; China Development Press: Beijing, China, 1996; pp. 101–135. [Google Scholar]
- Wang, Y.H.; Hu, A.G. A Major innovation of water right system—An investigation of water right transaction in dongyang-yiwu by using the theory of institutional change. Water Resour. Dev. Res. 2001, 5–8. [Google Scholar]
- Xiao, G.X. On the exchange of water rights in China and its institutional changes. Manag. World 2004, 4, 51–60. [Google Scholar]
- Wheeler, S.A.; Garrick, D.E. A tale of two water markets in Australia: Lessons for understanding participation in formal water markets. Oxf. Rev. Econ. Policy 2020, 1, 132–153. [Google Scholar] [CrossRef]
- Xu, X.; Wu, F.P.; Zhang, L.N.; Gao, X. Assessing the effect of the Chinese river chief policy for water pollution control under uncertainty-using Chaohu Lake as a case. Int. J. Environ. Res. Public Health 2020, 9, 3103. [Google Scholar] [CrossRef] [PubMed]
- Wu, F.P.; Zhao, Y.; Tian, G.L. On the responsibility of the downstream area for the protection of three river sources—Based on the perspective of water community with a shared future. Qinghai Soc. Sci. 2020, 2, 93–98. [Google Scholar]
- Ma, X.Q. Water right and definition of water right-an analysis of property rights economics of water resource utilization. J. Beijing Adm. Inst. 2002, 1, 37–41. [Google Scholar]
- Zhang, L.N.; Zhang, X.L.; Wu, F.P.; Pang, Q.H. Basin initial water rights allocation under multiple uncertainties: A trade-off analysis. Water Resour. Manag. Int. J. Publ. Eur. Water Resour. Assoc. (EWRA) 2020, 34, 955–988. [Google Scholar] [CrossRef]
- Li, F.; Wu, F.P.; Chen, L.X.; Zhao, Y.; Chen, X.N.; Shao, Z.Y. Fair and reasonable allocation of trans-boundary water resources based on an asymmetric Nash Negotiation Model from the satisfaction perspective: A case study for the Lancang-Mekong River Bain. Int. J. Environ. Res. Public Health. 2020, 17, 7638. [Google Scholar] [CrossRef]
- Meng, Y.; Zhang, Y.M.; Guan, X.J.; Liang, S.X. Study on the water allocation model for the Hekoucun Reservoir based on the gradual upgrading guarantee for ecological flows. Yellow River 2019, 5, 38–42. [Google Scholar]
- Dong, Y.C.; Zhou, M.; Du, K.; Lu, M.; Huang, L.F.; Yang, J.L. A review of urban water demand forecasting methods and models. Softw. Guide 2019, 12, 1–5. [Google Scholar]
- Liu, S.F.; Yang, Y.J.; Wu, L.F. Grey System Theory and Its Application, 7th ed.; Science Press: Beijing, China, 2014; pp. 237–241. [Google Scholar]
- Womble, P.; Hanemann, W.M. Water markets, water courts, and transaction costs in Colorado. Water Resour. Res. 2020, 4, e2019WR025507. [Google Scholar] [CrossRef]
- Zhang, J.B.; Zhu, X.X.; Zhang, Y.L. Logic origin and operation mode of government’s retained water quantity of water right of Yellow River in Inner Mongolia. J. Econ. Water Resour. 2020, 4, 51–54, 59, 83. [Google Scholar]
- Wang, Y. Analysis on the trading potential of water rights in Qingdao and suggestions on the cultivation of water market. Water Resour. Dev. Res. 2018, 8, 22–25. [Google Scholar]
- Seidl, C.; Wheeler, S.A.; Zuo, A. Treating water markets like stock markets: Key water market reform lessons in the Murray-Darling Basin. J. Hydrol. 2020, 581, 124399. [Google Scholar] [CrossRef]
- Li, L.Y. Ontology Analysis and Realization Path of Water Human Rights. Ph.D. Thesis, East China University of Political Science and Law, Shanghai, China, 2017; pp. 5–12. [Google Scholar]
- Hu, D.S. The human to water: The right to water in human rights law. Hebei Law Sci. 2006, 5, 17–23. [Google Scholar]
- Thielbörger, P. The Right(s) to Water: The Multi-Level Governance of a Unique Human Right; Springer: Berlin/Heidelberg, Germany, 2014; pp. 23–70. [Google Scholar]
- Chávarro, J.M. The Human Right to Water: A Legal Comparative Perspective at the Iternational, Regional and Domestic Level; Intersentia: Cambridge, UK, 2015; pp. 15–54. [Google Scholar]
- Shen, Z.F. Principal Component Analysis Based on Changsha City Water Resources Carrying Capacity Assessment Research. Master’s Thesis, Central South University of Forestry Science and Technology, Changsha, China, 2019. [Google Scholar]
- Changsha National Economic Statistics Bulletin in 2019. Available online: http://tjj.changsha.gov.cn/tjxx/tjsj/tjgb/202003/t20200318_7042166.html (accessed on 7 January 2020).
- China Urban Construction Statistical Yearbook in 2018. Available online: http://www.mohurd.gov.cn/xytj/tjzljsxytjgb/jstjnj/ (accessed on 7 January 2020).


| Accuracy Class | Relative Error Δ(k) | Absolute Correlation Degree ς | Mean Square Error Ratio C |
|---|---|---|---|
| Class I | 0.01 | 0.90 | 0.35 |
| Class II | 0.05 | 0.80 | 0.50 |
| Class III | 0.10 | 0.70 | 0.65 |
| Class IV | 0.20 | 0.60 | 0.80 |
| Runoff Frequency | Discharge Volumes of Xiangtan City (Million m3) |
|---|---|
| Annual average | 63,020 |
| 50% | 61,070 |
| 75% | 49,028 |
| 90% | 38,327 |
| Year | Agricultural Water Consumption (Million m3) | Industrial Water Consumption (Million m3) | Domestic Water Consumption (Million m3) | Total Water Consumption (Million m3) |
|---|---|---|---|---|
| 2010 | 1776.13 | 1321.51 | 420.17 | 3800.06 |
| 2011 | 1747.92 | 1343.95 | 398.52 | 3765.2 |
| 2012 | 1657 | 1484.63 | 371.12 | 3803.33 |
| 2013 | 1647.09 | 1407.98 | 376.8 | 3830.74 |
| 2014 | 1793.63 | 1317.43 | 369.93 | 3838.48 |
| 2015 | 1704.08 | 1257.77 | 383.56 | 3736.94 |
| 2016 | 1654.34 | 1235.01 | 387.39 | 3663.35 |
| 2017 | 1575.87 | 1280.18 | 407.61 | 3667.8 |
| 2018 | 1415.86 | 1308.37 | 412.5 | 3586.39 |
| 2019 | 1400.95 | 1295.29 | 427.18 | 3584.79 |
| Runoff Frequency | The Discharged Water Volumes of Xiangjiang River Section-Xiangtan City (Million m3) | The Initial Water-Rights of Changsha City (Million m3) |
|---|---|---|
| Annual average | 63,020 | 4100 |
| 50% | 61,070 | 3976 |
| 75% | 49,028 | 3192 |
| 90% | 38,327 | 2495 |
| Runoff Frequency | 50% | 75% | 90% |
|---|---|---|---|
| Agricultural Initial Water-Rights Volumes (million m3) | 1745 | 1401 | 1095 |
| Year | True Value of Agricultural Water Consumption (Million m3) | Fitting Value of GM (1,1) (Million m3) | Residual | Relative Error |
|---|---|---|---|---|
| 2010 | 1776.13 | 1776.13 | 0 | 0 |
| 2011 | 1747.92 | 1781.03 | −33.11 | 0.0189 |
| 2012 | 1657 | 1739.14 | −82.14 | 0.0496 |
| 2013 | 1647.09 | 1698.24 | −51.15 | 0.0311 |
| 2014 | 1793.63 | 1558.30 | 235.33 | 0.1312 |
| 2015 | 1704.08 | 1719.29 | −15.21 | 0.0089 |
| 2016 | 1654.34 | 1581.22 | 73.12 | 0.0442 |
| 2017 | 1575.87 | 1544.02 | 31.85 | 0.0202 |
| 2018 | 1415.86 | 1507.71 | −91.85 | 0.0649 |
| 2019 | 1400.95 | 1472.25 | −71.30 | 0.0509 |
| Index | Runoff Frequency | ||
|---|---|---|---|
| 50% | 75% | 90% | |
| Agricultural ITCV (million m3) | 87.23 | 70.03 | 54.75 |
| Agricultural ITWV (million m3) | 611.48 | 267.47 | −38.23 |
| Runoff Frequency | 50% | 75% | 90% |
|---|---|---|---|
| Industrial Initial Water-Rights Volumes (million m3) | 1412 | 1134 | 886 |
| Year | True Value of Industrial Water Consumption (Million m3) | Fitting Value of GM (1,1) (Million m3) | Residual | Relative Error |
|---|---|---|---|---|
| 2010 | 1321.51 | 1321.51 | 0 | 0 |
| 2011 | 1343.95 | 1398.5 | 54.55 | 0.0406 |
| 2012 | 1484.63 | 1379.74 | 104.89 | 0.0707 |
| 2013 | 1407.98 | 1361.25 | 46.73 | 0.0332 |
| 2014 | 1317.43 | 1342.99 | −25.56 | 0.0194 |
| 2015 | 1257.77 | 1324.98 | −67.21 | 0.0534 |
| 2016 | 1235.01 | 1307.22 | −72.21 | 0.0585 |
| 2017 | 1280.18 | 1289.68 | −9.5 | 0.0074 |
| 2018 | 1308.37 | 1272.4 | 35.97 | 0.0275 |
| 2019 | 1295.29 | 1255.33 | 39.96 | 0.0309 |
| Index | Runoff Frequency | ||
|---|---|---|---|
| 50% | 75% | 90% | |
| Industrial ITCV (million m3) | 70.6 | 56.68 | 44.31 |
| Industrial ITWV (million m3) | 329.69 | 51.25 | −196.18 |
| Runoff Frequency | 50% | 75% | 90% |
|---|---|---|---|
| Domestic Initial Water-Rights Volumes (million m3) | 421 | 338 | 264 |
| Year | True Value of Domestic Water Consumption (Million m3) | Fitting Value of GM (1,1) (Million m3) | Residual | Relative Error |
|---|---|---|---|---|
| 2010 | 420.17 | 420.17 | 0 | 0 |
| 2011 | 398.52 | 371.32 | 27.20 | 0.0683 |
| 2012 | 371.12 | 376.49 | −5.37 | 0.0145 |
| 2013 | 376.8 | 381.71 | −4.91 | 0.0130 |
| 2014 | 369.93 | 387.02 | −17.09 | 0.0462 |
| 2015 | 383.56 | 392.40 | −8.84 | 0.0230 |
| 2016 | 387.39 | 397.85 | −10.46 | 0.0270 |
| 2017 | 407.61 | 403.38 | 4.23 | 0.0104 |
| 2018 | 412.5 | 4.08.99 | 3.51 | 0.0085 |
| 2019 | 427.18 | 4.14.66 | 12.52 | 0.0293 |
| Index | Runoff Frequency | ||
|---|---|---|---|
| 50% | 75% | 90% | |
| Domestic ITCV (million m3) | 21.07 | 16.92 | 13.22 |
| Domestic ITWV (million m3) | −61.24 | −144.33 | −218.17 |
Publisher’s Note: MDPI stays neutral with regard to jurisdictional claims in published maps and institutional affiliations. |
© 2021 by the authors. Licensee MDPI, Basel, Switzerland. This article is an open access article distributed under the terms and conditions of the Creative Commons Attribution (CC BY) license (http://creativecommons.org/licenses/by/4.0/).
Share and Cite
Chen, X.-n.; Wu, F.-p.; Li, F.; Zhao, Y.; Xu, X. Analysis of Tradable Water Volumes of Industry in Water-Rich Areas of China: A Case Study of Changsha City. Int. J. Environ. Res. Public Health 2021, 18, 679. https://doi.org/10.3390/ijerph18020679
Chen X-n, Wu F-p, Li F, Zhao Y, Xu X. Analysis of Tradable Water Volumes of Industry in Water-Rich Areas of China: A Case Study of Changsha City. International Journal of Environmental Research and Public Health. 2021; 18(2):679. https://doi.org/10.3390/ijerph18020679
Chicago/Turabian StyleChen, Xiang-nan, Feng-ping Wu, Fang Li, Yue Zhao, and Xia Xu. 2021. "Analysis of Tradable Water Volumes of Industry in Water-Rich Areas of China: A Case Study of Changsha City" International Journal of Environmental Research and Public Health 18, no. 2: 679. https://doi.org/10.3390/ijerph18020679