Article

Spatiotemporal Evolution of Ecosystem Health of China’s Provinces Based on SDGs

1
College of Environmental Science and Engineering, Nankai University, Tianjin 300350, China
2
Sichuan Academy of Environmental Policy and Planning, Chengdu 610041, China
*
Author to whom correspondence should be addressed.
Int. J. Environ. Res. Public Health 2021, 18(20), 10569; https://doi.org/10.3390/ijerph182010569
Submission received: 7 September 2021 / Revised: 6 October 2021 / Accepted: 7 October 2021 / Published: 9 October 2021

Abstract

:
In the context of increasing ecological scarcity, maintaining the balance between natural and artificial capital has become a popular research topic in the field of ecosystem health. From the perspective of coordinating natural and artificial capital and maintaining the balance between human systems and the Earth’s ecosystem, the Ecosystem Health Index (EHI) was developed on the basis of the Sustainable Development Goals (SDGs). The EHI consists of the Social Progress Index (SPI), Economic Development Index (EDI), Natural Environment Index (NEI), and a pressure adjustment coefficient. Comprehensive indicator assessment models were used to analyze the spatial and temporal evolution of the EHIs in 30 of China’s provinces from 2013 to 2019. A three-dimensional judgment matrix was used to classify the 30 provinces into four basic types. The results show the following: (1) From 2013 to 2019, the EHIs of all provinces improved to different degrees, with 19 provinces achieving a healthy state. (2) Spatially, the EHI showed some regional aggregation in 2013. Provinces with high EHIs were concentrated in the west, followed by those in the east, and those in the central provinces had the lowest EHIs. However, the differences between regions had narrowed by 2019. (3) The spatial distribution patterns of the NEI and the EDI varied widely, and most provinces did not reach a high level of coordination between natural and artificial capital. (4) The environmental pressure in all provinces, except Liaoning, decreased over time. In some cases, excessive pressure decreased the pressure-adjusted EHI, regardless of the EHI value. (5) According to the results of the ecosystem health classification in each province, the factors that hinder ecosystem health vary from place to place.

1. Introduction

Ecosystem health is a characteristic defined by the structural and functional integrity of an ecosystem in the face of disturbances from human activity [1,2]. Early scholars argued that a healthy ecosystem can repair itself despite disturbances, and requires only minimal external support in its management [3]. Other scholars [4] have considered ecosystem health to be the absence of damage or deterioration of the ecosystem organization. Holling et al. [5] added stability, vitality, and sustainability to the criteria for ecosystem health on the basis of the lack of disease. Haskell, Norton, and Costanza [6] defined ecosystem health as a healthy, disease-free system that is stable and sustainable; that is, the system is able to maintain its organizational structure, self-regulate, and recover from stresses over time. Since the initial development of the ecosystem health concept, it has been supplemented and refined by scholars. Mageau [7] argued that a healthy ecosystem supports human communities by providing ecosystem services, such as food, fiber, waste absorption and recycling, drinking water, and clean air. Rapport et al. [8,9] emphasized that the ability to meet reasonable human needs is also an important element of health, in addition to its ecological aspects. Two definitions have evolved, namely, natural ecosystem-centered geocentrism and anthropocentrism, which focuses on the role of system health in the lives of humans and their environment [10]. New advances in ecosystem health assessment methods have been achieved with the enrichment of the meaning of ecosystem health. Hong et al. [11] applied a social accounting matrix, logistic Steele-based land use simulation, and stream ecosystem background conditions as three sub-models for evaluating the health of a stream landscape ecosystem. Van Niekerk et al. [12] evaluated the stresses caused by various socio-ecological processes and analyzed the ecosystem response separately to evaluate the estuarine ecosystem health. The main assessment methods are the indicator species and indicator system approaches [13]. The indicator species method focuses on analyzing environmental changes and assessing the health of ecosystems according to the number of dominant and sensitive species in the community, which is suitable for a single ecosystem and the measurement of a large number of species. The indicator system method combines physics, biology, ecology, economics, and other disciplines to identify suitable comprehensive indicators, which are then used to establish a system of indicators to comprehensively evaluate the health of ecosystems, with the VOR (vitality, organization, and resilience) model being the most commonly used. Assessment techniques based on biodiversity, ecosystem service level, and the comprehensive index of ecosystem health were developed and have been widely used to assess the health status of typical ecosystems, such as forests, rivers, and lakes [14,15,16,17,18]. These studies conducted useful explorations for the sustainable development of ecosystem health and the resource environment at the regional level.
In September 2015, the 2030 Agenda for Sustainable Development [19] was formally adopted in the United Nations Sustainable Development Summit, identifying 17 Sustainable Development Goals (SDGs). The SDGs emphasized the importance of sustainable ecosystem management to ensure the provision of various ecosystem services for future generations. However, the Sustainable Development Goals Report [20] showed insufficient progress on the SDGs related to ecological and environmental areas, deviating from the direction toward sustainable development. Resource scarcity, ecological damage, and the lack of green transition development have become threats to the health of global ecosystems. This phenomenon implies an intergenerational shift in the “scarcity” factors governing socio-economic development; that is, the main scarcity factors that constrain production are shifting from artificial capital to natural capital [21]. A growing conflict exists between the ability of ecosystems to provide limited services to humans and the unlimited demands of human socio-economic development. However, previous studies [22,23,24] on ecosystem health have not addressed the issue of ecological scarcity, with resource scarcity and ecological degradation as the core, and have failed to link ecosystem health with the sustainable development needs of human society from the perspective of coupled human–Earth systems. In addition, previously constructed index systems have mostly relied on the traditional evaluation framework, while lacking an index system that dovetails with the international evaluation framework.
The essence of ecosystem health, the goal of sustainable development, lies in the basic guarantee of providing ecological conditions for sustainable development. Healthy ecosystems are the cornerstone for future sustainable development. Both sustainable development measures and the ecosystem health evaluation system characterize the coupling and driving relationships of human-Earth systems, so the former can provide a reference for the construction of the latter. In this study, we combined the relationship between human and natural systems, considered the connotation of ecosystem health and the 17 SDGs, and built an ecosystem health evaluation system from the perspective of coordinating natural and artificial capital based on SDG assessment. An ecosystem health index (EHI) consisting of three subindexes, namely, the social progress index (SPI), the economic development index (EDI), and the natural environment index (NEI), and a pressure adjustment coefficient (P) was established. This study was conducted in China at the provincial scale to diagnose the effectiveness of current environmental protection actions and provide information support for sustainable ecosystem management.

2. Materials and Methods

2.1. Evaluation Basis

The concept of “health” was originally used to describe the human body and other animals and plants in a sound physical state [25,26]. The WHO defines health as not only the absence of disease or infirmity, but also the complete physical, psychological, and social state of well-being. On the basis of the relationship between ecosystems and humans, the health definition can be extended to ecosystems. Ecosystem health can be understood as the stability of the capital stock and the sustainability of the capacity to provide ecosystem services from the perspective of the structural function of the ecosystem and its mutually beneficial relationship with humans. Sustainable development is dedicated to searching for the reasonable self-reliance of the socio-economic–natural development system in terms of “development, coordination, and sustainability.” From the ecological aspect, we pursue a reasonable balance between ecosystem health and socio-economic development. The core of sustainable development-oriented ecosystem health addresses the relationship between humans and nature to ensure a balance between society’s demands on and returns to nature; that is, the increase in artificial capital does not presuppose the destruction of and reduction in natural capital. As a source of human welfare, natural ecosystems play an important role in improving the lives of human beings by providing them with the means of production and living; ecological resources are transformed into economic and material wealth to realize the accumulation of artificial capital, which is then invested in social development and regional construction. Natural ecosystems are also the material carriers of human life, providing direct ecological services, such as fresh air, clean water, and good environmental quality [27]. In addition to these desired outputs, the process of transforming natural capital into materials for human consumption has undesirable outputs, such as environmental pollution, with negative impacts on ecosystem health. To ensure the sustainability of ecological services and provide the basic guarantee of natural capital for humans, ecosystems must be managed sustainably.
With a timeline from 2015 to 2030, the SDGs aim to address the social, economic, and environmental dimensions of development in an integrated manner to harmonize the relationship between humans and nature, and promote the shift of human society toward a sustainable development path [19]. Since the release of “Our Common Future” in 1987, global consensus has been reached on three major aspects that define sustainable development: promoting scientific and technological innovation to overcome the diminishing marginal benefits of growth and provide economic development momentum; maintaining the increase in wealth and sustaining the quality of economic development without sacrificing the ecological environment; and ensuring that institutional construction can increase rational and orderly social management and realize fairness in economic development [28]. The three main elements that influence the health of the Earth’s ecosystems according to the theory of sustainable socio-economic growth and the meaning of ecosystem health are presented in Figure 1, addressing the questions of how natural systems sustainably provide abundant ecological resources, which is a fundamental prerequisite for ecosystem health, and how human systems fully utilize efficient resources to sustain the dynamics of economic development while improving ecosystem health. The ultimate goal of both of these aspects is to achieve the health and well-being of human systems so that the dynamic balance between humans and nature can be effectively maintained and the ecosystem can exist in a stable and healthy condition.

2.2. Establishment of Evaluation Index System

From the perspective of the natural–social–economic composite ecosystem, the need to coordinate natural and artificial capital under ecological scarcity is considered in this paper. An evaluation index system of the EHI for benchmarking SDGs was established, including three subindexes and a pressure adjustment coefficient (P), as shown in Figure 2 and Table 1.

2.2.1. Indicators of the SPI

Social progress reflects the systematic level of social construction and SPI comprises eight indicators, including regional urbanization, education, employment, medical care, consumption, social equity, and other aspects.

2.2.2. Indicators of the EDI

Economic growth is evaluated in terms of economic development, industrial structure, and per capita income. Fixed capital is an important factor affecting economic growth. The growth rate of GDP and disposable income are indicators of the level and speed of economic development. The contributions of secondary and tertiary industries to GDP are important indicators of the level and quality of modernization of the national economy. The higher the proportion, the higher the level of economic development. The proportion of R&D expenditure to regional GDP reflects the scale and intensity of R&D activities and the investment in science and technology innovation.

2.2.3. Indicators of the NEI

In this study, the natural environment is divided into two aspects: natural resources and environment. Natural resources are the main source and material basis of production and living, and the environment indicates the quality of the ecological environment, including water, air, soil, and ecological environments. Five indicators were used to reflect resource endowment conditions: energy, water, arable land, forest, and wetland resources. Eight indicators cover water, air, and soil quality and environmental inputs, measuring the quality and sustainability of the ecological environment.

2.2.4. Indicators of P

The above three subindexes are categorized as state quantities. Several pressure indicators also have an impact on ecosystem health, such as pollution emissions and resource consumption. However, these pressures are lagging indicators and provide no clear indication of the current state. They are only able to characterize trends to a certain extent.
This paper draws on the idea of the Planetary pressures-adjusted Human Development Index (PHDI) [29] by using an adjustment factor (P, where a high value implies low pressure). P consists of indicators of resource consumption and pollution emissions (including greenhouse gas emissions). The rate of human resource exploitation must be kept below the rate of resource output, and waste emissions should be kept below the capacity of the environment to absorb and transform waste, which is necessary to prevent the destruction of the biosphere’s ability to produce resources and maintain the services needed for society to survive and thrive. The PEHI is based on the EHI adjusted by P.
Due to the different levels of economic development and population sizes in different regions, some indicators cannot be directly compared and must be expressed by using the per capita or intensity value. According to the purpose of evaluation, indicators reflecting resource endowment use the per capita value, and some indicators reflecting the level of green development use the intensity value, which better reflects the quality of economic development.

2.3. Determination of Indicator Weights and EHI Evaluation Models

To avoid the drawbacks of the subjective weighting method, the entropy weight method [30,31,32] was adopted to calculate the weight of each indicator. Then, the scores of social progress (SPI), economic development (EDI), natural environment (NEI), and pressure adjustment coefficient (P) were calculated for each province from 2013 to 2019 according to the weights. The specific steps and formulas are as follows:
  • The initial indicators are standardized.
    Both positive and negative indicators are expressed as Equation (1) [33,34]:
    Y i j = X i j X j   w o r X j   o p t X j   w o r
    where Yij is the standardized value of Xij; Xij is the initial value of indicator i in province j; and Xj opt and Xj wor are the optimal and worst values of indicator i, respectively. The method for determining the threshold is detailed in Section 2.4.
    The normalization matrix is constructed according to the standardized results using Equation (2):
    E = Y i j m × n = X 11 X 12 X 1 n X 21 X 22 X 2 n X m 1 X m 2 X m n  
    where m is the number of evaluation indices, and n is the number of evaluation objects.
  • The entropy value ( E i ) and difference coefficient ( H i )   of   indicator   i are calculated as Equations (3) and (4):
    E i = 1 ln m i = 1 m X i j i = 1 m X i j ln X i j i = 1 m X i j
    H i = 1 E i  
  • Weight ω i is calculated as Equation (5):
    ω i = H i n i = 1 n H i ; 0 ω i 1 , i = 1 n ω i = 1 ,
    where ω i   is the weight of indicator i.
  • According to the corresponding weights, the score (Uk) of each subindex (including P) is derived as Equation (6):
    U k = i = 1 n Y i j ω i
  • The EHI score is calculated as Equation (7):
    E H I = α U 1 + β U 2 + γ U 3
    where α, β, and γ are undetermined parameters. As the three subsystems can influence and complement each other and are equally important in the larger system, each takes 1/3 of the weight.
  • The PEHI after adjustment [29] is calculated using Equation (8):
    P E H I = P × E H I ,
    where the PEHI represents the EHI adjusted by pressure. The value of P is within the range of [0, 1], and a high value means low pressure.

2.4. Determination of the Threshold Value

2.4.1. Discussion of Indicator Characteristics

Although the most common evaluation indicators are positive and negative indicators, moderate indicators also exist. These indicators have a tolerance range, which should neither be extremely large nor small, such as the urbanization rate, the number of medical practitioners (assistants) per 1000 people, and the intensity of land development, all of which are used in our study.
An extremely low urbanization rate indicates that economic growth in the urbanization process has not been fully realized. Conversely, an extremely high value indicates the excessive expansion of cities and towns, and the large-scale aggregation of the population in cities and towns will cause a series of problems. For example, the number of available jobs cannot meet the demand, and the expansion of cities occupies a large amount of farmland, which poses many hidden dangers to China as a major agricultural country. In serious cases, providing sufficient food to people becomes a severe problem. In this paper, the optimal level of developed countries is set to 80%, and an urbanization rate ranging from 0 to 80% is regarded as a positive indicator (0 is the worst value and 80% is the optimal value), which can be directly used in standardized calculations. Once the value exceeds 80%, the metric is normalized to 0.
The intensity of land development follows the same approach as that of the urbanization rate. When the intensity of land development exceeds a certain limit, people’s living environment will be threatened. According to “Outline of National Land Planning (2016–2030)”, China’s land development intensity will be controlled within 4.62% by 2030. Therefore, in this study, 4.62% is considered the optimal value, as stipulated by China, and the interval between 0 and 4.62% is regarded as a positive indicator.
An extremely small number of medical practitioners (assistants) indicates a lack of medical resources, while an extremely large number will result in the waste of medical resources. However, the screening of all the data collected during the study period revealed that the maximum value of this indicator among all provinces was 5.85, which does not reach the level of medical resource waste. Therefore, this indicator is regarded as a positive indicator.

2.4.2. Principles for Determining Thresholds

The five-step decision tree method in the Sustainable Development Report [20] was used to determine the optimal and worst values of the indicators after adjustment, considering the actual situation in China. The specific methods are as follows:
  • The indicators that are explicitly included in the SDGs with absolute thresholds, such as the urban registered unemployment rate and the Gini coefficient, are directly adopted. The absolute value is regarded as the value of the indicator, whose optimal value is 0.
  • For the indicators that are not explicitly required in the SDGs but have a desirable accepted value, such as the years of schooling per capita, the accepted value is selected as the optimal value.
  • Some indicators have stipulated limits in China, such as the ratio of nature reserves to jurisdictional areas; in this study, the optimal value of this indicator is set to 15% in counties, cities, and provinces in China. The optimal value for fertilizer application intensity is 250 kg/ha.
  • For the indicators not included in the three scenarios above, the average of the three best/worst performing provinces is always selected as the best/worst value.

2.5. Classification of Health Levels

A comprehensive index was used to classify ecosystem health status in previous studies [35]. As such a classification can be easily influenced by a subsystem that scores extremely high or low and obscures the original weak (superior) term, we classified the ecosystem health of the subsystem into three levels [23,36] on the basis of the calculated subindexes of social progress, economic development, and natural environment according to the Natural Breaks method of thematic classification in ArcGIS (Table 2). It is important to emphasize that ecosystem health is a relative concept as it is defined according to the reference values of indicators, and the Natural Breaks method of thematic classification, which is based on the natural grouping inherent in the data, identifies the classification intervals. Thus, the breaks of the three levels are “local”, not “global”; in other contexts and with other data, the values of the breaks would be different.
The ecosystem health status of each province was identified by establishing a three-dimensional assessment matrix [37] based on the health level of each subsystem (Table 3), similar to the identification methods of health status adopted by other scholars [23]. The rules are as follows:
If all three subindexes have values at the “healthy” level, that is, H = 3, the province has a comprehensive health status, that is, social–economic–natural health.
If all three subindexes have values at the “subhealthy” level, that is, S = 3, the province has a subhealth status, that is, social–economic–natural subhealth.
If one or more of the three subindexes have values at the “disease” level, that is, D ≥ 1, the province has the corresponding disease status based on the “one-vote veto system”.
If one of the three subindexes has a value at the “healthy” level, that is, H = 1 and D = 0, the province has a single health status, such as natural health or economic health.
If two of the three subindexes have values at the “healthy” level, that is, H = 2 and D = 0, the province has a compound health status, such as economic-natural health or social–economic health.
Social–economic–natural health is defined as the comprehensive health status. Social–economic, social–natural, and economic–natural health are compound health statuses, and social, economic, and natural health are single health statuses. Social–economic–natural subhealth is the subhealth status, and social, economic, and natural disease are single disease statuses. Social–economic, social–natural, and economic–natural disease are compound disease statuses, and social–economic–natural disease is defined as the comprehensive disease status.

2.6. Data Source

In 2011, the 7th National Environmental Protection Congress of China clarified the new principle of “Development in protection and protection in development,” and China began to explore a new path of green, high-quality, and sustainable development. Since then, the laws and regulations related to ecological and environmental protection have been updated to improve the health of the ecosystem. The year 2013 was an important landmark year for China in its commitment to fighting environmental pollution and starting a new path toward harmonizing the development of human and natural environments. Thus, 2013 was used as the starting point of the study period. The research endpoint is 2019, as the latest data available are from 2019. In the selection of sample regions, Tibet, Hong Kong, Macau, and Taiwan were excluded due to difficulties in obtaining data. The data of 30 other provinces (municipalities and autonomous regions) in China from 2013 to 2019 were obtained from regional statistical yearbooks, local government websites, national environmental statistical bulletins, the China Environmental Statistical Yearbook, the China Statistical Yearbook, and the China Energy Statistical Yearbook. Individual missing data were calculated using the average, exponential trend extrapolation, and interpolation methods.

3. Results and Discussion

3.1. Analysis of EHI Temporal Characteristics

3.1.1. Analysis of Country-Level Temporal Characteristics

Since 2013, China has issued a series of major policy decisions about environmental protection, including the revision of laws and emission limits for the prevention and control of water, air, and soil pollution in the ecological and environmental field. The results of this study’s evaluation clearly indicate that this series of initiatives has achieved good results at the national level (Figure 3): China’s EHI increased from 0.6395 in 2013 to 0.7029 in 2019, showing a positive trend, which is consistent with China’s performance in the SDGs evaluation (the SDGs evaluation started in 2016). Each subindex shows different degrees of improvement. The SPI increased from 0.6590 in 2013 to 0.7494 in 2019, the EDI improved from 0.6006 to 0.6981, and the NEI was stable, fluctuating in a small range above and below 0.66. The improvement of the EDI and SPI indicates that the capacity of natural systems to supply services to human society improved, as natural capital was not reduced or lost. The coordinated development of artificial and natural capital confirms the effectiveness of the initiatives introduced in China. The pressure also decreased annually, with P increasing from 0.690 to 0.847, implying that various human production activities exerted low negative pressure on the natural environment and became less of an obstacle to the achievement of sustainable development.
Figure 3 indicates a brief decline in the EDI between 2013 and 2015 as China’s economy was in full transition to the new normal, and the real estate ended its 15-year-long boom period and entered an adjustment period, leading to a significant increase in downward pressure on the economy during that period. China’s EDI returned to a positive trajectory after 2015 and had improved to 0.698 by 2019 due to the acceleration of institutional reforms, stock adjustment, and incremental optimization in China. The EHI trend is basically the same as the EDI trend, indicating that economic development determines the direction of ecosystem health in China’s current stage of development. At present, China’s GDP per capita is slightly over USD 10,000, which is roughly equivalent to only 90% of the world average, with a gap of approximately 20% from the standard of high-income countries. Thus, achieving high-quality economic development remains a challenge. However, extremely high economic growth may lead to the “pollution for growth” of unrestrained development, thereby requiring green transformation development to build a modern society in which people and nature live together in harmony.

3.1.2. Analysis of Provincial Temporal Characteristics

At the provincial level (Table 4), all provinces in the country show an overall increasing EHI trend, with all of them improving to varying degrees in 2019 compared to 2013. The EHI ranges in 2013 and 2019 were 0.5351–0.7411 and 0.6116–0.7627, respectively. Henan exhibited the largest improvement, increasing from 0.5368 in 2013 to 0.6508 in 2019, with a growth rate of 21.23%. From the subindex scores, the increase is mainly driven by the significant improvement of the EDI and the NEI. Specifically, Henan adhered to the development concept of ecological priority and mutual promotion of ecology and the economy and has taken many initiatives to promote the integration of ecological construction and economic and social development.
Anhui, Fujian, Jiangxi, Hubei, Hunan, Guangdong, and Ningxia exhibited a rising trend for 7 consecutive years. The other provinces did not maintain a continuous rising trend, but the fluctuation range was small, and the rise or fall did not exceed 0.06. The largest increase in the EHI occurred in Chongqing between 2018 and 2019, during which it increased by 0.055. Among specific indicators, Chongqing performed better than the other provinces in ecological protection and governance, resource consumption intensity, and resource use efficiency. The largest decline in the EHI occurred in Liaoning between 2013 and 2014, during which it decreased by 0.024, due to a decline in both the EDI and the NEI. Liaoning had a serious problem of insufficient investment in environmental protection during this period.

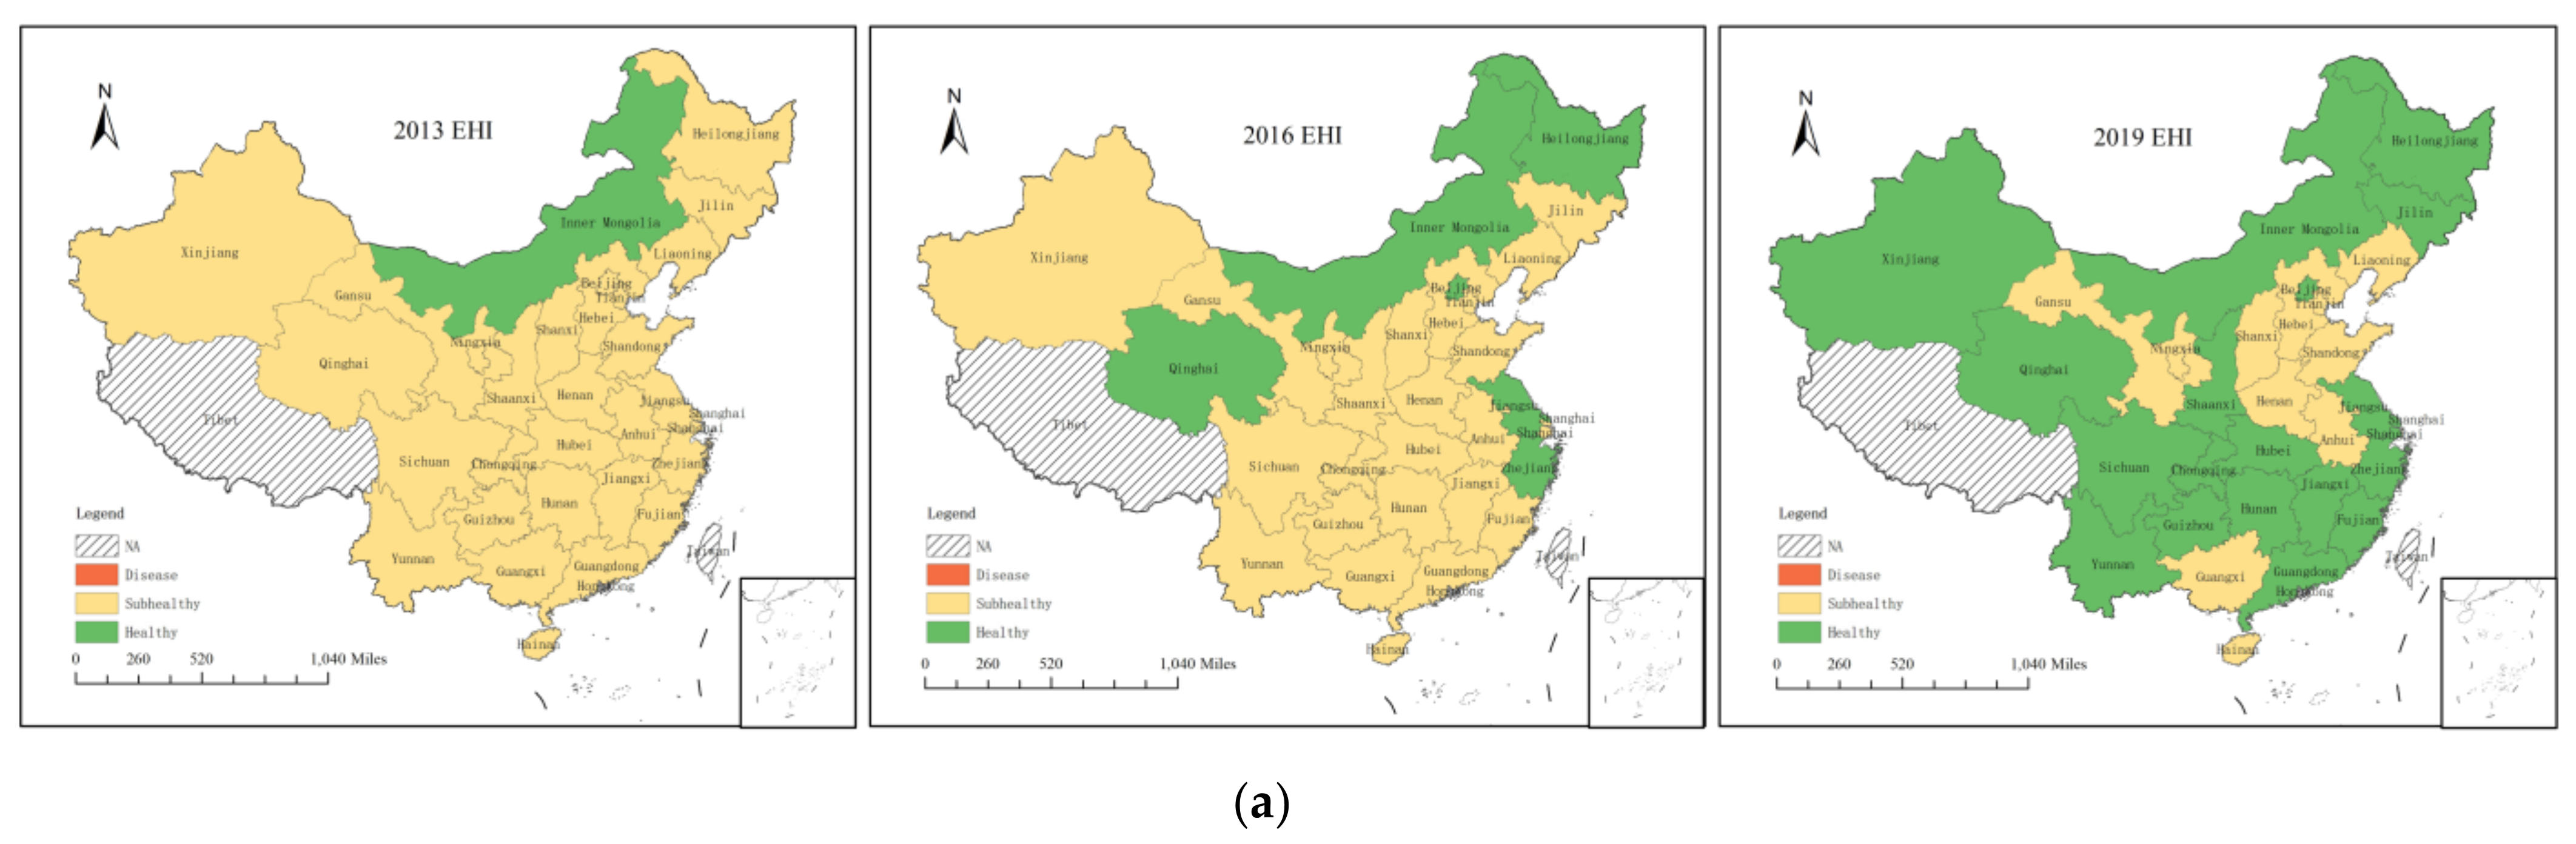
3.2. Analysis of EHI Spatial Characteristics

The characteristics of the spatial pattern were analyzed at three different points in time (i.e., 2013, 2016, and 2019). China can be divided into three major regions: eastern, central, and western. The eastern region includes the 13 provinces (cities) of Heilongjiang, Jilin, Liaoning, Beijing, Hebei, Tianjin, Fujian, Jiangsu, Shandong, Shanghai, Zhejiang, Guangdong, and Hainan; the central region includes the 6 provinces (cities) of Shanxi, Anhui, Jiangxi, Henan, Hubei, and Hunan, and the western region includes the 12 provinces (cities) of Inner Mongolia, Guangxi, Gansu, Ningxia, Qinghai, Shaanxi, Xinjiang, Guizhou, Sichuan, Tibet, Yunnan, and Chongqing. The EHI has a degree of spatial aggregation (Table 4, Figure 4a). In 2013, provinces with high EHIs were concentrated in the western region, followed by those in the eastern provinces, and the central provinces, such as Anhui, Henan, and Shanxi, had poor EHIs. However, through the implementation of the strategy of the rise of Central China, the ecosystem health improved with the commodity food base, important energy sources, and raw material base. By 2019, 19 provinces had transitioned to a healthy state, and the differences between regions gradually narrowed.
In terms of the SPI (Figure 4b), all provinces had good development bases and were already above the subhealthy level in 2013, with the eastern provinces of Beijing, Tianjin, Jiangsu, Zhejiang, and Guangdong performing predominantly at the healthy level. The other provinces transitioned to a healthy state over time. The remote areas of Gansu, Yunnan, and Guizhou, which are located in southwestern and central-western China (mostly in mountainous and basin landscapes with inconvenient transportation and therefore a relatively low level of social development), remained in a subhealthy state, requiring urgent improvement in the services that they can provide for the well-being of their residents.
The EDI (Figure 4c) of the provinces fluctuated considerably. The EDIs of Beijing, Tianjin, Jiangsu, and Zhejiang were at healthy levels in 2013, with a good economic foundation. In contrast, the EDIs of Hebei, Shanxi, Heilongjiang, and Hainan were at the disease level, with relatively low economic development. In 2016, Xinjiang and Gansu, which are located in northwest China, transitioned to a disease state. The terrains of these two provinces are mostly mountains and basins, and the transportation was underdeveloped. Their economic development was relatively low as it was mostly based on agriculture and animal husbandry. The southeast coast transitioned to a healthy state during this period and drove the economic development of the surrounding provinces. Provinces in a good economic state in 2019 are clustered around Beijing and Hubei. Owing to the focus of the western development strategy, the economic situation in the northwest also improved, with no provinces having an EDI in the disease category.
The NEI showed an opposite spatial distribution pattern to the EDI and did not greatly change over the seven study years (Figure 4d), indicating that most of the provinces failed to achieve coordination between natural and artificial capital. The NEIs of the western and northeastern regions were high and remained healthy. Most mid-western and northeastern regions have been blessed with natural resources, such as minerals, energy, and biological resources. Their economy was underdeveloped, making their ecological environment better protected and less damaged than those of the other provinces. The NEIs of the other regions were at the subhealthy or disease level. The NEIs of the provinces centered on Beijing, Tianjin, and Hebei were at the disease level. As the capital of China, Beijing had a high level of economic and social development (Figure 4b,c) but had notable shortcomings in the natural environment. First, the urbanization rate and the population density were high, and the per capita resource endowment was insufficient. Second, the environmental quality and the ecological condition were unsatisfactory. The eastern coastal provinces had a low level of resources due to the low importance placed on resources. As developed regions in China, these provinces had a high level of economic development. They can provide a solid economic foundation for promoting the upgrade of the energy consumption structure, green transformation development, and ecological environment construction. However, the current situation indicates that this ideal state has not yet been reached.

3.3. Classification of Provincial Ecosystem Health Level

According to the identification rules in 2.5, the 30 provinces in 2019 were classified into four basic types and six subtypes (Figure 5). Two provinces, namely, Jiangxi and Sichuan, achieved comprehensive ecosystem health. Inner Mongolia, Jilin, Heilongjiang, Shaanxi, Qinghai, and Xinjiang were characterized by social–natural health, while Zhejiang, Anhui, Fujian, Henan, Hubei, Hunan, Guangdong, and Chongqing were classified at the social–economic health level. Hebei, Shanxi, Liaoning, Guangxi, Hainan, and Ningxia were socially healthy. Guizhou, Yunnan, and Gansu were at the natural health level. Beijing, Tianjin, Shanghai, Jiangsu, and Shandong were characterized by natural disease. From the classification results, we can conclude that the provincial ecosystem health categories are generally spatially clustered, and some provincial ecosystem health classes have high consistency and local clustering. This classification provides a policy reference for the regional improvement of ecosystem health.

3.4. Pressure-Adjusted EHI (PEHI)

The PEHI is obtained according to Equation (8) in 2.3. If a region is not subjected to pressure from pollution emissions and resource consumption, then its PEHI and EHI will be equal. According to Table 5, the environmental pressure improved to varying degrees in nearly all provinces (a large P indicates low pressure). From 2013 to 2019, the environmental pressure was low in the southern provinces of Chongqing, Yunnan, Fujian, Jiangxi, Hunan, and Sichuan, while it was high in the northern provinces of Ningxia, Shanxi, Liaoning, Inner Mongolia, and Xinjiang, especially Liaoning, where pressure was higher in 2019 compared to 2013. This result indicates that the south had better control over resource consumption and pollution emissions than the north. Shanxi, which accounts for 2% of the country’s land area but retains more than 20% of the country’s coal reserves, had the poorest performance of the provinces. The past intensive development model greatly increased Shanxi’s resource consumption intensity, resulting in serious pollution emission problems. However, the environmental pressures faced by the provinces eased with the advancement of the energy revolution and the development of high-quality transformation in the energy industry. Given the complexity of environmental problems, Liaoning failed to maintain its trend of mitigating environmental pressure in 2019 and experienced a temporary decline. Industrial restructuring, environmental pollution treatment, environmental policy establishment, and the promotion of ecological environment construction should be carried out.
Taking 2019 as an example, the effect of P on the EHI was explored. As shown in Figure 6, extreme pressure (small P value) decreased the final PEHI in some cases, such as in Ningxia, Inner Mongolia, and Xinjiang provinces, regardless of the EHI value. Although China’s provinces had made efforts in green development and pollution prevention, the EHI was still influenced by environmental pressures. This phenomenon can be attributed to the leapfrog development of China’s economy and the complexity of environmental problems caused by spatial and temporal compression, which had multiple effects leading to relatively high pressure on China’s ecological environment and the serious situation around the world. The P of Sichuan was close to 1, indicating that the environmental pressure was low and the PEHI was very close to the EHI. However, except for Sichuan, the PEHIs of other provinces with healthy EHIs (EHI > 0.7) transitioned to subhealthy after the pressure adjustment. The subhealthy EHI decreased to the disease level after pressure adjustment in three provinces: Hebei, Shanxi, and Ningxia. Excessive environmental pressure can lead to the deterioration of natural ecosystems and reduce ecosystem services and functions, which may reduce the social and economic benefits and ultimately affect human well-being. This result indicates that immediate and aggressive initiatives must be implemented to reduce the tremendous pressures on the natural environment caused by human activities. Otherwise, the level of ecosystem health will stagnate.

4. Conclusions

In this study, an EHI system was developed for Chinese provincial units based on the SDGs, consisting of the SPI, the EDI, the NEI, and P. Then, we studied the spatial and temporal variation in the EHI in 30 of China’s provinces from 2013 to 2019. The 30 provinces were classified into four basic types based on the three subindexes using a three-dimensional judgment matrix. The main findings are as follows:
(1)
In terms of the time series, the overall level of provincial ecosystem health in China was on the rise between 2013 and 2019. The EHIs of all 30 provinces improved to varying degrees, driving the national EHI from 0.6395 in 2013 to 0.7029 in 2019. This trend indicates that the actions taken since 2013 to protect the ecological environment have effectively decreased the conflict between socio-economic development and ecosystem protection and promoted the coordinated development of the human and natural environments.
(2)
Spatially, the EHI showed certain regional aggregation at the beginning of the study period. The provinces with high EHIs were concentrated in the western regions, followed by the eastern provinces, and the central provinces had the lowest levels. The differences between regions had narrowed by 2019. In terms of the subindexes, the spatial distribution patterns of the NEI and the EDI differed greatly, and natural and artificial capital did not reach a high level of coordination in most of the provinces.
(3)
The environmental pressure was mitigated to varying degrees in all provinces from 2013 to 2019, except in Liaoning. In some cases, excessive pressure decreased the PEHI, regardless of the EHI value. The southern provinces had low environmental stress, while the northern provinces had high stress. There is a distinct spatial distribution of environmental stress.
(4)
According to a three-dimensional judgment matrix, the classification of ecosystem health in each province was determined, and potential countermeasures were identified. Each region should focus on its specific characteristics and advantages and clarify the main and secondary aspects to achieve key breakthroughs in certain areas and comprehensively improve regional ecosystem health. Provinces in the social–natural health class had serious deficiencies in R&D investment and low proportions of secondary and tertiary industries. Actions should be taken to improve the innovation of the ecological system and build a market with a diversified science and technology investment mechanism. Meanwhile, effort should be put into realizing the high-quality development of secondary and tertiary industries and continuously optimizing the industrial structure, combined with national industrial policies. Provinces in the social–economic health class should support the development of environmental protection construction with strong capital, advanced technology, and improved systems based on a good economic foundation. These provinces should strengthen the government’s function in the protection of the ecological environment, increase the investment of funds and human resources in ecological environment construction, strengthen the monitoring of the ecological environment, and carry out comprehensive macro-control of regional economic development and environmental protection. Provinces in the social health class shoulder the burden of the dual transformation of economic–social development and protection of the ecological environment. They should strengthen their cooperation with the capital forces of domestic provinces, change their mode of economic development, and optimize their economic structure. They should also maintain their current achievements in protecting the ecological environment and explore the establishment of a scientific and complete system of ecological environment protection. Provinces in the natural health class have healthy natural environmental systems and a low index of economic development. On the one hand, economic development should be continuously accelerated to provide solid support for the overall improvement of regional ecosystem health. On the other hand, the existing advantages should be consolidated, ecological advantages should be fully exploited, and the counter-effect of environmental regulations on the negative consequences of economic development must be enhanced to realize the simultaneous growth of artificial and natural capital. Provinces with developed economies that are grouped into the natural disease class should be guided in the transformation of economic development dynamics through environmental regulations to promote the optimization of industrial structure and green development, and enterprises should be encouraged to intensively implement the concept of green development. Further research and development and promotion of new products, new technologies, and new business models for pollution prevention, green energy, energy saving, and emission reduction should be conducted to realize the gradual replacement of the traditional unrestrained growth model with a green and innovative economic development model.

Author Contributions

Conceptualization, R.Z.; Formal analysis, R.Z.; Funding acquisition, C.S.; Investigation, R.Z. and R.H.; Methodology, R.Z. and C.S.; Project administration, C.S.; Resources, C.S.; Supervision, C.S.; Validation, R.Z.; Writing—original draft, R.Z. and R.H.; and Writing—review and editing, C.S. All authors have read and agreed to the published version of the manuscript.

Funding

This research was funded by the National Natural Science Foundation of China, grant number 42071292.

Institutional Review Board Statement

Not applicable.

Informed Consent Statement

Not applicable.

Data Availability Statement

The data presented in this study are available in the article.

Acknowledgments

The authors would like to thank the project team for their full support.

Conflicts of Interest

The authors declare no conflict of interest.

References

  1. Rapport, D.; Böhm, G.; Buckingham, D.; Cairns, J.; Costanza, R.; Karr, J.; De Kruijf, H.; Levins, R.; McMichael, A.; Nielsen, N.; et al. Ecosystem Health: The Concept, the ISEH, and the Important Tasks Ahead. Ecosyst. Health 1999, 5, 82–90. [Google Scholar] [CrossRef] [Green Version]
  2. Costanza, R.; Norton, B.G.; Haskell, B.D. Ecosystem Health: New Goals for Environmental Management; Island Press: Washington, DC, USA, 1992. [Google Scholar]
  3. Karr, J.R.; Fausch, K.D.; Angermeister, P.L.; Yant, P.R.; Schlosser, I.J. Assessing Biological Integrity in Running Waters: A Method and Its Rationale; Special Publication 5; Illinois Natural History Survey: Champaign, IL, USA, 1986. [Google Scholar]
  4. Li-Guo, Y.E.; Xiao-Chun, L.I. Review on Ecosystem Health. Res. Soil Water Conserv. 2008, 5, 186–190. [Google Scholar]
  5. Arrow, K.; Bolin, B.; Costanza, R.; Dasgupta, P.; Folke, C.; Holling, C.S.; Jansson, B.O.; Levin, S.; Mäler, K.G.; Perrings, C.; et al. Economic growth, carrying capacity, and the envi-ronment. Science 1996, 1, 104–110. [Google Scholar]
  6. Haskell, B.D.; Norton, B.G.; Costanza, R. Introduction: What Is Ecosystem Health and Why Should We Worry about It? Island Press: Washington, DC, USA, 1992. [Google Scholar]
  7. Mageau, M.T. Development and Testing of a Quantitative Assessment of Ecosystem Health; University of Maryland: College Park, MD, USA, 1998. [Google Scholar]
  8. Rapport, D.J. What Constitutes Ecosystem Health? Perspect. Biol. Med. 1989, 33, 120–132. [Google Scholar] [CrossRef]
  9. Rapport, D.J.; Maffi, L. Eco-cultural health, global health, and sustainability. Ecol. Res. 2010, 26, 1039–1049. [Google Scholar] [CrossRef]
  10. Vilchek, G.E. Ecosystem Health, Landscape Vulnerability, and Environmental Risk Assessment. Ecosyst. Health 1998, 4, 52–60. [Google Scholar] [CrossRef]
  11. Hong, B.; Limburg, K.E.; Erickson, J.D.; Gowdy, J.M.; Nowosielski, A.A.; Polimeni, J.M.; Stainbrook, K.M. Connecting the eco-logical-economic dots in human-dominated watersheds: Models to link socio-economic activities on the landscape to stream ecosystem health. Landsc. Urban Plan. 2009, 91, 78–87. [Google Scholar] [CrossRef]
  12. Van Niekerk, L.; Adams, J.B.; Bate, G.C.; Forbes, A.T.; Forbes, N.T.; Huizinga, P.; Lamberth, S.J.; MacKay, C.F.; Petersen, C.; Taljaard, S.; et al. Country-wide assessment of estuary health: An approach for integrating pressures and ecosystem response in a data limited environment. Estuar. Coast. Shelf Sci. 2013, 130, 239–251. [Google Scholar] [CrossRef]
  13. Yang, B.; Sui, P.; Chen, Y.Q.; Gao, W.S. Progress in Ecosystem Health Assessment. Chin. Agric. Sci. Bull. 2010, 21, 291–296. (In Chinese) [Google Scholar]
  14. Chen, G.; Dai, L.; Fan, Z.; Wang, Q. On forest ecosystem health and its evaluation. On forest ecosystem health and its evalua-tion. Chin. J. Appl. Ecol. 2002, 13, 605–610. [Google Scholar]
  15. Mo, M.H.; Wang, X.L.; Wu, H.J.; Cai, S.; Zhang, X.; Wang, H. Ecosystem Health Assessment of Honghu Lake Wetland of China Using Artificial Neural Network Approach. Chin. Geogr. Sci. 2009, 19, 349–356. [Google Scholar] [CrossRef] [Green Version]
  16. Shen, D.; Jiao, L.L.; Chang, Y.; Hu, Y.M.; Wang, T.Y. Ecosystem health assessment of Yellow Sea and Bohai coastal areas. Chin. J. Ecol. 2015, 34, 2362–2372. [Google Scholar]
  17. Bebianno, M.; Pereira, C.G.; Rey, F.; Cravo, A.; Duarte, D.; D’Errico, G.; Regoli, F. Integrated approach to assess ecosystem health in harbor areas. Sci. Total Environ. 2015, 514, 92–107. [Google Scholar] [CrossRef] [PubMed]
  18. Sun, T.; Lin, W.; Chen, G.; Guo, P.; Ying, Z. Wetland ecosystem health assessment through integrating remote sensing and in-ventory data with an assessment model for the Hangzhou Bay, China. Sci. Total Environ. 2016, 566–567, 627–640. [Google Scholar] [CrossRef] [PubMed]
  19. United Nations. Transforming Our World: The 2030 Agenda for Sustainable Development; United Nations: New York, NY, USA, 2015. [Google Scholar]
  20. Sachs, J.; Schmidt-Traub, G.; Kroll, C.; Lafortune, G.; Fuller, G.; Woelm, F. The Sustainable Development Goals and COVID-19, Sustainable Development Report 2020; Cambridge University Press: Cambridge, UK, 2020. [Google Scholar]
  21. He, Y.; Shao, C.F.; Zhou, H.L.; Gao, J.L. An analysis of the transition of “scarcity types” from the perspective of sustainable de-velopment. China Popul. Resour. Environ. 2020, 30, 38–44. (In Chinese) [Google Scholar]
  22. Shen, W.; Zheng, Z.; Qin, Y.; Li, Y. Spatiotemporal characteristics and driving force of ecosystem health in an important ecolog-ical function region in China. Int. J. Environ. Res. Public Health 2020, 17, 5075. [Google Scholar] [CrossRef]
  23. Meng, L.; Huang, J.; Dong, J. Assessment of rural ecosystem health and type classification in Jiangsu province, China. Sci. Total Environ. 2018, 615, 1218–1228. [Google Scholar] [CrossRef]
  24. Shen, C.; Shi, H.; Zheng, W.; Ding, D. Spatial heterogeneity of ecosystem health and its sensitivity to pressure in the waters of nearshore archipelago. Ecol. Indic. 2016, 61, 822–832. [Google Scholar] [CrossRef]
  25. Lu, Y.; Wang, R.; Zhang, Y.; Su, H.; Wang, P.; Jenkins, A.; Ferrier, R.C.; Bailey, M.; Squire, G. Ecosystem health towards sustainability. Ecosyst. Health Sustain. 2015, 1, 1–15. [Google Scholar] [CrossRef]
  26. Allen, E. Forest Health Assessment in Canada. Ecosyst. Health 2001, 7, 28–34. [Google Scholar] [CrossRef]
  27. Hu, M.; Sarwar, S.; Li, Z. Spatio-Temporal Differentiation Mode and Threshold Effect of Yangtze River Delta Urban Ecological Well-Being Performance Based on Network DEA. Sustainability 2021, 13, 4550. [Google Scholar] [CrossRef]
  28. Niu, W.Y. The three elements of the connotation of sustainable development theory. Bull. Chin. Acad. Sci. 2014, 29, 410–415. (In Chinese) [Google Scholar]
  29. United Nations Development Programme (UNDP). Human Development Report 2020; UNDP: New York, NY, USA, 2021. [Google Scholar]
  30. Qiao, C.; Wang, Y.; Li, C.-H.; Yan, B.-Q. Application of Extension Theory Based on Improved Entropy Weight Method to Rock Slope Analysis in Cold Regions. Geotech. Geol. Eng. 2021, 39, 4315–4327. [Google Scholar] [CrossRef]
  31. Xiao, Y.; Wang, J.; Huang, H. Does economic development bring more livability? Evidence from Jiangsu Province, China. J. Clean. Prod. 2021, 293, 126187. [Google Scholar]
  32. Ji, Y.; Huang, G.H.; Sun, W. Risk assessment of hydropower stations through an integrated fuzzy entropy-weight multiple cri-teria decision making method: A case study of the Xiangxi River. Expert Syst. Appl. 2015, 42, 5380–5389. [Google Scholar] [CrossRef]
  33. Xiao, R.; Liu, Y.; Fei, X.; Yu, W.; Zhang, Z.; Meng, Q. Ecosystem health assessment: A comprehensive and detailed analysis of the case study in coastal metropolitan region, eastern China. Ecol. Indic. 2019, 98, 363–376. [Google Scholar] [CrossRef]
  34. Yuan, C.; Wei, Z.; Shi, H.; Sun, J.; Fu, Z. Spatial heterogeneity of estuarine wetland ecosystem health influenced by complex nat-ural and anthropogenic factors. Sci. Total. Environ. 2018, 634, 1445–1462. [Google Scholar]
  35. Zhang, N.; Dou, S.Q.; Xu, Y.; Jing, J.L.; Zhang, H.B. Temporal-spatial changes of ecosystem health in Guangxi in the past 14 years. J. Guilin Univ. Technol. 2021, 41, 370–378. (In Chinese) [Google Scholar]
  36. Liu, D.; Hao, S. Ecosystem Health Assessment at County-Scale Using the Pressure-State-Response Framework on the Loess Plateau, China. Int. J. Environ. Res. Public Health 2016, 14, 2. [Google Scholar] [CrossRef] [Green Version]
  37. Shi, J.K.; Shao, C.F.; Ju, M.T. On the evaluation index system of the environmental risk rank for the petrochemical industry. J. Saf. Environ. 2015, 15, 324–330. (In Chinese) [Google Scholar]
Figure 1. Logical framework of ecosystem health.
Ijerph 18 10569 g001
Figure 2. The hierarchical scheme of EHI and PEHI.
Ijerph 18 10569 g002
Figure 3. Trends in China’s ecosystem health index and subindexes, 2013–2019.
Ijerph 18 10569 g003
Figure 4. Distribution of EHI and subindexes in 30 provinces. (a) EHI; (b) SPI; (c) EDI; (d) NEI.
Ijerph 18 10569 g004aIjerph 18 10569 g004b
Figure 5. Spatial distribution of ecosystem health classifications in 30 provinces, 2019.
Ijerph 18 10569 g005
Figure 6. P, EHI, and PEHI of 30 provinces, 2019.
Ijerph 18 10569 g006
Table 1. Index system of ecosystem health based on SDGs.
SubindexNo.IndicatorsIndicator
Character
Benchmark
Social progressA1Urbanization rateSDG11
A2Average educational year+SDG4
A3Life expectancy in the population+SDG3
A4Urban registered unemployment rateSDG8
A5Town Engel coefficientSDG1
A6Rural Engel coefficientSDG1
A7Gini coefficientSDG10
A8Per capita household consumption expenditure+SDG8
A9Number of medical practitioners (assistants) per 1000 peopleSDG3
Economic developmentB1Fixed capital stock per capita+/
B2Per capita GDP growth rate+SDG8
B3Per capita disposable income+SDG8
B4Proportion of secondary industry in GDP+SDG9
B5Proportion of tertiary industry in GDP+SDG9
B6Proportion of R&D expenditure in GDP of the region+SDG9
Natural environmentResource endowmentC1Per capita reserves of energy resources+SDG7
C2Per capita water resources+SDG6
C3Per capita cultivated area+/
C4Per capita forest stock+SDG15
C5Per capita wetland area+SDG15
Ecological environmentC6Proportion of investment in ecological and environmental protection in GDP+SDG6, SDG15
C7Forest coverage rate+SDG15
C8Proportion of protected natural area in area under jurisdiction+SDG15
C9The surface water reaches or is better than the proportion of class ⅲ water body+SDG6
C10Proportion of days with good air quality+SDG11
C11Comprehensive utilization rate of industrial solid waste+SDG12
C12Intensity of fertilizer applicationSDG12
C13Intensity of pesticide applicationSDG12
PressureResource consumptionP1Elasticity coefficient of energy consumptionSDG7
P2Utilization rate of water resources developmentSDG6
P3Intensity of land developmentSDG12
Pollution emissionsP4Emission intensity of ammonia nitrogenSDG12
P5COD emission intensitySDG12
P6Nitrogen oxide emission intensitySDG12
P7SO2 emission intensitySDG12
P8Solid waste generated per unit of GDPSDG11
P9Greenhouse gas emission intensitySDG13
+, −, and ○ indicate positive, negative, and moderate indicators, respectively.
Table 2. Subsystem health classification.
Health LevelsScoreHealth Status
Level 10.7−1.0Healthy
Level 20.5−0.7Subhealthy
Level 30−0.5Disease
Table 3. Health classification when the social subsystem has a “healthy”, “subhealthy” and “disease” status.
Economic Subsystem Health LevelsNatural Subsystem Health Levels
HealthySubhealthyDisease
“healthy” status
HealthySocial–economic–natural healthSocial–economic healthNatural disease
SubhealthySocial–natural healthSocial healthNatural disease
DiseaseEconomic diseaseEconomic diseaseEconomic–natural disease
“subhealthy” status
HealthyEconomic–natural healthEconomic healthNatural disease
SubhealthyNatural healthSocial–economic–natural subhealthNatural disease
DiseaseEconomic diseaseEconomic diseaseEconomic–natural disease
“disease” status
HealthySocial diseaseSocial diseaseSocial–natural disease
SubhealthySocial diseaseSocial diseaseSocial–natural disease
DiseaseSocial–economic diseaseSocial–economic diseaseSocial–economic–natural disease
Table 4. EHIs of 30 provinces in China, 2013–2019.
Region2013201420152016201720182019Average Value
Beijing0.69400.67980.68510.70220.69350.69410.71160.6944
Tianjin0.66730.66750.66470.68200.66960.69270.68170.6751
Hebei0.53510.53150.54410.58010.59030.61260.61160.5722
Shanxi0.59350.58530.58930.60010.65410.64740.63500.6150
Inner Mongolia0.74110.74700.72970.73290.72700.77600.76080.7449
Liaoning0.67400.65000.63480.65320.68420.72130.69890.6738
Jilin0.68750.66850.66070.68940.67570.69020.70320.6822
Heilongjiang0.69540.69290.68370.70400.70360.71200.71050.7003
Shanghai0.66820.67590.67030.67840.66470.67790.70840.6777
Jiangsu0.64410.65940.67620.70830.71050.70190.70360.6863
Zhejiang0.66850.68690.70380.72310.70720.71380.75150.7078
Anhui0.59710.60540.60880.65030.65380.67130.69830.6407
Fujian0.65210.65830.66650.68000.69550.70370.72760.6834
Jiangxi0.61050.61780.61570.64120.64700.67530.71320.6458
Shandong0.60420.60900.61260.63430.64390.65870.64900.6302
Henan0.53680.55520.55310.58430.61430.61950.65080.5877
Hubei0.61850.64490.64870.69000.69610.72100.74620.6808
Hunan0.60400.61170.62410.63380.64430.66500.70120.6406
Guangdong0.63740.64500.65600.68310.68770.69930.72210.6758
Guangxi0.61270.61350.62440.63000.61450.65950.64730.6288
Hainan0.58670.60560.59940.61350.63480.65690.67760.6249
Chongqing0.63490.66040.65580.68580.69760.69500.74960.6827
Sichuan0.64270.64740.64390.67110.69900.71020.74450.6798
Guizhou0.63030.65160.65540.65790.68640.68540.71270.6685
Yunnan0.63320.61400.61960.64350.66870.66880.71580.6519
Shaanxi0.66740.66860.64870.67960.71390.72420.72510.6896
Gansu0.63270.62210.59910.62950.62520.66860.65460.6331
Qinghai0.69560.69820.69510.71840.71000.74200.74430.7148
Ningxia0.62940.63210.64580.66520.67160.67700.66850.6557
Xinjiang0.68860.68960.67020.68890.74270.75230.76270.7136
National0.63950.64370.64280.66450.67420.68980.70290.6653
Table 5. P for 30 provinces, 2013–2019.
Region2013201420152016201720182019
Beijing0.78030.78200.78210.78230.78270.78230.7834
Tianjin0.73950.77440.78110.78230.78270.76850.7780
Hebei0.60120.63500.55310.78330.79350.79690.7983
Shanxi0.42550.45150.46310.62980.66100.67160.6492
Inner Mongolia0.63750.64900.66220.77780.71610.65000.7397
Liaoning0.73330.67730.70480.82550.79870.79470.7206
Jilin0.76980.76820.78670.93340.93170.93630.9247
Heilongjiang0.65280.65770.66230.88300.89170.90250.9004
Shanghai0.77610.78200.78210.78230.78270.78230.7834
Jiangsu0.75880.77620.78660.80940.78410.78470.7835
Zhejiang0.88640.90540.91780.93250.92320.92040.9271
Anhui0.67270.74720.77480.90520.89840.90310.8740
Fujian0.84080.82410.91520.96820.94940.93750.9414
Jiangxi0.70130.73790.79090.91890.94120.93920.9533
Shandong0.75080.73780.75190.79570.80570.83900.7859
Henan0.65030.72730.75050.86920.88960.86960.8324
Hubei0.78840.82460.86090.95300.94450.92960.9122
Hunan0.77070.81090.83760.97190.96980.95950.9700
Guangdong0.87570.88280.89090.92080.90930.91650.9100
Guangxi0.76500.79880.84180.95390.96210.95380.8582
Hainan0.75520.73720.71290.96800.92790.91110.9021
Chongqing0.82430.83900.88620.96020.96190.94100.9285
Sichuan0.81180.83840.86320.97230.97250.97430.9739
Guizhou0.57600.70010.76840.88720.90540.91010.9262
Yunnan0.67780.77090.80710.90390.93390.93630.9318
Shaanxi0.77310.79060.79050.89410.91480.91280.8634
Gansu0.56270.59190.56100.82540.80570.85180.8993
Qinghai0.54540.61450.68480.83270.84210.83030.8510
Ningxia0.26860.29330.21900.58920.51020.52540.5281
Xinjiang0.33520.38910.52590.71520.70430.81110.7733
National0.69020.71720.73720.85760.85320.85470.8468
Publisher’s Note: MDPI stays neutral with regard to jurisdictional claims in published maps and institutional affiliations.

