
Work Task Association with Lead Urine and Blood Concentrations in Informal Electronic Waste Recyclers in Thailand and Chile

 , , , ,
Abstract
:1. Introduction
2. Materials and Methods
2.1. Study Population and Design
2.2. Survey
2.3. Urine and Blood Pb Sampling
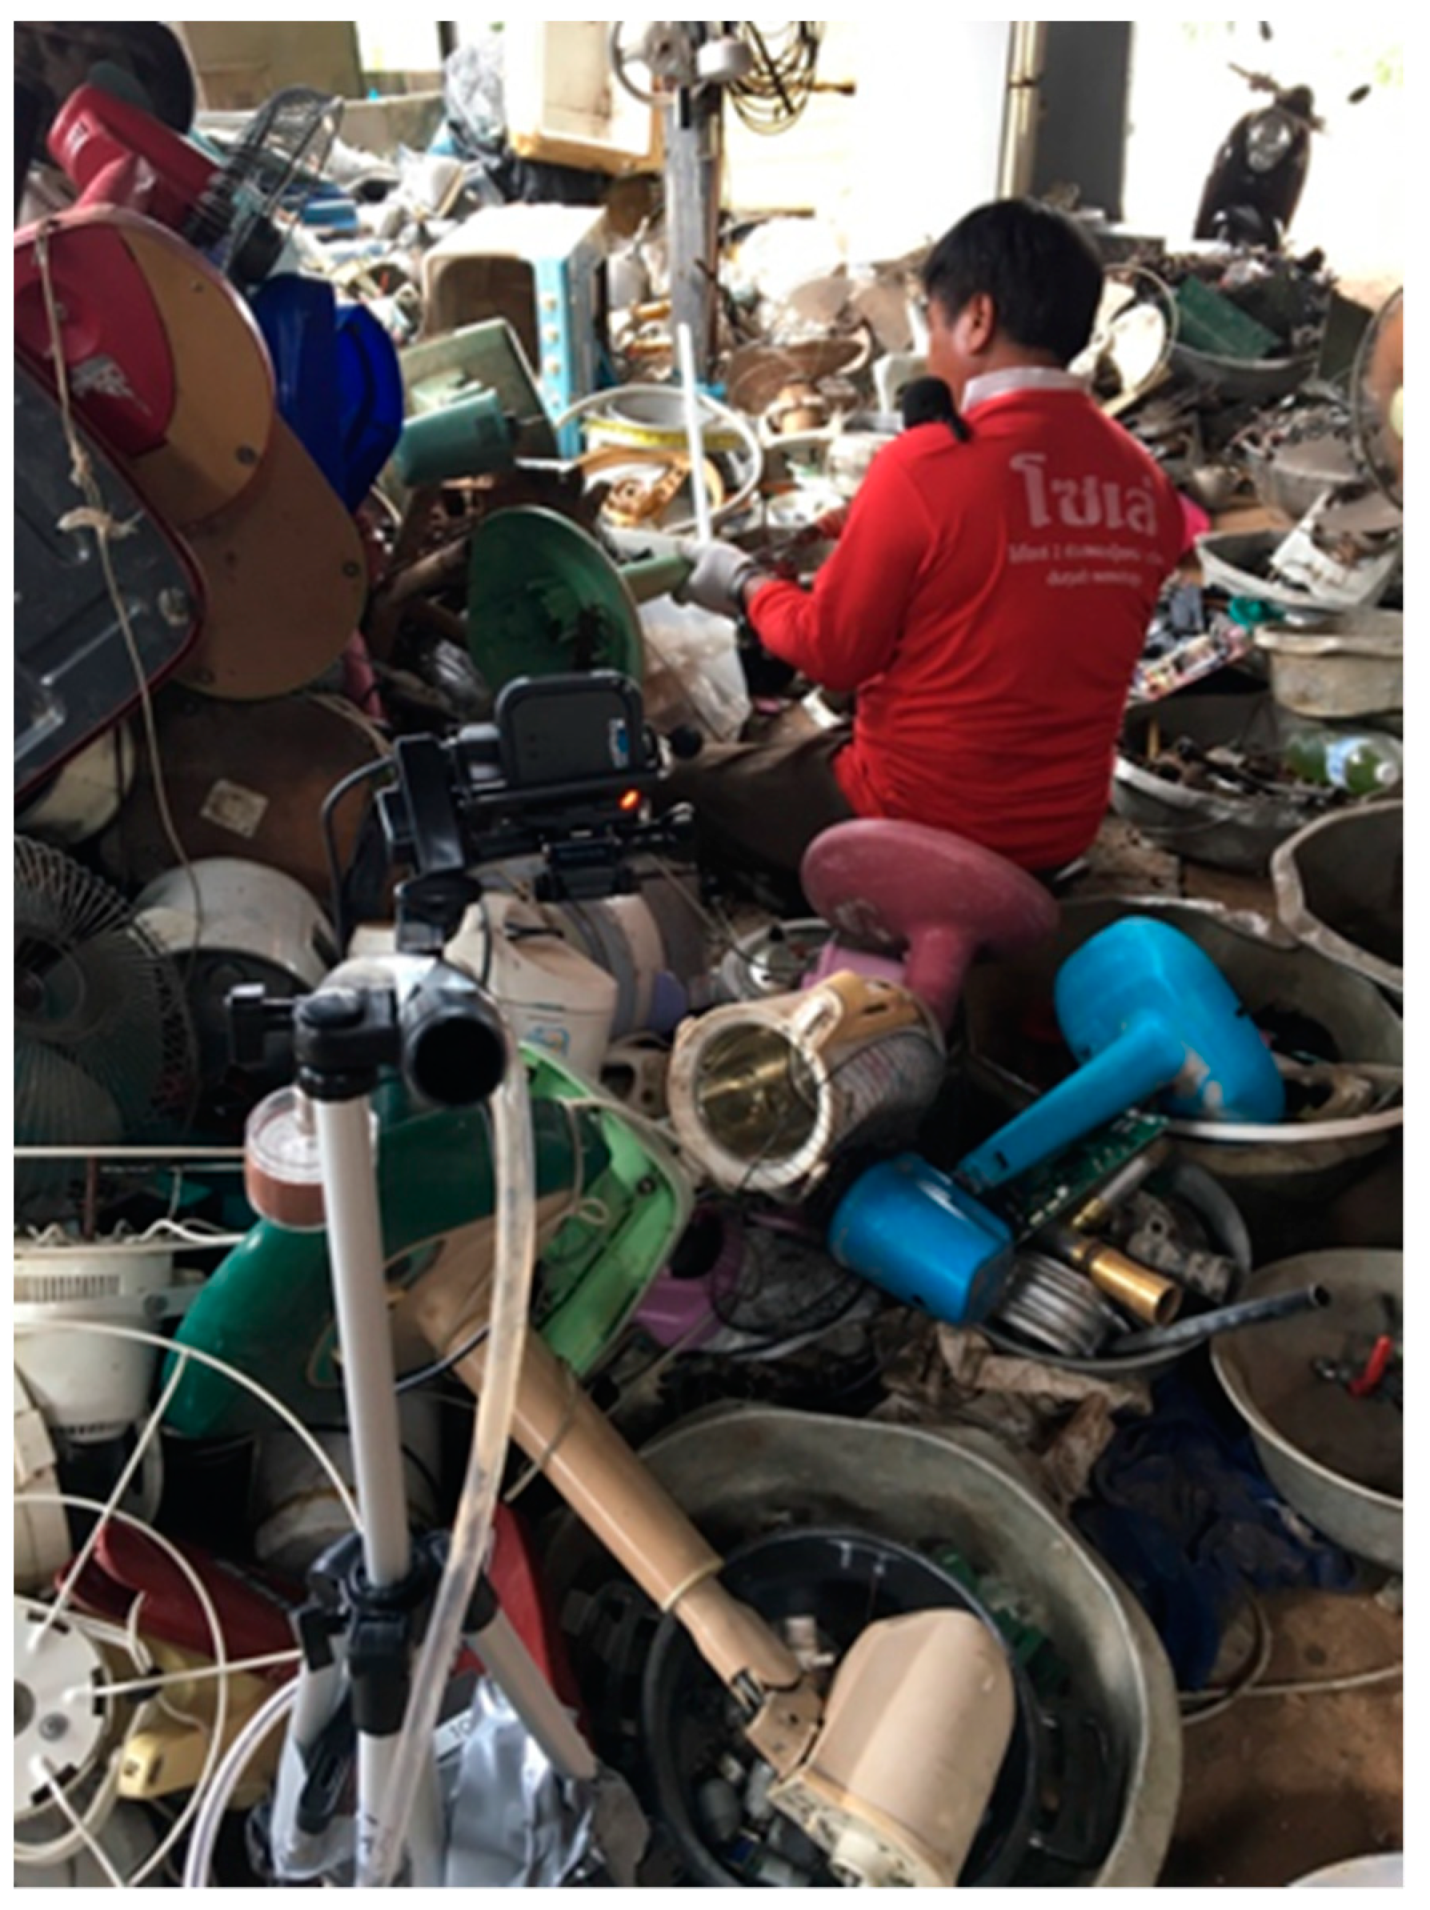
2.4. Video Data
2.5. Statistical Analysis
3. Results
3.1. Demographics
3.2. Video Participants
3.3. Boosted Regression Trees
4. Discussion
4.1. Summary
4.2. Implications
4.3. Limitations
5. Conclusions
Supplementary Materials
Author Contributions
Funding
Institutional Review Board Statement
Informed Consent Statement
Data Availability Statement
Acknowledgments
Conflicts of Interest
References
- Wang, F.; Huisman, J.; Meskers, C.E.M.; Schluep, M.; Stevels, A.; Hagelüken, C. The Best-of-2-Worlds philosophy: Developing local dismantling and global infrastructure network for sustainable e-waste treatment in emerging economies. Waste Manag. 2012, 32, 2134–2146. [Google Scholar] [CrossRef] [PubMed]
- Torres, D.; Guzmán, S.; Kuehr, R.; Magalini, F.; Devia, L.; Cueva, A.; Herbeck, E.; Kern, M.; Rovira, S.; Drisse, M.N.; et al. Sustainable Management of Waste Electrical and Electronic Equipment in Latin America. ITU, Secretariat of the Basel Convention, UNESCO, UNIDO, UNU, WIPO, BCRC-South America, ECLAC. 2016. Available online: https://www.uncclearn.org/sites/default/files/inventory/integrated_weee_management_and_disposal-395429-normal-e.pdf (accessed on 16 July 2021).
- Forti, V.; Baldé, C.P.; Kuehr, R.; Bel, G. The Global E-Waste Monitor 2020. 2020. Available online: http://ewastemonitor.info/ (accessed on 16 July 2021).
- Robinson, B.H. E-waste: An assessment of global production and environmental impacts. Sci. Total Environ. 2009, 408, 183–191. [Google Scholar] [CrossRef]
- Heacock, M.; Kelly, C.B.; Asante, K.A.; Birnbaum, L.S.; Bergman, Å.L.; Bruné, M.N.; Buka, I.; Carpenter, D.O.; Chen, A.; Huo, X.; et al. E-waste and harm to vulnerable populations: A growing global problem. Environ. Health Perspect. 2016, 124, 550–555. [Google Scholar] [CrossRef] [PubMed]
- Honda, S.; Sinha Khetriwal, D.; Kuehr, R. Regional E-Waste Monitor East and Southeast Asia. 2016. Available online: http://ewastemonitor.info/pdf/Regional-E-Waste-Monitor.pdf (accessed on 16 July 2021).
- International Labour Office. Universal Health-Care Coverage Scheme; International Labour Office: Geneva, Switzerland, 2001. [Google Scholar]
- Aguilera, X.; Castillo-Laborde, C.; Ferrari MNDe Delgado, I.; Ibañez, C. Monitoring and Evaluating Progress towards Universal Health Coverage in Chile. PLoS Med. 2014, 11, 9–11. [Google Scholar] [CrossRef] [PubMed] [Green Version]
- Ohajinwa, C.M.; van Bodegom, P.M.; Vijver, M.G.; Olumide, A.O.; Osibanjo, O.; Peijnenburg, W.J.G.M. Prevalence and injury patterns among electronic waste workers in the informal sector in Nigeria. Inj. Prev. 2017. [Google Scholar] [CrossRef] [PubMed]
- Wong, C.S.C.; Duzgoren-Aydin, N.S.; Aydin, A.; Wong, M.H. Evidence of excessive releases of metals from primitive e-waste processing in Guiyu, China. Environ. Pollut. 2007, 148, 62–72. [Google Scholar] [CrossRef]
- Ceballos, D.M.; Dong, Z. The formal electronic recycling industry: Challenges and opportunities in occupational and environmental health research. Environ. Int. 2016, 95, 157–166. [Google Scholar] [CrossRef] [Green Version]
- Okeme, J.O.; Arrandale, V.H. Electronic Waste Recycling: Occupational Exposures and Work-Related Health Effects. Curr. Environ. Health Rep. 2019, 6, 256–268. [Google Scholar] [CrossRef]
- Ádám, B.; Göen, T.; Scheepers, P.T.; Adliene, D.; Batinic, B.; Budnik, L.T.; Duca, R.C.; Ghosh, M.; Giurgiu, D.I.; Godderis, L.; et al. From inequitable to sustainable e-waste processing for reduction of impact on human health and the environment. Environ. Res. 2021, 194, 110728. [Google Scholar] [CrossRef]
- Lau, W.K.Y.; Liang, P.; Man, Y.B.; Chung, S.S.; Wong, M.H. Human health risk assessment based on trace metals in suspended air particulates, surface dust, and floor dust from e-waste recycling workshops in Hong Kong, China. Environ. Sci. Pollut Res. 2014, 21, 3813–3825. [Google Scholar] [CrossRef]
- California Department of Public Health. Electronic Waste Recycling Fee; California Department of Public Health: Sacramento, CA, USA, 2012. [Google Scholar]
- Yohannessen, K.; Pinto-Galleguillos, D.; Parra-Giordano, D.; Agost, A.; Valdés, M.; Smith, L.M.; Galen, K.; Arain, A.; Rojas, F.; Neitzel, R.L.; et al. Health Assessment of Electronic Waste Workers in Chile: Participant Characterization. Int. J. Environ. Res. Public Health 2019, 16, 386. [Google Scholar] [CrossRef] [PubMed] [Green Version]
- Seith, R.; Arain, A.L.; Nambunmee, K.; Adar, S.D.; Neitzel, R.L. Self-reported health and metal body burden in an electronic waste recycling community in Northeastern Thailand. J. Occup. Environ. Med. 2019, 61, 905–909. [Google Scholar] [CrossRef] [PubMed]
- Neitzel, R.L.; Sayler, S.K.; Arain, A.L.; Nambunmee, K. Metal levels, genetic instability, and renal markers in electronic waste workers in Thailand. Int. J. Occup. Environ. Med. 2020, 11, 72–84. [Google Scholar] [CrossRef] [PubMed] [Green Version]
- World Bank. Gini Index (World Bank Estimate)—Thailand. Available online: https://data.worldbank.org/indicator/SI.POV.GINI?locations=TH (accessed on 23 July 2021).
- Babel, S.; Ta, A.T.; Habarakada Liyanage, T.U. Current Situation and Challenges of Waste Management in Thailand. In Sustainable Waste Management Challenges in Developing Countries; IGI Global: Hershey, PA, USA, 2019; pp. 409–440. [Google Scholar]
- Notification of Ministry of Commerce, Subject: Import Prohibition of Electronic Wastes, B.E. 2563. 2020. Available online: https://www.sealandmaersk.com/~/media_sc9/sealandmaersk/local-information/files/asia/taiwan/overview/import-prohibition-of-electronic-waste-thailand.pdf (accessed on 16 July 2021).
- National Statistics Institute 2017 Census Results. Available online: http://www.censo2017.cl (accessed on 16 July 2021).
- World Bank. Gini Index (World Bank Estimate)—Chile. Available online: https://data.worldbank.org/indicator/SI.POV.GINI?locations=CL (accessed on 23 July 2021).
- Magalini, F.; Kuehr, R.; Baldé, C.P. eWaste en América Latina. 2015. Available online: https://www.gsma.com/latinamerica/wp-content/uploads/2015/11/gsma-unu-ewaste2015-spa.pdf (accessed on 16 July 2021).
- Arain, A.L. Environmental Health Impacts of Information Electronic Waste Recycling; University of Michigan: Ann Arbor, MI, USA, 2019. [Google Scholar]
- Succop, P.A.; Clark, S.; Chen, M.; Galke, W. Imputation of Data Values That are Less Than a Detection Limit. J. Occup. Environ. Hyg. 2004, 1, 436–441. [Google Scholar] [CrossRef] [PubMed]
- Friedman, J.; Tibshirani, R.; Hastie, T. Additive logistic regression: A statistical view of boosting (With discussion and a rejoinder by the authors). Ann. Stat. 2000, 28, 337–407. [Google Scholar] [CrossRef]
- Elith, J.; Leathwick, J.R.; Hastie, T. A working guide to boosted regression trees. J. Anim. Ecol. 2008, 77, 802–813. [Google Scholar] [CrossRef]
- Friedman, J.H.; Meulman, J.J. Multiple additive regression trees with application in epidemiology. Stat. Med. 2003, 22, 1365–1381. [Google Scholar] [CrossRef]
- Lampa, E.; Lind, L.; Lind, P.M.; Bornefalk-Hermansson, A. The identification of complex interactions in epidemiology and toxicology: A simulation study of boosted regression trees. Environ. Heal. A Glob. Access. Sci. Source 2014, 13, 1–17. [Google Scholar] [CrossRef] [Green Version]
- Mansiaux, Y.; Carrat, F. Detection of independent associations in a large epidemiologic dataset: A comparison of random forests, boosted regression trees, conventional and penalized logistic regression for identifying independent factors associated with H1N1pdm influenza infections. BMC Med. Res. Methodol. 2014, 14, 1–10. [Google Scholar]
- Burns, K.N.; Sayler, S.K.; Neitzel, R.L. Stress, health, noise exposures, and injuries among electronic waste recycling workers in Ghana. J. Occup. Med. Toxicol. 2019, 14, 1–11. [Google Scholar] [CrossRef]
- Amankwaa, E.F.; Adovor Tsikudo, K.A.; Bowman, J. ‘Away’ is a place: The impact of electronic waste recycling on blood lead levels in Ghana. Sci. Total Environ. 2017, 601–602, 1566–1574. [Google Scholar] [CrossRef] [PubMed]
- Srigboh, R.K.; Basu, N.; Stephens, J.; Asampong, E.; Perkins, M.; Neitzel, R.L.; Fobil, J. Multiple elemental exposures amongst workers at the Agbogbloshie electronic waste (e-waste) site in Ghana. Chemosphere 2016, 164, 68–74. [Google Scholar] [CrossRef] [Green Version]
- Wittsiepe, J.; Feldt, T.; Till, H.; Burchard, G.; Wilhelm, M.; Fobil, J.N. Pilot study on the internal exposure to heavy metals of informal-level electronic waste workers in Agbogbloshie, Accra, Ghana. Environ. Sci. Pollut. Res. 2017, 24, 3097–3107. [Google Scholar] [CrossRef] [PubMed]
- David, G.C. Ergonomic methods for assessing exposure to risk factors for work-related musculoskeletal disorders. Occup. Med. 2005, 55, 190–199. [Google Scholar] [CrossRef] [PubMed] [Green Version]
- Juul-Kristensen, B.; Hansson, G.-Å.; Fallentin, N.; Andersen, J.H.; Ekdahl, C. Assessment of work postures and movements using a video-based observation method and direct technical measurements. Appl. Ergon. 2001, 32, 517–524. [Google Scholar] [CrossRef]
- Spielholz, P.; Silverstein, B.; Morgan, M.; Checkoway, H.; Kaufman, J. Comparison of self-report, video observation and direct measurement methods for upper extremity musculoskeletal disorder physical risk factors. Ergonomics 2001, 44, 588–613. [Google Scholar] [CrossRef]
- Cocca, P.; Marciano, F.; Alberti, M. Video surveillance systems to enhance occupational safety: A case study. Saf. Sci. 2016, 84, 140–148. [Google Scholar] [CrossRef]
- Xu, F.; McGlothlin, J.D. Video exposure assessments of solvent exposures in university pharmaceutical laboratories—A pilot study. Chem. Health Saf. 2003, 10, 23–28. [Google Scholar] [CrossRef]
- McGlothlin, J.D.; Xu, F.; Cole, S.S.; Huizen, D. Real-time assessment of air contaminants using video exposure monitoring (VEM) methods and techniques. In Patty’s Industrial Hygiene, 6th ed.; Harris, R., Ed.; John Wiley and Son: Chichester, UK; West Sussex, UK, 2001. [Google Scholar]


| Variables | Thailand | Chile | ||||
|---|---|---|---|---|---|---|
| N | Mean (sd) | Median (Max) | N | Mean (sd) | Median (Max) | |
| Body mass index (BMI; kg/m2) ‡ | 69 | 24.9 (4.2) | 24.2 (39.0) | 93 | 30.1 (5.4) | 29.3 (57.6) |
| Residence time (years) ‡ | 123 | 41.7 (15.6) | 43 (84) | 93 | 14.4 (15.1) | 8.0 (63.5) |
| Time in E-waste (years) | - | - | - | 92 | 12.4 (11.81) | 10.00 (42.0) |
| Age (years) | 129 | 46.4 (12.5) | 46 (84) | 93 | 46.8 (14.3) | 46 (87) |
| N | n (%) | N | n (%) | |||
| Sex (male) † | 130 | 71 (54.6%) | 93 | 68 (73.1%) | ||
| Marital-Single ‡ | 130 | 9 (6.9%) | 87 | 19 (21.8%) | ||
| - Married | 115 (88.5%) | 58 (66.7%) | ||||
| - Divorced | 2 (1.5%) | 1 (1.1%) | ||||
| - Cohabitating | 0 (0%) | 3 (3.4%) | ||||
| - Widowing | 4 (3.1%) | 3 (3.4%) | ||||
| - Separated | 0 (0%) | 3 (3.4%) | ||||
| Education-None | 127 | 7 (5.5%) | 93 | 7 (7.4%) | ||
| - Primary | 57 (44.9%) | 30 (32.3%) | ||||
| - Secondary | 48 (37.8%) | 41 (44.1%) | ||||
| - Some college | 15 (11.8%) | 15 (16.1%) | ||||
| Employed by business (Yes) * | 130 | 90 (69.2%) | 93 | 90 (96.8%) | ||
| Income > Min. Wage * | 129 | 49 (38%) | 87 | 55 (63.2%) | ||
| E-waste job (Primary) | 130 | 72 (55.4%) | 50 | 34 (68.0%) | ||
| Data | Sample Type | Thailand | Chile | ||||
|---|---|---|---|---|---|---|---|
| N | Mean (sd) | Median (Max) | N | Mean (sd) | Median (Max) | ||
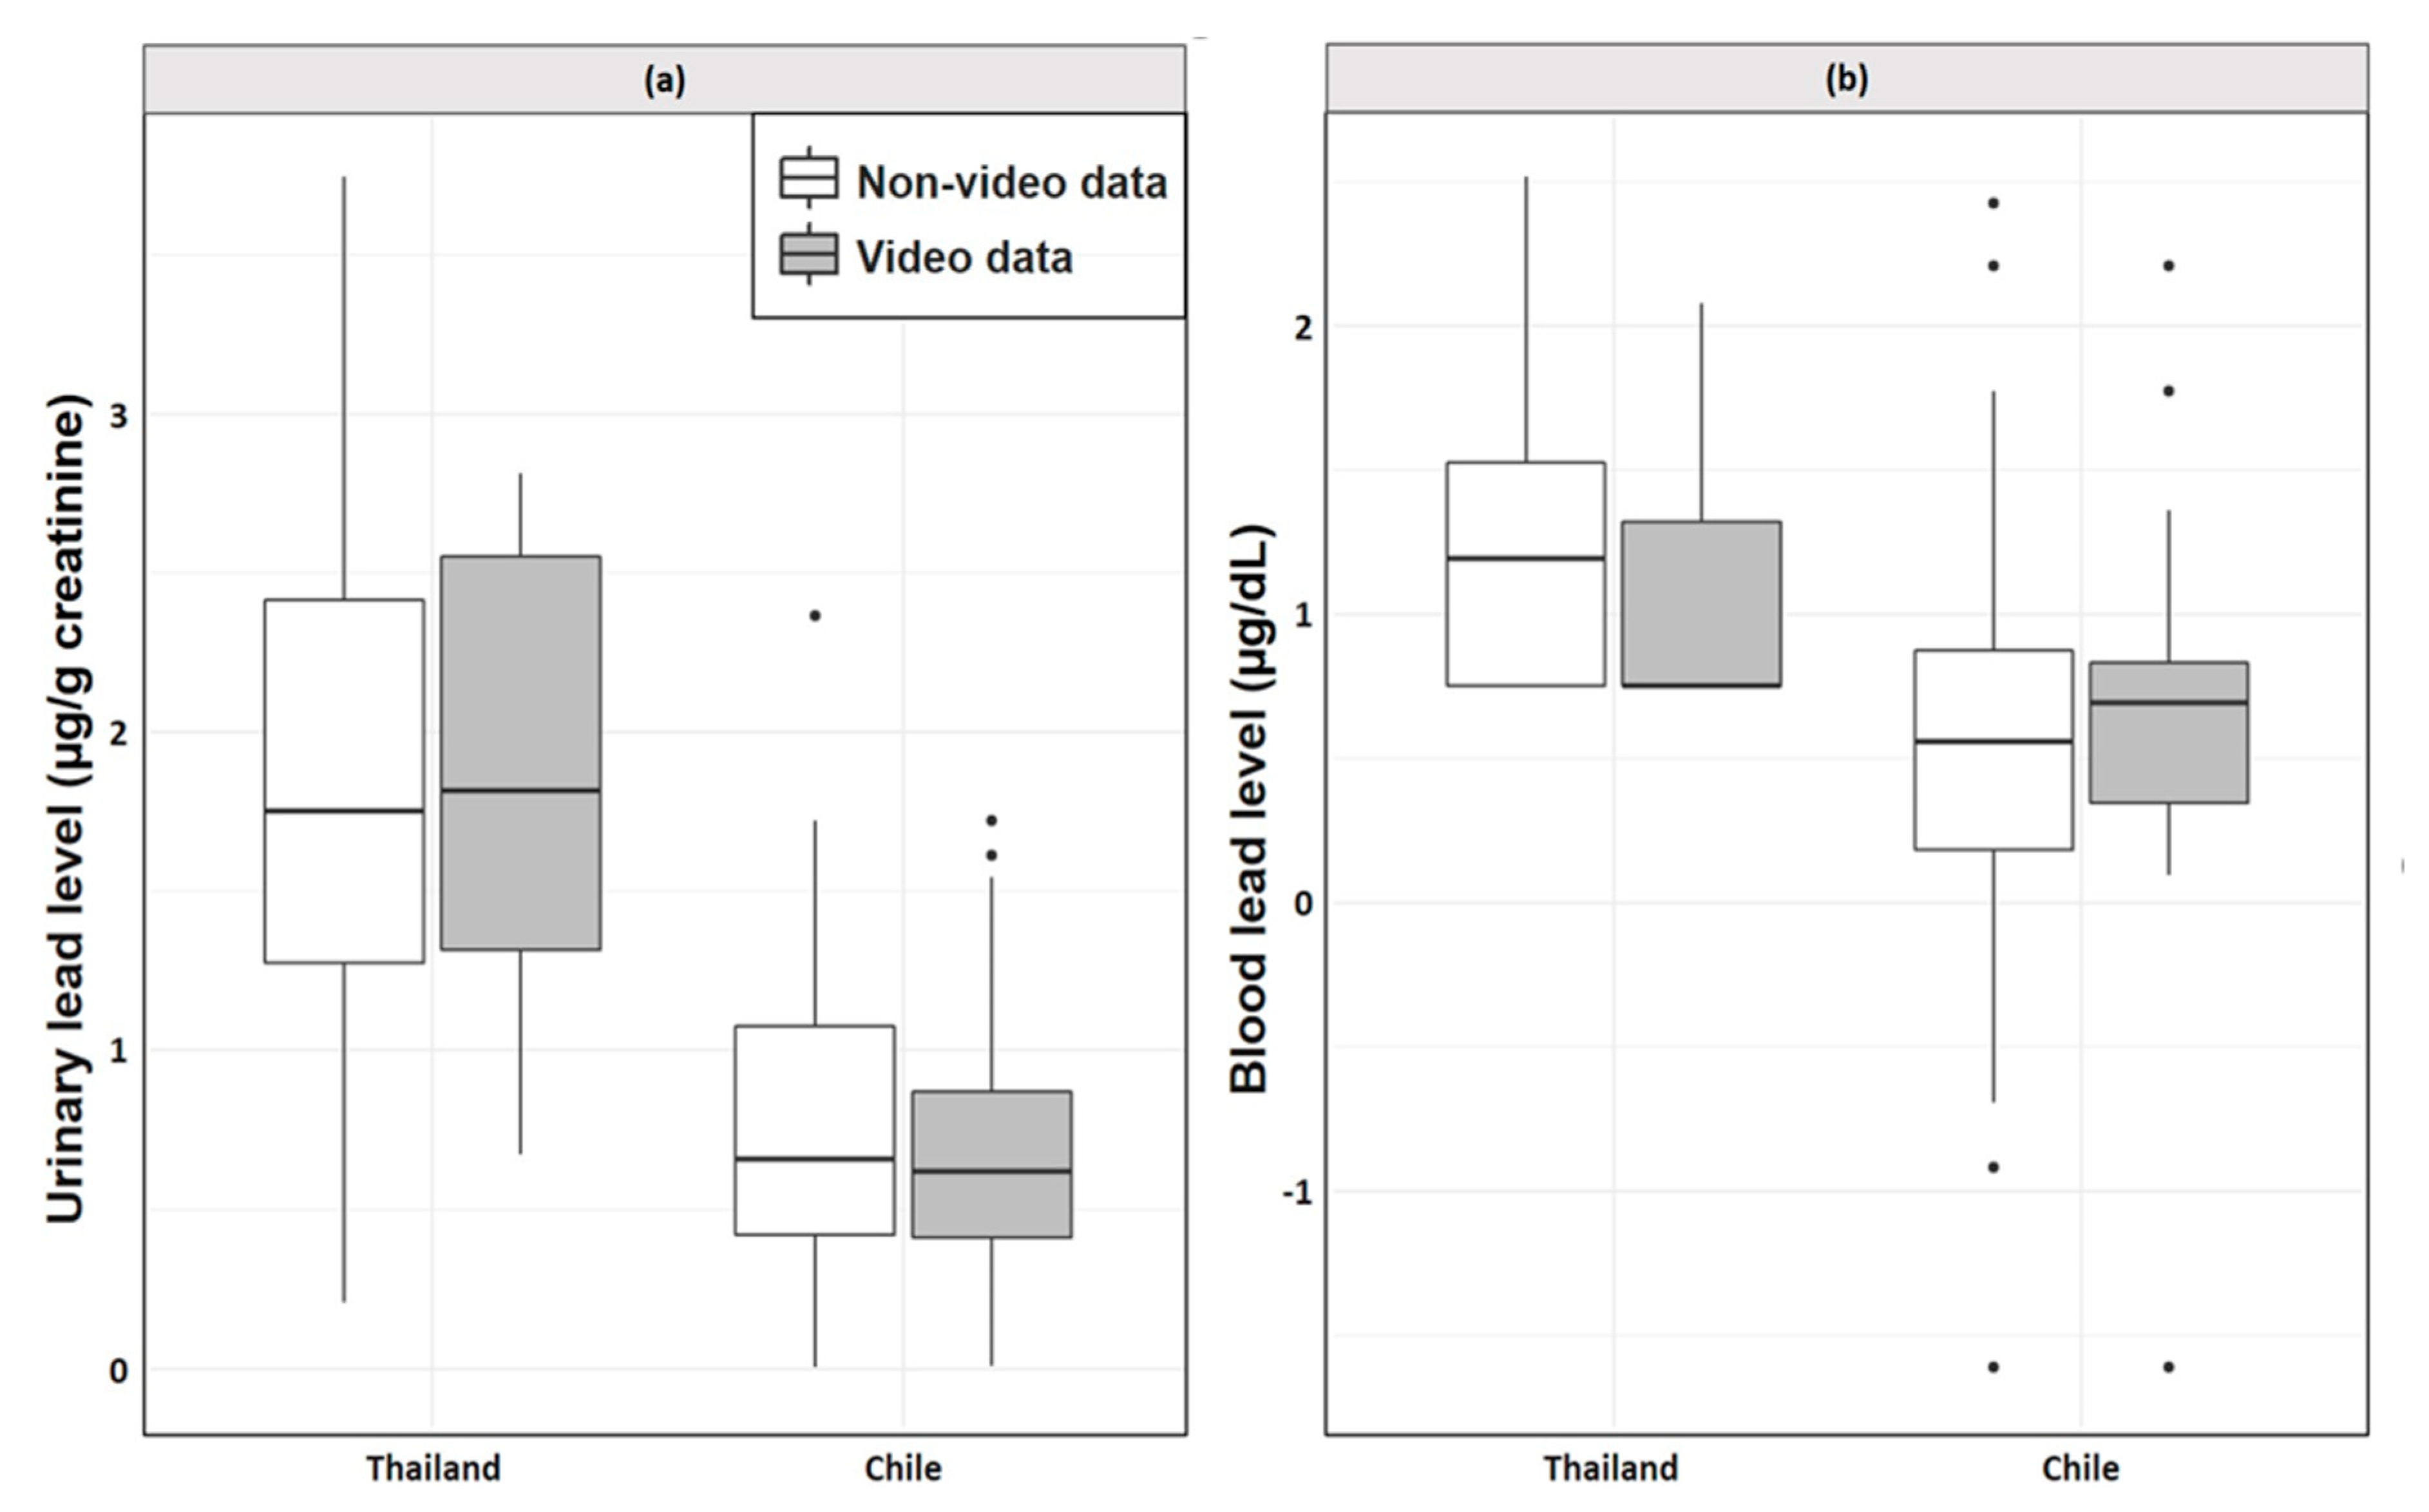
| Full data | Blood lead levels (µg/dL) † | 105 | 3.79 (1.99) | 3.3 (12.4) | 82 | 2.17 (1.71) | 1.75 (11.3) |
| Log-transformed † | 105 | 1.22 (0.46) | 1.2 (2.5) | 82 | 0.54 (0.71) | 0.56 (2.42) | |
| Urine lead levels (µg/g creatinine) † | 105 | 7.45 (7.36) | 4.77 (41.3) | 86 | 1.41 (1.48) | 0.93 (9.67) | |
| Log-transformed † | 105 | 1.83 (0.77) | 1.75 (3.75) | 86 | 0.74 (0.51) | 0.66 (2.37) | |
| Video data | Blood lead levels (µg/dL) | 19 | 3.11 (1.54) | 2.12 (8) | 21 | 2.44 (1.92) | 2 (9.1) |
| Log-transformed * | 19 | 1.05 (0.4) | 0.75 (2.08) | 21 | 0.66 (0.73) | 0.69 (2.21) | |
| Urine lead levels (µg/g creatinine) † | 19 | 7.37 (5.07) | 5.15 (15.67) | 21 | 1.34 (1.35) | 0.86 (4.6) | |
| Log-transformed † | 19 | 1.92 (0.69) | 1.82 (2.81) | 21 | 0.72 (0.51) | 0.62 (1.72) | |
| Variables | Thailand (N = 19) | Chile (N = 21) | ||||
|---|---|---|---|---|---|---|
| N | Mean (sd) | Median (Max) | N | Mean (sd) | Median (Max) | |
| Age | 45.3 (7.9) | 46 (60) | 50.8 (11.1) | 51 (67) | ||
| Hours worked † | 40.7 (13) | 40 (56) | 53.6 (13.8) | 50 (86) | ||
| Residence Time ‡ | 18 | 37.9 (15.2) | 42 (60) | 12.8 (16) | 7.3 (63.5) | |
| n (%) | n (%) | |||||
| Education | 18 | |||||
| None | 3 (15.8) | 1 (4.8) | ||||
| Primary | 5 (26.3) | 7 (33.3) | ||||
| Secondary | 7 (36.8) | 8 (38.1) | ||||
| Some college | 3 (15.8) | 5 (23.8) | ||||
| Employed by business (Yes) * | 12 (63.2) | 21 (100) | ||||
| Income > minimum wage | 7 (36.8) | 14 (66.7) | ||||
| Sex (Male) | 9 (47.7) | 17 (81) | ||||
| Variables | Thailand (N = 19) | Chile (N = 21) | ||||
|---|---|---|---|---|---|---|
| N | Mean (sd) | Median (Max) | N | Mean (sd) | Median (Max) | |
| Mechanical § | ||||||
| Sharp Blade | 0.06 (0.12) | 0 (0.4) | 0.01 (0.05) | 0 (0.2) | ||
| Blunt striking instrument‡ | 0.88 (0.55) | 1 (2) | 0.13 (0.44) | 0 (2) | ||
| T-wrench * | 0.09 (0.16) | 0 (0.5) | 0 (0) | 0 (0) | ||
| Wrench | 0.03 (0.05) | 0 (0.1) | 0.02 (0.06) | 0 (0.2) | ||
| Pliers/scissors † | 0.32 (0.29) | 0.3 (0.8) | 0.07 (0.13) | 0 (0.4) | ||
| Bolt Cutters | 0.01 (0.05) | 0 (0.2) | 0 (0) | 0 (0) | ||
| Chisel | 0.19 (0.34) | 0 (1) | 0.06 (0.27) | 0 (1.25) | ||
| Screwdriver | 0.17 (0.22) | 0.1 (0.8) | 0.23 (0.31) | 0.2 (0.12) | ||
| Power drill * | 0.23 (0.33) | 0 (0.8) | 0.02 (0.11) | 0 (0.5) | ||
| Musculoskeletal § | ||||||
| Bending back ‡ | 1.89 (0.61) | 1.9 (3) | 0.93 (0.71) | 0.9 (2.4) | ||
| Bending neck | 1.5 (1.05) | 1.8 (3) | 1.06 (1) | 0.8 (3) | ||
| Lifting < 20 lbs. | 0.41 (0.59) | 0 (2) | 0.44 (0.59) | 0.3 (2.58) | ||
| Lifting > 20 lbs. | 0.59 (0.69) | 0 (2) | 0.42 (0.58) | 0.2 (2.25) | ||
| Pushing/pulling | 0.03 (0.08) | 0 (3) | 0.11 (0.2) | 0 (0.8) | ||
| Repetitive arm motion † | 0.50 (0.64) | 0.2 (2) | 0.05 (0.1) | 0 (0.4) | ||
| Repetitive hand motion | 0.56 (0.79) | 0.2 (2.4) | 0.19 (0.38) | 0 (1.6) | ||
| Squatting/kneeling * | 0.82 (1.22) | 0.1 (3) | 0.12 (0.26) | 0 (0.9) | ||
| Sitting low to ground ‡ | 1.79 (1.34) | 2.6 (3) | 0.01 (0.05) | 0 (0.2) | ||
| Chemicals § | ||||||
| Use of Chemical | 0.01 (0.03) | 0 (0.1) | 0 (0.02) | 0 (0.1) | ||
| Potential for Lacerations § | ||||||
| Working near broken glass * | 0.52 (1.04) | 0 (3) | 0.01 (0.07) | 0 (0.3) | ||
| Working near sharp metal | 0.81 (1.33) | 0 (3) | 0.47 (0.81) | 0 (2.4) | ||
| Handling sharp metal | 0.15 (0.35) | 0 (1) | 0.04 (0.1) | 0 (0.3) | ||
| PPE § | ||||||
| Cotton gloves ‡ | 2 (1.4) | 2.9 (3) | 0.33 (0.79) | 0 (3) | ||
| Close toed shoes † | 18 | 1.37 (1.46) | 0.6 (3) | 20 | 2.52 (0.91) | 3 (3) |
| Rubber Gloves | 0.44 (1.05) | 0 (3) | 20 | 0.3 (0.79) | 0 (3) | |
| Fabric as mask | 0.27 (0.81) | 0 (2.7) | 0 (0) | 0 (0) | ||
| Dusk mask | 0.16 (0.69) | 0 (3) | 0 (0) | 0 (0) | ||
| Long pants | 2.31 (1.23) | 3 (3) | 2.64 (0.66) | 3 (3) | ||
| Electronics || | ||||||
| TV - CRT | 0 (0) | 0 (0) | 0.04 (0.15) | 0 (0.67) | ||
| Washing machine | 0.05 (0.23) | 0 (1) | 0.02 (0.05) | 0 (0.2) | ||
| Electric Fan * | 0.29 (0.45) | 0 (1) | 0 (0) | 0 (0) | ||
| Desktop Monitor - CRT | 0.01 (0.02) | 0 (0.1) | 0.01 (0.03) | 0 (0.1) | ||
| Computer Tower | 0.01 (0.03) | 0 (0.1) | 0.01 (0.04) | 0 (0.2) | ||
| Cellphone | 0 (0) | 0 (0) | 0.05 (0.22) | 0 (1) | ||
| Laptop | 0 (0) | 0 (0) | 0.04 (0.17) | 0 (0.8) | ||
| Printed circuit board | 0 (0) | 0 (0) | 0.06 (0.15) | 0 (0.6) | ||
| Parts † | 0.81 (0.36) | 1 (1) | (0.37) | 0.3 (1) | ||
Publisher’s Note: MDPI stays neutral with regard to jurisdictional claims in published maps and institutional affiliations. |
© 2021 by the authors. Licensee MDPI, Basel, Switzerland. This article is an open access article distributed under the terms and conditions of the Creative Commons Attribution (CC BY) license (https://creativecommons.org/licenses/by/4.0/).
Share and Cite
Shkembi, A.; Nambunmee, K.; Jindaphong, S.; Parra-Giordano, D.; Yohannessen, K.; Ruiz-Rudolph, P.; Neitzel, R.L.; Arain, A. Work Task Association with Lead Urine and Blood Concentrations in Informal Electronic Waste Recyclers in Thailand and Chile. Int. J. Environ. Res. Public Health 2021, 18, 10580. https://doi.org/10.3390/ijerph182010580
Shkembi A, Nambunmee K, Jindaphong S, Parra-Giordano D, Yohannessen K, Ruiz-Rudolph P, Neitzel RL, Arain A. Work Task Association with Lead Urine and Blood Concentrations in Informal Electronic Waste Recyclers in Thailand and Chile. International Journal of Environmental Research and Public Health. 2021; 18(20):10580. https://doi.org/10.3390/ijerph182010580
Chicago/Turabian StyleShkembi, Abas, Kowit Nambunmee, Siripond Jindaphong, Denisse Parra-Giordano, Karla Yohannessen, Pablo Ruiz-Rudolph, Richard L. Neitzel, and Aubrey Arain. 2021. "Work Task Association with Lead Urine and Blood Concentrations in Informal Electronic Waste Recyclers in Thailand and Chile" International Journal of Environmental Research and Public Health 18, no. 20: 10580. https://doi.org/10.3390/ijerph182010580