Abstract
The purpose of this research was to develop the 3 min incremental step-in-place (3MISP) test for predicting maximal oxygen uptake (O2max). A total of 205 adults (20–64 years) completed the 3MISP and O2max tests. Using age, gender, body composition (BC) including percent body fat (PBF) or body mass index (BMI), and with or without heart rate (HR) at the beginning of exercise (HR0) or difference between HR at the third minute during the exercise and the first minute post exercise (ΔHR3 − HR4) in the 3MISP test, six O2max prediction models were derived from multiple linear regression. Age (r = −0.239), gender (r = 0.430), BMI (r = −0.191), PBF (r = −0.706), HR0 (r = −0.516), and ΔHR3 − HR4 (r = 0.563) were significantly correlated to O2max. Among the six O2max prediction models, the PBF model∆HR3 − HR4 has the highest accuracy. The simplest models with age, gender, and PBF/BMI explained 54.5% of the O2max in the PBF modelBC and 39.8% of that in the BMI modelBC. The addition of HR0 and ∆HR3 − HR4 increases the variance of O2max explained by the PBF and BMI models∆HR3 − HR4 by 17.98% and 45.23%, respectively, while standard errors of estimate decrease by 10.73% and 15.61%. These data demonstrate that the models established using 3MISP-HR data can enhance the accuracy of O2max prediction.
1. Introduction
In the past, many scholars have devoted themselves to the analysis of aerobic capacity using the submaximal exercise intensity method [1,2,3]. With the public awareness of physical health increasing under the impact of novel coronavirus disease 2019 (COVID-19), at-home workouts have become a pandemic fitness trend. An easy-to-use and low-cost method for self-monitoring of cardiorespiratory fitness (CRF) level is essential for most people. CRF is a primary component of physical fitness [4,5]. The assessment of CRF may help individuals to identify their risk of cardiovascular disease, providing a basis for developing home workout plans, and it may be adopted as a clinical indicator to evaluate a patient’s functional status and treatment outcomes [6,7,8]. Maximal oxygen uptake (O2max) is a crucial factor in physical performance and health conditions. The plateau in O2, attained at exhaustion during the incremental O2max exercise test, represents the upper limit of CRF [9]. Direct measurement of O2max requires the participant to perform an exercise test on a treadmill or bicycle ergometer until exhaustion while being monitored with a gas exchange analyzer. However, this direct measurement of O2max relies on highly precise laboratory technology, expensive equipment, complicated operating procedures, intense physical exercise, and appropriate trained personnel to operate the test system. It is also a very time-consuming procedure. In addition, the measurement equipment is stationary, which limits the feasibility of home testing or wide application. Therefore, during the COVID-19 pandemic and increase in home workouts, it is essential to develop a method for indirect measurement of O2max suitable for home testing, which could contribute to the development of self-health management in the public.
Exercise tests are important clinical tools for evaluating CRF status and predicting future cardiovascular events [10]. Previous studies have developed various submaximal exercise tests, including the 6 minute walk test, 12 min walk test, Cooper 12 min run test, and the multistage 20 m shuttle run test. Based on the measured distance, speed, and other exercise data, as well as various physiological indicators of body composition, O2max prediction equations were established to assess CRF levels in adults [11,12,13]. These exercise tests were relatively simple, required little equipment, and entailed lower management costs. However, they required large testing spaces and long performance sessions, and they were easily influenced by weather. In addition, exercise commonly induces physiological stress, but these tests did not monitor physiological variables. As a result, it was difficult to identify whether the participant reached a state of willpower failure, which is prone to increasing the risk of sudden cardiac arrest in participants with low levels of physical fitness. This would also affect to some extent the effectiveness of O2max prediction equations and limit the feasibility of testing in home settings.
To overcome the time and space limitations in CRF field-based exercise tests, several researchers proposed the use of step-up tests to evaluate CRF levels in adults [14,15,16,17]. Based on the relationship between oxygen consumption in the human body and the post-exercise heart rate (HR) during recovery, they established the O2max prediction equation with a combination of demographic parameters (such as age-, gender-, and body-fat-related values) to access the CRF levels of participants, and the outcomes were considerable. The step-up test is one of the most commonly used indirect methods of measurement for estimating CRF [14,16,17]. This type of method requires little space, a short testing time, and no expensive equipment or professionals to operate it. However, some studies found that, during the step-up test, elderly adults and obese individuals were not able to satisfactorily complete the testing procedure at a standard intensity of exercise [6,18]. The step-up test is performed with a step-box with a height of 20–50 cm, so individual differences in fitness level could easily be ignored. For a participant who is overweight or has a knee injury, gait abnormality, or balance impairment, it may be difficult to complete the test.
The step-in-place test may be a suitable alternative to the step-up test. The step-in-place test requires less testing time, space, and equipment. Since it requires no step-box, it is safer than the step-up test. It is also easier to manage and perform in home settings. According to the step-in-place test protocol, the participant lifts the knees to a target height, defined as midway between his/her midpoint of the patella and iliac crest, while standing [2,19]. Currently, the step-in-place test is widely applied in the assessment of aerobic fitness in elderly people (aged 60–94 years), but few studies have examined CRF tests in younger adults. To enhance the safety, effectiveness, and universality of adult CRF tests, with selective and economic considerations, we aimed to develop the 3 min incremental step-in-place (3MISP) testing method and O2max prediction equations based on different situations. The main purposes of this research were to analyze the relationship between actual measured values of O2max and exercise HR during the 3MISP test and, along with anthropometric parameters, to establish the O2max prediction equation, as well as to verify and compare the validities of different O2max prediction models. In this research, we hypothesized that variation in exercise HR during the 3MISP test is a potential predictor of O2max. The O2max prediction equations, established using 3MISP-HR variables and combining age, gender, and percent body fat (PBF)/body mass index (BMI), can improve the accuracy of O2max prediction.
2. Materials and Methods
2.1. Study Design
In this research, the participants were required to complete 2 exercise tests: direct measurement of O2max and the 3MISP test. An electromagnetically braked bicycle ergometer (Excalibur Sport Ergometer, Lode BV, Groningen, The Netherlands) was used in combination with the Cardiopulmonary Exercise Testing System (Vmax Encore 29 System, VIASYS Healthcare Inc., Yorba Linda, CA, USA) to measure the O2max in both the training group and the testing group, while the Polar H10 Heart Rate Monitor with a chest strap (Polar Electro Oy, Espoo, Finland) was used to measure the HR of each participant during the 3MISP test. Due to the significant correlation between the variation in HR during exercise and measured O2max [2,3], HR was treated as a predictor of O2max to improve the accuracy of O2max prediction. With the measured data, this research established multiple linear regression equations based on the parameters of age, gender, PBF/BMI, and with or without 3MISP-HR to predict O2max. Subsequently, the predicted residual error sum of squares (PRESS) and constant error (CE) statistical methods were adopted separately to cross-validate these prediction equations. These study procedures were approved by the Institutional Review Board of the Industrial Technology Research Institute. Before beginning the experimental tests, informed consent forms were completed by the participants.
2.2. Participants
All the participants (Taiwanese adults) were recruited openly, independently, and randomly through public advertisements posted in public spaces. Participants with cardiovascular, pulmonary, or metabolic disorders, or muscular or bone diseases that could affect their completion of the exercise tests, were excluded. Finally, a total of 205 healthy adults (aged 20–64 years, 48.8% women and 51.2% men) completed this research project. The anthropometric and body composition parameters that were measured included height, body weight, BMI, and PBF. A body composition analyzer (InBody ® 570, Biospace, Inc., Seoul, Korea) was used for the measurements of body weight and PBF [20]. BMI was calculated as weight (in kilograms) divided by height (in meters) squared.
2.3. Maximal Oxygen Consumption
The O2max of each participant was measured with an electromagnetically braked bicycle ergometer and a cardiopulmonary exercise testing system. During the exercise test, the participant was required to wear a Polar H10 Hear Rate Monitor with a chest strap to monitor his/her HR and an appropriate gas-collecting mask (Hans Rudolph). The sampling tube and digital flow sensor connected to the mask were used to measure the tidal volume of each breath and the composition of O2 and CO2. The initial load at the beginning of the test on the bicycle ergometer was 25 W. The load was increased by 15 W every 2 min until the participant could not maintain the required pedaling rate of 70 rpm. Participants were then asked to rate their levels of physical fatigue on the Borg Rating of Perceived Exertion scale (RPE, scale range: 6–20 points). In the present research, O2max refers to the maximum average relative O2 value for 30 consecutive seconds. The O2max criteria were deemed to be met when the participants reached three of the following four requirements: (1) a plateau in O2 despite an increase in load; (2) respiratory exchange ratio ≥ 1.10; (3) maximum HR over 90% of the age-predicted maximum HR (i.e., 220 − age); and (4) RPE ≥ 18 [21].
2.4. MISP Test
Before the 3MISP test, the participant was required to wear a Polar H10 Hear Rate Monitor with a chest strap to monitor his/her HR during exercise. While wearing the HR monitor, the patient stood while the midway point between the participant’s patella and iliac crest was measured as the target height for lifting the knees and marked by colored tape. Once the test began, the participant was asked to match a rhythm produced by an electronic metronome while stepping in place, raising the knee to the marked height with each step. The 3MISP test started with 96 steps per minute (SPM), and the rate was increased by 24 SPM every 1 minute. If the participant was unable to maintain the rhythm, he/she could run instead of walking for up to 3 min. If the participant was unable to lift the knees to the required height or follow the rhythm for 30 s, then the test session was terminated and the results were eliminated from the analysis. For safety concerns, the participant had to maintain the step rate at 80 SPM for a cool-down period of 30 s before resting in a standing position. The recorded data contained the HR at the beginning of exercise (HR0); at the first (HR1), second (HR2), and third minutes (HR3) during the exercise; and at the first minute post exercise (HR4).
2.5. Statistical Analysis
All values are presented as mean ± standard deviation (SD). Multivariate analysis of variance was used to compare the differences in physical characteristics between the training and testing groups. The effect size was calculated to reflect the magnitude of between-group differences in the total values for various variables, using Cohen’s d [22].Pearson’s correlation coefficients were calculated to analyze the linear relationships between independent variables (i.e., age, gender, PBF, BMI, and 3MISP-HR) and the measured O2max of the training group, and the validity of O2max prediction models was also verified. For absolute values of the correlation coefficient (r), 0.00–0.10 is regarded as negligible, 0.10–0.39 as weak, 0.40–0.69 as moderate, 0.70–0.89 as strong, and 0.90–1.00 as very strong correlation [23]. Multiple linear regression analysis with cross-validation (70% of the samples were used for modeling, and 30% of the samples were used for verification) was applied to the development of O2max prediction models by using the variables of age, gender, PBF/BMI, and with or without 3MISP-HR. The multiple coefficient of determination (R2), the absolute SEE, and relative SEE (%SEE) were used for evaluating the accuracy of the O2max prediction equation, while the paired t-test was used to compare the difference between the measured O2max and estimated O2max in the training group. The PRESS and constant error (CE = ∑(Y − Ŷ)/N, where Y is measured O2max and Ŷ is estimated O2max) statistical methods were adopted separately to cross-validate the O2max prediction models [3,24]. According to the CRF classifications (O2max) from the American College of Sports Medicine’s guidelines for exercise testing and prescription, the entire sample was divided into the subgroups of gender, age, and O2max [21], and then the CEs were calculated to compare the differences between the measured and estimated O2max among these subgroups. Bland–Altman plots were applied to assess the agreement between the predicted and directly measured O2max values [25]. The statistical software SPSS (version 22, IBM Corp., Armonk, NY, USA) was used for statistical analysis. The significance level was set to p < 0.05.
3. Results
Table 1 presents the study population and the physical characteristics of all participants in the training and testing groups. The results of multivariate analysis of variance showed that there were no significant differences in age, height, body weight, BMI, PBF, HR0, or ΔHR3 − HR4 between the training and testing groups. Average O2max was higher in the training group than in the testing group.

Table 1.
Physical characteristics of the participants.
Table 2 presents the Pearson’s correlations between measured O2max and independent variables in the training group. The results showed that age (r = −0.239, p = 0.004), BMI (r = −0.191, p = 0.022), PBF (r = −0.706, p < 0.001), and HR0 (r = −0.516, p < 0.001) all had significant negative correlations with O2max, while gender (women = 0, men = 1) and ΔHR3 − HR4 both had positive correlations with O2max (gender: r = 0.430, p < 0.001; ΔHR3 − HR4: r = 0.563, p < 0.001).
Table 2.
Pearson correlation coefficients for the correlations between O2max and independent variables in the training group.
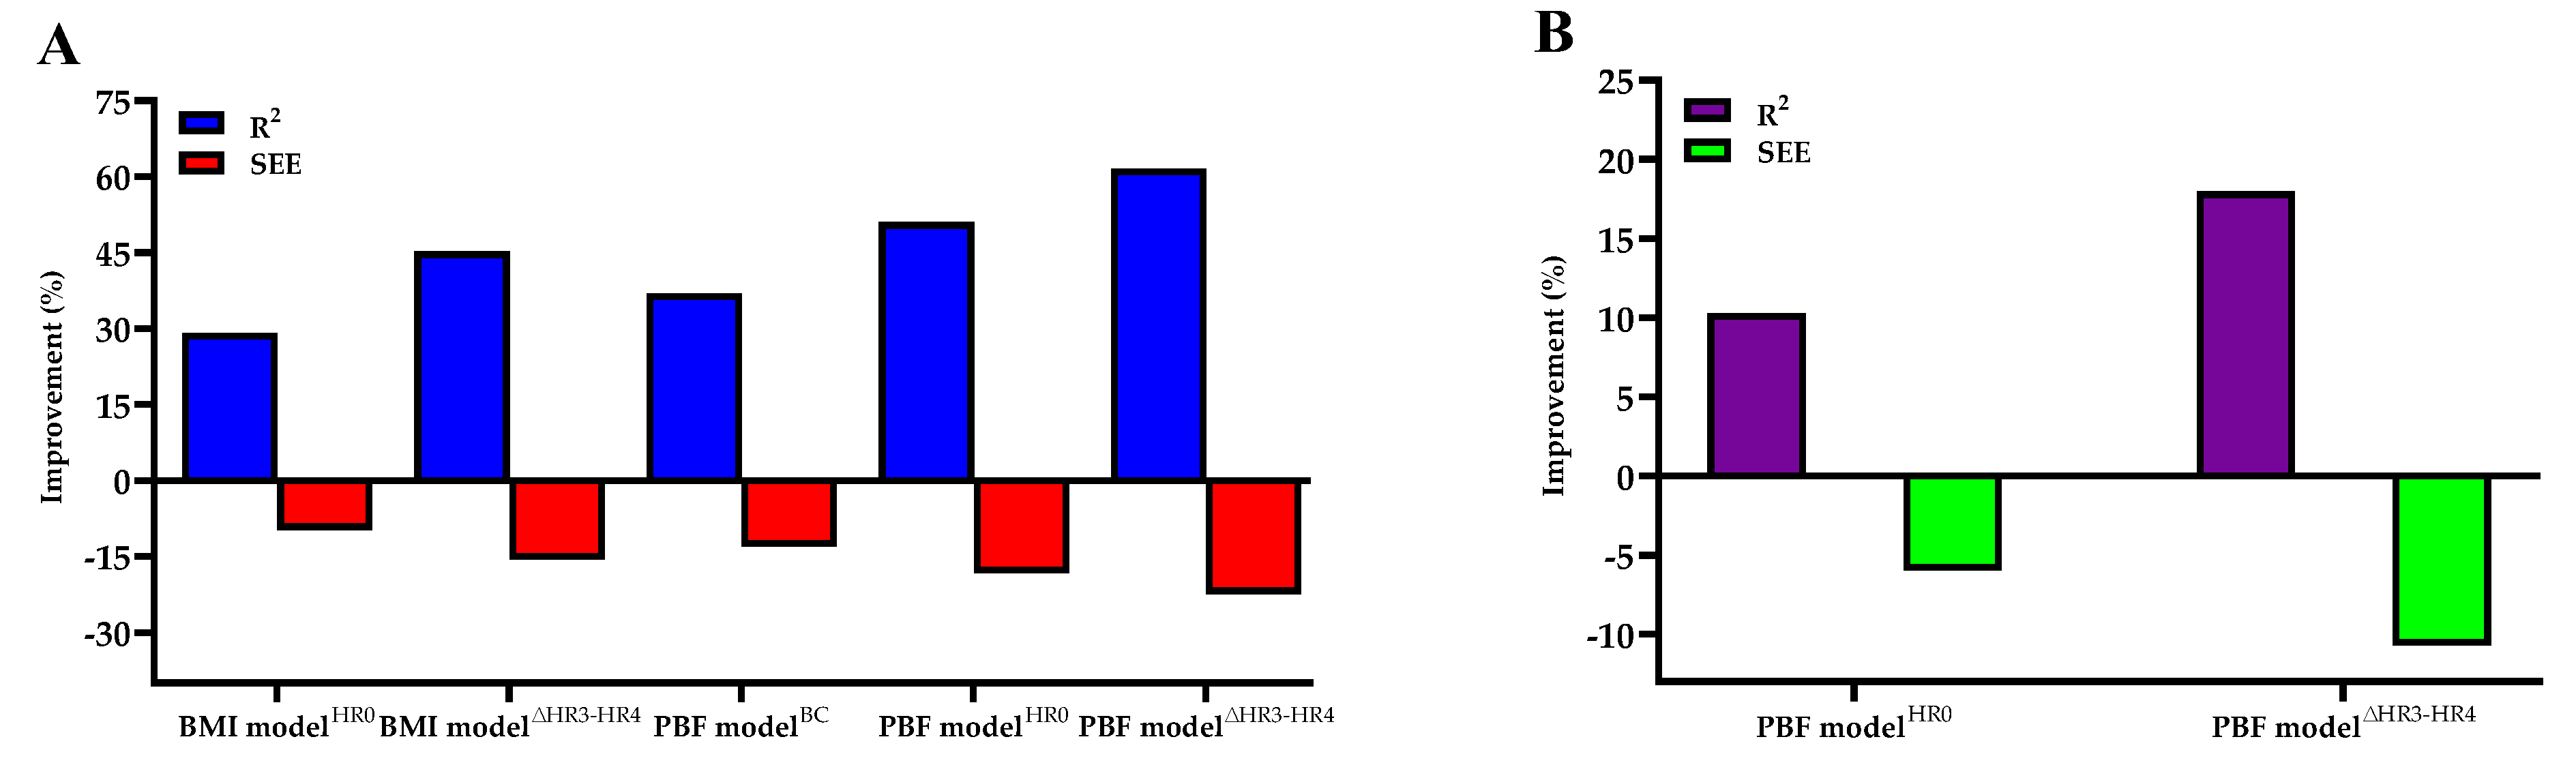
Table 3 lists the multiple regression models for predicting O2max and the results of cross-validation. Among the PBF and BMI models, the PBF model∆HR3−HR4 had the highest multivariate correlation and the lowest SEE value. When age, gender, and body composition were used to predict O2max, the addition of HR0 increased R2 from 0.545 to 0.601 and decreased the SEE from 4.7757 to 4.4905 mL·kg−1·min−1 in the PBF modelHR0, whereas in the BMI modelHR0, R2 increased from 0.398 to 0.514 and the SEE decreased from 5.4936 to 4.9564 mL·kg−1·min−1. Therefore, the variance of O2max explained by the PBF and BMI modelsHR0 increased by 10.28% and 29.15%, respectively, while the SEE decreased by 5.97% and 9.78%, respectively. The addition of HR0 and ∆HR3−HR4 increased the explained variance of O2max by 17.98% in the PBF model∆HR3 − HR4 and 45.23% in the BMI model∆HR3 − HR4, while the SEE decreased by 10.73% in the PBF model∆HR3 − HR4 and 15.61% in the BMI model∆HR3 − HR4 (see Figure 1). The cross-validation results of the PRESS method showed that the changes in R2 and SEE values of all O2max prediction models were minor (∆R2 < 0.014, ∆SEE < 0.2125 mL·kg−1·min−1).
Table 3.
Multiple regression models predicting O2max (mL·kg−1·min−1).

Figure 1.
(A) Percentage improvement in O2max prediction accuracy in the BMI modelHR0, BMI model∆HR3 − HR4, PBF modelBC, PBF modelHR0, and PBF model∆HR3 − HR4 as compared with the BMI modelBC. (B) Percentage improvement of O2max prediction accuracy in PBF modelHR0 and PBF model∆HR3−HR4 as compared with the PBF modelBC.
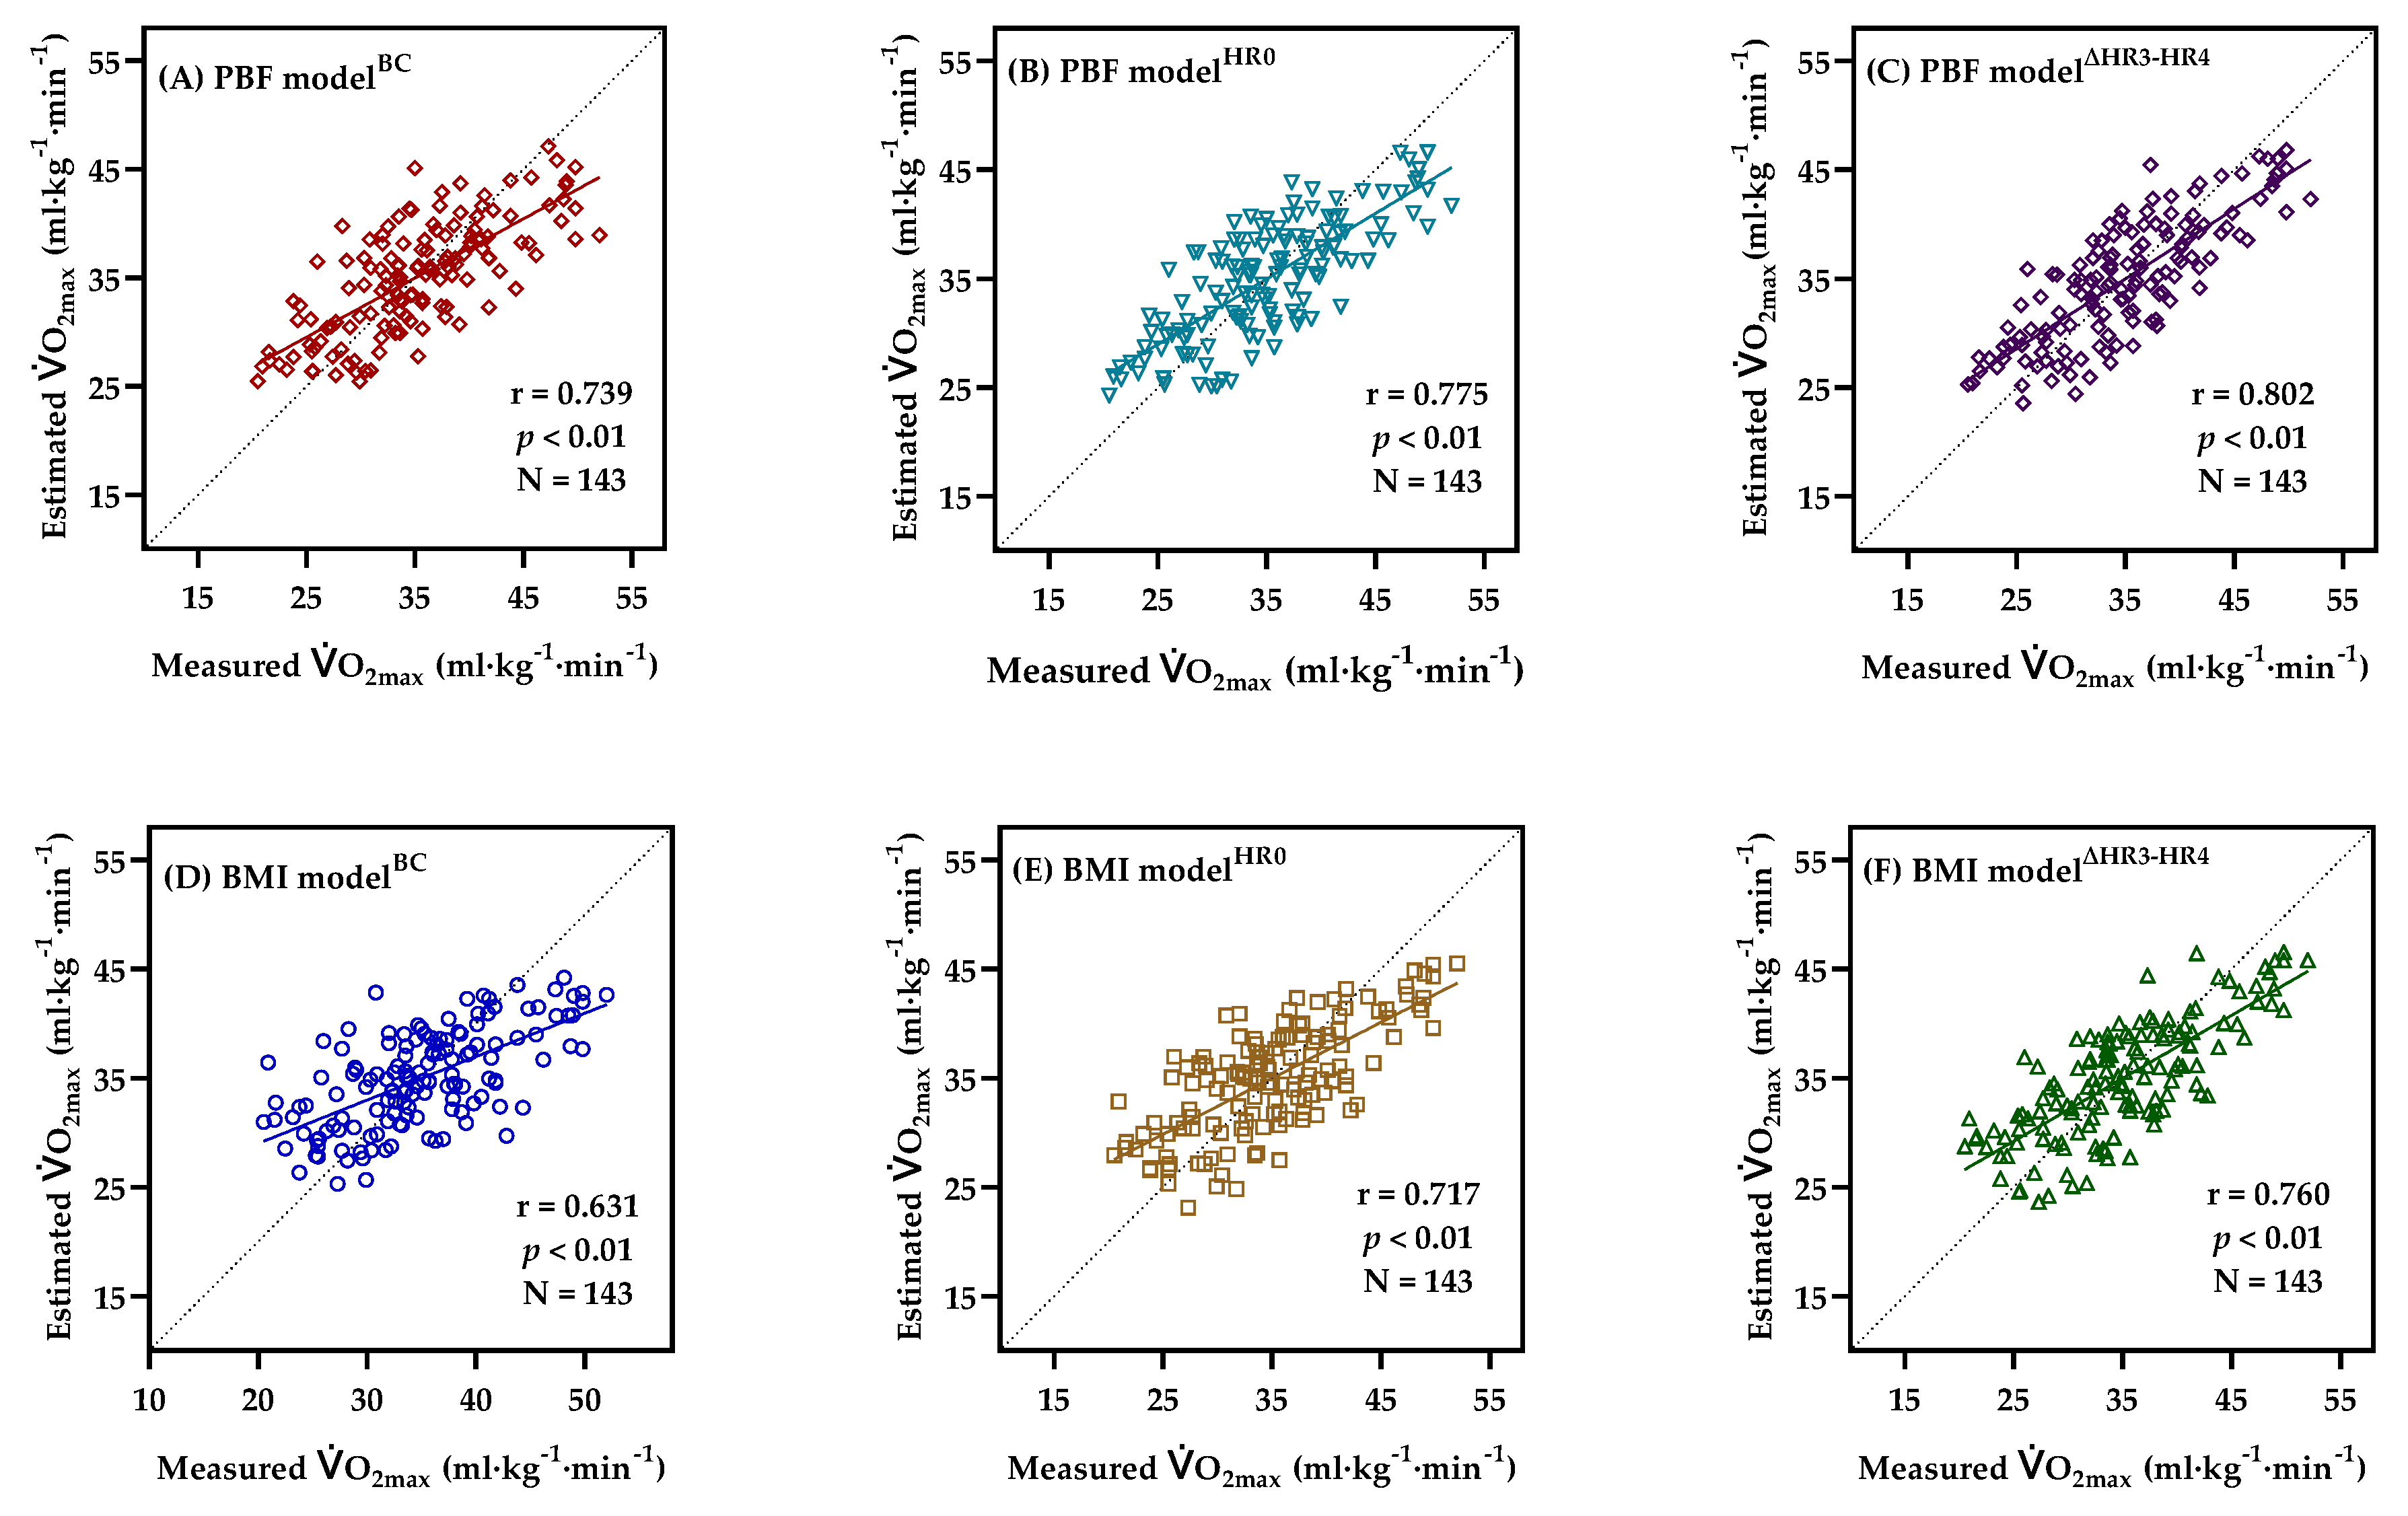
Figure 2 explains the correlation between the measured O2max and estimated O2max in the training group. There was no significant difference between the estimated O2max (PBF modelBC: 34.96 ± 5.18 mL·kg−1·min−1; BMI modelBC: 34.96 ± 4.42 mL·kg−1·min−1; PBF modelHR0: 34.96 ± 5.43 mL·kg−1·min−1; BMI modelHR0: 34.96 ± 5.02 mL·kg−1·min−1; PBF model∆HR3 − HR4: 34.96 ± 5.62 mL·kg−1·min−1; BMI model∆HR3 − HR4: 34.96 ± 5.33 mL·kg−1·min−1) and the measured O2max (34.96 ± 7.01 mL·kg−1·min−1).
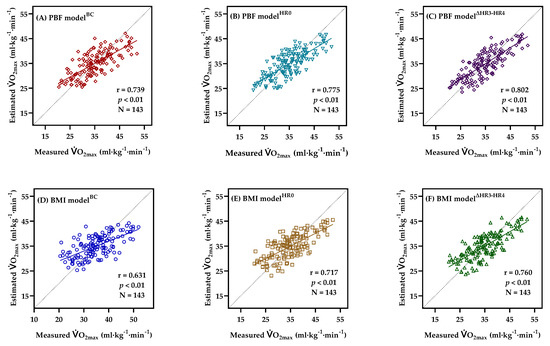
Figure 2.
Correlations between the measured and estimated O2max obtained from PBF modelBC (A), PBF modelHR0 (B), PBF model∆HR3 − HR4 (C), BMI modelBC (D), BMI modelHR0 (E), BMI model∆HR3 − HR4 (F), in the training group, showing the regression line and Pearson’s correlation coefficient.
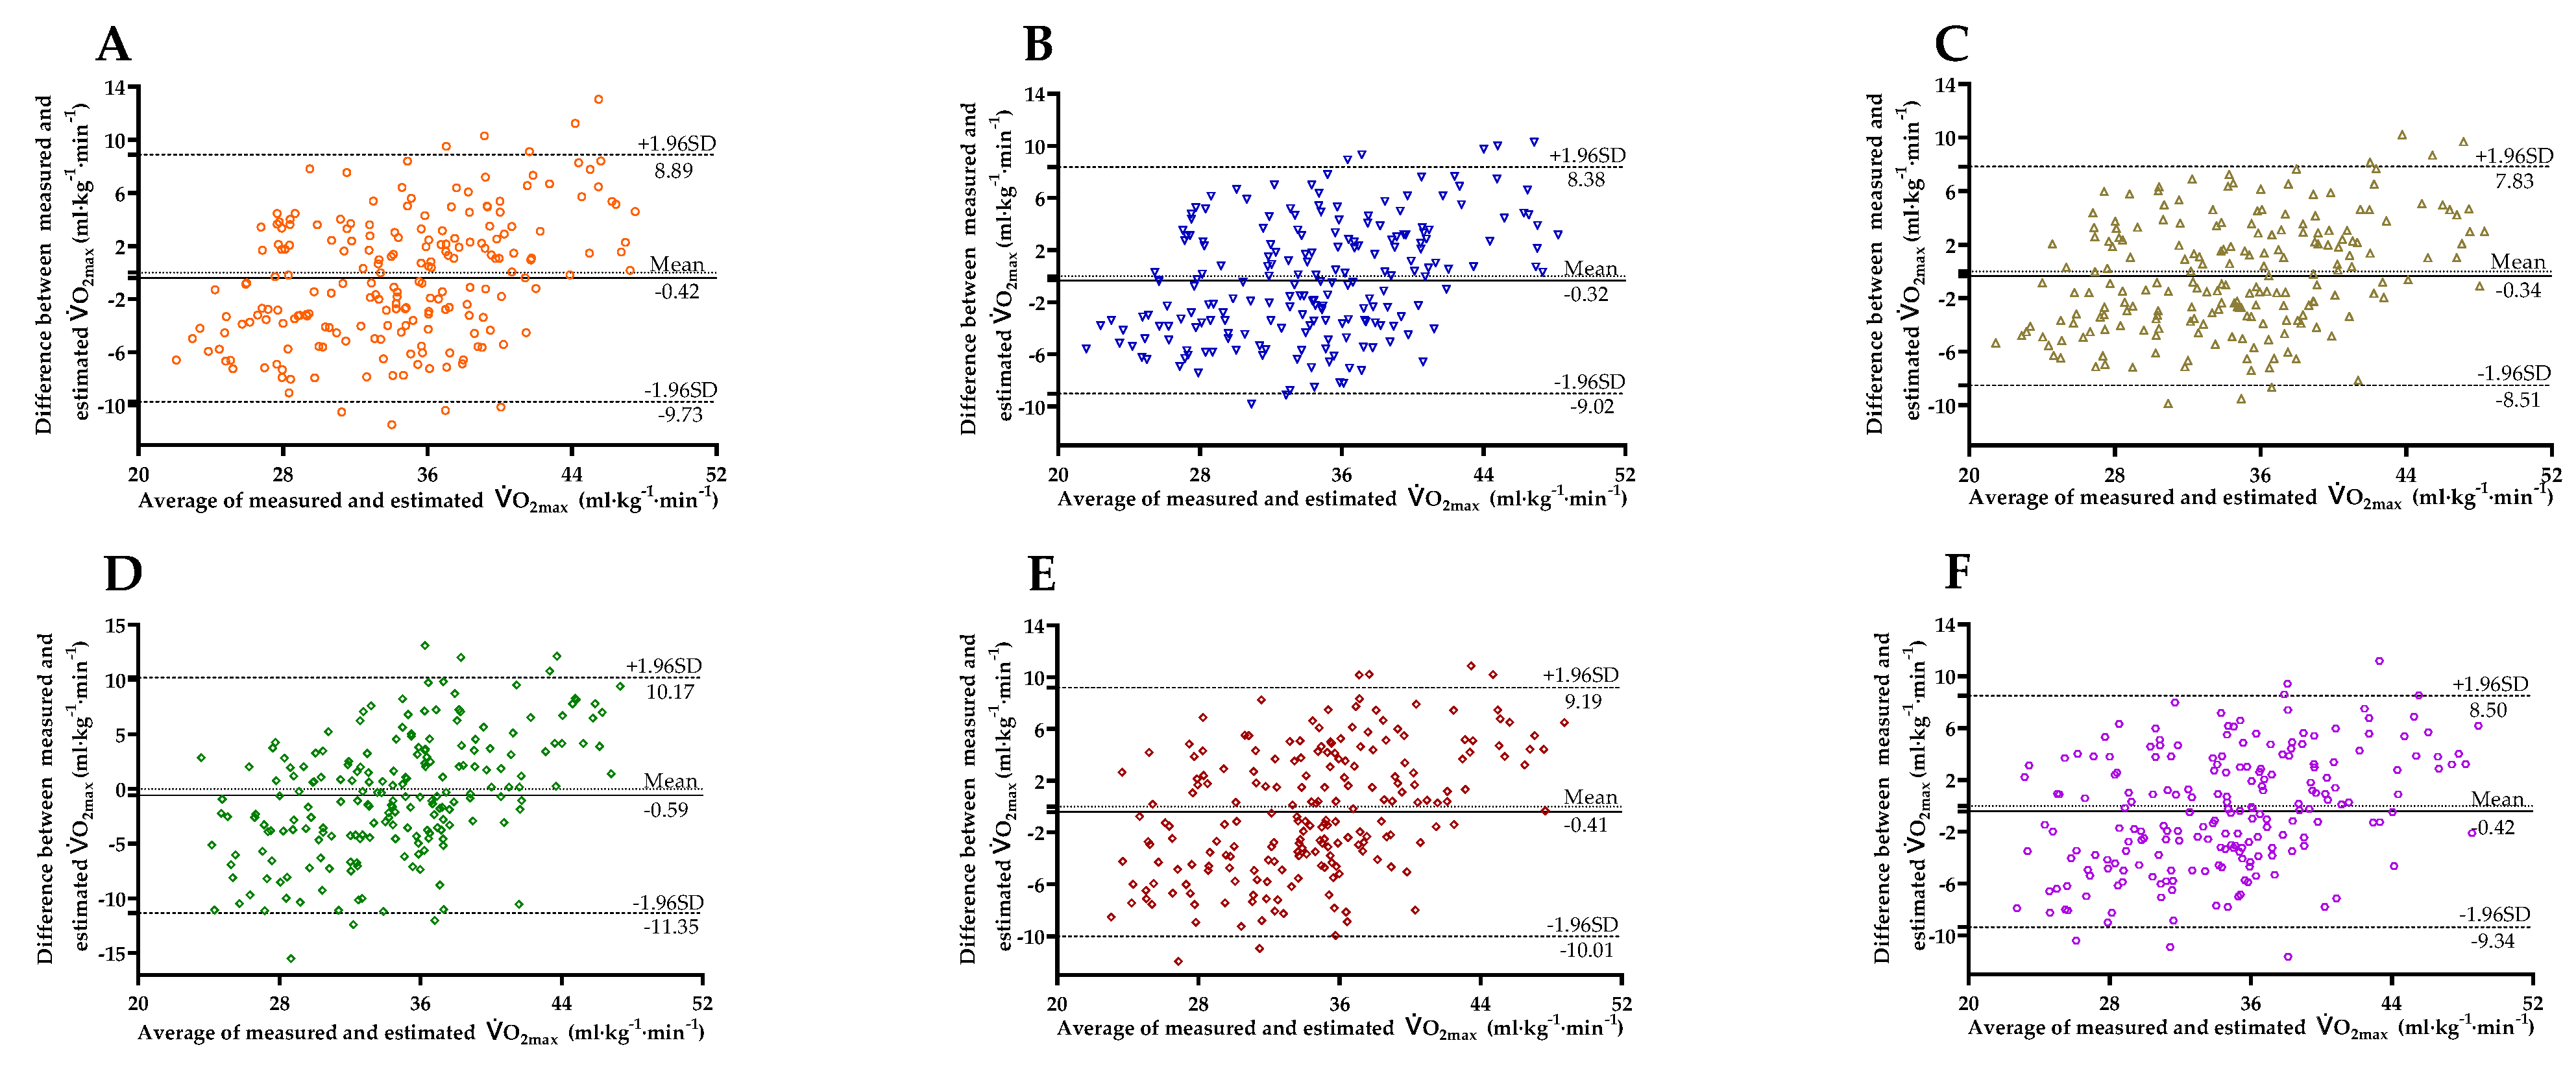
Figure 3 shows the Bland–Altman Plots comparing the values of O2max measured with those predicted, with the 95% limits of agreement (LoAs). The mean differences between O2max measured and estimated by PBF modelBC (95% LoA = −9.73 to 8.89), PBF modelHR0 (95% LoA = −9.02 to 8.38), PBF model∆HR3 − HR4 (95% LoA = −8.51 to 7.83), BMI modelBC (95% LoA = −11.35 to 10.17), BMI modelHR0 (95% LoA = −10.01 to 9.19), and BMI model∆HR3 − HR4 (95% LoA = −9.34 to 8.50) were −0.42 ± 4.75, −0.32 ± 4.44, −0.34 ± 4.17, −0.59 ± 5.49, −0.41 ± 4.90, and −0.42 ± 4.55 mL·kg−1·min−1, respectively, not significant (all p > 0.05), and within the acceptable range [26].
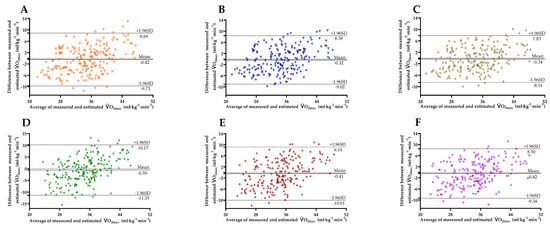
Figure 3.
Bland–Altman Plots comparing the differences between measured and estimated O2max obtained from PBF modelBC (A), PBF modelHR0 (B), PBF model∆HR3 − HR4 (C), BMI modelBC (D), BMI modelHR0 (E), BMI model∆HR3 − HR4 (F) in the entire sample (n = 205). The mean differences and 95% limits of agreement are shown as solid lines and dashed lines, respectively.
Table 4 shows the results of cross-validation with the CE statistical method in the O2max prediction models. The CE absolute values for the subgroups of gender, age, and O2max of 32–38 mL·kg−1·min−1 in the PBF and BMI models∆HR3 − HR4 were less than 1. As for the O2max subgroup, the CE absolute values for the subgroups of low physical fitness (O2max < 32 mL·kg−1·min−1) and high physical fitness (O2max ≥ 38 mL·kg−1·min−1) were higher, while the subgroup of moderate fitness (O2max = 32–38 mL·kg−1·min−1) had lower CE absolute values in all models.
Table 4.
Constant error and standard deviations for subgroups of gender, age, and measured O2max in the entire sample (n = 205).
4. Discussion
Previous studies have indicated that CRF is closely related to coronary heart disease, all-cause mortality [4,27,28], and COVID-19 mortality [29]. Individuals with high CRF levels have lower risk of dying from COVID-19, while a low CRF level is likely to increase the risk of cardiovascular disease and mortality [30,31]. For a CRF assessment, O2max is generally considered as an indicator of CRF level. It can be used for clinical-related classification, such as risk stratification for patients with COVID-19 [32]. However, given the rapid spread of the severe COVID-19, the conventional method used to directly measure the O2max on a treadmill or bicycle ergometer in the laboratory is not feasible. Therefore, it is necessary to develop a simple and reliable home testing method to indirectly measure O2max. Under such circumstances, this research developed the 3MISP testing method and established six O2max prediction equations based on physical characteristics, base HR, and exercise test parameters. The validity of different models for O2max prediction was verified and compared as well. This research found a significant correlation between 3MISP-HR and O2max, as hypothesized. The O2max prediction equations using age, gender, and PBF/BMI (i.e., PBF and BMI modelsBC) are relatively simple but less accurate. Although the O2max prediction equations with baseline HR (i.e., PBF and BMI modelsHR0) can effectively improve the accuracy of O2max prediction, the O2max prediction equations built from the 3MISP exercise test (i.e., PBF and BMI models∆HR3 − HR4) have the highest accuracy. In addition, PBF is a better predictor than BMI. Compared with BMI models, the three PBF models established with physical characteristics, baseline HR, and exercise test parameters present higher R2 and lower SEE (%SEE) values. Of the PBF models, the PBF model∆HR3−HR4 is the best one for predicting O2max and can provide more precise estimation of O2max in healthy adults. However, BMI models are more economical and affordable. Individuals can select the corresponding O2max prediction equation based on their own conditions and circumstances to evaluate their CRF levels. Due to the simple movement, minimal space and equipment, short testing time, high safety index, and reliability, the 3MISP test is convenient for everyone to conduct CRF self-monitoring at home.
Generally, HR can reflect an individual’s physical fitness and exercise intensity. In a standard CRF test, the HR of a non-athlete is normally close to the age-predicted maximum HR [33]. An individual with a higher CRF level has a lower baseline HR and shorter HR recovery time following a cardiopulmonary exercise test [34]. Since there is a linear relationship between HR variations before, during, and after exercise and O2max [2,3,6,17,35,36,37,38], the exercise HR test can improve the prediction of the O2max model. Previous studies have demonstrated a significant negative correlation between post-exercise recovery HR and O2max [6,36,37,39], and it is an important factor in O2max prediction. Matsuo et al. (2020b) indicated that HR both during and following exercise had negative correlations with O2max, and the HR index composed of these two had the largest correlation with O2max [3]. Chung et al. (2021) found that the difference between HR at the third minute during the exercise and recovery HR at the first minute post exercise in the 3 min step test had positive correlations with O2max [2]. The results of the present research are consistent with those of previous studies, demonstrating that ∆HR3 − HR4 and O2max have a significant positive correlation in the 3MISP test, while HR0 has a negative correlation with O2max (see Figure 1). These findings shows that HR can play a potential role in predicting O2max, and the HR variations based on the 3MISP test can be deemed as one of the relevant factors in CRF for adults. By monitoring the HR response in the 3MISP test, we can objectively understand the physical load during exercise of each participant and further establish the O2max prediction equation.
Previous studies indicated that age, gender, and physical characteristics (BMI or PBF) are important predictors of O2max [3,17,40]. Those findings are similar to the results of this research. In the present research, the simplest O2max prediction equation established with age, gender, and BMI/PBF explained 39.8% of the O2max in the BMI modelBC and 54.5% of that in the PBF modelBC (Table 3). To enhance the accuracy of O2max prediction, it uses HR variations during the 3MISP test as the predictive variable to establish the O2max prediction equation. The addition of HR0 and ∆HR3 − HR4 increases the variance of O2max explained by the PBF and BMI models∆HR3 − HR4 by 17.98% and 45.23%, respectively, while SEE decreases by 10.73% and 15.61%. Compared to the most economical BMI modelBC, the PBF model∆HR3 − HR4 increases the explained variance in O2max by 61.56%, while the SEE decreases by 22.40% (see Figure 2). These results show that, in the models developed on the basis of biological data, adding 3MISP-HR data improves the accuracy of O2max prediction models, and the O2max prediction of the PBF model∆HR3 − HR has higher precision than that of the BMI model∆HR3 − HR4. Many previous studies of O2max prediction have also found that PBF is a better predictor than BMI [2,40,41]. Therefore, when financial conditions permit, people can consider adopting the PBF models to evaluate their O2max. As for economical options, the BMI models may be affordable choices.
Due to the convenience of the step test, many studies in the past have adopted the Young Men’s Christian Association step test [6,16], Harvard step test [42], Chester step test [42], and Japan step test [3] to evaluate O2max, with positive outcomes. Lee et al. (2019) established the O2max prediction equation based on age, gender, height, body weight, and recovery HR (R2 = 0.56–0.61, SEE = 4.74–5.01 mL·kg−1·min−1) [17]. Hong et al. (2019) used age, sex, body weight, and recovery HR to establish two O2max prediction equations, which could explain 73.4% and 72.2% of O2max, respectively, and the SEEs were both 4.7 mL·kg−1·min−1 [1]. Matsuo et al. (2020b) used age, gender, BMI, and HR index to establish a O2max prediction equation, and the R2 and SEE values were 0.60 and 4.05 mL·kg−1·min−1, respectively [3]. The step-up test requires the participant to continuously step forward onto and backward off a box of a specified height at a speed set by a metronome for a certain time to examine the CRF level according to the HR during or following exercise [43,44]. Since this type of test places high demands on lower limb muscle strength, body coordination, and balance, it is difficult for participants with poor physical fitness or knee injuries to complete, and such participants are likely to fall during the stepping process [2]. Bohannon et al. (2015) noticed that 23% of their participants were unable to complete the step-up test, and those who could complete the procedure were younger adults (aged 39.9 ± 19.4 years) with lower BMI (25.0 vs. 27.1 kg/m2) [18]. Beutner et al. (2015) also found that the participants who were unable to complete the test (15%) were older adults (aged 69.3 ± 5.5 years) or had higher BMI (BMI: 29.5 ± 3.9 kg/m2) [6]. To enhance the safety, effectiveness, and universality of the CRF assessment, this research designed a substitute for the step-up test, namely the 3MISP test. The midway point between the participant’s patella and iliac crest is measured as the target height for lifting the knees during the test, and no step-box is used. It is thus safer than the step-up test. As compared with previous studies that assessed O2max with a step-up test, the R2 and SEE values (R2 = 0.578–0.643; SEE = 4.2631–4.6358 mL·kg−1·min−1) in our O2max prediction models (PBF and BMI model∆HR3−HR4) developed by the 3MISP test are both acceptable. Our study agreed with previous reports suggesting that there was a strong correlation between O2max values predicted using gender, age, physical characteristics (BMI/PBF) and HR from the step test, and actual measurements of O2max in the bicycle ergometer or treadmill test [2,3,16] and confirmed the applicability of 3MISP test to the healthy adults.
For determining the reliability and validity of our O2max prediction equations, two separate cross-validation procedures were performed in this research. The cross-validation results of the PRESS method showed that the R2 (0.002–0.014) and SEE (0.018–0.2125 mL·kg−1·min−1) differences in the multiple linear regressions for the six prediction models between the training and testing groups were minor (see Table 3). Cross-validation analysis with the CE statistical method was used to compare the difference between measured and estimated O2max in subgroups, and the results showed that the CE absolute values for the subgroups of gender, age, and O2max of 32–38 mL·kg−1·min−1 in the PBF and BMI models∆HR3 − HR4 were minor (see Table 4). The results of these two separate cross-validations verified the effectiveness of our O2max prediction models. Therefore, the proposed 3MISP test and the O2max prediction equations established in the present research are reasonable and feasible according to these experimental results.
The practical implications are that HR during the 3MISP test can be used to predict O2max, providing the assessment of CRF. By developing the O2max models, the 3MISP test provides HR making it cost-effective and space-efficient to evaluate the CRF levels. The 3 min Harvard step was applied to measure the CRF levels in Taiwan, by calculating the step-up index with HR. This test requires step-up boxes, and participants with low physical fitness or knee injuries are prone to falling in the process of stepping forward onto and backward off the box [2]. Therefore, the safer test is pursued. Given that the HR is the key indicator of CRF, the implementation of the 3MISP test to calculate HR0 and ∆HR3 − HR4 provides a more securely practical method of CRF measurement, without a step-up box in the present study. Furthermore, we established six O2max prediction models, and the public can choose the corresponding formulas based on economic conditions. Under specific conditions, individuals without a PBF detector can select more economical BMI models to estimate O2max, thereby promoting the self-health management.
There are some strengths and limitations in this research. The strengths are that the 3MISP test proposed for evaluating CRF is simple, safe, effective, space-saving, and easy to conduct. The cross-validation design was used to investigate the validity of 3MISP in predicting O2max. In addition, the six prediction models can be chosen under different situations. Regarding limitations, no participants were given any habituation trial before the 3MISP test. Another limitation is that, since the participants in this research were all healthy adults in Taiwan aged 20–64 years, the O2max prediction equation established here may not be applicable to children, adolescents, older adults, or individuals with metabolic syndrome or mobility impairments.
5. Conclusions
The 3 min incremental step-in-place test has simple movements, a minimal testing space, a short testing time, a high safety index, and reliability, and it requires no step-box or expensive equipment. High demands on rhythm and coordination are limitations of 3 min incremental step-in-place test. This study showed that the 3 min incremental step-in-place test is an effective assessment method, and the accuracy of regression models for predicting maximal oxygen uptake was also improved. Among the six maximal oxygen uptake prediction models developed in the present research, the percent body fat model∆HR3 − HR4 using age, gender, percent body fat, and heart rate at the beginning of exercise, and difference between heart rate at the third minute during the exercise and the first minute post exercise in the 3 min incremental step-in-place test, had the highest accuracy and appears to be the best model for maximal oxygen uptake prediction, whereas the body mass index models are more economical and affordable. Individuals can select appropriate maximal oxygen uptake prediction equations based on their own conditions and circumstances to evaluate their cardiorespiratory fitness levels. The 3 min incremental step-in-place test provides a safe, simple, and effective method of assessing cardiorespiratory fitness. It can be applied in the home setting as a cardiorespiratory fitness self-monitoring method for the general population. In the event that a rapid test is required and space is limited, the 3 min incremental step-in-place test can also be used as an ideal choice for clinical practice. The achievements of this study can provide health groups aged 20–64 years with various choices of cardiorespiratory fitness assessment, regardless of whether they own the necessary equipment.
Author Contributions
Conceptualization, F.L., W.-S.C.; Data curation, C.-H.C.; Formal analysis, C.-H.C.; Investigation, C.-S.H., C.-C.H.; Methodology, F.L., Y.-C.C., H.-J.W., N.-W.K.; Software, F.L.; Supervision, C.-S.H., C.-C.H. All authors have read and agreed to the published version of the manuscript.
Funding
This research was supported by the Sports Administration, Ministry of Education, R.O.C., for the Comprehensive Research for the Industrial Technology Research Institute’s Technology Fitness Program: no.K4653H1A20.
Institutional Review Board Statement
The study was approved and reviewed by the Institutional Review Board (IRB) of the Industrial Technology Research Institute (IRB No: IRB-APP-F02-106-009).
Informed Consent Statement
Informed consent was obtained from all subjects involved in the study. Before the experiment, the researchers explained the experimental process in detail, and the experiment began after the subjects signed the consent form.
Conflicts of Interest
The authors declare no conflict of interest.
References
- Hong, S.H.; Yang, H.I.; Kim, D.I.; Gonzales, T.I.; Brage, S.; Jeon, J.Y. Validation of Submaximal Step Tests and the 6-Min Walk Test for Predicting Maximal Oxygen Consumption in Young and Healthy Participants. Int. J. Environ. Res. Public Health 2019, 16, 4858. [Google Scholar] [CrossRef] [Green Version]
- Chung, Y.-C.; Huang, C.-Y.; Wu, H.-J.; Kan, N.-W.; Ho, C.-S.; Huang, C.-C.; Chen, H.-T. Predicting maximal oxygen uptake from a 3-minute progressive knee-ups and step test. PeerJ 2021, 9, e10831. [Google Scholar] [CrossRef] [PubMed]
- Matsuo, T.; So, R.; Takahashi, M. Estimating cardiorespiratory fitness from heart rates both during and after stepping exercise: A validated simple and safe procedure for step tests at worksites. Graefe’s Arch. Clin. Exp. Ophthalmol. 2020, 120, 2445–2454. [Google Scholar] [CrossRef] [PubMed]
- Ross, R.; Blair, S.N.; Arena, R.; Church, T.S.; Després, J.-P.; Franklin, B.A.; Haskell, W.L.; Kaminsky, L.A.; Levine, B.D.; Lavie, C.J.; et al. Importance of assessing cardiorespiratory fitness in clinical practice: A case for fitness as a clinical vital sign: A scientific statement from the american heart association. Circulation 2016, 134, e653–e699. [Google Scholar] [CrossRef] [PubMed]
- Rao, A.; Phadke, A.; Patil, P.; Joshi, A. Comparison Of Non-exercise Test and Step Test In Estimation of Aerobic Capacity (VO2max) In Young Adults. Natl. J. Physiol. Pharm. Pharmacol. 2014, 4, 1. [Google Scholar] [CrossRef]
- Beutner, F.; Ubrich, R.; Zachariae, S.; Engel, C.; Sandri, M.; Teren, A.; Gielen, S. Validation of a brief step-test protocol for estimation of peak oxygen uptake. Eur. J. Prev. Cardiol. 2015, 22, 503–512. [Google Scholar] [CrossRef]
- Nes, B.M.; Janszky, I.; Vatten, L.J.; Nilsen, T.I.; Aspenes, S.T.; Wisløff, U. Estimating VO2 peak from a nonexercise prediction model: The HUNT Study, Norway. Med. Sci. Sports Exerc. 2011, 43, 2024–2030. [Google Scholar] [CrossRef]
- Sui, X.; LaMonte, M.J.; Blair, S.N. Cardiorespiratory fitness as a predictor of nonfatal cardiovascular events in asymptomatic women and men. Am. J. Epidemiol. 2007, 165, 1413–1423. [Google Scholar] [CrossRef]
- De Sousa, N.; Bertucci, D.R.; de Sant’Ana, G.M.; Padua, P.; da Rosa, D.M. Incremental and decremental cardiopulmonary exercise testing protocols produce similar maximum oxygen uptake in athletes. Sci. Rep. 2021, 11, 13118. [Google Scholar] [CrossRef]
- Cooney, J.K.; Moore, J.P.; Ahmad, Y.A.; Jones, J.G.; Lemmey, A.B.; Casanova, F.; Maddison, P.J.; Thom, J.M. A simple step test to estimate cardio-respiratory fitness levels of rheumatoid arthritis patients in a clinical setting. Int. J. Rheumatol. 2013, 2013, 1–8. [Google Scholar] [CrossRef] [Green Version]
- Cooper, K.H. A means of assessing maximal oxygen intake. Correlation between field and treadmill testing. JAMA 1968, 203, 201–204. [Google Scholar] [CrossRef]
- Léger, L.A.; Mercier, D.; Gadoury, C.; Lambert, J. The multistage 20 metre shuttle run test for aerobic fitness. J. Sports Sci. 1988, 6, 93–101. [Google Scholar] [CrossRef]
- Noonan, V.; Dean, E. Submaximal exercise testing: Clinical application and interpretation. Phys. Ther. 2000, 80, 782–807. [Google Scholar] [CrossRef]
- Elsaidy, W.S.I.M. Evaluating the validity and reliability of Harvard step test to predict VO2max in terms of the step height according to the knee joint angle. Theor. Appl. Int. Ed. 2011, 1, 126–132. [Google Scholar]
- Sopalard, M.; Leelarungrayub, J.; Klaphajone, J. Variation of knee angle and leg length for predicting VO2max in healthy male volunteers using the Queen’s College step test. J. Phys. Educ. Sport 2016, 16, 275–280. [Google Scholar]
- Van Kieu, N.T.; Jung, S.-J.; Shin, S.-W.; Jung, H.-W.; Jung, E.-S.; Won, Y.H.; Kim, Y.-G.; Chae, S.-W. The Validity of the YMCA 3-Minute Step Test for Estimating Maximal Oxygen Uptake in Healthy Korean and Vietnamese Adults. J. Lifestyle Med. 2020, 10, 21–29. [Google Scholar] [CrossRef] [PubMed]
- Lee, O.; Lee, S.; Kang, M.; Mun, J.; Chung, J. Prediction of maximal oxygen consumption using the Young Men’s Christian Association-step test in Korean adults. Graefe’s Arch. Clin. Exp. Ophthalmol. 2019, 119, 1245–1252. [Google Scholar] [CrossRef]
- Bohannon, R.W.; Bubela, D.J.; Wang, Y.C.; Magasi, S.S.; Gershon, R.C. Six-minute walk test versus three-minute step test for measuring functional endurance. J. Strength Cond. Res. 2015, 29, 3240–3244. [Google Scholar] [CrossRef] [Green Version]
- Bohannon, R.W.; Crouch, R.H. Two-minute step test of exercise capacity: Systematic review of procedures, performance, and clinimetric properties. J. Geriatr. Phys. Ther. 2019, 42, 105–112. [Google Scholar] [CrossRef]
- Miller, R.M.; Chambers, T.L.; Burns, S.P.; Godard, M.P. Validating inbody® 570 multi-frequency bioelectrical impedance analyzer versus DXA for body fat percentage analysis. Med. Sci. Sports Exerc. 2016, 48, 991. [Google Scholar] [CrossRef] [Green Version]
- Riebe, D.; Ehrman, J.K.; Liguori, G.; Magal, M. Clinical exercise testing and interpretation. In ACSM’s Guidelines for Exercise Testing and Prescription, 10th ed.; Wolters Kluwer: Philadelphia, PA, USA, 2016; pp. 93–142. [Google Scholar]
- Cohen, J. A power primer. Psychol. Bull. 1992, 112, 155–159. [Google Scholar] [CrossRef] [PubMed]
- Schober, P.; Boer, C.; Schwarte, L.A. Correlation coefficients: Appropriate use and interpretation. Anesth. Analg. 2018, 126, 1763–1768. [Google Scholar] [CrossRef] [PubMed]
- Holiday, D.B.; Ballard, J.; McKeown, B.C. PRESS-related statistics: Regression tools for cross-validation and case diagnostics. Med. Sci. Sports Exerc. 1995, 27, 612–620. [Google Scholar] [CrossRef] [PubMed]
- Giavarina, D. Understanding bland altman analysis. Biochem. Med. 2015, 25, 141–151. [Google Scholar] [CrossRef] [PubMed] [Green Version]
- García, R.C.F.; De Oliveira, R.M.; Martínez, E.C.; Neves, E.B. VO2 estimation equation accuracy to young adults. Arch. Med. 2019, 20, 33–39. [Google Scholar] [CrossRef]
- Kodama, S.; Saito, K.; Tanaka, S.; Maki, M.; Yachi, Y.; Asumi, M.; Sugawara, A.; Totsuka, K.; Shimano, H.; Ohashi, Y.; et al. Cardiorespiratory fitness as a quantitative predictor of all-cause mortality and cardiovascular events in healthy men and women: A meta-analysis. JAMA 2009, 301, 2024–2035. [Google Scholar] [CrossRef] [Green Version]
- Jiménez-Pavón, D.; Lavie, C.J.; Blair, S.N. The role of cardiorespiratory fitness on the risk of sudden cardiac death at the population level: A systematic review and meta-analysis of the available evidence. Prog. Cardiovasc. Dis. 2019, 62, 279–287. [Google Scholar] [CrossRef]
- Christensen, R.A.G.; Arneja, J.; Cyr, K.S.; Sturrock, S.L.; Brooks, J.D. The association of estimated cardiorespiratory fitness with COVID-19 incidence and mortality: A cohort study. PLoS ONE 2021, 16, e0250508. [Google Scholar] [CrossRef] [PubMed]
- Strauss, M.; Foshag, P.; Jehn, U.; Brzęk, A.; Littwitz, H.; Leischik, R. Higher cardiorespiratory fitness is strongly associated with lower cardiovascular risk factors in firefighters: A cross-sectional study in a German fire brigade. Sci. Rep. 2021, 11, 1–7. [Google Scholar] [CrossRef]
- Schwendinger, F.; Pocecco, E. Counteracting physical inactivity during the COVID-19 pandemic: Evidence-based recommendations for home-based exercise. Int. J. Environ. Res. Public Health 2020, 17, 3909. [Google Scholar] [CrossRef]
- Ahmed, I. COVID-19–does exercise prescription and maximal oxygen uptake (VO2max) have a role in risk-stratifying patients? Clin. Med. 2020, 20, 282–284. [Google Scholar] [CrossRef]
- Berglund, I.J.; Sørås, S.E.; Relling, B.E.; Lundgren, K.M.; Kiel, I.A.; Moholdt, T. The relationship between maximum heart rate in a cardiorespiratory fitness test and in a maximum heart rate test. J. Sci. Med. Sport 2019, 22, 607–610. [Google Scholar] [CrossRef]
- Facioli, T.P.; Philbois, S.V.; Gastaldi, A.C.; Almeida, D.S.; Maida, K.D.; Rodrigues, J.A.L.; Sánchez-Delgado, J.C.; Souza, H.C.D. Study of heart rate recovery and cardiovascular autonomic modulation in healthy participants after submaximal exercise. Sci. Rep. 2021, 11, 1–9. [Google Scholar] [CrossRef]
- Grant, C.C.; Murray, C.; Van Rensburg, D.C.J.; Fletcher, L. A comparison between heart rate and heart rate variability as indicators of cardiac health and fitness. Front. Physiol. 2013, 4, 337. [Google Scholar] [CrossRef] [PubMed] [Green Version]
- Chatterjee, S.; Mukherjee, P.S.; Bandyopadhyay, A. Validity of Queen’s College step test for use with young Indian men. Br. J. Sports Med. 2004, 38, 289–291. [Google Scholar] [CrossRef] [PubMed]
- Chatterjee, S.; Chatterjee, P.; Bandyopadhyay, A. Validity of Queen’s College Step Test for estimation of maximum oxygen uptake in female students. Indian J. Med. Res. 2005, 121, 32–35. [Google Scholar] [PubMed]
- Ekblom-Bak, E.; Bjorkman, F.; Hellenius, M.; Ekblom, B. A new submaximal cycle ergometer test for prediction of VO2max. Scand. J. Med. Sci. Sports 2014, 24, 319–326. [Google Scholar] [CrossRef] [Green Version]
- Ibikunle, P.O.; Enumah, U.G. Maximum oxygen uptake and cardiovascular response of Professional male football and Basketball players to Chester step test. IOSR J. Sports Phys. Educ. 2016, 3, 1–5. [Google Scholar] [CrossRef]
- Matsuo, T.; So, R.; Takahashi, M. Workers’ physical activity data contribute to estimating maximal oxygen consumption: A questionnaire study to concurrently assess workers’ sedentary behavior and cardiorespiratory fitness. BMC Public Health 2020, 20, 22. [Google Scholar] [CrossRef]
- Cao, Z.-B.; Miyatake, N.; Aoyama, T.; Higuchi, M.; Tabata, I. Prediction of maximal oxygen uptake from a 3-minute walk based on gender, age, and body composition. J. Phys. Act. Health 2013, 10, 280–287. [Google Scholar] [CrossRef]
- Elliott, D.; Abt, G.; Barry, T. The effect of an active arm action on heart rate and predicted VO2max during the Chester step test. J. Sci. Med. Sport 2008, 11, 112–115. [Google Scholar] [CrossRef]
- Cheung, P.P. Review of Various Step Test Protocols for Use in Assessing Aerobic Fitness in Schools. Asian J. Phys. Educ. Recreat. 2012, 18, 74–81. [Google Scholar] [CrossRef]
- Yan, L.; Croce, R.; Horvat, M.; Roswal, G.; Fallaize, A.; Love, K. Determination of Cardiovascular Functioning in Chinese Adults with Intellectual Disabilities using the 3-Minute Step Test. Clin. Kinesiol. 2019, 73, 8–14. [Google Scholar]
Publisher’s Note: MDPI stays neutral with regard to jurisdictional claims in published maps and institutional affiliations. |
© 2021 by the authors. Licensee MDPI, Basel, Switzerland. This article is an open access article distributed under the terms and conditions of the Creative Commons Attribution (CC BY) license (https://creativecommons.org/licenses/by/4.0/).