Article

Effects of Anthropogenic Emissions from Different Sectors on PM2.5 Concentrations in Chinese Cities

1
Key Research Institute of Yellow River Civilization and Sustainable Development & Collaborative Innovation Center on Yellow River Civilization of Henan Province, Henan University, Kaifeng 475004, China
2
Institute of Urban Big Data, College of Geography and Environmental Science, Henan University, Kaifeng 475004, China
3
College of Geography and Environmental Science, Henan University, Kaifeng 475004, China
4
Key Laboratory of Geospatial Technology for the Middle and Lower Yellow River Regions (Henan University), Ministry of Education, Kaifeng 475004, China
5
Henan Key Laboratory of Integrated Air Pollution Control and Ecological Security, Henan University, Kaifeng 475004, China
6
Henan Ecological and Environmental Monitoring Center, Zhengzhou 450046, China
7
Institute of Technology, Technology & Media University of Henan Kaifeng, Kaifeng 475004, China
*
Authors to whom correspondence should be addressed.
These authors contributed equally to this work and should be considered co-first authors.
Int. J. Environ. Res. Public Health 2021, 18(20), 10869; https://doi.org/10.3390/ijerph182010869
Submission received: 13 September 2021 / Revised: 8 October 2021 / Accepted: 12 October 2021 / Published: 15 October 2021
(This article belongs to the Section Air)

Abstract

:
PM2.5 pollution has gradually attracted people’s attention due to its important negative impact on public health in recent years. The influence of anthropogenic emission factors on PM2.5 concentrations is more complicated, but their relative individual impact on different emission sectors remains unclear. With the aid of the geographic detector model (GeoDetector), this study evaluated the impacts of anthropogenic emissions from different sectors on the PM2.5 concentrations of major cities in China. The results indicated that the influence of anthropogenic emissions factors with different emission sectors on PM2.5 concentrations exhibited significant changes at different spatial and temporal scales. Residential emissions were the dominant driver at the national annual scale, and the NOX of residential emissions explained 20% (q = 0.2) of the PM2.5 concentrations. In addition, residential emissions played the leading role at the regional annual scale and during most of the seasons in northern China, and ammonia emissions from residents were the dominant factor. Traffic emissions play a leading role in the four seasons for MUYR and EC in southern China, MYR and NC in northern China, and on a national scale. Compared with primary particulate matter, secondary anthropogenic precursors have a more important effect on PM2.5 concentrations at the national or regional annual scale. The results can help to strengthen our understanding of PM2.5 pollution, improve PM2.5 forecasting models, and formulate more precise government control policy.

1. Introduction

Particulate matter (including PM2.5 and PM10, etc.), particularly fine particulate matter (PM2.5), is an air pollutant that exerts an important negative impact on public health [1,2,3,4]. Worldwide, more than 3.2 million people die prematurely due to outdoor particulate matter exposure each year [5]. In recent years, with the acceleration of China’s industrialization and urbanization and the continuous expansion of the urban scale, PM2.5 pollution has gradually attracted the attention of the government and academic circles [6,7,8].
Clarifying the mechanism of PM2.5 pollution is key to formulating effective pollution control policies. Natural geographic elements, including climate and topography, exert an important impact on PM2.5 [9,10,11,12,13,14,15,16]. Related studies have discussed meteorological factors, including temperature [17,18,19], humidity [20,21], wind speed [22,23], precipitation [24], atmospheric pressure [25], boundary layer height [26,27], solar radiation [28], and other factors that contribute to PM2.5. In addition to physical and geographic elements, human factors also exert a significant impact on PM2.5 concentrations [29]. Researchers have discussed the impact of many aspects on PM2.5 concentrations, such as land use [30,31], urbanization [32,33], transportation [34], economic development [35,36], and emissions premises [37,38,39,40,41]. Studies including [42] and others have studied the impact of reforestation and conversion of arable land on future air quality in the southern United States. The results showed that reforestation in the southeastern part of the United States led to a slight increase in summer PM2.5 in the southeastern United States, and the conversion of forest land to cultivated land led to an increase in annual PM2.5 concentrations. Studies including [43] and others have studied the impact of urban expansion on air quality in eastern China. The results have shown that intensive urbanization has an appropriate dilution effect on the concentrations of surface pollutants, but improper local emission control measures will aggravate regional haze pollution. Studies including [44] and others found that improper local emission control has been also found to have a great impact on light pollution among regional haze pollution. Studies including [45] and others have discussed the relationship between urbanization and other human factors, including clean energy consumption, emission reduction input, industry, and PM2.5 concentrations. The results have shown that the increase in PM2.5 concentrations is associated with urban areas. The protection of chemical and industrial growth is consistent, and increasing emissions reduction inputs and clean energy can slow the trend of increasing PM2.5 concentrations. Studies including [46] and others discussed the impact of social and economic development on major Chinese cities in terms of population density, economic growth, industrial base, industrial dust emissions, road density, trade openness, and energy consumption. The results showed that population density, industrial base, industrial dust emission, and road density have a significant positive effect on PM2.5 concentrations, while economic growth has a negative effect on PM2.5 concentrations. Studies including [35] and other studies have found that industrialization, urbanization, and economic growth in China have a positive correlation with PM2.5 concentrations. Studies including [47] and others found that land use/cover changes in PM2.5 concentrations showed a significant difference in different regions. Studies including [48] and others discussed the relationship between urban spatial structure and air quality in the United States, and found that proximate forests to urban areas reduce the number of AQI exceedance days. In addition, related researchers have integrated natural and human factors to discuss their influence on air quality [49,50]. Studies including [51] and others explored the impact of future climate change and anthropogenic emissions on the air quality in Portugal and Porto metropolitan areas in 2050 through different scenarios. The results showed that climate change and anthropogenic emissions have obvious temporal and spatial differences in the impact of air quality.
In summary, although existing research has made considerable progress in understanding the influence mechanism of PM2.5 concentrations, there remain some shortcomings. Existing studies mostly analyze the driving mechanism at a single temporal and spatial scale, and the differences of impact factors at different temporal and spatial scales are insufficiently considered. As far as anthropogenic emission factors are concerned, the impact mechanism of different sectors and different types of anthropogenic emissions on PM2.5 at different temporal and spatial scales is still unclear. This study focused on the entirety of China and analyzed the impact mechanism of emissions from different sectors on PM2.5 changes at different temporal and spatial scales. In addition, unlike most previous studies, which have only roughly characterized the humanistic driving mechanism through statistical data, this study focused more on the differences within the emission sector and explored the impact of anthropogenic emissions between different sectors on PM2.5 to clarify the difference in the impact of sector emissions on PM2.5 from a more detailed perspective.
Based on the emission inventory and site monitoring data, this study used the geographic detector method to explore the influence mechanism of the anthropogenic emission factors of different sectors on the PM2.5 concentrations. The research results will help researchers improve the accuracy of air quality forecasting models and also provide a basis and reference for government departments to formulate more accurate particulate matter emission government control policy.

2. Materials and Methods
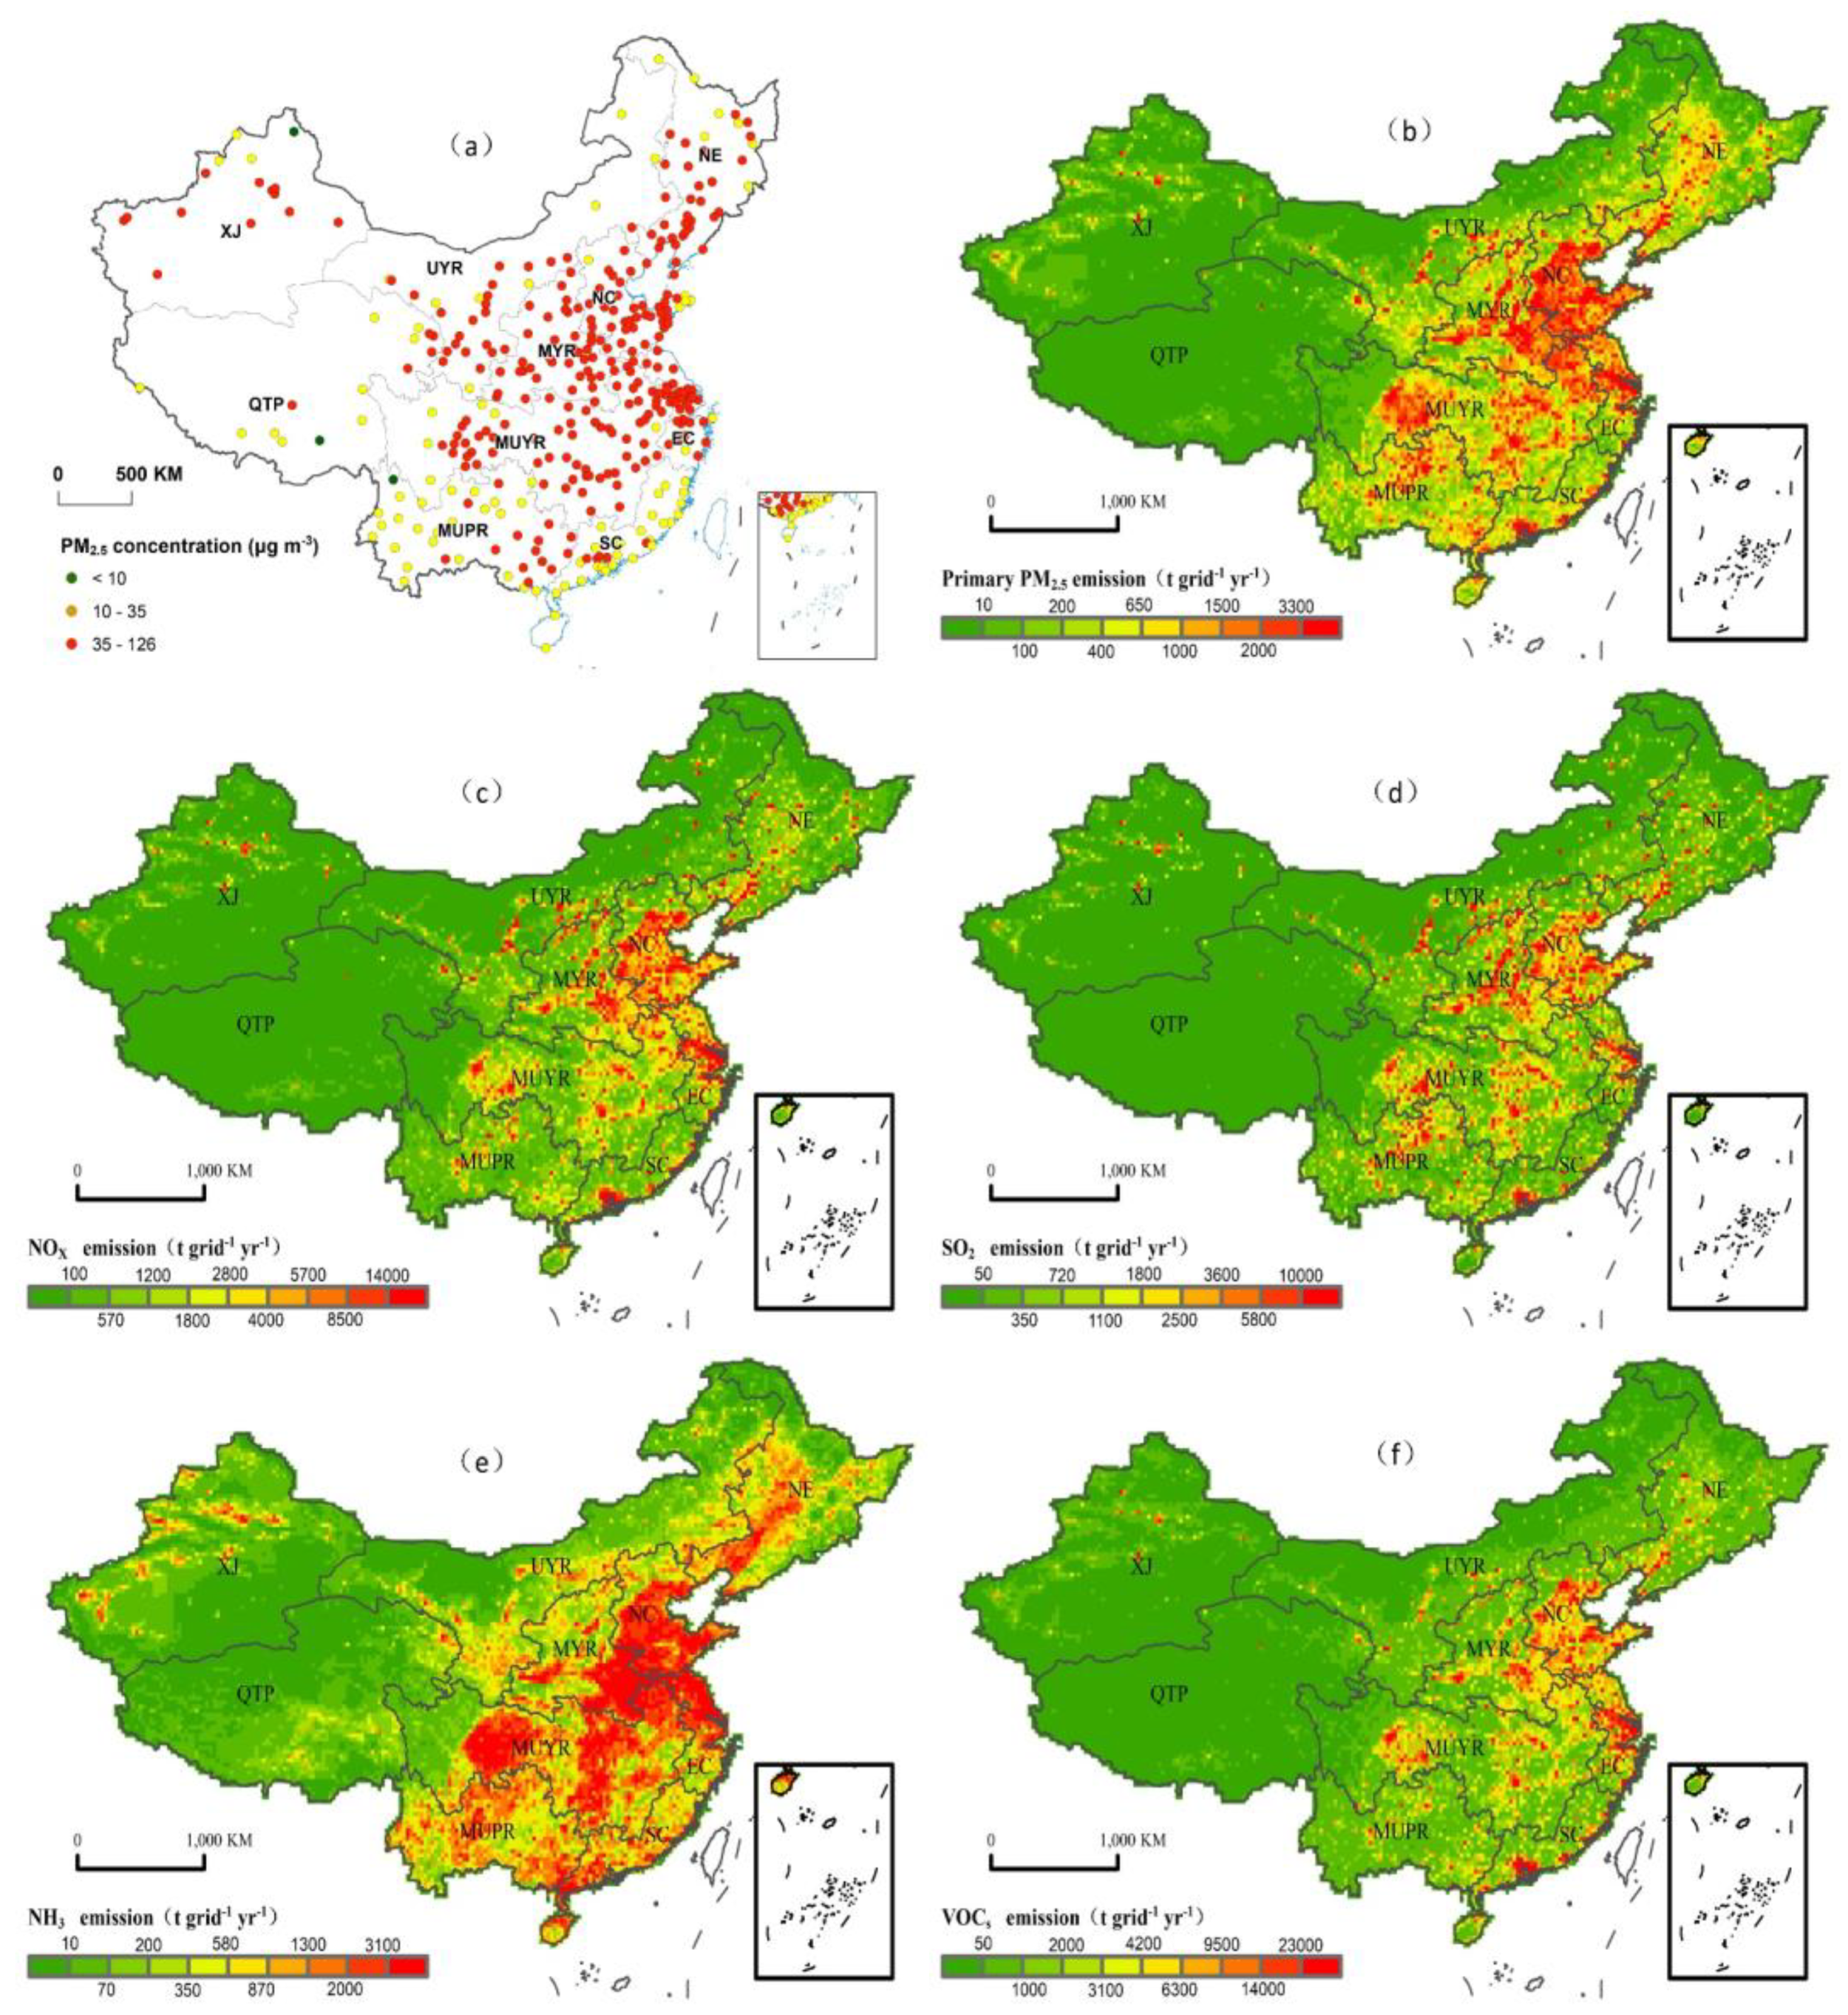
2.1. Study Area

This study takes China as the research area and selects 366 major cities as samples to analyze the impact of the emissions of different sectors on the PM2.5 concentrations of major cities. Considering China’s natural and economic and social conditions and referring to the research of [52], the China region is divided into ten zones (Figure S1): the upper zone of the Yellow River (UYR); the middle and upper zone of the Pearl River (MUPR); the middle zone of the Yellow River (MYR); the northern coastal zone (NC); the northeast zone (NE); the middle and upper zone of the Yangtze River (MUYR); the southeast coastal zone (SC); the Xinjiang zone (XJ); the Qinghai-Tibetan Plateau (QTP); and the eastern coastal area (EC). Furthermore, part of the district is divided into two regions, the south and the north. NE, MYR, UYR, and NC belong to the northern region, while SC, MUPR, EC, and MUYR belong to the southern region.

2.2. Data

The data used in this study include daily PM2.5 monitoring data from 366 cities (Figure S2) from 2015 to 2017 (National Environmental Monitoring Center). Based on this data, we can obtain the annual average concentrations (Figure 1a) from 2015 to 2017, as well as the seasonal average concentrations (Figures S2 and S3). The anthropogenic emission data of primary PM2.5, nitrogen oxides (NOX), volatile organic compounds (VOCS), sulfur dioxide (SO2) and ammonia (NH3) come from the 2016 Tsinghua University Emission Inventory (MEIC) (http://www.meicmodel.org/ (accessed on 10 December 2018)) (Figure 1b–f), the grid resolution is 0.25° × 0.25°, and the temporal resolution is month by month. The emission sector is divided into five sectors: industrial sources, agricultural sources, transportation sources, power sources and residential sources. The types of pollutants in each sector are as follows (Figures S4–S8): primary industry PM2.5, primary power PM2.5, primary residential PM2.5, primary transportation PM2.5, industrial NOX, power NOX, residential NOX, transportation NOX, industry VOCS, power VOCS, residential VOCS, transportation VOCS, agricultural NH3, industrial NH3, residential NH3, transportation NH3, industrial SO2, and power SO2.

2.3. GeoDetector Model

Geographic detectors are a set of statistical methods that use spatial similarity to detect the influence of independent variables on dependent variables and reveal the driving force behind the phenomenon. This method has no linear assumptions and has clear physical meaning. It includes 4 modules: the factor detection module, interaction function detection module, risk area detection module, and ecological detection module [53]. This study uses the factor detection module in GeoDetector to evaluate the contribution of pollutants emitted by different sectors to the PM2.5 concentrations of major cities in China. The factor detection module can express the degree of interpretation of the independent variable to the dependent variable through the q value. For specific methods, please refer to related research [54,55].
The factor detection module used in this article is used to detect the spatial differentiation of the dependent variable and quantify the degree of interpretation of a certain independent variable to the dependent variable, measured by the q value. Assume that the PM2.5 concentrations in the area in which the city is located are composed of daily emission data of 366 cities across the country. Assuming that there may be a factor that affects the concentrations of PM2.5, expressed as A = {Ah}, h = 1, 2, …, L, L is the number of influencing factors, Ah is the different types of influencing Factors A, and A-type h corresponds to one or more regional subsets of the city in space. To detect the spatial correlation between influencing Factor A and urban PM2.5 concentrations, the layers of influencing Factor A and the urban PM2.5 concentrations map are superimposed. In the h type of influencing Factor A, the discrete variance of urban PM2.5 concentrations is denoted as σh2, and the degree of interpretation of PM2.5 concentrations by influencing Factor A can be expressed as:
q = 1 h = 1 L N h σ h 2 N σ 2
In the formula, q is the explanatory power of urban PM2.5 concentrations influencing factors, and its value range is [0, 1]; L is the number of urban subregions divided by influencing factors, which this article uses equal interval classification to divide into 6 levels; h is a certain subarea; Nh is the number of samples in a given subarea; N is the number of samples in the entire study area; σh2 is the discrete variance of the PM2.5 concentrations in a given subregional city; σ2 is the variance of the PM2.5 concentrations in the entire regional city. If the q value of a certain influencing factor is higher, its explanatory power is stronger, and the influence of this factor on urban PM2.5 concentrations is stronger. Conversely, if the q value of a certain influencing factor is smaller, its explanatory power is weaker, and the influence of this factor on urban PM2.5 concentrations is weaker. In extreme cases, a q value of 0 indicates that the influencing factor and urban PM2.5 concentrations score have no relationship. A q value of 1 indicates that the influencing factors completely affect the distribution of urban PM2.5 concentrations.

3. Results

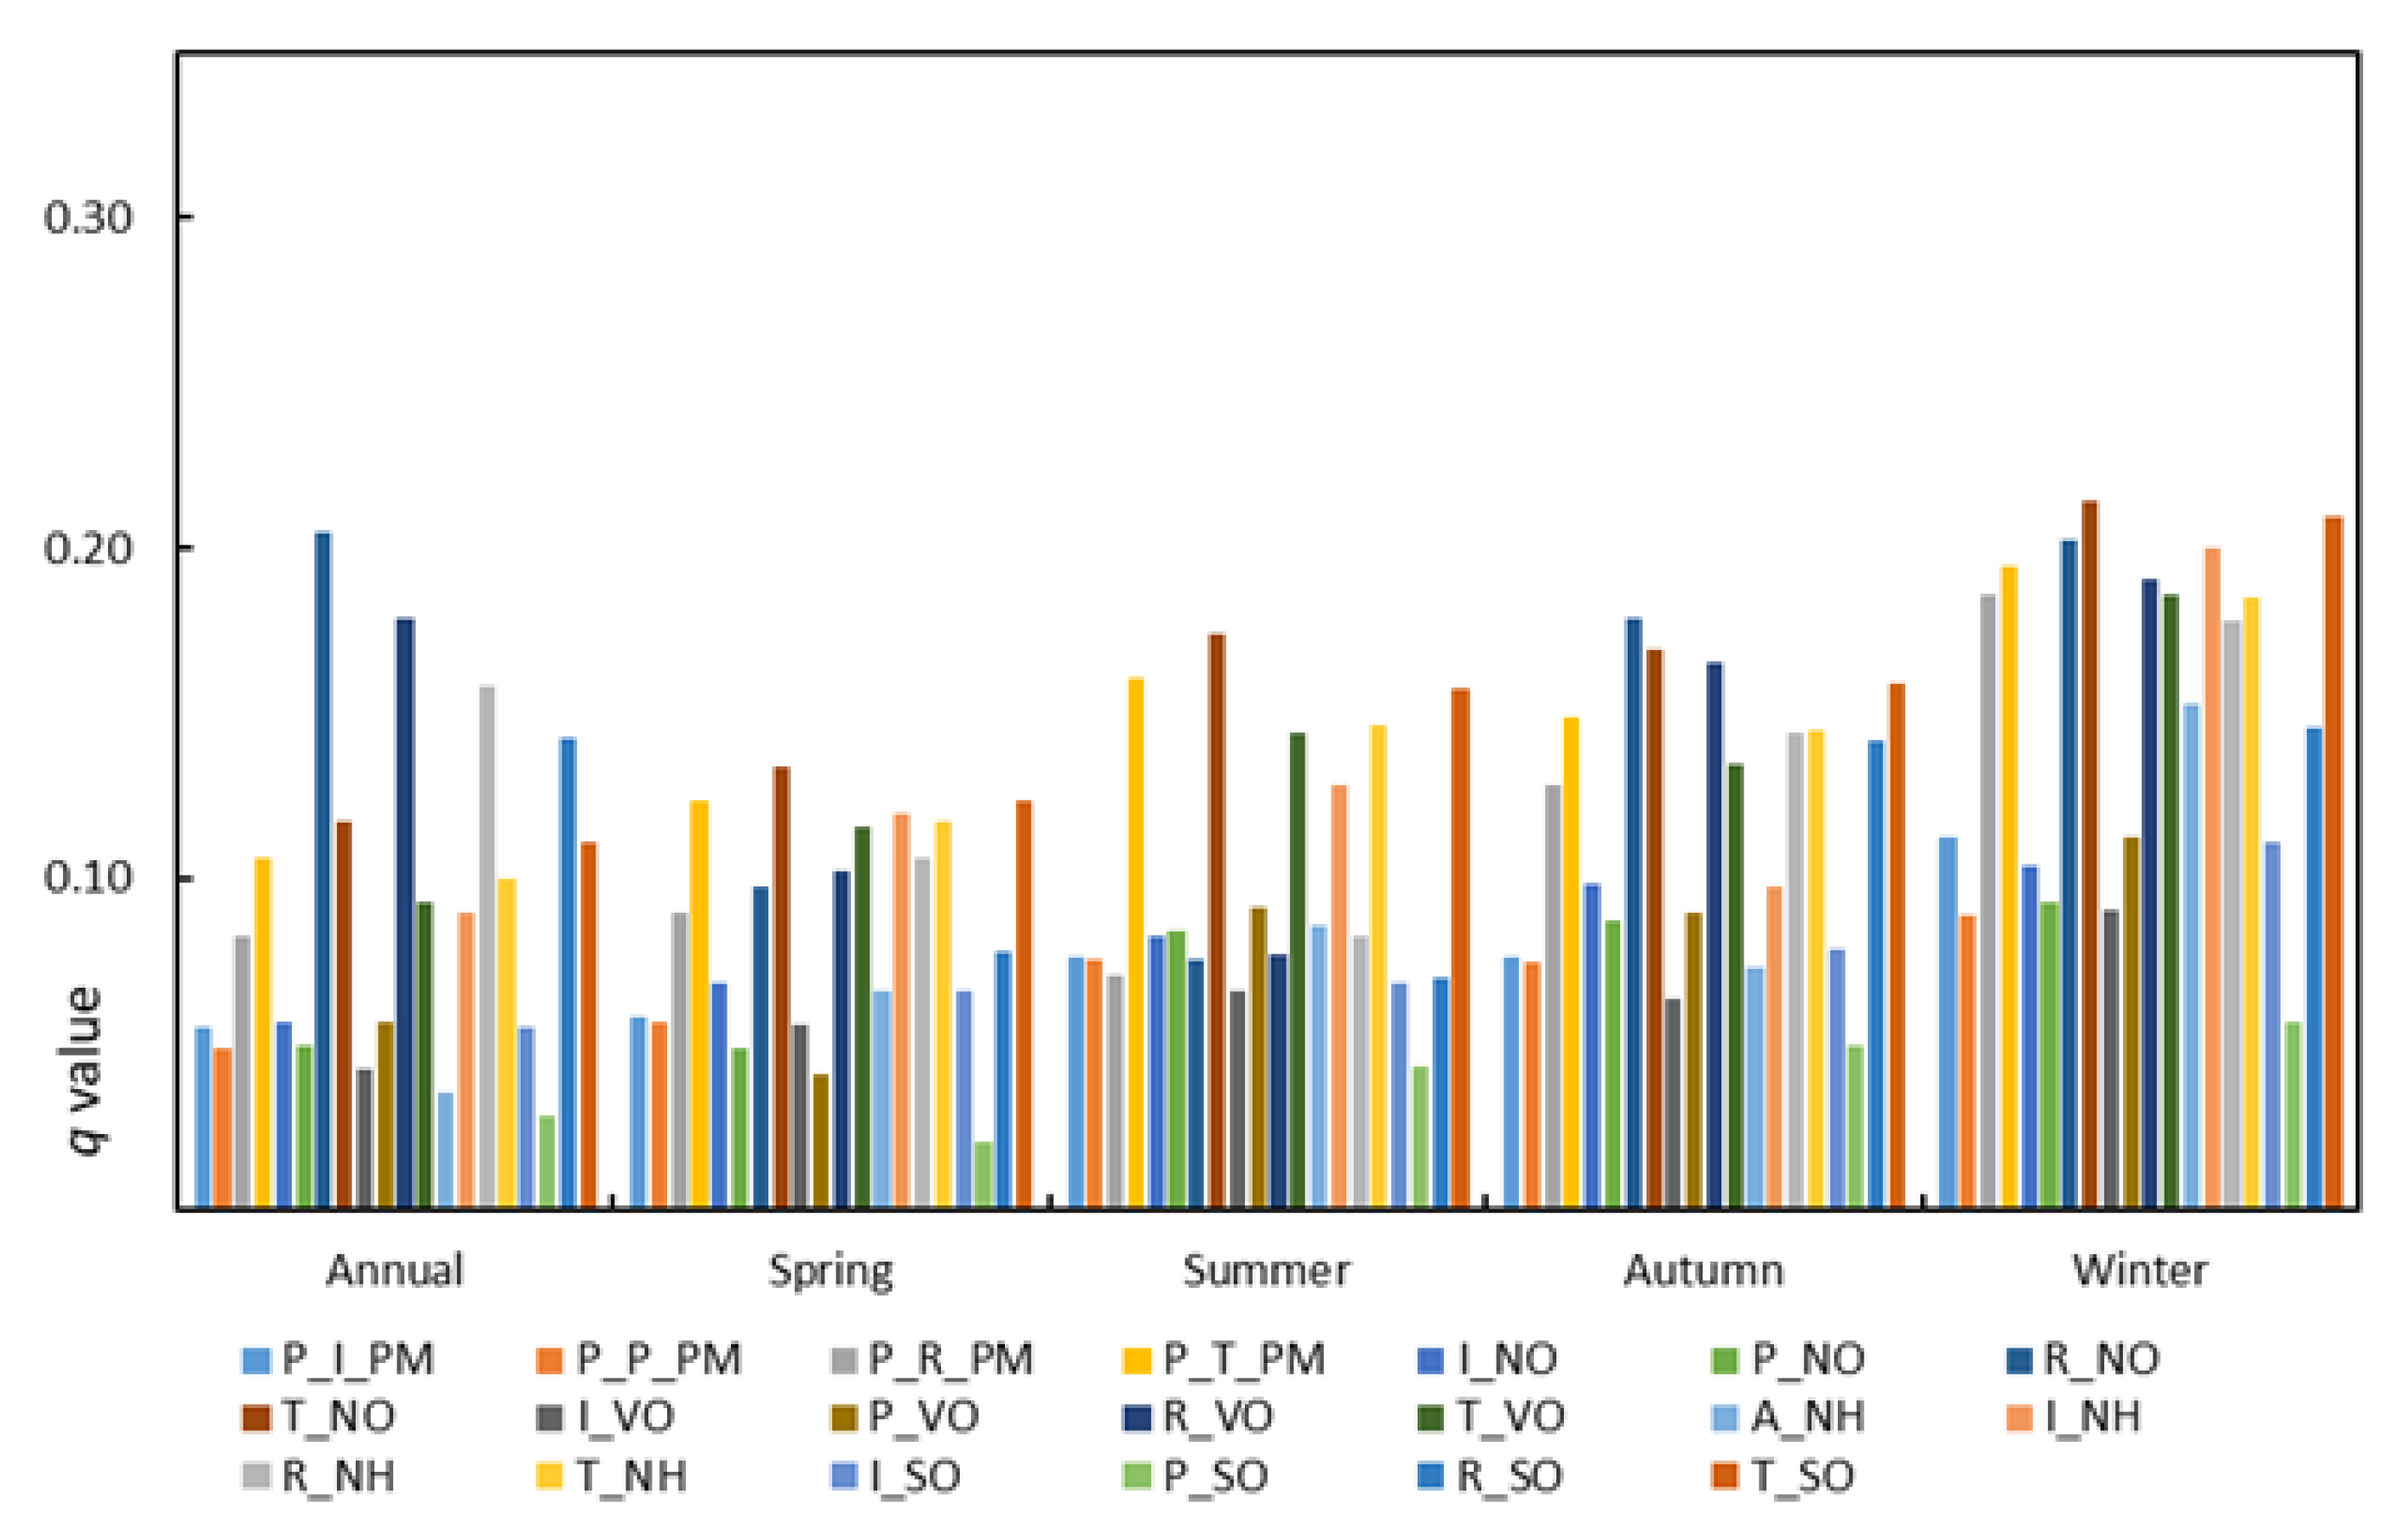
3.1. Analysis on the National Annual Scale

The driving factors of PM2.5 concentrations in all Chinese cities have significant annual changes on an annual scale. If the emission sectors are not considered, the primary two factors influencing the concentrations of PM2.5 on the national annual scale are NH and P_PM (Figure S9). If the emission sectors are considered, the dominant factors that affect PM2.5 concentrations on the national annual scale come from residential sources. Among them, the dominant factor is R_NO (q = 0.20), followed by R_VO (q = 0.18), R_NH (q = 0.16) and R_SO (q = 0.14) (Figure 2).

3.2. Analysis on the National Seasonal Scale

If the emission sectors are not taken into account, the dominant factors that affect the PM2.5 concentrations on the national scale in spring are NO and NH (Figure S9). In summer, these types of anthropogenic emissions have similar effects on PM2.5 concentrations on the national scale. Similar to summer, these types of anthropogenic emissions have similar effects on PM2.5 concentrations in autumn (except SO). However, the influence of NH and P_PM on PM2.5 concentrations are stronger than other factors in winter on the national scale.
If the emission sectors are considered, traffic sources play a leading role in the influence of PM2.5 concentrations compared with several other emission sources in spring on the national scale (Figure 2). The contribution of the influencing factors is ranked as follows: T_NO (q = 0.13), T_SO (q = 0.12), T_VO (q = 0.12). Similar to spring, the main driving factors come from traffic sources in summer. T_NO (q = 0.17) ranks first, followed by T_SO (q = 0.16) and T_NH (q = 0.15). In autumn, residential sources and traffic emissions play a leading role in PM2.5 concentrations and have similar effects on the national scale. R_NO (q = 0.18) and R_NO (q = 0.17) are the top two factors. Similar to autumn, residential sources and traffic sources in winter play a leading role in the PM2.5 concentrations and have similar effects, and the dominant factors are T_NO and T_SO.

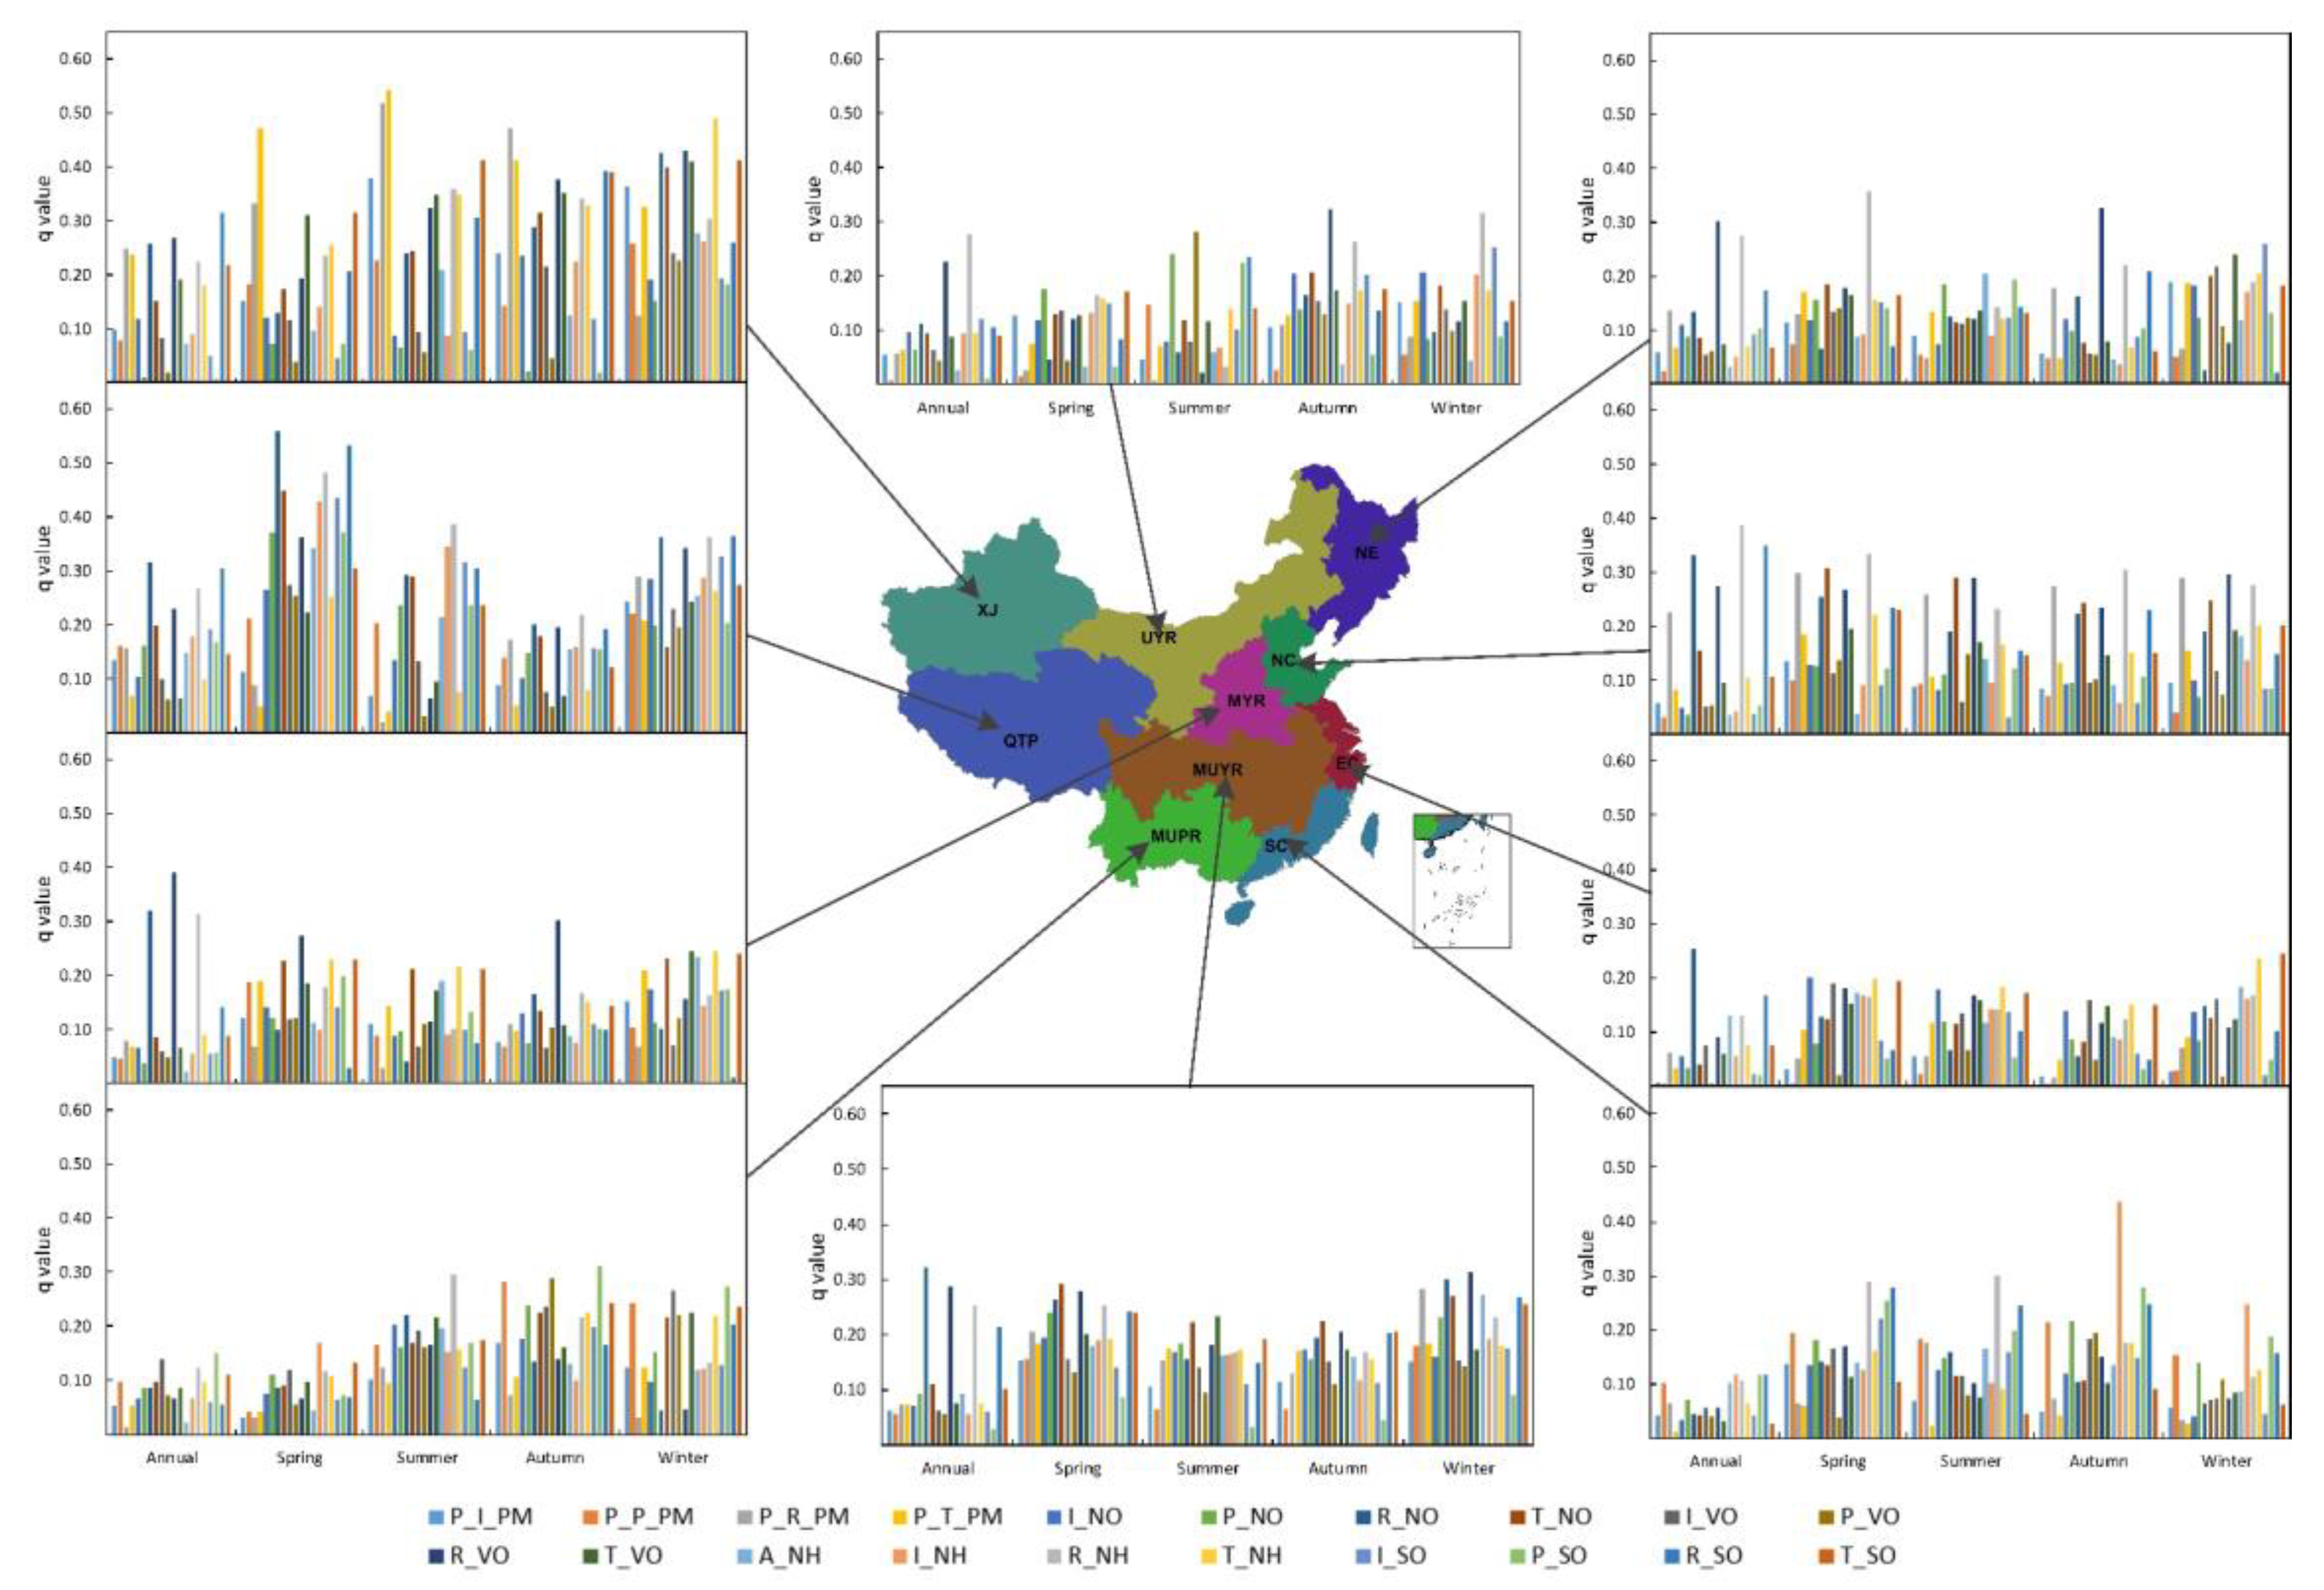
3.3. Analysis on the Regional Annual Scale

If the emission sectors are not considered, these types of anthropogenic emissions have similar effects on PM2.5 concentrations in most regions on the annual scale (except MYR and NC) (Figure S10). NH is the dominant factor of PM2.5 concentrations in NC, while P_PM and NH3 are the two main factors on PM2.5 concentrations in MYR.
If the emission sectors are taken into account, residential sources are the basic factors on PM2.5 concentrations in most Chinese urban areas (except MUPR) (Figure 3). The northern area is dominated by R_VO and R_NH, while some southern areas (EC and MUYR) are dominated by R_NO. For the XJ and QTP regions, the dominant factors affecting PM2.5 concentrations are R_SO and R_NO, respectively.

3.4. Analysis on the Regional Seasonal Scale

If the emission sectors are not considered, NH is the dominant factor in northern China and SC in spring, and NO is the dominant factor in southern EC and MUYR (Figure S10). In summer, NH is the dominant factor of PM2.5 concentrations in most northern regions (except UYR) and in southern MUYR, VO is the dominant factor in URY and SC, and SO is the dominant factor in MUPR. In autumn, P_PM is the dominant factor of PM2.5 concentrations in NE, MYR, and SC. NH is the dominant factor of PM2.5 concentrations in NC and MUYR, and the dominant factor of PM2.5 concentrations in MUPR and UYR is VO. In winter, however, NH is the dominant factor of PM2.5 concentrations in NC, MYR, XJ, EC, SC and MUYR. VO is the dominant factor of PM2.5 concentrations in MUPR and NE, and SO is the dominant factor of PM2.5 concentrations in UYR in winter.
If the emission sectors are considered, emissions from residential sources and traffic sources are the dominant factors affecting the change in PM2.5 concentrations in spring in most regions (Figure 3). NE, NC, MYR in the northern region and SC in the southern region are dominated by residential source emissions, while traffic emissions dominate in southern EC and MUYR. Similar to spring, summer residential and traffic sources remain the basic influencing factors for PM2.5 concentrations changes in most parts of the country. Among them, NC, MYR, and XJ in the north and EC and MUYR in the south are mainly due to traffic emissions, whereas residential source emissions play a leading role in the southern MUPR and SC. In autumn, residential source emissions are the dominant factor in the changes in PM2.5 concentrations in northern regions (UYR, NE, NC, MYR), with the R_VO factor being the primary influencing factor, followed by R_NH. In winter, traffic emissions are the dominant factor affecting the changes in PM2.5 concentrations in the XJ, MYR, and EC regions, whereas residential source emissions are the dominant factors in the UYR, NC, and MUYR regions.

4. Discussion

The concentrations of PM2.5 is affected by both natural and human factors, and anthropogenic emissions play an important role in its formation. Numerous studies have analyzed the formation of PM2.5 and the influencing factors of its concentrations [56,57], but few studies have focused on the impacts of these factors on PM2.5 concentrations from the perspective of sector emissions. In addition, the research results can provide a more accurate reference for formulating PM2.5 control policies. In this paper, five types of pollutants emitted by five sectors, including residential sources, power, transportation, industry, and agriculture, were selected as driving factors. Based on the GeoDetector model, the impact of emission factors on the PM2.5 concentrations at different temporal and spatial scales was analyzed. The study found obvious seasonal and regional changes in the impact of pollutant emissions from different sectors on PM2.5 concentrations in Chinese cities. These variations are due mainly to the temporal and spatial differences in the emission of different precursors and photochemical reactions. Of course, anthropogenic emissions are also the main factors influencing the temporal and spatial differences in PM2.5 concentrations in China and even at the global scale [58,59,60].
At the national scale, residential emissions are the main influencing factor of the PM2.5 concentrations changes through the whole year. This result also verifies the proposal by other researchers that residential emissions play an important and non-negligible role in air pollution control [61,62]. However, at the national seasonal scale, the main driving factors of PM2.5 concentrations show more significant changes. The impact of residential emissions on PM2.5 concentrations in autumn and winter is stronger than that in spring and summer. These differences may be due to the unfavorable meteorological conditions of the planetary boundary layer in autumn and winter, such as temperature inversion and relatively frequent weak surface wind speed; moreover, the heating of living spaces and biomass burning in autumn and winter may easily cause an increase in PM2.5 concentrations [10,11,63,64]. It is worth noting that ammonia emissions exert a stronger impact on PM2.5 in winter compared to the other three seasons regardless of whether sectoral emissions are considered. Since the emission of NH3 in winter is lower than in other seasons, its impact is also higher than in other seasons, indicating that NH3 plays a very important role in the production of PM2.5 in winter, which is consistent with previous studies [65,66]. Therefore, measures to limit NH3 emissions should be considered when reducing PM2.5 pollution in winter to achieve better pollution control effects.
At the regional scale, we found that the impact of residential emissions on PM2.5 concentrations is dominant in the northern region and part of the southern region (MUYR and EC) through the whole year. Moreover, residential emissions also play a leading role in most seasons in the northern region. This impact may be because coal combustion and biomass combustion accounted for a large proportion of residential sources in the northern region, and these sources exert a greater impact on PM2.5 concentrations, especially in spring, autumn and winter, which is consistent with existing studies [67,68,69]. In addition, the importance of residential source NH3 emissions has been neglected. Studies have shown that residential NH3 emissions exert a significant impact on PM2.5 concentrations at the regional annual scale and in most seasons in northern China. This finding is consistent with related studies. For example, NH3 emissions from urban residential sewage account for a relatively high proportion of total NH3 emissions and have an important impact on PM2.5 concentrations [39]. It is worth noting that traffic emissions play a leading role in the four seasons for MUYR and EC in southern China, MYR and NC in northern China, and on a national scale. China’s national statistics [70] show that from 1990 to 2012, the number of motor vehicles in China has increased 22 times in 22 years, and traffic emissions have become one of the largest sources of air pollution in China. On the other hand, this may be due to the fact that these areas are located in the central and eastern parts of China, with higher road network density, higher car ownership, and accelerated photochemical reactions under suitable weather conditions, which have an important impact on PM2.5 concentrations [7,71,72].
The effects of primary emissions and secondary precursors on PM2.5 concentrations have obvious differences at different temporal and spatial scales. At the annual scale, whether national or regional, primary PM2.5 emissions contribute less to the PM2.5 concentrations than secondary emissions. This finding is consistent with previous research, indicating that secondary emissions make an important contribution to PM2.5 concentrations [73]. At the national seasonal scale, the contribution of primary PM2.5 to the PM2.5 concentrations is equivalent to that of secondary emissions, and the dominant factor comes from the primary emission of PM2.5 from transport sources. However, on the regional seasonal scale, the contribution of primary PM2.5 to PM2.5 concentrations is significantly different from that of secondary precursor emissions. Therefore, when formulating PM2.5 control policies, it is necessary to consider the actual conditions of the region and use differentiated emission control policies in different regions and seasons.
This study comprehensively quantifies the impact of different sectors’ emissions on PM2.5 concentrations. The results of the study can help us understand the anthropogenic emission mechanism of PM2.5 pollution changes and provide a reference for follow-up research and the formulation of policies and measures for related sectors. However, there are some limitations. (1) Due to the uncertainties in the emission inventory adopted, our research results will also have corresponding uncertainties. Moreover, given data availability limitations, the current inventory data used is only for one year (2016); data from other years need to be analyzed in future work. (2) Given length restrictions and the previous research results that have been obtained, this article does not consider meteorological factors in its focus. In the future, it will be necessary to comprehensively consider the impact of land use/cover change, topography, and socioeconomic factors on PM2.5 concentrations. (3) Related research shows that the concentrations of PM2.5 and O3 sometimes fluctuate, which also makes it difficult to formulate pollution control policies. Future research will combine the two pollutants of PM2.5 and O3 for analysis, thereby clarifying the impact mechanisms and formulating a more accurate policy reference for the government to comprehensively control air pollution.

5. Conclusions

The results of this study show that the effects of emission factors among various sectors on PM2.5 concentrations present large regional and seasonal differences. Residential emissions were the dominant driver at the national annual scale, and also played the leading role at the regional annual scale and during most of the seasons in northern China. Residential NH3 emissions exert a significant impact on PM2.5 concentrations at the regional annual scale and in most seasons in northern China. Transportation emissions play a leading role in the four seasons for MUYR and EC in southern China, MYR and NC in northern China, and on a national scale. Compared with primary particulate matter, secondary anthropogenic precursors have a more important effect on PM2.5 concentrations at the national or regional annual scale.
The influence mechanism of pollutants discharged by different sectors on PM2.5 concentrations is more complicated, which also makes it difficult for us to clarify the contributions of various factors to PM2.5 concentrations. This study comprehensively and quantitatively assessed the impact of anthropogenic emissions from various sectors and their interactions on PM2.5 concentrations. Given the complex nonlinear relationship between PM2.5 concentrations and its influencing factors, this study will help us better understand the impact mechanism of PM2.5 pollution. Moreover, it will help researchers improve the accuracy of PM2.5 prediction models and help governments formulate more precise PM2.5 pollution control policies.

Supplementary Materials

The following are available online at https://www.mdpi.com/article/10.3390/ijerph182010869/s1, Figure S1: Ten regions in China. Figure S2: Locations of air quality monitoring stations. Figure S3: Seasonal mean PM2.5 concentrations in spring (a), summer (b), autumn (c), and winter (d) in Chinese cities (2015–2017). Figure S4: Maps of (a) primary industry PM2.5 emissions, (b) primary power PM2.5 emissions, (c) primary resident PM2.5 emissions, and (d) primary transportation PM2.5 emissions from Chinese cities with different emission sectors in 2016 with resolution of 0.25° × 0.25°. Figure S5: Maps of (a) agriculture NH3 emissions, (b) power NH3 emissions, (c) resident NH3 emissions, and (d) transportation NH3 emissions from Chinese cities with different emission sectors in 2016 with resolution of 0.25° × 0.25°. Figure S6: Maps of (a) industry NH3 emissions, (b) power NH3 emissions, (c) resident NH3 emissions, and (d) transportation NH3 emissions from Chinese cities with different emission sectors in 2016 with resolution of 0.25° × 0.25°. Figure S7: Maps of (a) industry SO2 emissions, (b) power SO2 emissions, (c) resident SO2 emissions, and (d) transportation SO2 emissions from Chinese cities with different emission sectors in 2016 with resolution of 0.25° × 0.25°. Figure S8: Maps of (a) industry VOCS emissions, (b) power VOCS emissions, (c) resident VOCS emissions, and (d) transportation VOCS emissions from Chinese cities with different emission sectors in 2016 with resolution of 0.25° × 0.25°. Figure S9: Annual and seasonal q values of driving factors for PM2.5 concentrations between PM2.5 concentrations and impacting factors at the national scale (China). P_PM denotes primary PM2.5; NO denotes NOX; VO denotes VOCs; NH denotes NH3; SO denotes SO2. Figure S10. Annual and seasonal q values of driving factors for PM2.5 concentrations between PM2.5 concentrations and impacting factors at the regional scale (China). P_PM denotes primary PM2.5; NO denotes NOX; VOCs VO denotes VOCs; NH denotes NH3; SO denotes SO2. Table S1: Effect of various anthropogenic factors with different emission sectors on PM2.5 concentrations in China in 2016. Table S2: Effect of various anthropogenic factors with different emission sectors on PM2.5 concentrations throughout the whole year at the regional scale. Table S3: Effect of various anthropogenic factors with different emission sectors on PM2.5 concentrations in spring at the regional scale. Table S4: Effect of various anthropogenic factors with different emission sectors on PM2.5 concentrations in summer at the regional scale. Table S5: Effect of various anthropogenic factors with different emission sectors on PM2.5 concentrations in autumn at the regional scale. Table S6: Effect of various anthropogenic factors with different emission sectors on PM2.5 concentrations in winter at the regional scale.

Author Contributions

Conceptualization, H.S.; methodology, H.S. and P.L.; software, P.L. and J.Y.; validation, P.L. and F.W.; formal analysis, P.L. and X.L.; investigation, P.L. and W.W.; resources, H.S. and Y.X.; data curation, P.L.; writing—original draft preparation, J.Y. and P.L.; writing—review and editing, P.L. and H.S.; visualization, J.Y. and M.Z.; supervision, C.M. All authors have read and agreed to the published version of the manuscript.

Funding

This research was funded by the Natural Science Foundation of China (41401107) and the Basic and Frontier Technology Research Project of Henan Province, China (162300410132), and the Higher Education Research Project of Henan Province, China (17B170003).

Institutional Review Board Statement

The studies not involving humans or animals. So ethical review and approval were not applicable for this study.

Informed Consent Statement

Informed consent obtained from all subjects or patient consent was waived are not applicable for studies not involving humans.

Conflicts of Interest

The authors declare no conflict of interest.

Abbreviations

PM2.5fine particulate matter
NOxnitrogen oxides
VOCsvolatile organic compounds
SO2sulfur dioxide
NH3ammonia
UYRthe upper zone of the Yellow River
MUPRthe middle and upper zone of the Pearl River
MYRthe middle zone of the Yellow River
NCthe northern coastal zone
NEthe northeast zone
MUYRthe middle and upper zone of the Yangtze River
SCthe southeast coastal zone
XJthe Xinjiang zone
QTPthe Qinghai-Tibetan Plateau
ECthe eastern coastal area

References

  1. Jerrett, M. Atmospheric science: The death toll from air-pollution sources. Nature 2015, 525, 330–331. [Google Scholar] [CrossRef] [PubMed] [Green Version]
  2. Pui, D.Y.H.; Chen, S.-C.; Zuo, Z. PM2.5 in China: Measurements, sources, visibility and health effects, and mitigation. Particuology 2014, 13, 1–26. [Google Scholar] [CrossRef]
  3. Watson, T. Environment: Breathing trouble. Nature 2014, 513, S14–S15. [Google Scholar]
  4. Patz, J.A.; Campbell-Lendrum, D.; Holloway, T.; Foley, J.A. Impact of regional climate change on human health. Nature 2005, 438, 310–317. [Google Scholar] [CrossRef]
  5. Lim, S.S.; Vos, T.; Flaxman, A.D.; Danaei, G.; Shibuya, K.; Adair-Rohani, H.; Amann, M.; Anderson, H.R.; Andrews, K.G.; Aryee, M.; et al. A comparative risk assessment of burden of disease and injury attributable to 67 risk factors and risk factor clusters in 21 regions, 1990-2010: A systematic analysis for the Global Burden of Disease Study 2010. Lancet 2012, 380, 2224–2260. [Google Scholar] [CrossRef] [Green Version]
  6. Zhang, Q.; Zheng, Y.; Tong, D.; Shao, M.; Wang, S.; Zhang, Y.; Xu, X.; Wang, J.; He, H.; Liu, W.; et al. Drivers of improved PM2.5 air quality in China from 2013 to 2017. Proc. Natl. Acad. Sci. USA 2019, 116, 24463–24469. [Google Scholar] [CrossRef] [Green Version]
  7. Guo, S.; Hu, M.; Zamora, M.L.; Peng, J.; Shang, D.; Zheng, J.; Du, Z.; Wu, Z.; Shao, M.; Zeng, L.; et al. Elucidating severe urban haze formation in China. Proc. Natl. Acad. Sci. USA 2014, 111, 17373–17378. [Google Scholar] [CrossRef] [PubMed] [Green Version]
  8. Zhang, Q.; He, K.; Huo, H. Cleaning China’s air. Nature 2012, 484, 161–162. [Google Scholar] [CrossRef]
  9. Chen, Z.; Chen, D.; Zhao, C.; Kwan, M.p.; Cai, J.; Zhuang, Y.; Zhao, B.; Wang, X.; Chen, B.; Yang, J.; et al. Influence of meteorological conditions on PM2.5 concentrations across China: A review of methodology and mechanism. Environ. Int. 2020, 139, 105558. [Google Scholar] [CrossRef]
  10. Li, X.; Song, H.; Zhai, S.; Lu, S.; Kong, Y.; Xia, H.; Zhao, H. Particulate matter pollution in Chinese cities: Areal-temporal variations and their relationships with meteorological conditions (2015–2017). Environ. Pollut. 2019, 246, 11–18. [Google Scholar] [CrossRef]
  11. Tai, A.P.K.; Mickley, L.J.; Jacob, D.J. Correlations between fine particulate matter (PM2.5) and meteorological variables in the United States: Implications for the sensitivity of PM2.5 to climate change. Atmos. Environ. 2010, 44, 3976–3984. [Google Scholar] [CrossRef]
  12. Megaritis, A.G.; Fountoukis, C.; Charalampidis, P.E.; Denier Van Der Gon, H.A.C.; Pilinis, C.; Pandis, S.N. Linking climate and air quality over Europe: Effects of meteorology on PM2.5 concentrations. Atmos. Chem. Phys. 2014, 14, 10283–10298. [Google Scholar] [CrossRef] [Green Version]
  13. Mahapatra, P.S.; Sinha, P.R.; Boopathy, R.; Das, T.; Mohanty, S.; Sahu, S.C.; Gurjar, B.R. Seasonal progression of atmospheric particulate matter over an urban coastal region in peninsular India: Role of local meteorology and long-range transport. Atmos. Res. 2018, 199, 145–158. [Google Scholar] [CrossRef]
  14. Galindo, N.; Varea, M.; Gil-Moltó, J.; Yubero, E.; Nicolás, J. The Influence of Meteorology on Particulate Matter Concentrations at an Urban Mediterranean Location. Water Air Soil Pollut. 2011, 215, 365–372. [Google Scholar] [CrossRef]
  15. Hien, P.D.; Bac, V.T.; Tham, H.C.; Nhan, D.D.; Vinh, L.D. Influence of meteorological conditions on PM2.5 and PM2.5−10 concentrations during the monsoon season in Hanoi, Vietnam. Atmos. Environ. 2002, 36, 3473–3484. [Google Scholar] [CrossRef]
  16. Jacob, D.J.; Winner, D.A. Effect of climate change on air quality. Atmos. Environ. 2009, 43, 51–63. [Google Scholar] [CrossRef] [Green Version]
  17. He, J.; Gong, S.; Yu, Y.; Yu, L.; Wu, L.; Mao, H.; Song, C.; Zhao, S.; Liu, H.; Li, X.; et al. Air pollution characteristics and their relation to meteorological conditions during 2014–2015 in major Chinese cities. Environ. Pollut. 2017, 223, 484–496. [Google Scholar] [CrossRef]
  18. Li, J.; Chen, H.; Li, Z.; Wang, P.; Cribb, M.; Fan, X. Low-level temperature inversions and their effect on aerosol condensation nuclei concentrations under different large-scale synoptic circulations. Adv. Atmos. Sci. 2015, 32, 898–908. [Google Scholar] [CrossRef]
  19. Trinh, T.T.; Trinh, T.T.; Le, T.T.; Nguyen, T.D.H.; Tu, B.M. Temperature inversion and air pollution relationship, and its effects on human health in Hanoi City, Vietnam. Environ. Geochem. Health 2019, 41, 929–937. [Google Scholar] [CrossRef]
  20. Cheng, Y.; He, K.; Du, Z.Y.; Zheng, M.; Duan, F.K.; Ma, Y.L. Humidity plays an important role in the PM2.5 pollution in Beijing. Environ. Pollut. 2015, 197, 68–75. [Google Scholar] [CrossRef]
  21. Trivedi, D.K.; Ali, K.; Beig, G. Impact of meteorological parameters on the development of fine and coarse particles over Delhi. Sci. Total Environ. 2014, 478, 175–183. [Google Scholar] [CrossRef] [PubMed]
  22. Yin, Q.; Wang, J.; Hu, M.; Wong, H. Estimation of daily PM2.5 concentration and its relationship with meteorological conditions in Beijing. J. Environ. Sci. (China) 2016, 48, 161–168. [Google Scholar] [CrossRef] [PubMed]
  23. Fleming, Z.L.; Monks, P.S.; Manning, A.J. Review: Untangling the influence of air-mass history in interpreting observed atmospheric composition. Atmos. Res. 2012, 104–105, 1–39. [Google Scholar] [CrossRef] [Green Version]
  24. Guo, L.C.; Zhang, Y.; Lin, H.; Zeng, W.; Liu, T.; Xiao, J.; Rutherford, S.; You, J.; Ma, W. The washout effects of rainfall on atmospheric particulate pollution in two Chinese cities. Environ. Pollut. 2016, 215, 195–202. [Google Scholar] [CrossRef]
  25. Li, X.; Ma, Y.; Wang, Y.; Liu, N.; Hong, Y. Temporal and spatial analyses of particulate matter (PM10 and PM2.5) and its relationship with meteorological parameters over an urban city in northeast China. Atmos. Res. 2017, 198, 185–193. [Google Scholar] [CrossRef]
  26. Zheng, C.; Zhao, C.; Zhu, Y.; Wang, Y.; Shi, X.; Wu, X.; Chen, T.; Wu, F.; Qiu, Y. Analysis of influential factors for the relationship between PM2.5 and AOD in Beijing. Atmos. Chem. Phys. 2017, 17, 13473–13489. [Google Scholar] [CrossRef] [Green Version]
  27. Wu, P.; Ding, Y.; Liu, Y. Atmospheric circulation and dynamic mechanism for persistent haze events in the Beijing–Tianjin–Hebei region. Adv. Atmos. Sci. 2017, 34, 429–440. [Google Scholar] [CrossRef] [Green Version]
  28. Yang, X.; Zhao, C.; Zhou, L.; Wang, Y.; Liu, X. Distinct impact of different types of aerosols on surface solar radiation in China. J. Geophys. Res. Atmos. 2016, 121, 6459–6471. [Google Scholar] [CrossRef]
  29. Liu, P.; Song, H.; Wang, T.; Wang, F.; Li, X.; Miao, C.; Zhao, H. Effects of meteorological conditions and anthropogenic precursors on ground-level ozone concentrations in Chinese cities. Environ. Pollut. 2020, 262, 114366. [Google Scholar] [CrossRef]
  30. Ang-Olson, J.; Fischer, M.; Dulla, R. Land Use as an Air Quality Control Measure: Review of Current Practice and Examination of Policy Options. Transp. Res. Rec. 2000, 1738, 33–38. [Google Scholar] [CrossRef]
  31. Ooi, M.C.G.; Chan, A.; Ashfold, M.J.; Oozeer, M.Y.; Morris, K.I.; Kong, S.S.K. The role of land use on the local climate and air quality during calm inter-monsoon in a tropical city. Geosci. Front. 2019, 10, 405–415. [Google Scholar] [CrossRef]
  32. Shi, Y.; Bilal, M.; Ho, H.C.; Omar, A. Urbanization and regional air pollution across South Asian developing countries–A nationwide land use regression for ambient PM2.5 assessment in Pakistan. Environ. Pollut. 2020, 266, 115145. [Google Scholar] [CrossRef]
  33. Han, L.; Zhou, W.; Li, W.; Qian, Y. Urbanization strategy and environmental changes: An insight with relationship between population change and fine particulate pollution. Sci. Total Environ. 2018, 642, 789–799. [Google Scholar] [CrossRef] [PubMed]
  34. Ferm, M.; Sjöberg, K. Concentrations and emission factors for PM2.5 and PM10 from road traffic in Sweden. Atmos. Environ. 2015, 119, 211–219. [Google Scholar] [CrossRef]
  35. Li, G.; Fang, C.; Wang, S.; Sun, S. The Effect of Economic Growth, Urbanization, and Industrialization on Fine Particulate Matter (PM2.5) Concentrations in China. Environ. Sci. Technol. 2016, 50, 11452–11459. [Google Scholar] [CrossRef] [PubMed]
  36. Ma, Y.R.; Ji, Q.; Fan, Y. Spatial linkage analysis of the impact of regional economic activities on PM2.5 pollution in China. J. Clean. Prod. 2016, 139, 1157–1167. [Google Scholar] [CrossRef]
  37. Wang, T.; Zhang, L.; Zhou, S.; Zhang, T.; Zhai, S.; Yang, Z.; Wang, D.; Song, H. Effects of ground-level ozone pollution on yield and economic losses of winter wheat in Henan, China. Atmos. Environ. 2021, 262, 118654. [Google Scholar] [CrossRef]
  38. Blanchard, C.L.; Shaw, S.L.; Edgerton, E.S.; Schwab, J.J. Emission influences on air pollutant concentrations in New York state: II. PM2.5 organic and elemental carbon constituents. Atmos. Environ. X 2019, 3, 100039. [Google Scholar] [CrossRef]
  39. Hsu, C.-H.; Cheng, F.-Y.; Chang, H.-Y.; Lin, N.-H. Implementation of a dynamical NH3 emissions parameterization in CMAQ for improving PM2.5 simulation in Taiwan. Atmos. Environ. 2019, 218, 116923. [Google Scholar] [CrossRef]
  40. Backes, A.M.; Aulinger, A.; Bieser, J.; Matthias, V.; Quante, M. Ammonia emissions in Europe, part II: How ammonia emission abatement strategies affect secondary aerosols. Atmos. Environ. 2016, 126, 153–161. [Google Scholar] [CrossRef] [Green Version]
  41. Bittman, S.; Jones, K.; Vingarzan, R.; Hunt, D.E.; Sheppard, S.C.; Tait, J.; So, R.; Zhao, J. Weekly agricultural emissions and ambient concentrations of ammonia: Validation of an emission inventory. Atmos. Environ. 2015, 113, 108–117. [Google Scholar] [CrossRef]
  42. Trail, M.; Tsimpidi, A.P.; Liu, P.; Tsigaridis, K.; Hu, Y.; Nenes, A.; Stone, B.; Russell, A.G. Reforestation and crop land conversion impacts on future regional air quality in the Southeastern U.S. Agric. For. Meteorol. 2015, 209–210, 78–86. [Google Scholar] [CrossRef]
  43. Tao, W.T.; Liu, J.; Ban-Weiss, G.A.; Hauglustaine, D.A.; Zhang, L.; Zhang, Q.; Cheng, Y.; Yu, Y. Effects of urban land expansion on the regional meteorology and air quality of eastern China. Atmos. Chem. Phys. 2015, 15, 10299–11034. [Google Scholar] [CrossRef]
  44. Kocifaj, M.; Barentine, J.C. Air pollution mitigation can reduce the brightness of the night sky in and near cities. Sci. Rep. 2021, 11, 1–10. [Google Scholar] [CrossRef]
  45. Wang, X.; Tian, G.; Yang, D.; Zhang, W.; Lu, D.; Liu, Z. Responses of PM2.5 pollution to urbanization in China. Energy Policy 2018, 123, 602–610. [Google Scholar] [CrossRef]
  46. Zhou, C.; Chen, J.; Wang, S. Examining the effects of socioeconomic development on fine particulate matter (PM2.5) in China’s cities using spatial regression and the geographical detector technique. Sci. Total Environ. 2018, 619–620, 436–445. [Google Scholar] [CrossRef] [PubMed]
  47. Sun, L.; Wei, J.; Duan, D.H.; Guo, Y.M.; Yang, D.X.; Jia, C.; Mi, X.T.; Mi, L.S.; Wei, J.; Duan, D.H.; et al. Impact of Land-Use and Land-Cover Change on urban air quality in representative cities of China. J. Atmos. Sol.-Terr. Phys. 2016, 142, 43–54. [Google Scholar] [CrossRef]
  48. McCarty, J.; Kaza, N. Urban form and air quality in the United States. Landsc. Urban Plan. 2015, 139, 168–179. [Google Scholar] [CrossRef]
  49. Penrod, A.; Zhang, Y.; Wang, K.; Wu, S.Y.; Leung, L.R. Impacts of future climate and emission changes on U.S. air quality. Atmos. Environ. 2014, 89, 533–547. [Google Scholar] [CrossRef]
  50. Jing, Z.; Liu, P.; Wang, T.; Song, H.; Lee, J.; Xu, T.; Xing, Y. Effects of meteorological factors and anthropogenic precursors on PM2.5 concentrations in cities in China. Sustainability 2020, 12, 3550. [Google Scholar] [CrossRef]
  51. Sá, E.; Martins, H.; Ferreira, J.; Marta-Almeida, M.; Rocha, A.; Carvalho, A.; Freitas, S.; Borrego, C. Climate change and pollutant emissions impacts on air quality in 2050 over Portugal. Atmos. Environ. 2016, 131, 209–224. [Google Scholar] [CrossRef]
  52. Liu, Y. A Study on Zoning “New Three Macro-Regional Development Zones” of Regional Economy of China. Acta Geogr. Sin. 2005, 60, 361–370. [Google Scholar]
  53. Wang, J.; Xu, C. Geodector:principle and prospective. Acta Geogr. Sin. 2017, 72, 116–134. [Google Scholar]
  54. Wang, J.F.; Zhang, T.L.; Fu, B.J. A measure of spatial stratified heterogeneity. Ecol. Indic. 2016, 67, 250–256. [Google Scholar] [CrossRef]
  55. Wang, J.F.; Hu, Y. Environmental health risk detection with GeogDetector. Environ. Model. Softw. 2012, 33, 114–115. [Google Scholar] [CrossRef]
  56. Wang, S.; Zhou, C.; Wang, Z.; Feng, K.; Hubacek, K. The characteristics and drivers of fine particulate matter (PM2.5) distribution in China. J. Clean. Prod. 2017, 142, 1800–1809. [Google Scholar] [CrossRef]
  57. Yang, D.; Wang, X.; Xu, J.; Xu, C.; Lu, D.; Ye, C.; Wang, Z.; Bai, L. Quantifying the influence of natural and socioeconomic factors and their interactive impact on PM2.5 pollution in China. Environ. Pollut. 2018, 241, 475–483. [Google Scholar] [CrossRef]
  58. Zhang, Q.; Tong, P.; Liu, M.; Lin, H.; Yun, X.; Zhang, H.; Tao, W.; Liu, J.; Wang, S.; Tao, S.; et al. A WRF-Chem model-based future vehicle emission control policy simulation and assessment for the Beijing-Tianjin-Hebei region, China. J. Environ. Manag. 2020, 253, 109751. [Google Scholar] [CrossRef]
  59. Ma, T.; Duan, F.; He, K.; Qin, Y.; Tong, D.; Geng, G.; Liu, X.; Li, H.; Yang, S.; Ye, S.; et al. Air pollution characteristics and their relationship with emissions and meteorology in the Yangtze River Delta region during 2014–2016. J. Environ. Sci. 2019, 83, 8–20. [Google Scholar] [CrossRef]
  60. Liu, Q.; Wang, S.; Zhang, W.; Li, J.; Dong, G. The effect of natural and anthropogenic factors on PM2.5: Empirical evidence from Chinese cities with different income levels. Sci. Total Environ. 2019, 653, 157–167. [Google Scholar] [CrossRef] [PubMed]
  61. Zhu, J.L.; Denise, L.M.; Qi, C.; Qiang, Z.; Yu, S.; Wei, P.; Zbigniew, K.; Xinghua, Q.; Shiqiu, Z.; Min, H.; et al. Air pollutant emissions from Chinese households: A major and underappreciated ambient pollution source. Proc. Natl. Acad. Sci. USA 2016, 113, 7756–7761. [Google Scholar]
  62. Chafe, Z.A.; Brauer, M.; Klimont, Z.; Dingenen, R.; Mehta, S.; Rao, S.; Riahi, K.; Dentener, F.; Smith, K.R. Household cooking with solid fuels contributes to ambient PM2.5 air pollution and the burden of disease. Environ. Health Perspect. 2014, 122, 1314–1320. [Google Scholar] [CrossRef] [Green Version]
  63. Xu, Y.; Xue, W.; Lei, Y.; Huang, Q.; Zhao, Y.; Cheng, S.; Ren, Z.; Wang, J. Spatiotemporal variation in the impact of meteorological conditions on PM2.5 pollution in China from 2000 to 2017. Atmos. Environ. 2020, 223, 117215. [Google Scholar] [CrossRef]
  64. Li, M.; Wang, L.; Liu, J.; Gao, W.; Song, T.; Sun, Y.; Li, L.; Li, X.; Wang, Y.; Liu, L.; et al. Exploring the regional pollution characteristics and meteorological formation mechanism of PM2.5 in North China during 2013–2017. Environ. Int. 2020, 134, 105283. [Google Scholar] [CrossRef]
  65. Wu, Y.; Gu, B.; Erisman, J.W.; Reis, S.; Fang, Y.; Lu, X.; Zhang, X. PM2.5 pollution is substantially affected by ammonia emissions in China. Environ. Pollut. 2016, 218, 86–94. [Google Scholar] [CrossRef] [PubMed] [Green Version]
  66. Li, L.; Kumar, M.; Zhu, C.; Zhong, J.; Francisco, J.S.; Zeng, X.C. Near-Barrierless Ammonium Bisulfate Formation via a Loop-Structure Promoted Proton-Transfer Mechanism on the Surface of Water. J. Am. Chem. Soc. 2016, 138, 1816–1819. [Google Scholar] [CrossRef] [PubMed] [Green Version]
  67. Shen, G.; Ru, M.; Du, W.; Zhu, X.; Zhong, Q.; Chen, Y.; Shen, H.; Yun, X.; Meng, W.; Liu, J.; et al. Impacts of air pollutants from rural Chinese households under the rapid residential energy transition. Nat. Commun. 2019, 10, 1–8. [Google Scholar] [CrossRef] [Green Version]
  68. Timmermans, R.; Kranenburg, R.; Manders, A.; Hendriks, C.; Segers, A.; Dammers, E.; Zhang, Q.; Wang, L.; Liu, Z.; Zeng, L.; et al. Source apportionment of PM2.5 across China using LOTOS-EUROS. Atmos. Environ. 2017, 164, 370–386. [Google Scholar] [CrossRef]
  69. Xiao, Q.; Ma, Z.; Li, S.; Liu, Y. The impact of winter heating on air pollution in China. PLoS ONE 2015, 10, e0117311. [Google Scholar] [CrossRef] [Green Version]
  70. Statistics, N.B.O. China Energy Statistical Yearbook (2000–2012); China Statistics Press: Beijing, China, 2012. [Google Scholar]
  71. Wang, H.; He, X.; Liang, X.; Choma, E.F.; Liu, Y.; Shan, L.; Zheng, H.; Zhang, S.; Nielsen, C.P.; Wang, S.; et al. Health benefits of on-road transportation pollution control programs in China. Proc. Natl. Acad. Sci. USA 2020, 117, 25370–25377. [Google Scholar] [CrossRef]
  72. Wu, Y.; Zhang, S.; Hao, J.; Liu, H.; Wu, X.; Hu, J.; Walsh, M.P.; Wallington, T.J.; Zhang, K.M.; Stevanovic, S. On-road vehicle emissions and their control in China: A review and outlook. Sci. Total Environ. 2017, 574, 332–349. [Google Scholar] [CrossRef] [PubMed] [Green Version]
  73. Huang, R.-J.; Zhang, Y.; Bozzetti, C.; Ho, K.-F.; Cao, J.-J.; Han, Y.; Daellenbach, K.R.; Slowik, J.G.; Platt, S.M.; Canonaco, F.; et al. High secondary aerosol contribution to particulate pollution during haze events in China. Nature 2014, 514, 218–222. [Google Scholar] [CrossRef] [Green Version]
Figure 1. Maps of (a) annual average concentrations of PM2.5 (2015–2017) and (b) primary PM2.5 emissions, (c) NOX emissions, (d) SO2 emissions, (e) NH3 emissions, and (f) VOCS emissions from Chinese cities in 2016 with a resolution of 0.25 × 0.25.
Ijerph 18 10869 g001
Figure 2. The q value of the driving factor on the national annual and seasonal scales. (P_I_PM denotes primary industry PM2.5; P_P_PM denotes primary power PM2.5; P_R_PM denotes primary residential PM2.5; P_T_PM denotes primary transportation PM2.5; I_NO denotes industrial NOX; P_NO denotes power NOX; R_NO denotes residential NOX; T_NO denotes transportation NOX; I_VO denotes industry VOCS; P_VO denotes power VOCS; R_VO denotes residential VOCS; T_VO denotes transportation VOCS; A_NH denotes agricultural NH3; I_NH denotes industrial NH3; R_NH denotes residential NH3; T_NH denotes transportation NH3; I_SO denotes industrial SO2; and P_SO denotes power SO2).
Ijerph 18 10869 g002
Figure 3. The q value of the driving factor on the regional annual and seasonal scales. (P_I_PM denotes primary industry PM2.5; P_P_PM denotes primary power PM2.5; P_R_PM denotes primary residential PM2.5; P_T_PM denotes primary transportation PM2.5; I_NO denotes industrial NOX; P_NO denotes power NOX; R_NO denotes residential NOX; T_NO denotes transportation NOX; I_VO denotes industry VOCS; P_VO denotes power VOCS; R_VO denotes residential VOCS; T_VO denotes transportation VOCS; A_NH denotes agricultural NH3; I_NH denotes industrial NH3; R_NH denotes residential NH3; T_NH denotes transportation NH3; I_SO denotes industrial SO2; and P_SO denotes power SO2).
Ijerph 18 10869 g003
Publisher’s Note: MDPI stays neutral with regard to jurisdictional claims in published maps and institutional affiliations.

