
Does Self-Assessed Health Reflect the True Health State?


Abstract
:1. Introduction
2. Materials and Methods
- Age in years;
- Gender (1 = female; 0 = male);
- Marital status (1 = yes; 0 = otherwise);
- Level of education (1 = incomplete secondary, 2 = secondary level completed with or without vocational training, and 3 = higher education);
- Settlement of residence (1 = village, 2 = urban/small town, and 3 = city);
- Working status (1 = employed; 0 = otherwise); and
- Had an episode of acute illness during the last 12 months (1 = yes; 0 = otherwise).
- Duration in years of suffering with chronic disease;
- Duration in years of disability;
- Age in years;
- Gender (1 = female; 0 = male);
- Marital status (1 = yes; 0 = no);
- Socioeconomic position (SEP; 1 = above median income; 0 = otherwise); and
- Overall life satisfaction (1 = satisfied; 0 = otherwise), which is a control variable for possible systematic bias in the self-reported responses.
3. Results
4. Discussion
5. Conclusions
Author Contributions
Funding
Institutional Review Board Statement
Informed Consent Statement
Data Availability Statement
Acknowledgments
Conflicts of Interest
Appendix A

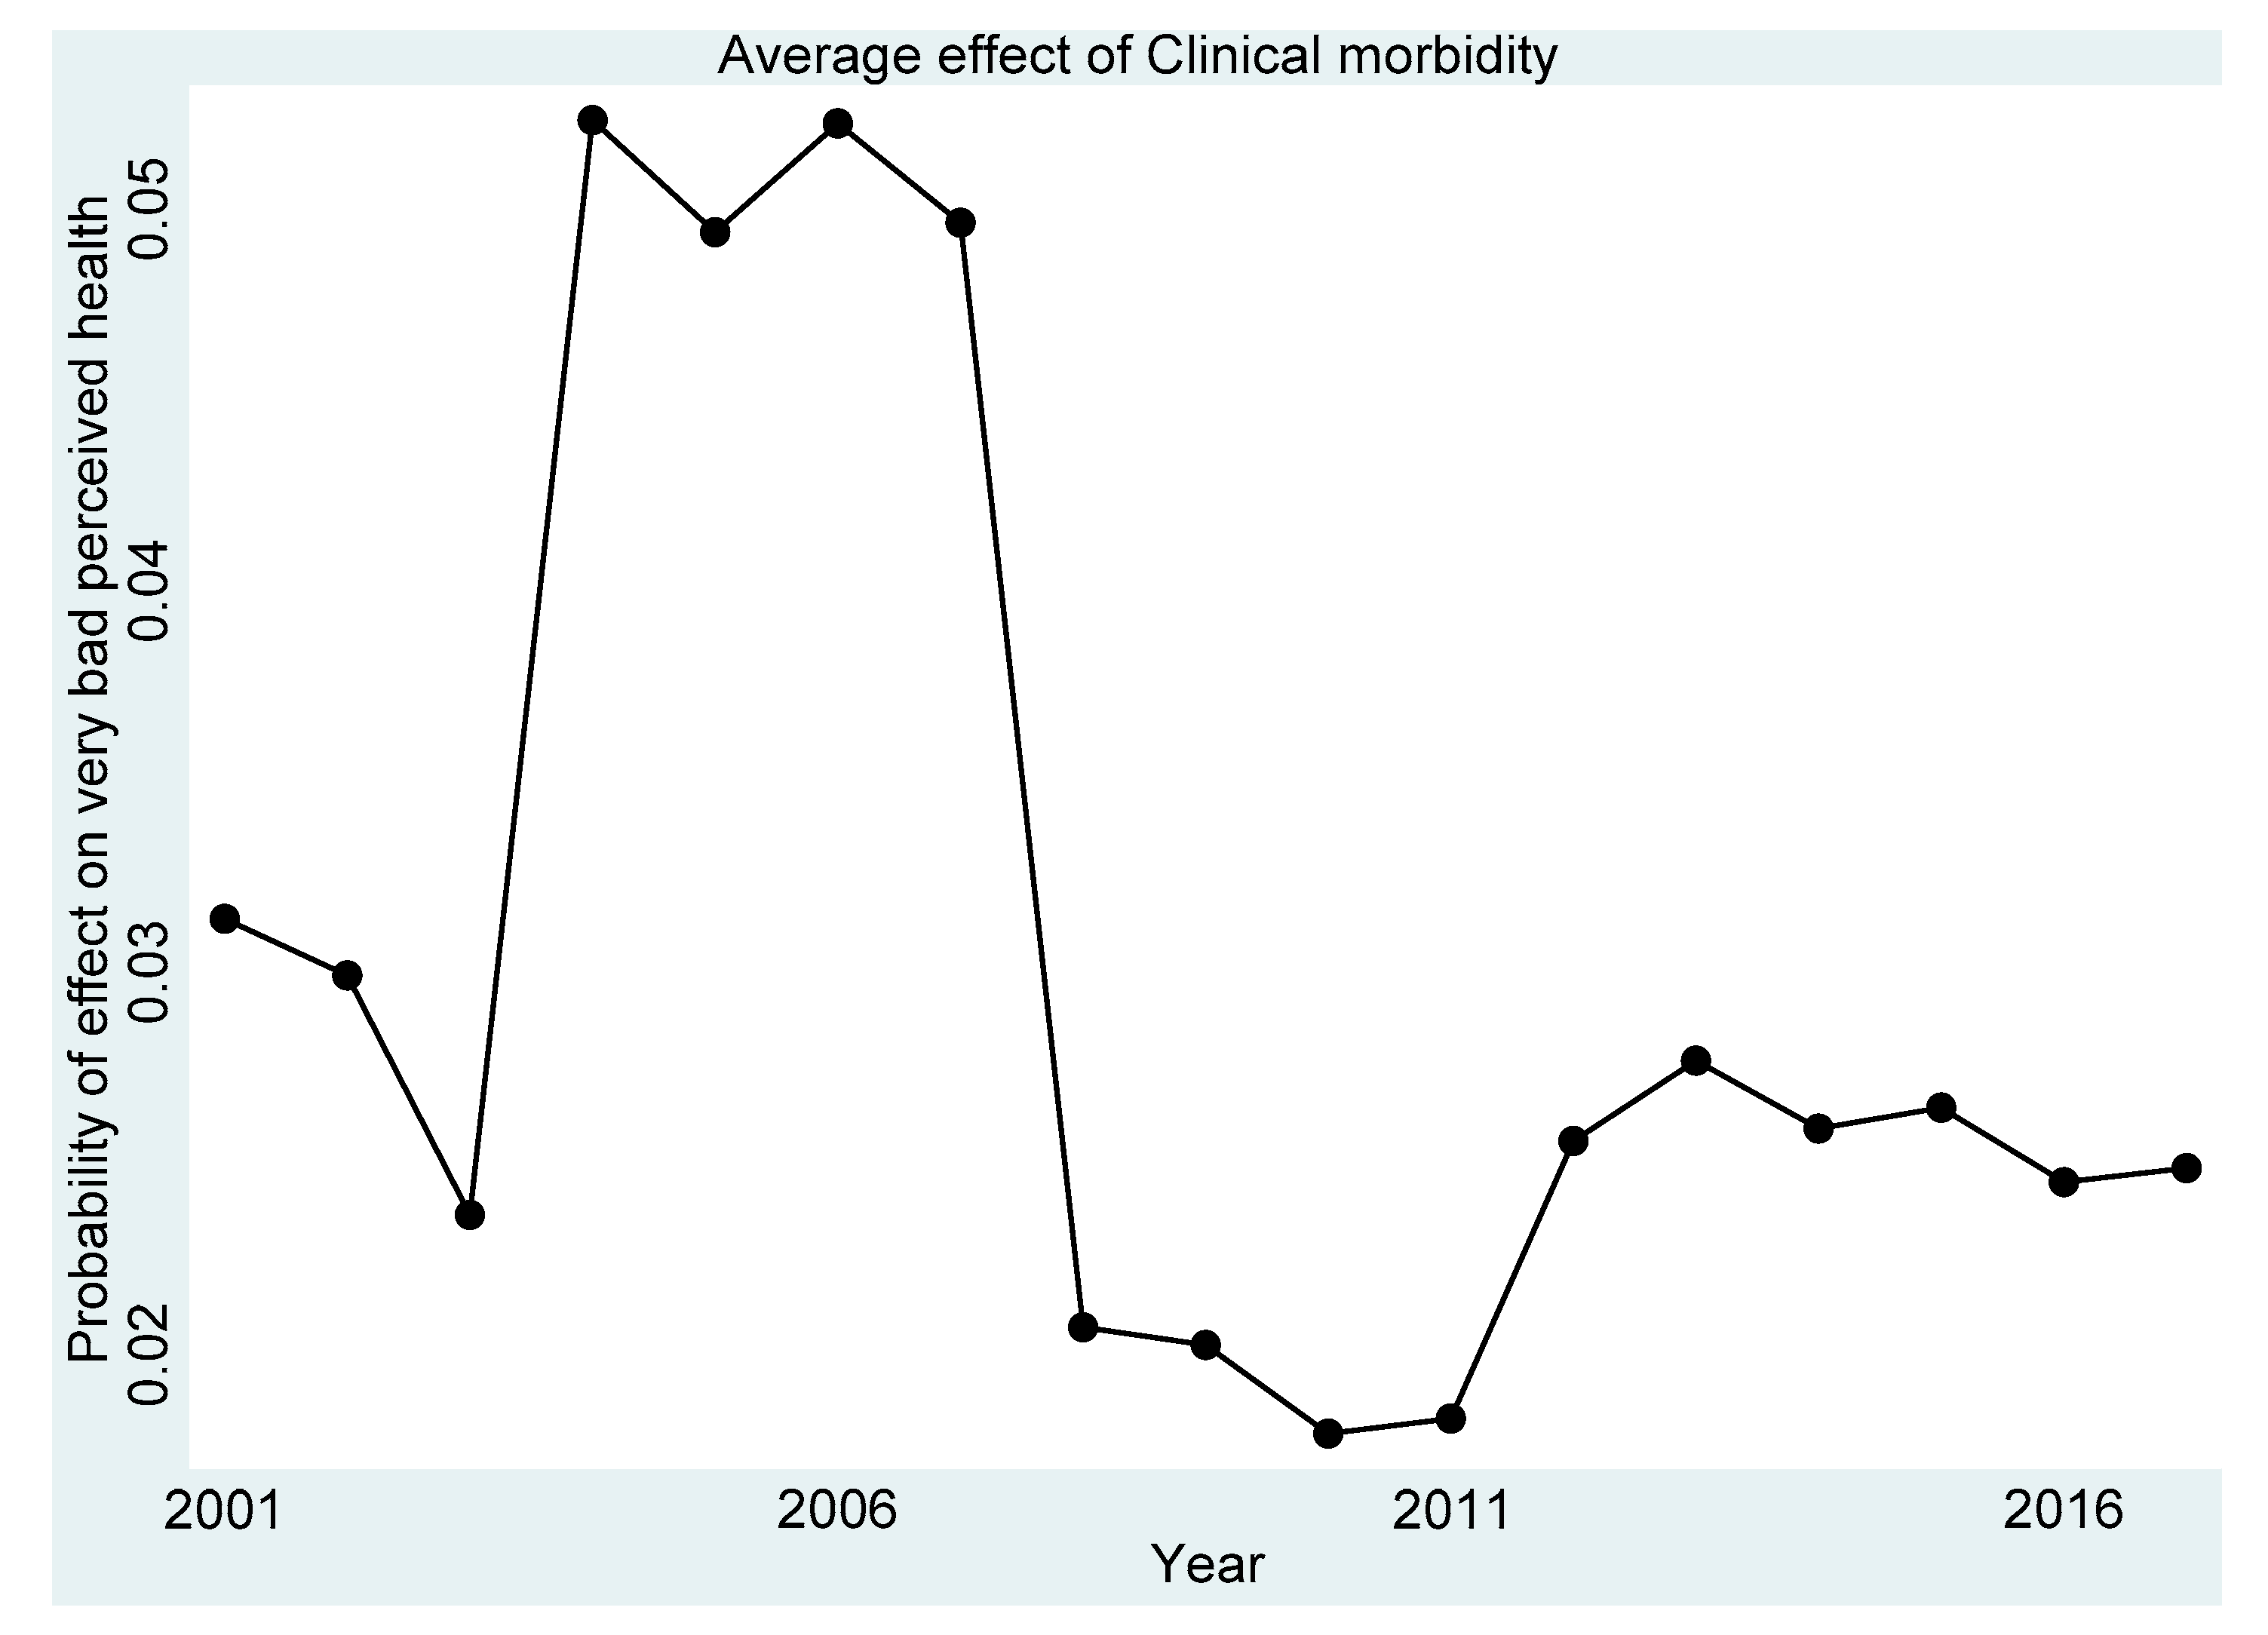
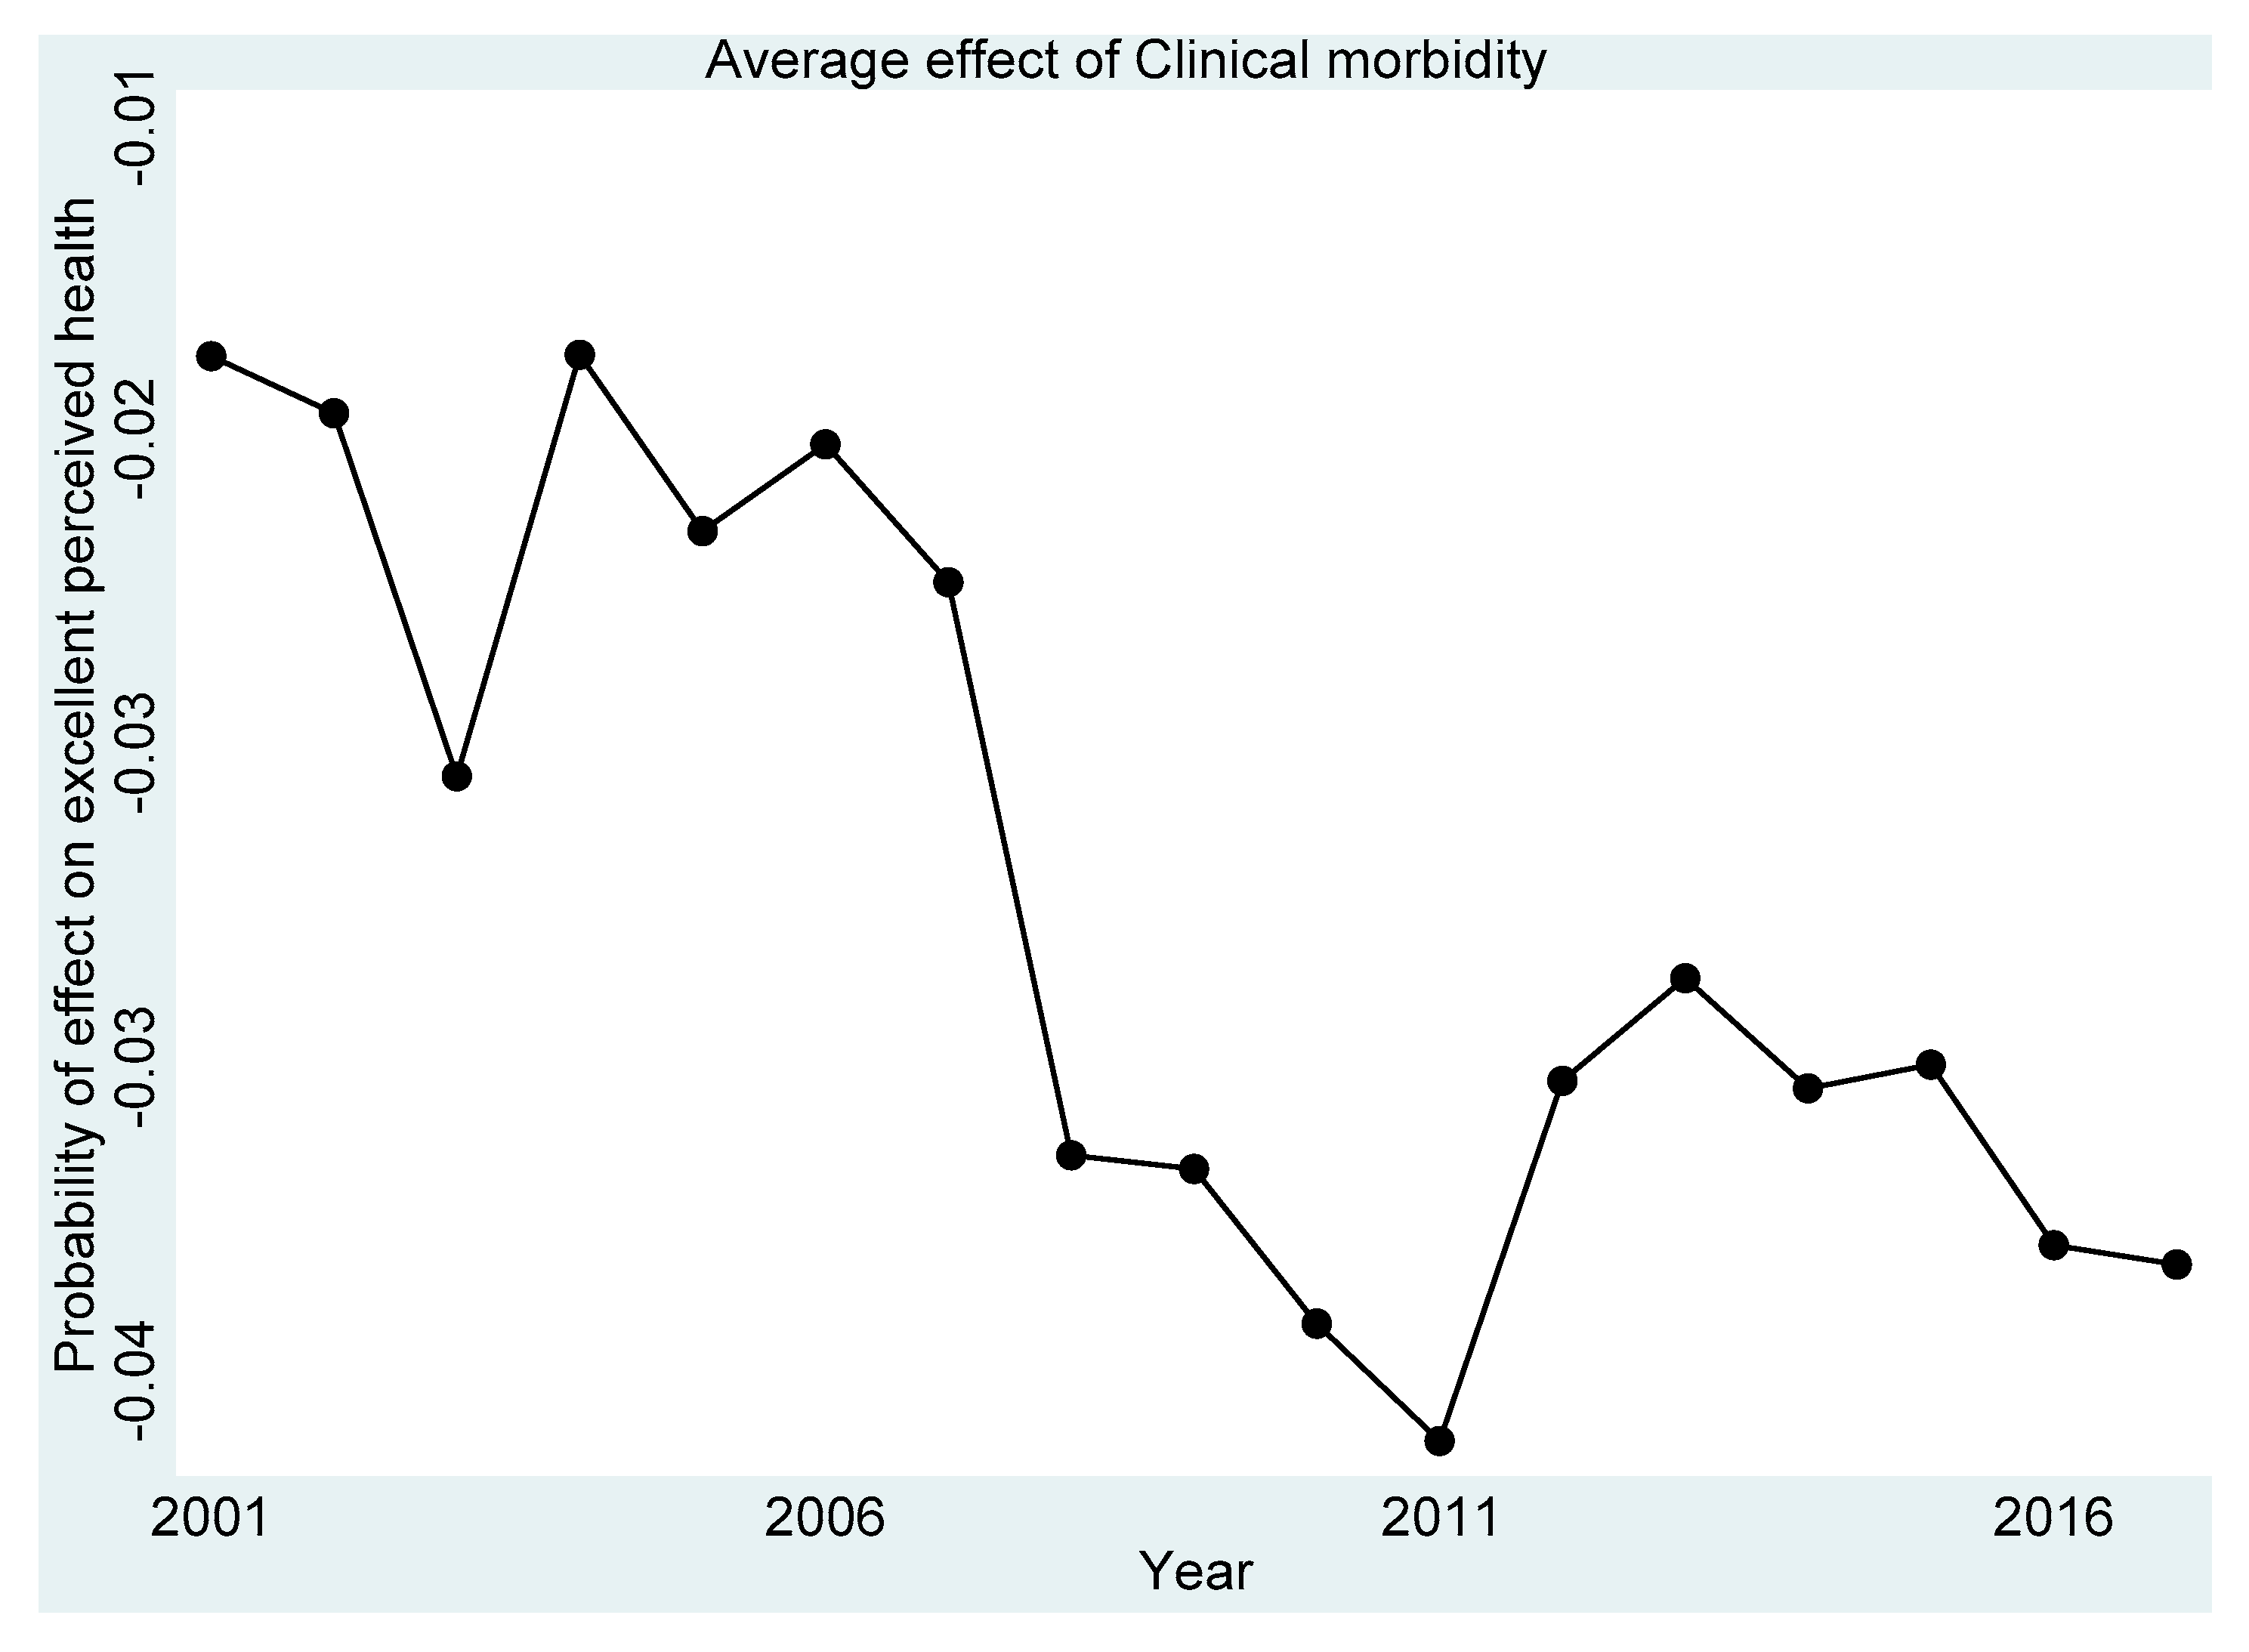
| Marginal Effect of Clinical Morbidity | 2001 | 2002 | 2003 | 2004 | 2005 | 2006 | 2007 | 2008 | 2009 | 2010 | 2011 | 2012 | 2013 | 2014 | 2015 | 2016 | 2017 |
|---|---|---|---|---|---|---|---|---|---|---|---|---|---|---|---|---|---|
| Pr(perceived health status ≤ very bad), perceived health status = very bad | 0.015 (0.000) | 0.016 (0.000) | 0.014 (0.000) | 0.014 (0.000) | 0.013 (0.000) | 0.014 (0.000) | 0.013 (0.000) | 0.013 (0.000) | 0.012 (0.000) | 0.012 (0.000) | 0.011 (0.000) | 0.012 (0.000) | 0.013 (0.000) | 0.012 (0.000) | 0.012 (0.000) | 0.011 (0.000) | 0.011 (0.000) |
| Pr(very bad < perceived health status ≤ bad), perceived health status = bad | 0.067 (0.002) | 0.070 (0.002) | 0.063 (0.002) | 0.065 (0.001) | 0.061 (0.001) | 0.063 (0.001) | 0.061 (0.001) | 0.059 (0.002) | 0.058 (0.002) | 0.056 (0.001) | 0.054 (0.001) | 0.058 (0.001) | 0.059 (0.001) | 0.057 (0.001) | 0.056 (0.001) | 0.053 (0.001) | 0.053 (0.001) |
| Pr(bad < perceived health status ≤ average), perceived health status = average | 0.178 (0.004) | 0.172 (0.004) | 0.185 (0.004) | 0.182 (0.004) | 0.188 (0.004) | 0.185 (0.004) | 0.188 (0.004) | 0.192 (0.004) | 0.193 (0.004) | 0.196 (0.004) | 0.199 (0.004) | 0.192 (0.004) | 0.192 (0.004) | 0.195 (0.004) | 0.196 (0.004) | 0.200 (0.004) | 0.200 (0.004) |
| Pr(average < perceived health status ≤ good), perceived health status = good | −0.227 (0.004) | −0.227 (0.004) | −0.225 (0.004) | −0.226 (0.004) | −0.224 (0.004) | −0.225 (0.004) | −0.223 (0.004) | −0.222 (0.004) | −0.221 (0.004) | −0.219 (0.004) | −0.216 (0.004) | −0.221 (0.004) | −0.222 (0.004) | −0.219 (0.004) | −0.219 (0.004) | −0.215 (0.004) | −0.215 (0.004) |
| Pr(good < perceived health status ≤ excellent), perceived health status = excellent | −0.033 (0.001) | −0.030 (0.001) | −0.037 (0.001) | −0.035 (0.001) | −0.039 (0.001) | −0.037 (0.001) | −0.039 (0.001) | −0.042 (0.001) | −0.042 (0.001) | −0.045 (0.001) | −0.048 (0.001) | −0.042 (0.001) | −0.041 (0.001) | −0.044 (0.001) | −0.045 (0.001) | −0.049 (0.001) | −0.049 (0.001) |
Appendix B
References
- Kerkhofs, M.; Lindeboom, M. Subjective health measures and state dependent reporting errors. Health Econ. 1995, 4, 221–235. [Google Scholar] [CrossRef] [PubMed]
- Groot, W. Adaptation and scale of reference bias in self-assessments of quality of life. J. Health Econ. 2000, 19, 403–420. [Google Scholar] [CrossRef]
- Sadana, R.; Mathers, C.D.; Lopez, A.D.; Murray, C.J.L.; Iburg, K. Comparative Analysis of More than 50 Household Surveys on Health Status; GPE Discussion Paper No. 15. EIP/GPE/EBD; World Health Organisation: Geneva, Switzerland, 2000. [Google Scholar]
- Murray, C.J.L.; Tandon, A.; Salomon, J.; Mathers, C.D.; Sadana, R. Cross-Population Comparability of Evidence for Health Policy; GPE Discussion Paper No. 46. WHO/EIP; World Health Organisation: Geneva, Switzerland, 2001. [Google Scholar]
- Shmueli, A. Reporting Heterogeneity in the Measurement of Health and Health-Related Quality of Life. Pharmacoeconomics 2002, 20, 405–412. [Google Scholar] [CrossRef] [PubMed]
- Baron-Epel, O.; Kaplan, G.; Haviv-Messika, A.; Tarabeia, J.; Green, M.S.; Kaluski, D.N. Self-reported health as a cultural health determinant in Arab and Jewish Israelis: MABAT—National Health and Nutrition Survey 1999–2001. Soc. Sci. Med. 2005, 61, 1256–1266. [Google Scholar] [CrossRef]
- Bailis, D.S.; Segall, A.; Chipperfield, J. Two views of self-rated general health status. Soc. Sci. Med. 2003, 56, 203–217. [Google Scholar] [CrossRef]
- Goldberg, P.; Guéguen, A.; Schmaus, A.; Nakache, J.-P. Longitudinal study of associations between perceived health status and self reported diseases in the French Gazel cohort. J. Epidemiol. Community Health 2001, 55, 233–238. [Google Scholar] [CrossRef] [Green Version]
- Au, N.; Johnston, D.W. Self-assessed health: What does it mean and what does it hide? Soc. Sci. Med. 2014, 121, 21–28. [Google Scholar] [CrossRef]
- Layes, A.; Asada, Y.; Kephart, G. Whiners and deniers—What does self-rated health measure? Soc. Sci. Med. 2012, 75, 1–9. [Google Scholar] [CrossRef] [PubMed]
- López-Casasnovas, G.; Saez, M. Saved by Wealth? Income, Wealth, and Self-Perceived Health in Spain during the Financial Crisis. Int. J. Environ. Res. Public Health 2020, 17, 7018. [Google Scholar] [CrossRef]
- Kaneva, M.; Gerry, C.J.; Baidin, V. The effect of chronic conditions and multi-morbidity on self-assessedhealth in Russia. Scand. J. Public Health 2018, 46, 886–896. [Google Scholar] [CrossRef] [PubMed]
- Darviri, C.; Artemiadis, A.K.; Tigani, X.; Alexopoulos, E.C. Lifestyle and self-rated health: A cross-sectional study of 3,601 citizens of Athens, Greece. BMC Public Health 2011, 11, 619. [Google Scholar] [CrossRef] [PubMed] [Green Version]
- Demirchyan, A.; E Thompson, M. Determinants of self-rated health in women: A population-based study in Armavir Marz, Armenia, 2001 & 2004. Int. J. Equity Health 2008, 7, 25. [Google Scholar] [CrossRef] [Green Version]
- Asfar, T.; Ahmad, B.; Rastam, S.; Mulloli, T.P.; Ward, K.D.; Maziak, W. Self-rated health and its determinants among adults in Syria: A model from the Middle East. BMC Public Health 2007, 7, 177. [Google Scholar] [CrossRef] [Green Version]
- Kasmel, A.; Helasoja, V.; Lipand, A.; Prättälä, R.; Klumbiene, J.; Pudule, I. Association between health behaviour and self-reported health in Estonia, Finland, Latvia and Lithuania. Eur. J. Public Health 2004, 14, 32–36. [Google Scholar] [CrossRef] [Green Version]
- Tay, J.B.; Kelleher, C.C.; Hope, A.; Barry, M.; Nic Gabhainn, S.; Sixsmith, J. Influence of sociodemographic and neighbourhood factors on self rated health and quality of life in rural communities: Findings from the Agriproject in the Republic of Ireland. J. Epidemiol. Community Health 2004, 58, 904–911. [Google Scholar] [CrossRef] [Green Version]
- Hernàndez-Quevedo, C.; Jones, A.M.; Rice, N. Reporting Bias and Heterogeneity in Self-Assessed Health. Evidence from the British Household Panel Survey. Health, Econometrics and Data Group (HEDG); Working Papers No. 05/04; HEDG, Department of Economics, University of York: Heslington, UK, 2005. [Google Scholar]
- Krieger, N. A glossary for social epidemiology. J. Epidemiol. Community Health 2001, 55, 693–700. [Google Scholar] [CrossRef] [Green Version]
- Lindeboom, M.; van Doorslaer, E. Cut-point shift and index shift in self-reported health. J. Health Econ. 2004, 23, 1083–1099. [Google Scholar] [CrossRef] [Green Version]
- Krause, N.M.; Jay, G.M. What Do Global Self-Rated Health Items Measure? Med. Care 1994, 32, 930–942. [Google Scholar] [CrossRef] [PubMed]
- Kempen, G.I.; Miedema, I.; Bos, G.A.V.D.; Ormel, J. Relationship of Domain-Specific Measures of Health to Perceived Overall Health among Older Subjects. J. Clin. Epidemiol. 1998, 51, 11–18. [Google Scholar] [CrossRef]
- Simon, J.; De Boer, J.; A Joung, I.M.; Bosma, H.; MacKenbach, J.P. How is your health in general? A qualitative study on self-assessed health. Eur. J. Public Health 2005, 15, 200–208. [Google Scholar] [CrossRef] [PubMed] [Green Version]
- Zhang, T.; Chaojie, L.; Ziling, N. Association of Access to Healthcare with Self-Assessed Health and Quality of Life among Old Adults with Chronic Disease in China: Urban Versus Rural Populations. Int. J. Environ. Res. Public Health 2019, 16, 2592. [Google Scholar] [CrossRef] [PubMed] [Green Version]
- Park, J.M. Health status and health services utilization in elderly Koreans. Int. J. Equity Health 2014, 13, 1–7. [Google Scholar] [CrossRef] [PubMed] [Green Version]
- Ellis, R.P.; Fiebig, D.G.; Johar, M.; Jones, G.; Savage, E. Explaining Health Care Expenditure Variation: Large-Sample Evidence Using Linked Survey and Health Administrative Data. Health Econ. 2013, 22, 1093–1110. [Google Scholar] [CrossRef] [PubMed] [Green Version]
- Greene, W.H.; Hensher, D.A. Modeling Ordered Choices; Cambridge University Press (CUP): Cambridge, UK, 2010. [Google Scholar]
- Jones, A.M. Identification of treatment effects in Health Economics. Health Econ. 2007, 16, 1127–1131. [Google Scholar] [CrossRef] [PubMed]
- Kawatsu, H.; Largey, A.G. EM Algorithms for Ordered Probit Models with Endogenous Regressors. Econom. J. 2009, 12, 164–186. [Google Scholar] [CrossRef]


| Duration (Mean) of Suffering in Years | Perceived Health (%) | |||||
|---|---|---|---|---|---|---|
| Clinical Morbidity | Very Bad | Bad | Average | Good | Excellent | |
| Heart disease (N = 6795) | 14.96 (0.17) | 7.49 | 37.44 | 51.48 | 3.49 | 0.10 |
| Gastrointestinal disease (N = 6822) | 15.72 (0.16) | 4.63 | 25.49 | 61.24 | 8.46 | 0.18 |
| Spinal diseases (N = 6495) | 15.69 (0.16) | 4.46 | 26.82 | 60.63 | 7.90 | 0.18 |
| Other chronic disease (N = 9127) | 14.42 (0.13) | 5.23 | 27.93 | 57.97 | 8.63 | 0.24 |
| Assigned disability (N = 6761) | 9.89 (0.12) | 9.50 | 41.15 | 44.56 | 4.61 | 0.18 |
| Survey Year | Respondents (Aged 18 Years and above) | Year-on-Year Attrition (%) |
|---|---|---|
| 2001 | 4773 | 16.47 |
| 2002 | 4874 | 10.65 |
| 2003 | 4768 | 10.63 |
| 2004 | 9627 | 9.21 |
| 2005 | 9393 | 5.75 |
| 2006 | 11,460 | 24.15 |
| 2007 | 11,294 | 9.00 |
| 2008 | 6011 | 8.27 |
| 2009 | 5916 | 6.37 |
| 2010 | 8993 | 37.95 |
| 2011 | 10,074 | 17.22 |
| 2012 | 10,942 | 15.40 |
| 2013 | 10,468 | 10.79 |
| 2014 | 9097 | 6.41 |
| 2015 | 9091 | 6.84 |
| 2016 | 9136 | 5.81 |
| 2017 | 9322 | 5.13 |
| Total | 145,239 | 12.44 |
| Recursive Model | Naive Model | |
|---|---|---|
| Dependent Variable = Clinical Morbidity | Coeff. | Coeff. |
| Age | 0.018 *** | |
| [(0.02)–(0.02)] | ||
| Gender (comparison: female) | ||
| Male | −0.202 *** | |
| [(−0.22)–(−0.18)] | ||
| Education (comparison: secondary education incomplete) | ||
| Secondary with/without vocational training | −0.072 *** | |
| [(−0.10)–(−0.05)] | ||
| Higher education | −0.135 *** | |
| [(−0.16)–(−0.11)] | ||
| Marital status (comparison: otherwise) | ||
| Married | −0.035 ** | |
| [(−0.06)–(−0.01)] | ||
| Settlement of residence (comparison: village) | ||
| Town | 0.104 *** | |
| [(0.08)–(0.13)] | ||
| City | 0.202 *** | |
| [(0.18)–(0.22)] | ||
| Working status (comparison: otherwise) | ||
| Employed | −0.116 *** | |
| [(−0.14)–(−0.10)] | ||
| Acute illness episode (comparison: no heart attack/no stroke) | ||
| Heart attack | 1.654 *** | |
| [(1.57)–(1.74)] | ||
| Stroke | 0.695 *** | |
| [(0.63)–(0.76)] | ||
| Dependent Variable = Perceived Health Status | ||
| Clinical morbidity | −1.238 *** | −0.817 *** |
| [(−1.32)–(−1.16)] | [(−0.85)–(−0.79)] | |
| Duration of clinical morbidity | 0.003 *** | |
| [(0.00)–(0.00)] | ||
| Interaction effect (duration of clinical morbidity) | 0.004 *** | |
| [(0.00)–(0.01)] | ||
| Assigned with disability | −0.947 *** | −1.003 *** |
| [(−0.99)–(−0.90)] | [(−1.05)–(−0.96)] | |
| Duration of life with disability | 0.009 *** | 0.010 *** |
| [(0.01)–(0.01)] | [(0.01)–(0.01)] | |
| Age | −0.028 *** | −0.030 *** |
| [(−0.03)–(−0.03)] | [(−0.03)–(−0.03)] | |
| Gender (comparison: female) | ||
| Male | 0.218 *** | 0.236 *** |
| [(0.20)–(0.23)] | [(0.22)–(0.25)] | |
| Marital status (comparison: otherwise) | ||
| Married | −0.063 *** | −0.052 *** |
| [(−0.08)–(−0.05)] | [(−0.07)–(−0.03)] | |
| Economic position (comparison: below median income) | ||
| Income above median level | 0.083 *** | 0.086 *** |
| [(0.07)–(0.10)] | [(0.07)–(0.10)] | |
| Satisfied with Life (comparison: otherwise) | ||
| Satisfied with Life | 0.424 *** | 0.428 *** |
| [(0.41)–(0.44)] | [(0.41)–(0.44)] | |
| Year (comparison: 2001) | ||
| 2002 | −0.042 | −0.043 |
| [(−0.09)–(0.00)] | [(−0.09)–(0.01)] | |
| 2003 | 0.066 ** | 0.066 ** |
| [(0.02)–(0.11)] | [(0.02)–(0.12)] | |
| 2004 | 0.033 | 0.035 |
| [(−0.01)–(0.07)] | [(−0.01)–(0.08)] | |
| 2005 | 0.089 *** | 0.092 *** |
| [(0.05)–(0.13)] | [(0.05)–(0.14)] | |
| 2006 | 0.058 ** | 0.060 ** |
| [(0.02)–(0.10)] | [(0.02)–(0.10)] | |
| 2007 | 0.092 *** | 0.095 *** |
| [(0.05)–(0.13)] | [(0.05)–(0.14)] | |
| 2008 | 0.130 *** | 0.132 *** |
| [(0.09)–(0.17)] | [(0.09)–(0.18)] | |
| 2009 | 0.138 *** | 0.141 *** |
| [(0.09)–(0.18)] | [(0.09)–(0.19)] | |
| 2010 | 0.175 *** | 0.178 *** |
| [(0.13)–(0.22)] | [(0.14)–(0.22)] | |
| 2011 | 0.206 *** | 0.210 *** |
| [(0.17)–(0.25)] | [(0.17)–(0.25)] | |
| 2012 | 0.132 *** | 0.136 *** |
| [(0.09)–(0.17)] | [(0.09)–(0.18)] | |
| 2013 | 0.119 *** | 0.123 *** |
| [(0.08)–(0.16)] | [(0.08)–(0.16)] | |
| 2014 | 0.161 *** | 0.166 *** |
| [(0.12)–(0.20)] | [(0.12)–(0.21)] | |
| 2015 | 0.166 *** | 0.171 *** |
| [(0.12)–(0.21)] | [(0.13)–(0.21)] | |
| 2016 | 0.223 *** | 0.229 *** |
| [(0.18)–(0.26)] | [(0.19)–(0.27)] | |
| 2017 | 0.222 *** | 0.229 *** |
| [(0.18)–(0.26)] | [(0.19)–(0.27)] | |
| N | 145,239 | 145,239 |
| AIC | −13.943 | −12.674 |
| BIC | −13.941 | −12.623 |
| Log-likelihood | −170,215.08 | −120,338.33 |
| Probability | 2001 | 2002 | 2003 | 2004 | 2005 | 2006 | 2007 | 2008 | 2009 | 2010 | 2011 | 2012 | 2013 | 2014 | 2015 | 2016 | 2017 |
|---|---|---|---|---|---|---|---|---|---|---|---|---|---|---|---|---|---|
| PrCond(clinical morbidity = 1) | 0.016 (0.001) | 0.017 (0.001) | 0.015 (0.001) | 0.016 (0.001) | 0.014 (0.001) | 0.015 (0.001) | 0.014 (0.001) | 0.014 (0.001) | 0.013 (0.001) | 0.013 (0.001) | 0.012 (0.001) | 0.013 (0.001) | 0.014 (0.001) | 0.013 (0.001) | 0.013 (0.001) | 0.012 (0.001) | 0.012 (0.001) |
| PrCond(clinical morbidity = 0) | 0.015 (0.001) | 0.016 (0.001) | 0.014 (0.001) | 0.014 (0.001) | 0.013 (0.001) | 0.014 (0.001) | 0.013 (0.001) | 0.012 (0.001) | 0.012 (0.001) | 0.012 (0.001) | 0.011 (0.001) | 0.012 (0.001) | 0.013 (0.001) | 0.012 (0.001) | 0.012 (0.001) | 0.011 (0.001) | 0.011 (0.001) |
| Difference at perceived health = very bad | 0.001 | 0.001 | 0.001 | 0.002 | 0.001 | 0.001 | 0.001 | 0.002 | 0.001 | 0.001 | 0.001 | 0.001 | 0.001 | 0.001 | 0.001 | 0.001 | 0.001 |
| Prcond(clinical morbidity = 1) | 0.108 (0.003) | 0.112 (0.002) | 0.102 (0.002) | 0.105 (0.002) | 0.100 (0.002) | 0.103 (0.002) | 0.100 (0.002) | 0.097 (0.002) | 0.096 (0.002) | 0.093 (0.002) | 0.090 (0.002) | 0.096 (0.002) | 0.098 (0.002) | 0.094 (0.002) | 0.094 (0.002) | 0.089 (0.002) | 0.089 (0.002) |
| Prcond(clinical morbidity = 0) | 0.076 (0.002) | 0.079 (0.002) | 0.071 (0.002) | 0.073 (0.001) | 0.069 (0.001) | 0.071 (0.001) | 0.069 (0.001) | 0.066 (0.001) | 0.066 (0.001) | 0.063 (0.001) | 0.061 (0.001) | 0.066 (0.001) | 0.067 (0.001) | 0.064 (0.001) | 0.064 (0.001) | 0.060 (0.001) | 0.060 (0.001) |
| Difference at perceived health = bad | 0.032 | 0.033 | 0.031 | 0.032 | 0.031 | 0.032 | 0.031 | 0.031 | 0.030 | 0.030 | 0.029 | 0.030 | 0.031 | 0.030 | 0.030 | 0.029 | 0.029 |
| PrCond(clinical morbidity = 1) | 0.875 (0.004) | 0.870 (0.003) | 0.883 (0.003) | 0.879 (0.002) | 0.885 (0.002) | 0.882 (0.002) | 0.886 (0.002) | 0.890 (0.003) | 0.891 (0.003) | 0.894 (0.002) | 0.898 (0.002) | 0.890 (0.002) | 0.889 (0.002) | 0.893 (0.002) | 0.894 (0.002) | 0.899 (0.002) | 0.899 (0.002) |
| PrCond(clinical morbidity = 0) | 0.634 (0.006) | 0.638 (0.005) | 0.627 (0.005) | 0.630 (0.005) | 0.624 (0.005) | 0.628 (0.005) | 0.624 (0.005) | 0.619 (0.005) | 0.618 (0.005) | 0.614 (0.005) | 0.610 (0.005) | 0.619 (0.005) | 0.621 (0.005) | 0.615 (0.005) | 0.615 (0.005) | 0.607 (0.006) | 0.607 (0.006) |
| Difference at perceived health = average | 0.241 | 0.232 | 0.256 | 0.249 | 0.261 | 0.254 | 0.262 | 0.271 | 0.273 | 0.28 | 0.288 | 0.271 | 0.268 | 0.278 | 0.279 | 0.292 | 0.292 |
| Prcond(clinical morbidity = 1) | 0.000 | 0.000 | 0.000 | 0.000 | 0.000 | 0.000 | 0.000 | 0.000 | 0.000 | 0.000 | 0.000 | 0.000 | 0.000 | 0.000 | 0.000 | 0.000 | 0.000 |
| Prcond(clinical morbidity = 0) | 0.275 (0.008) | 0.266 (0.006) | 0.289 (0.006) | 0.282 (0.005) | 0.294 (0.006) | 0.287 (0.005) | 0.294 (0.005) | 0.302 (0.006) | 0.304 (0.006) | 0.312 (0.006) | 0.318 (0.006) | 0.303 (0.006) | 0.300 (0.006) | 0.309 (0.006) | 0.310 (0.006) | 0.322 (0.006) | 0.322 (0.006) |
| Difference at perceived health = good | −0.275 | −0.266 | −0.289 | −0.282 | −0.294 | −0.287 | −0.294 | −0.302 | −0.304 | −0.312 | −0.318 | −0.303 | −0.300 | −0.309 | −0.310 | −0.322 | −0.322 |
Publisher’s Note: MDPI stays neutral with regard to jurisdictional claims in published maps and institutional affiliations. |
© 2021 by the authors. Licensee MDPI, Basel, Switzerland. This article is an open access article distributed under the terms and conditions of the Creative Commons Attribution (CC BY) license (https://creativecommons.org/licenses/by/4.0/).
Share and Cite
Paul, P.; Nguemdjo, U.; Kovtun, N.; Ventelou, B. Does Self-Assessed Health Reflect the True Health State? Int. J. Environ. Res. Public Health 2021, 18, 11153. https://doi.org/10.3390/ijerph182111153
Paul P, Nguemdjo U, Kovtun N, Ventelou B. Does Self-Assessed Health Reflect the True Health State? International Journal of Environmental Research and Public Health. 2021; 18(21):11153. https://doi.org/10.3390/ijerph182111153
Chicago/Turabian StylePaul, Pavitra, Ulrich Nguemdjo, Natalia Kovtun, and Bruno Ventelou. 2021. "Does Self-Assessed Health Reflect the True Health State?" International Journal of Environmental Research and Public Health 18, no. 21: 11153. https://doi.org/10.3390/ijerph182111153