
ClimApp—Integrating Personal Factors with Weather Forecasts for Individualised Warning and Guidance on Thermal Stress

 , ,
, ,  ,
,  , , ,
, , ,
Abstract
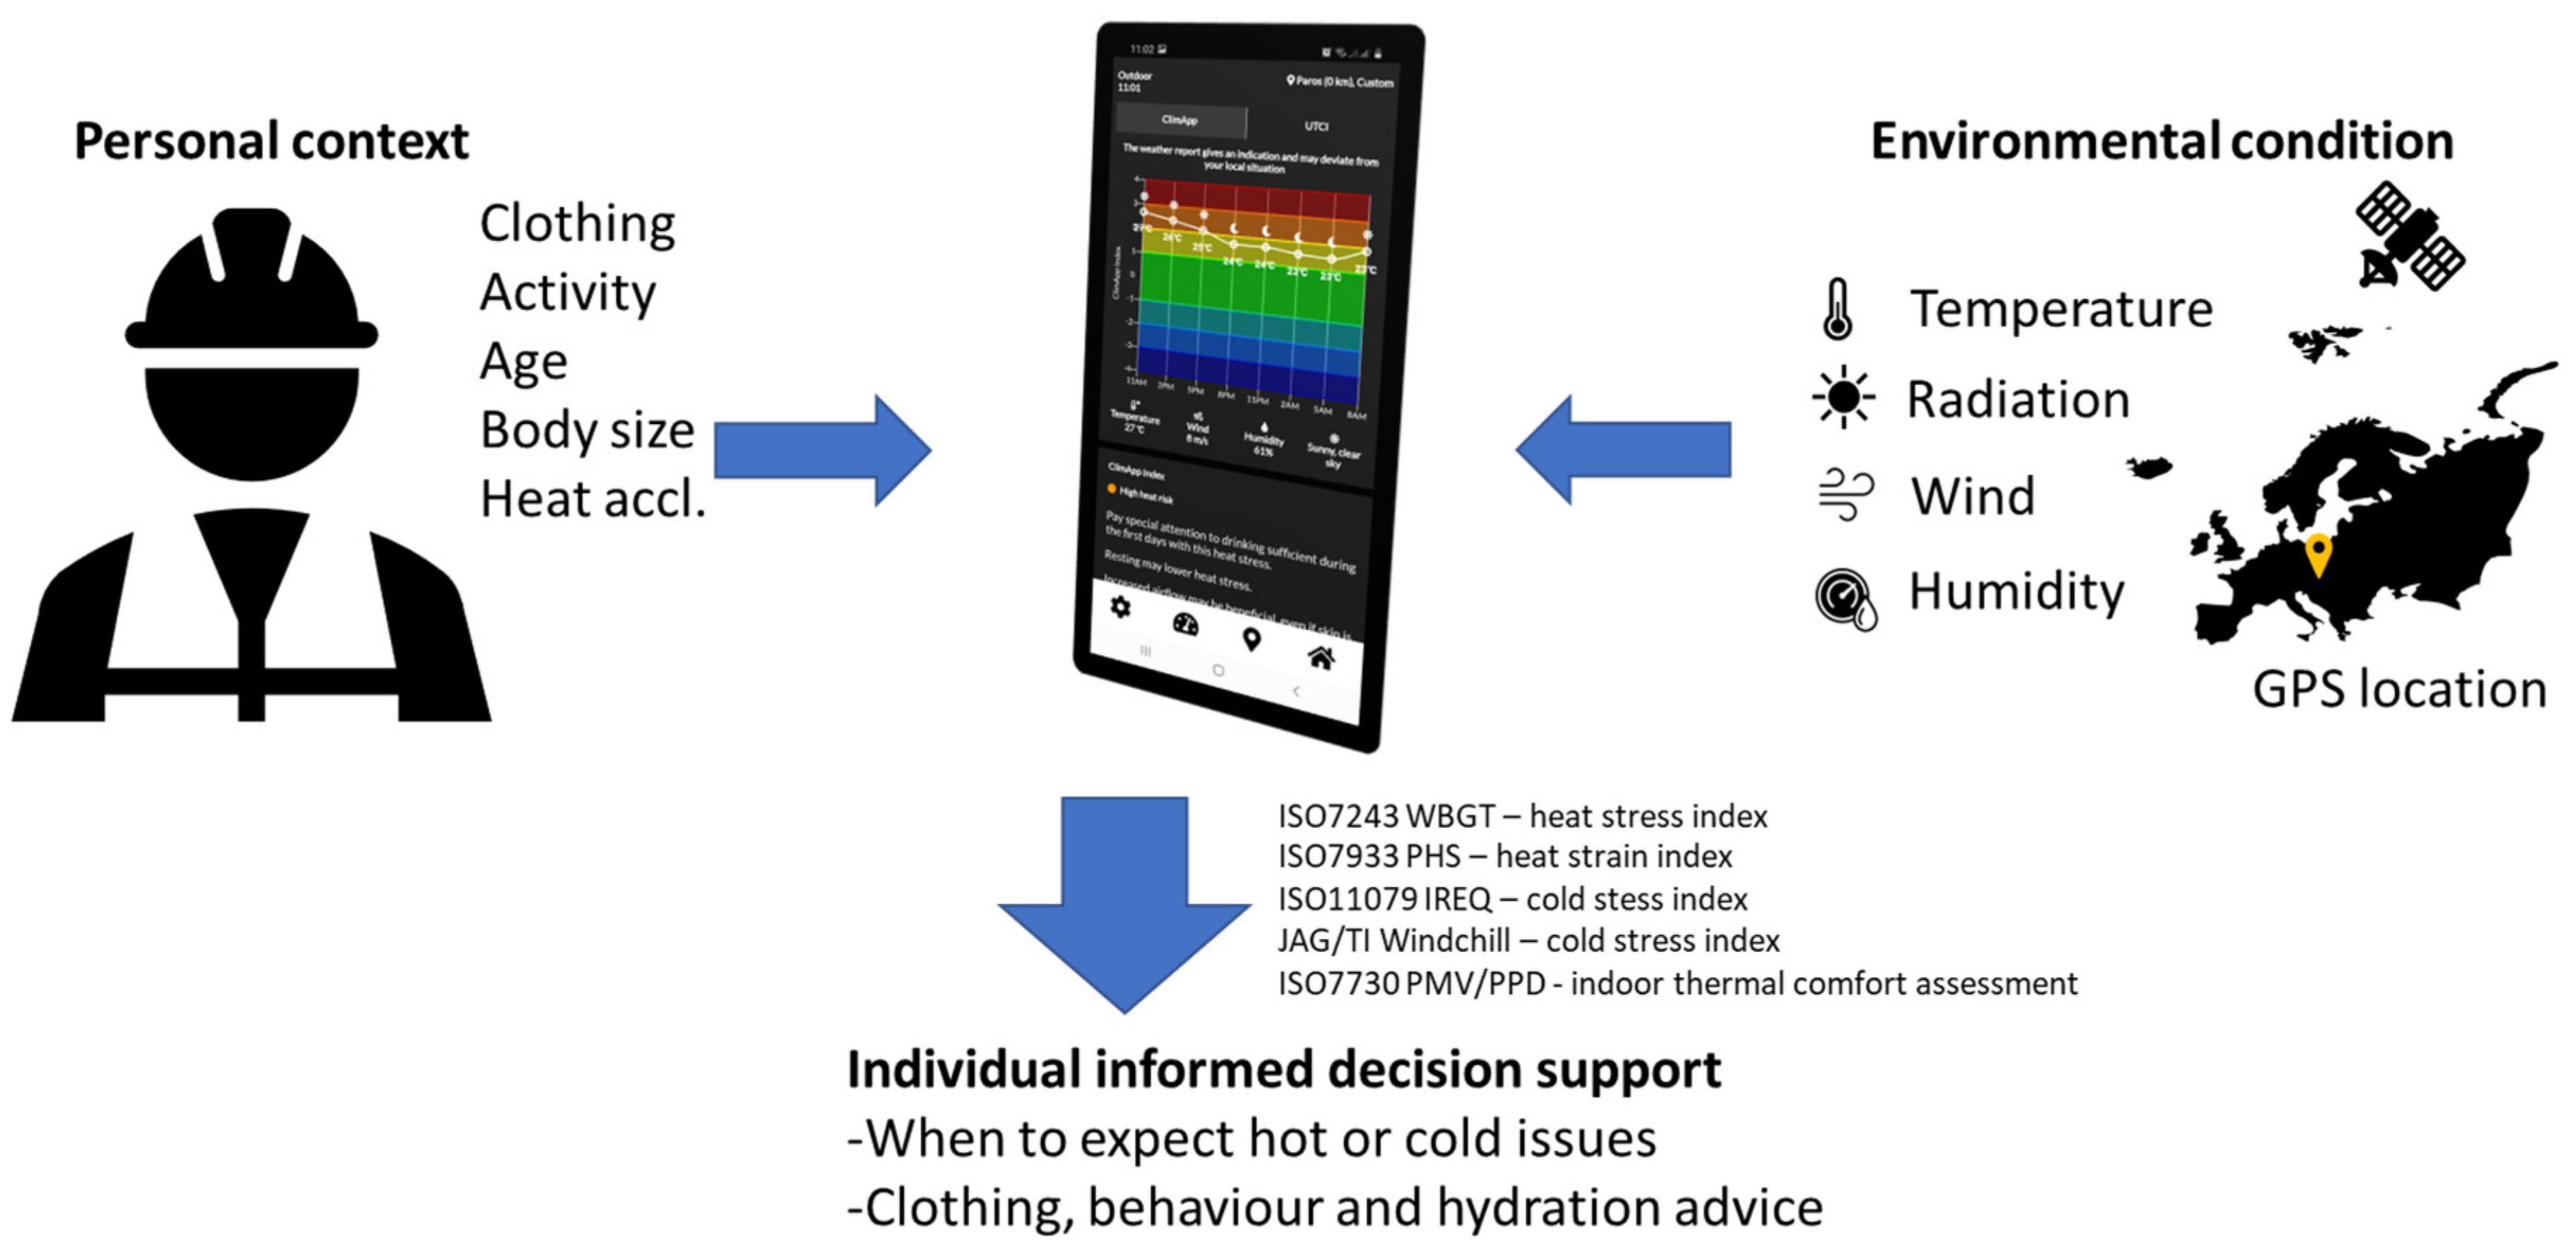
:1. Introduction
2. Materials and Methods
- The device retrieves local current and 24 h weather forecasts based on geographical coordinates.
- The ClimApp index shows the predicted level of heat or cold stress and strain.
- Interpretation and advice of the ClimApp index is presented to the user via icons, graphs and text in the device language.
- The user can customise the model input according to the personal situation, including activity level, clothing, body characteristics, heat acclimatisation, indoor or outdoor situation and geographical location.
- The user can select an individual profile (e.g., themselves or a worker representative), or as a caregiver of children or seniors.

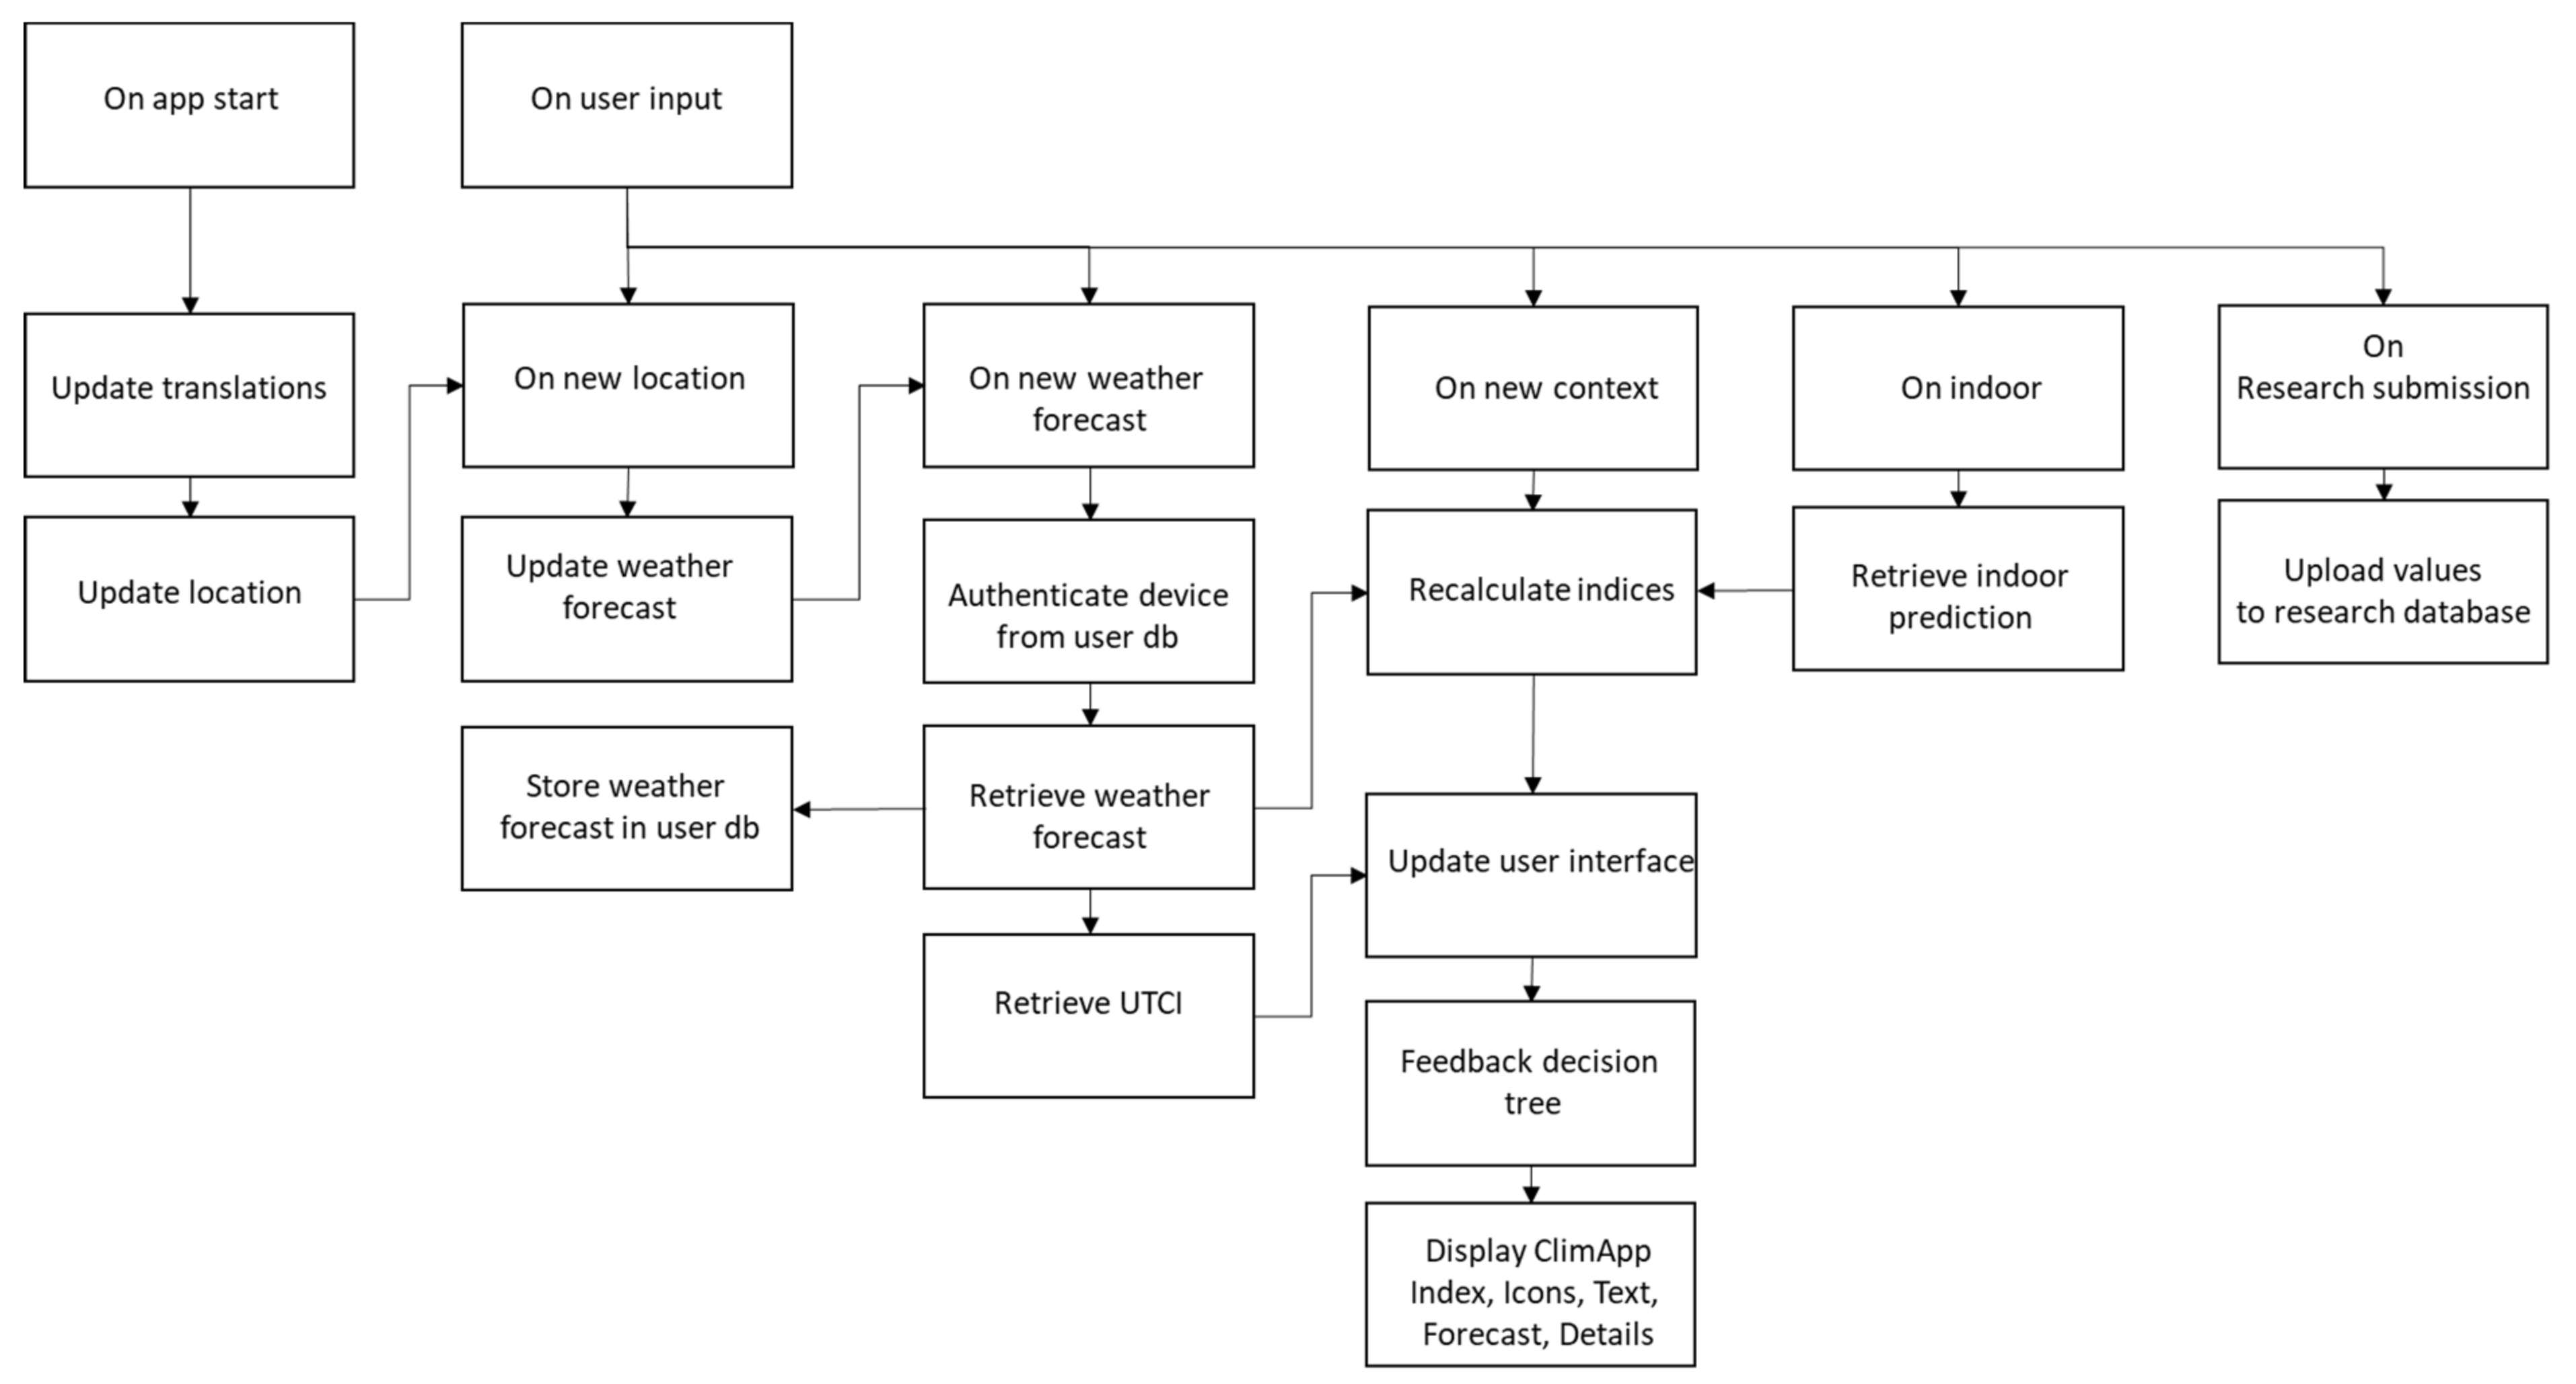
2.1. Architecture and Workflow
2.2. ClimApp Environmental Variables

| Type | Input Parameter or Variable | Symbol | Unit | Dependent Model or Output Variable | Source |
|---|---|---|---|---|---|
| Environment | Air temperature | Tair | °C | ISO 11079 IREQ, ISO 7933 PHS, ISO 7243 WBGT, Water vapour pressure, Black globe temperature, Natural wet bulb temperature Mean radiant temperature, Windchill index | Openweathermap.org |
| Air temperature indoor | Tair,indoor | °C | ISO 7730 PMV, | User input | |
| Atmospheric pressure | Pair | kPa | ISO 7243 WBGT | Openweathermap.org | |
| Relative humidity | RH | % | ISO 11079 IREQ, WBGT, Natural wet bulb temperature, Water vapour pressure, | Openweathermap.org | |
| Relative humidity indoor | RHindoor | % | ISO 7730 PMV | Antoine relation [27] using indoor temperature and outdoor water vapour pressure | |
| Water vapor pressure | Pv,air | kPa | ISO 7933 PHS, Relative humidity indoor | Antoine relation [27] | |
| Wind speed at 10 m | Vair,10m | ms−1 | Windchill index, Wind speed at 2 m, | Openweathermap.org | |
| Wind speed at 2 m | Vair,2m | ms−1 | ISO 11079 IREQ, ISO 7933 PHS, WBGT, Black globe temperature, Natural wet bulb temperature, Mean radiant temperature | Liljegren et al. [20]—stability class D for rural environments | |
| Wind speed indoor | Vair,indoor | ms−1 | ISO 7730 PMV | Windows closed: Vair,indoor = 0.2 ms−1 Windows open: Vair,indoor = 0.5 ms−1 | |
| Cloud cover | N | octa | WBGT cloud | Openweathermap.org | |
| Rain | ml | Openweathermap.org | |||
| Snow | cm | Openweathermap.org | |||
| Solar radiation | Qsolar | Wm−2 | Black globe temperature Natural wet bulb temperature | Liljegren [21] | |
| Black globe temperature (5 cm) | Tg | °C | WBGT Mean radiant temperature | Liljegren et al. [20] | |
| Natural wet bulb temperature | Tnwb | °C | WBGT | Liljegren et al. [20] | |
| Mean radiant temperature | Tmr | °C | ISO 11079 IREQ, ISO 7933 PHS | Ramsey et al. [28] | |
| Mean radiant temperature indoor | Tmr,indoor | °C | ISO 7730 PMV | Tmr,indoor = Tair,indoor | |
| Wet bulb globe temperature | WBGT | °C | ISO 7243 WBGT | Liljegren et al. [20] | |
| WBGT effective | WBGTeffective | °C | WBGT effective | ISO 7243 [24] | |
| Wind chill index | Twindchill | °C | Windchill index | ISO 11079 [12] | |
| WBGT reference value | WBGTref | °C | ISO 7243 WBGT | ISO 7243 [24] | |
| Latitude | ° | Solar radiation | GPS or user input | ||
| Longitude | ° | Solar radiation | GPS or user input | ||
| Date and time | Solar radiation | Mobile device | |||
| Activity | Metabolic rate | M | W | Metabolic heat production | |
| Metabolic heat production | Qmet | W | Recommended Alert Limit | Harris and Benedict [29] ISO 8996 [30], User input | |
| Metabolic heat production | Qmet | Wm−2 | ISO 11079 IREQ, ISO 7933 PHS | Metabolic heat production (W) per body surface area (m2) | |
| External work | W | Wm−2 | ISO 11079 IREQ, ISO 7933 PHS | W = 0 | |
| Walking speed | vwalk | ms−1 | ISO 7933 PHS ISO 11079 IREQ | 0.8 m/s—as to approximate air pumping effects in clothing | |
| Clothing | Clothing insulation | Icl | m2KW−1 | ISO 11079 IREQ, ISO 7933 PHS | ISO 9920 [31] User input |
| Clothing total static evaporative resistance | Re,T | m2 kPa W−1 | CAV | ISO 9920 [31] | |
| Static water vapour permeability index | imst | - | ISO 7933 PHS, | ISO 9920 [31] User input | |
| Air permeability | pair | Lm−2s−1 | ISO 11079 IREQ | ISO 9920 [31] User input | |
| Clothing Adjustment Value | CAV | °C | WBGT effective | Bernard et al. [32] | |
| Person | Age | a | years | Resting metabolic rate | User input |
| Height | h | cm | Body surface area, Resting metabolic rate | User input | |
| Weight | w | kg | Body surface area, Resting metabolic rate | User input | |
| Sex | - | Resting metabolic rate | User input | ||
| Acclimatisation to heat | - | ISO 7933 PHS, ISO 7243 WBGT | User input | ||
| Body surface area | A | m2 | Metabolic heat production | du Bois and du Bois [33] | |
| Position | - | ISO 7933 PHS | standing |
2.3. ClimApp Index for Assessment of the Thermal Environment
2.3.1. Translation of Cold Assessment from ISO 11079 into ClimApp
- The required whole body clothing insulation to be in thermal balance with the environment to sustain 8 h work (Icl,neutral in Clo);
- The required minimal whole body clothing insulation to allow body cooling to sustain 8 h work (Icl,minimal in Clo);
- The duration limit of exposure—allowing for high cold strain—the value is based on the input clothing level and activity level (DLEcold in minutes).
- User-specified Clothing level (Icl,user) is lower than required minimal clothing level (ClimApp index < −1).
- ◦
- ClimApp index = −1 − (Icl,minimal − Icl,user);
- ◦
- ClimApp index = −1.5 means that the user is dressed 0.5 Clo below the minimal required clothing level. The duration limit of exposure will be shorter than 8 h.
- Clothing level is between minimal and neutral (−1 < ClimApp index < 0).
- ◦
- Climapp index = −1 + (Icl,user − Icl,minimal)/(Icl,neutral − Icl,minimal);
- ◦
- ClimApp index = 0 means that the user is dressed such that no significant cold stress is expected. Workers can continue to work 8 h.
- Clothing level is greater than the neutral clothing level (ClimApp index > 0).
- ◦
- ClimApp index = Icl,user − Icl,neutral;
- ◦
- Climapp index = 0.5 means that the user is overdressed by 0.5 Clo and although it may not be a warm environment, heat issues may be expected, for example user may sweat.
2.3.2. Translation of Heat Stress and Heat Strain Assessment from WBGT ISO 7243 and PHS ISO 7933 into ClimApp
- HRL less than 0.8 (ClimApp Index < 1).
- ◦
- ClimApp index = HRL/0.8;
- ◦
- ClimApp index = 0.5 means that no significant heat risk is expected.
- HRL between 0.8 and 1.0 and (1 < ClimApp index < 2).
- ◦
- ClimApp index = 1 + (HRL − 0.8)/0.2;
- ◦
- ClimApp index = 1.5 means that the recommended alert limit is being approached and moderate heat stress can be expected.
- HRL between 1.0 and 1.2 (2 < ClimApp index < 3).
- ◦
- ClimApp index = 2 + (HRL − 1.0)/0.2;
- ◦
- ClimApp index = 2.5 means that the recommended alert limit is surpassed and high heat stress can be expected.
- HRL greater than 120% (ClimApp index > 3).
- ◦
- ClimApp index = 3 + (HRL − 1.2);
- ◦
- ClimApp index = 3.5 means that the recommended alert limit is surpassed by more than 20% and severe heat stress can be expected.
- The duration limit of exposure before rectal temperature reaches 38 °C (DLEhot in minutes);
- The total amount of sweat loss accumulated over the simulation time (PHSsweat in grams).
2.3.3. Translation of Naturally Ventilated Indoor Thermal Environment Assessment from PMV/PPD ISO 7730 into ClimApp
2.4. ClimApp Personalised Variables
3. Results
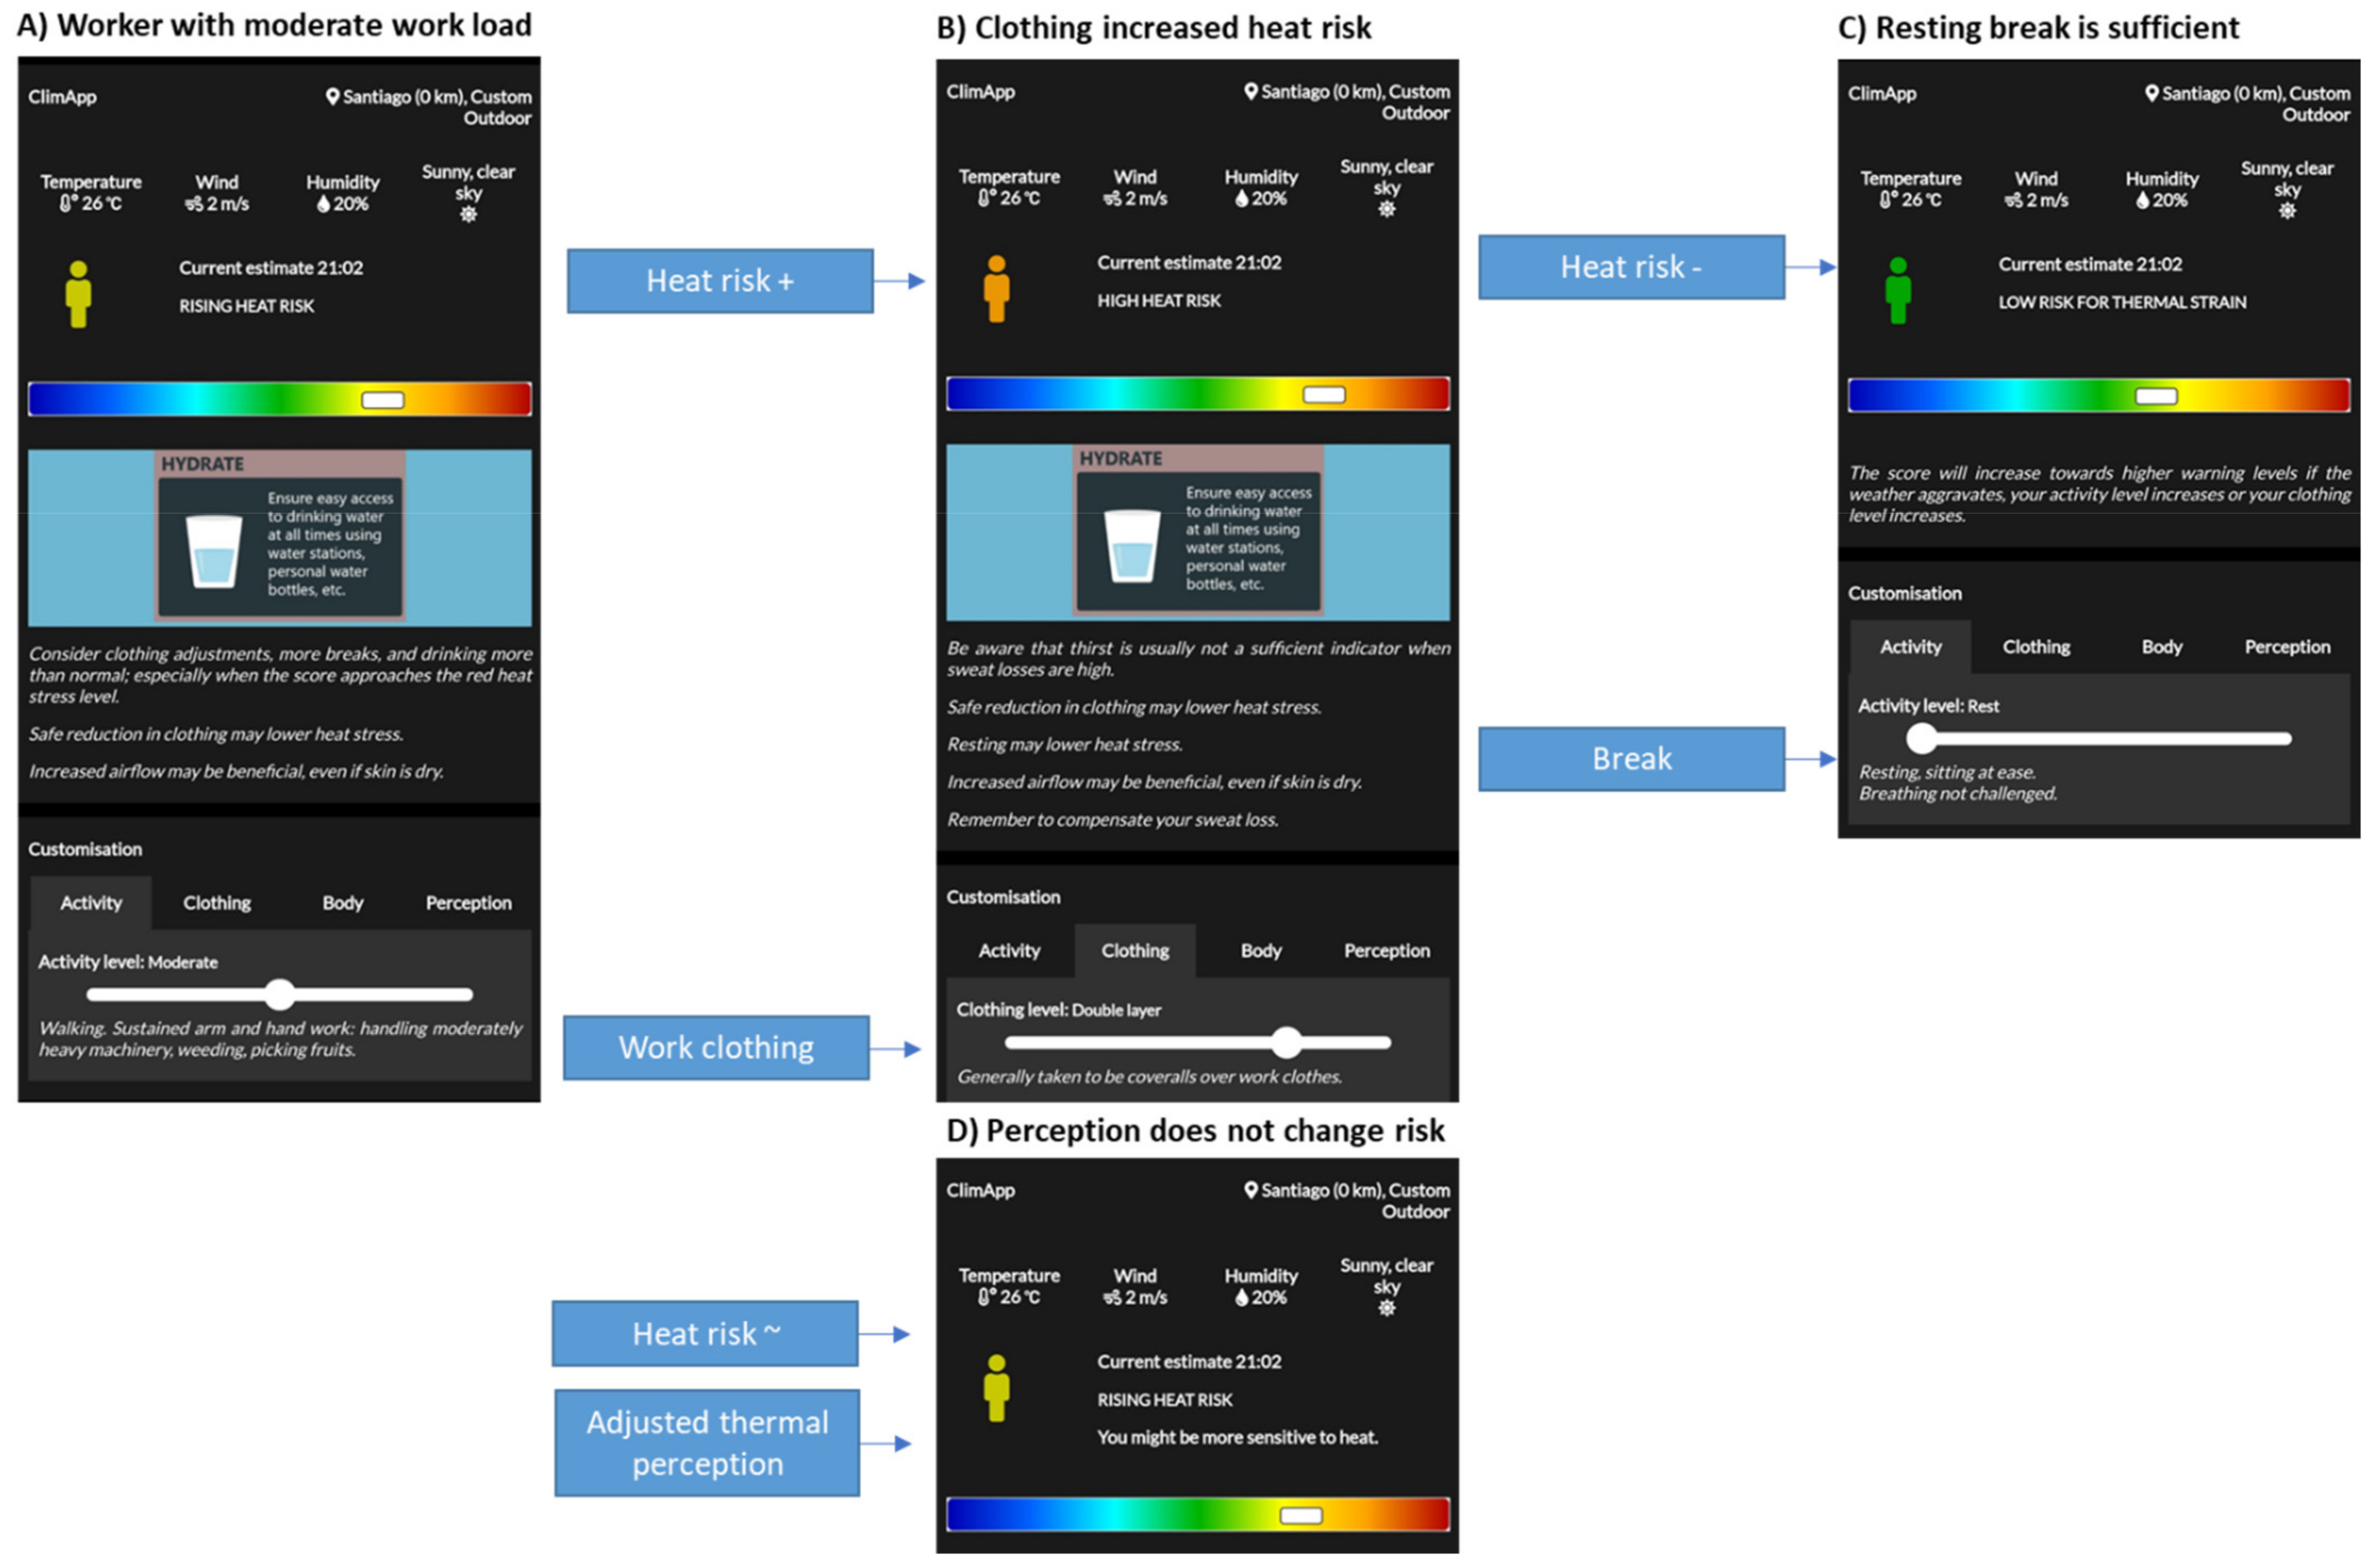
3.1. General Overview Panel
3.2. Customisation Panel
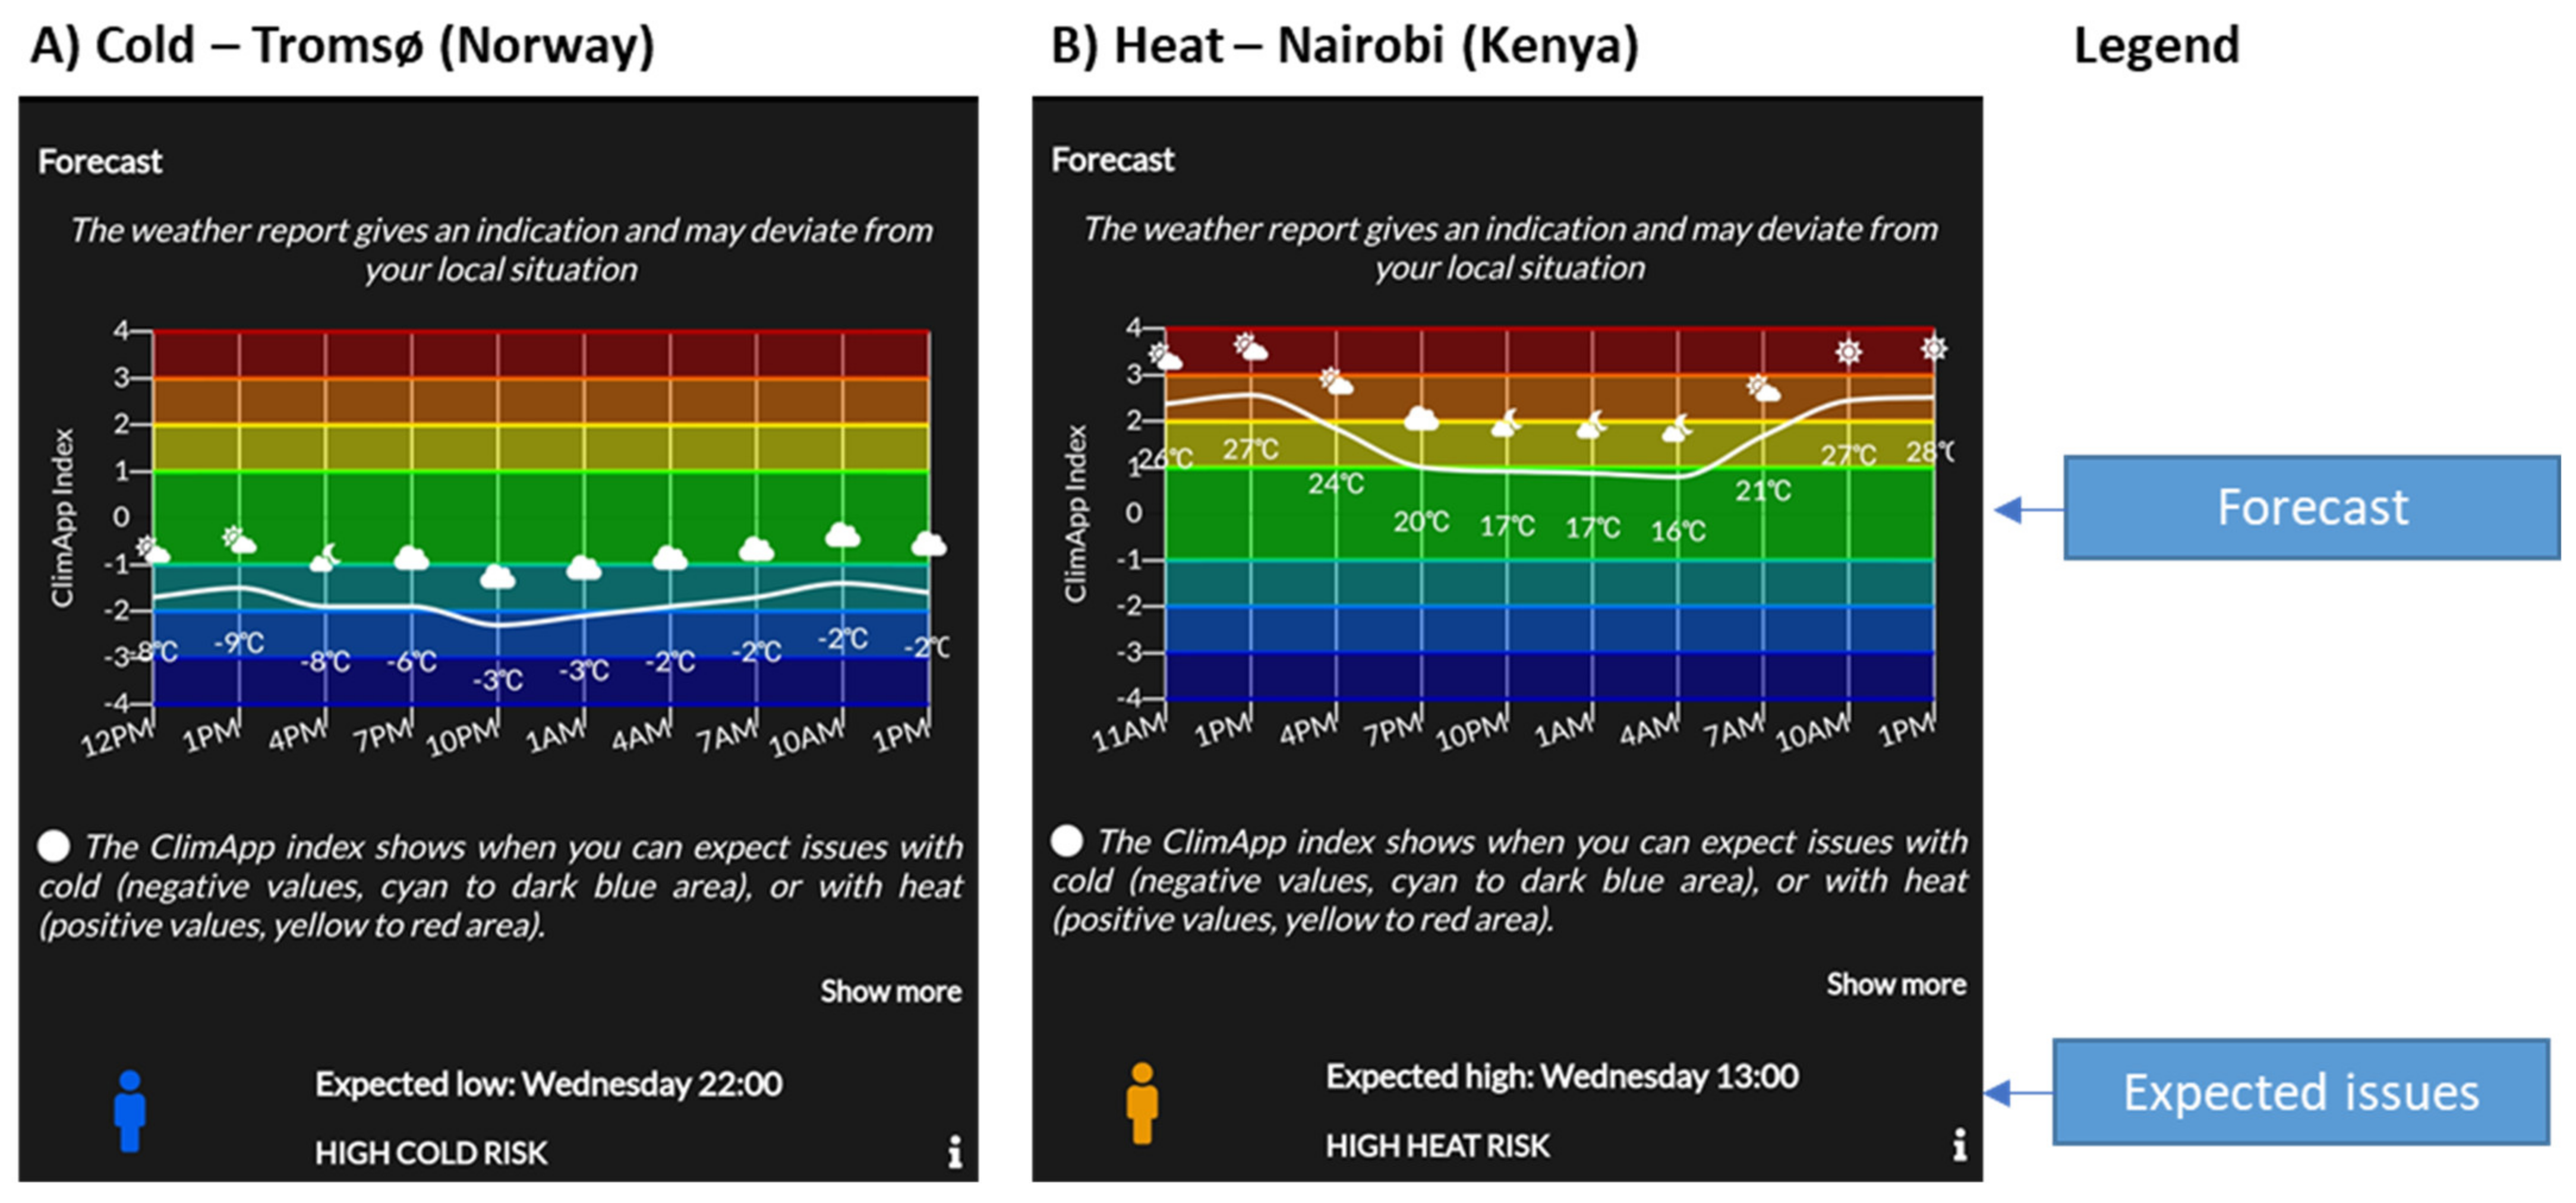
3.3. Forecast Panel
3.4. Detailed Information Panel
3.5. Location Panel
3.6. Profile Panel
3.7. Research Panel
4. Discussion
- Heat and cold stress assessments and warnings based on ISO human thermal models and indices presented as a single integrated index ranging from −4 (extremely cold) to +4 (extremely hot), where a value between −1 and +1 is associated with low thermal stress.
- Individualised input: activity level, clothing level, body characteristics, heat acclimatisation, indoor/outdoor situation and geographical location
- Profile-based output: individual worker, caregiver of children, or caregiver of elderly.
- Current and forecast weather: heat and cold stress warning, advice for adaptation such as clothing level, exposure reduction, and hydration in the form of infographics and text.
- 10 languages: English, Danish, Dutch, Swedish, Norwegian, Hellenic (Greek), Italian, German, Spanish and French.
- Research functionality, to collect individual data on thermal exposure and subjective response for worker and citizen science projects.
4.1. Estimating Heat Risk Level
4.2. Estimating Cold Risk Level
4.3. User Evaluation and Sensitivity Analysis
4.4. Limitations
5. Conclusions
- The developed app has enabled the integration of weather forecasts with personal input to provide personalised heat and cold stress warnings.
- Users can customise their input by adjusting activity level, clothing, body characteristics, heat acclimatisation status, indoor or outdoor situation and manually change the geographical location if they wish to see forecasts for other locations than their current one (GPS determined).
- ClimApp supports the adaptation of appropriate thermoregulatory behaviour for a given warning by providing a weather summary, the thermal index and associated warnings of thermal stress, as well as advice in the form of infographics and text specific to the user profile.
- The app may support citizen science projects by letting users submit their local thermal environment conditions, clothing and activity levels, as well as their subjective responses.
- The research functionality and user evaluations are ongoing (currently with n = 1745) and have taken place across the globe in both warm and cold environments. From the present technical description and developed framework, the app may be versioned or further developed to target special populations for the advancement and benefit of user specificity.
Author Contributions
Funding
Institutional Review Board Statement
Informed Consent Statement
Data Availability Statement
Acknowledgments
Conflicts of Interest
References
- ClimApp on the iOS App Store. Available online: https://apps.apple.com/nl/app/climapp/id1458460604 (accessed on 20 October 2021).
- ClimApp on the Android Play Store. Available online: https://play.google.com/store/apps/details?id=com.climapp.app&hl=en_US&gl=US (accessed on 20 October 2021).
- Petersson, J.; Kuklane, K.; Gao, C. Is there a need to integrate human thermal models with weather forecasts to predict thermal stress? Int. J. Environ. Res. Public Health 2019, 16, 4586. [Google Scholar] [CrossRef] [PubMed] [Green Version]
- Morabito, M.; Messeri, A.; Noti, P.; Casanueva, A.; Crisci, A.; Kotlarski, S.; Orlandini, S.; Schwierz, C.; Spirig, C.; Kingma, B.R.; et al. An occupational heat–health warning system for Europe: The HEAT-SHIELD platform. Int. J. Environ. Res. Public Health 2019, 16, 2890. [Google Scholar] [CrossRef] [PubMed] [Green Version]
- Casanueva, A.; Burgstall, A.; Kotlarski, S.; Messeri, A.; Morabito, M.; Flouris, A.D.; Nybo, L.; Spirig, C.; Schwierz, C. Overview of existing heat-health warning systems in Europe. Int. J. Environ. Res. Public Health 2019, 16, 2657. [Google Scholar] [CrossRef] [Green Version]
- Wilkins, D. Heat and Cold Stress in the Antarctic. 1976. Available online: https://www.cambridge.org/core/product/identifier/S003224740000005X/type/journal_article (accessed on 4 January 2021).
- Sullivan-Kwantes, W.; Haman, F.; Kingma, B.R.; Martini, S.; Gautier-Wong, E.; Chen, K.Y.; Friedl, K.E. Human performance research for military operations in extreme cold environments. J. Sci. Med. Sport 2020, 24, 954–962. [Google Scholar] [CrossRef] [PubMed]
- Flouris, A.D.; Dinas, P.; Ioannou, L.; Nybo, L.; Havenith, G.; Kenny, G.P.; Kjellstrom, T. Workers’ health and productivity under occupational heat strain: A systematic review and meta-analysis. Lancet Planet Health 2018, 2, e521–e531. [Google Scholar] [CrossRef] [Green Version]
- Pilcher, J.J.; Nadler, E.; Busch, C. Effects of Hot and Cold Temperature Exposure on Performance: A Meta-Analytic Review; Taylor and Francis: London, UK, 2010. [Google Scholar]
- Xu, X.; Rioux, T.P.; Gonzalez, J.; Hansen, E.O.; Castellani, J.W.; Santee, W.R.; Karis, A.J.; Potter, A.W. A digital tool for prevention and management of cold weather injuries—cold weather ensemble decision aid (CoWEDA). Int. J. Biometeorol. 2021, 65, 1415–1426. Available online: https://pubmed.ncbi.nlm.nih.gov/33813648/ (accessed on 21 April 2021). [CrossRef]
- Malchaire, J.; Piette, A.; Kampmann, B.; Mehnert, P.; Gebhardt, H.; Havenith, G.; Hartog, E.D.; Holmer, I.; Parsons, K.; Alfano, G.; et al. Development and validation of the predicted heat strain model. Ann. Occup. Hyg. 2001, 45, 123–135. [Google Scholar] [CrossRef]
- ISO/TR 11079. Evaluation of Cold Environments—Determination of Required Clothing Insulation (IREQ); ISO: Geneva, Switzerland, 1993. [Google Scholar]
- Broede, P.; Fiala, D.; Blazejczyk, K.; Holmér, I.; Jendritzky, G.; Kampmann, B.; Tinz, B.; Havenith, G. Deriving the operational procedure for the Universal Thermal Climate Index (UTCI). Int. J. Biometeorol. 2012, 56, 481–494. [Google Scholar] [CrossRef] [Green Version]
- Havenith, G.; Fiala, D. Thermal indices and thermophysiological modeling for heat stress. Compr. Physiol. 2011, 6, 255–302. [Google Scholar]
- Kingma, B.R.M.; Vosselman, M.J.; Frijns, A.J.H.; van Steenhoven, A.A.; van Marken Lichtenbelt, W.D. Incorporating neurophysiological concepts in mathematical thermoregulation models. Int. J. Biometeorol. 2014, 58, 87–99. [Google Scholar] [CrossRef] [PubMed]
- ISO 11079:2007(en). Ergonomics of the Thermal Environment—Determination and Interpretation of Cold Stress When Using Required Clothing Insulation (IREQ) and Local Cooling Effects. Available online: https://www.iso.org/obp/ui/#iso:std:iso:11079:ed-1:v1:en (accessed on 21 April 2021).
- Apache Cordova Open-Source Framework. Available online: https://cordova.apache.org/docs/en/latest/guide/overview/index.html (accessed on 20 October 2021).
- ClimApp GitHub Repository. 2021. Available online: https://github.com/ClimAppConsortium/ClimApp (accessed on 20 October 2021).
- Openweathermap.org. Accuracy and Quality of Weather Data. 2021. Available online: https://openweathermap.org/accuracy-and-quality (accessed on 26 July 2021).
- Liljegren, J.C.; Carhart, R.A.; Lawday, P.; Tschopp, S.; Sharp, R. Modeling the wet bulb globe temperature using standard meteorological measurements. J. Occup. Environ. Hyg. 2008, 10, 654–655. [Google Scholar] [CrossRef] [PubMed]
- Liljegren, J.C. WBGT and Solar Radiation Source Code: Software Produced by UChicago Argonne, LLC under Contract No. DE-AC02-06CH11357 with the Department of Energy; UChicago Argonne, LLC: Chicago, IL, USA, 2008. [Google Scholar]
- Michalsky, J.J. The Astronomical Almanac’s algorithm for approximate solar position (1950–2050). Sol. Energy 1988, 40, 227–235. [Google Scholar] [CrossRef]
- Kasten, F.; Czeplak, G. Solar and terrestrial radiation dependent on the amount and type of cloud. Sol. Energy 1980, 24, 177–189. [Google Scholar] [CrossRef]
- ISO 7243:2017. Ergonomics of the Thermal Environment—Assessment of Heat Stress Using the WBGT (Wet Bulb Globe Temperature) Index. Available online: https://www.iso.org/standard/67188.html (accessed on 21 April 2021).
- Lemke, B.; Kjellstrom, T.; Freyberg, C.; Briggs, D.; Otto, M.; Hasson, L. Climate Change Heat Impact & Prevention. Available online: https://www.climatechip.org/ (accessed on 27 January 2021).
- Aguilera, J.J.; Andersen, R.K.; Toftum, J. Prediction of indoor air temperature using weather data and simple building descriptors. Int. J. Environ. Res. Public Health 2019, 16, 4349. [Google Scholar] [CrossRef] [Green Version]
- Parsons, K. Human Thermal Environments, 2nd ed.; Parsons, K.C., Ed.; Taylor & Francis: London, UK, 2003. [Google Scholar]
- Ramsey, J.D.; Bernard, T.E. Heat Stress. In Patty’s Industrial Hygiene and Toxicology, 2nd ed.; Dreisbach, R.H., Ed.; John Wiley & Sons Ltd.: New York, NY, USA, 2000. [Google Scholar]
- Harris, J.A.; Benedict, F.G. A Biometric Study of Human Basal Metabolism. Proc. Natl. Acad. Sci. USA 1918, 4, 370–373. Available online: http://www.ncbi.nlm.nih.gov/pubmed/16576330 (accessed on 20 October 2021). [CrossRef] [PubMed] [Green Version]
- ISO. Ergonomics of the Thermal Environment—Determination of Metabolic Rate; BS EN ISO 89962004; ISO: Geneva, Switzerland, 2004; Available online: https://www.iso.org/standard/34251.html (accessed on 21 April 2021).
- ISO 9920 I. ISO 9920—Ergonomics of the Thermal Environment—Estimation of the Thermal Insulation and Evaporative Resistance of a Clothing Ensemble; ISO: Geneva, Switzerland, 2006. [Google Scholar]
- Bernard, T.E.; Ashley, C.D.; Garzon, X.P.; Kim, J.H.; Coca, A. Prediction of WBGT-based clothing adjustment values from evaporative resistance. Ind. Health 2017, 56, 549–554. [Google Scholar] [CrossRef] [Green Version]
- Du Bois, D.; Du Bois, E.F. A formula to estimate the approximate surface area if height and weight be known delafield. Arch. Intern. Med. 1916, 17, 863–871. [Google Scholar] [CrossRef] [Green Version]
- ISO 7933:2004. Ergonomics of the thermal environment—Analytical Determination and Interpretation of Heat Stress Using Calculation of the Predicted Heat Strain. Available online: https://www.iso.org/standard/37600.html (accessed on 21 April 2021).
- ISO 7730:2005. Ergonomics of the Thermal Environment—Analytical Determination and Interpretation of Thermal Comfort Using Calculation of the PMV and PPD Indices and Local Thermal Comfort Criteria. Available online: https://www.iso.org/standard/39155.html (accessed on 21 April 2021).
- Kuklane, K.; Toma, R. Common clothing area factor estimation equations are inaccurate for highly insulating (Icl > 2 clo) and non-western loose-fitting clothing ensembles. Ind. Health 2020, 59, 107–116. [Google Scholar] [CrossRef]
- International Organisation for Standardization. ISO 15265 (2004) Ergonomics of Thermal Environments—Strategy of Evaluation of the Risk for the Prevention of Constraints or Discomfort under Thermal Working Conditions; International Organization for Standardization: Geneva, Switzerland, 2004. [Google Scholar]
- D’Ambrosio Alfano, F.R.; Palella, B.I.; Riccio, G. On the transition thermal discomfort to heat stress as a function of the PMV value. Ind. Health 2013, 51, 285. [Google Scholar] [CrossRef] [PubMed] [Green Version]
- Griefahn, B. Limits of and possibilities to improve the IREQ cold stress model (ISO/TR 11079). A validation study in the field. Appl. Ergon. 2000, 31, 423–431. [Google Scholar] [CrossRef]
- Kenney, W.L. Psychrometric limits and critical evaporative coefficients for exercising older women. J. Appl. Physiol. 2020, 129, 263–271. Available online: https://journals.physiology.org/doi/10.1152/japplphysiol.00345.2020 (accessed on 11 April 2021). [CrossRef] [PubMed]


| Activity | Description | Qmet (W) |
|---|---|---|
| Low | Light manual work: writing, drawing, book-keeping. Easy to breathe and carry on a conversation | 180 |
| Moderate | Walking. Sustained arm and hand work: handling moderately heavy machinery, weeding, picking fruit | 300 |
| High | Intense arm and trunk work: carrying heavy material, shovelling, hand mowing, concrete block laying | 415 |
| Very high | Very intense occupational activity at fast maximum pace: working with an axe, climbing stairs, running on level surface. | 520 |
| Clothing | Description | Icl | imst | pair |
|---|---|---|---|---|
| Summer attire | Loose-fitting, short clothing, typical for summer | 0.078 | 0.45 | 200 |
| Casual attire | Common in informal settings, long sleeves | 0.124 | 0.38 | 100 |
| Business suit * | Regular business suit, common in offices | 0.155 | 0.38 | 50 |
| Double layer | Generally taken to be coveralls over work clothes | 0.233 | 0.38 | 10 |
| Winter attire | Winter clothing, multiple layers including a thick coat | 0.310 | 0.38 | 5 |
| Extreme winter attire | Extreme cold weather clothing, multiple layers including a thick coat | 0.388 | 0.38 | 5 |
Publisher’s Note: MDPI stays neutral with regard to jurisdictional claims in published maps and institutional affiliations. |
© 2021 by the authors. Licensee MDPI, Basel, Switzerland. This article is an open access article distributed under the terms and conditions of the Creative Commons Attribution (CC BY) license (https://creativecommons.org/licenses/by/4.0/).
Share and Cite
Kingma, B.R.M.; Steenhoff, H.; Toftum, J.; Daanen, H.A.M.; Folkerts, M.A.; Gerrett, N.; Gao, C.; Kuklane, K.; Petersson, J.; Halder, A.; et al. ClimApp—Integrating Personal Factors with Weather Forecasts for Individualised Warning and Guidance on Thermal Stress. Int. J. Environ. Res. Public Health 2021, 18, 11317. https://doi.org/10.3390/ijerph182111317
Kingma BRM, Steenhoff H, Toftum J, Daanen HAM, Folkerts MA, Gerrett N, Gao C, Kuklane K, Petersson J, Halder A, et al. ClimApp—Integrating Personal Factors with Weather Forecasts for Individualised Warning and Guidance on Thermal Stress. International Journal of Environmental Research and Public Health. 2021; 18(21):11317. https://doi.org/10.3390/ijerph182111317
Chicago/Turabian StyleKingma, B. R. M., H. Steenhoff, J. Toftum, H. A. M. Daanen, M. A. Folkerts, N. Gerrett, C. Gao, K. Kuklane, J. Petersson, A. Halder, and et al. 2021. "ClimApp—Integrating Personal Factors with Weather Forecasts for Individualised Warning and Guidance on Thermal Stress" International Journal of Environmental Research and Public Health 18, no. 21: 11317. https://doi.org/10.3390/ijerph182111317
APA StyleKingma, B. R. M., Steenhoff, H., Toftum, J., Daanen, H. A. M., Folkerts, M. A., Gerrett, N., Gao, C., Kuklane, K., Petersson, J., Halder, A., Zuurbier, M., Garland, S. W., & Nybo, L. (2021). ClimApp—Integrating Personal Factors with Weather Forecasts for Individualised Warning and Guidance on Thermal Stress. International Journal of Environmental Research and Public Health, 18(21), 11317. https://doi.org/10.3390/ijerph182111317