Article

Metabarcoding Analysis of Harmful Algal Bloom Species in the Western Pacific Seamount Regions

1
CAS Key Laboratory of Marine Ecology and Environmental Sciences, Institute of Oceanology, Chinese Academy of Sciences, Qingdao 266071, China
2
Laboratory of Marine Ecology and Environmental Science, Qingdao National Laboratory for Marine Science and Technology, Qingdao 266237, China
3
Center for Ocean Mega-Science, Chinese Academy of Sciences, Qingdao 266071, China
4
College of Life Science and Technology, Huazhong Agricultural University, Wuhan 430070, China
5
Laboratory of Marine Organism Taxonomy and Phylogeny, Institute of Oceanology, Chinese Academy of Sciences, Qingdao 266071, China
6
College of Marine Science, University of Chinese Academy of Sciences, Beijing 100049, China
7
Department of Molecular Biology and Biochemistry, Simon Fraser University, Burnaby, BC V5A 1S6, Canada
*
Author to whom correspondence should be addressed.
Int. J. Environ. Res. Public Health 2021, 18(21), 11470; https://doi.org/10.3390/ijerph182111470
Submission received: 22 September 2021 / Revised: 27 October 2021 / Accepted: 28 October 2021 / Published: 31 October 2021
(This article belongs to the Special Issue Novel Understanding for the Ecology of Marine HABs)

Abstract

:
The Western Pacific is the most oligotrophic sea on Earth, with numerous seamounts. However, the plankton diversity and biogeography of the Western Pacific in general and the seamount regions in particular remains largely unexplored. In this project, we quantitatively analyzed the composition and distribution patterns of plankton species in the Western Pacific seamount regions by applying metabarcoding analysis. We identified 4601 amplicon sequence variants (ASVs) representing 34 classes in seven protist phyla/divisions in the Western Pacific seamount regions, among which Dinoflagellata was by far the most dominant division. Among the 336 annotated phytoplankton species (including species in Dinoflagellata), we identified 36 harmful algal bloom (HAB) species, many of which displayed unique spatial distribution patterns in the Western Pacific seamount regions. This study was the first attempt in applying ASV-based metabarcoding analysis in studying phytoplankton and HAB species in the Western Pacific seamount regions, which may facilitate further research on the potential correlation between HABs in the Western Pacific seamount regions and coastal regions.

1. Introduction

Harmful algal blooms (HABs) caused by proliferation of certain algae in the marine environment pose threats to ecological security, directly or indirectly to human health, and to local social and economic development [1]. In recent decades, HABs have evolved into frequent abnormal ecological disasters under the influence of intensified human activities and climate changes [2]. Increasingly more HABs of rare and novel species occur within and beyond their recognized geographic regions, and HABs of previously undescribed species have become common features of HABs [3]. An emerging pattern of HAB distribution is that HABs caused by the same HAB species could be geographically distant. For example, brown tides caused by the picoplankton Aureococcus anophagefferens have been reported on the eastern U.S. coast in 1985 [4], in Saldanha Bay, South Africa in 1997 [5], and in Qinhuangdao, China in 2009 [6], which were geographically distant regions. As A. anophagefferens has been detected in the ballast water samples and in the bilge-water of local watercraft [4], it has been proposed that ballast water was the vector of the A. anophagefferens seeds [3]. However, a recent study using molecular markers has uncovered widespread distribution of A. anophagefferens [7], suggesting that ballast water was not an obligatory vector for the A. anophagefferens-caused brown tides to occur. Therefore, the geographical distribution patterns of HAB species remain to be better explored and determined.
The Western Pacific is one of the most oligotrophic seas on Earth, with a large number of seamounts that often support rich stocks of large fish and benthic communities [8], making them hotspots for a variety of marine life. Studies have demonstrated that seamounts can increase the abundance of microplankton, such as diatoms [9,10,11]. Furthermore, studies suggested that seamounts may constitute coastal-like habitats in which the phytoplankton species composition can differ from that of the surrounding environment [10]. Nevertheless, there has been only limited research on the spatial distribution of phytoplankton communities in the Western Pacific Ocean, most of which applied morphology-based methods for phytoplankton identification [12,13,14]. Morphology-based methods have many limitations, including low resolution especially for picoplankton. In recent years, the development of high-throughput sequencing methods has greatly enhanced our ability to assess the biodiversity of phytoplankton and identify their ecological significance in the ocean [15]. For example, a comprehensive study of the diversity of microeukaryotes in three different regions in the northwestern Pacific Ocean using high-throughput sequencing of the 18S rRNA gene unveiled a eukaryotic microbial community structure in different habitats [16].
In this study, we attempted for the first time to explore HAB species and their distribution patterns in the Western Pacific seamount regions, applying the ASV-based metabarcoding method DADA2, which was recently developed [17,18]. We analyzed HAB species using high-throughput sequencing of the 18S rDNA V4 regions of phytoplankton collected at seamount sampling sites. We found that Dinoflagellata was by far the most dominant group of phytoplankton in the Western Pacific seamount regions. We identified 36 HAB species, some of which have been identified in coastal regions of China.

2. Materials and Methods

2.1. Sampling Sites and Sample Preparation

The survey was carried out in the seamount area of the Western Pacific Ocean (9°58′–10°45′ N, 140°2′–140°21′ E) from May to June, 2019. Altogether, 80 water samples were collected at 21 sampling sites that belonged to three sampling sections (Figure 1). Of those sampling sites, sampling sites in section A, section B, and section C were in the vicinity of seamounts on the Caroline Ridge. At each sampling site, water samples were collected at 1–7 different depths, with the sampling depths ranging from 0 m (i.e., surface) to 2300 m. Each sample was filtered using 200 μm mesh (Hebei Anping Wire Mesh Co., Ltd., Hengshui, China) to remove large suspended solids, larger zooplankton, and phytoplankton, followed by a second filtration through a 0.2 μm polycarbonate membrane (Millipore, Burlington, MA, USA) using a vacuum filtration pump with negative pressure below 50 kPa. The filter membranes were transferred in tubes and were then snap-frozen in liquid nitrogen and stored at −80 °C until processed for DNA samples.

2.2. DNA Extraction and Sequencing

DNA was extracted from frozen samples using HP Plant DNA Kit (Omega, Norwalk, CT, USA), according to the manufacturer’s protocol as described previously [19]. DNA quality was ascertained using 260/280 nm and 260/230 nm ratios with a spectrophotometer (Thermo Scientific NanoDrop 2000C, Wilmington, DE, USA). The 18S rDNA V4 region was amplified using forward primer V4F 5′-CCAGCA(G/C)C(C/T)GCGGTAATTCC-3′ and the reverse primer V4R 5′-ACTTTCGTTCTTGAT(C/T)(A/G)A-3′ [20]. Both forward and reverse primers were tagged with adapter and sample-specific barcodes. The PCR reaction system was 50 μL, including 50 ng template DNA, 1 μL each of positive and negative primers, and 25 μL 2× Mix (Tiangen, Beijing, China), with the remaining volume supplemented with DEPC water. Thermal cycling consisted of initial denaturation at 95 °C for 3 min, followed by 20 cycles of denaturation at 95 °C for 30 s, annealing at 50 °C for 30 s, elongation at 72 °C for 40 s, and a final extension at 72 °C for 10 min. The degradation and contamination of PCR products were monitored on 1% agarose gels, followed by purifying with the Qiagen Gel Extraction Kit (Qiagen, Hilden, Germany) according to the manufacturer’s instructions. The sequencing libraries were generated using TruSeq® DNA PCR-Free Sample Preparation Kit (Illumina, San Diego, CA, USA) following the manufacturer’s recommendations, and index codes were added. The library quality was assessed on the Qubit@ 2.0 Fluorometer (Thermo Scientific, Waltham, MA, USA) and Agilent Bioanalyzer 2100 system (Agilent Technologies, Santa Clara, CA, USA). Pyrosequencing of PCR products was performed using the Illumina NovaSeq platform (Illumina, Santa Clara, CA, USA; Novogene, Beijing, China), and 250 bp paired-end reads were generated.

2.3. Bioinformatics Analysis

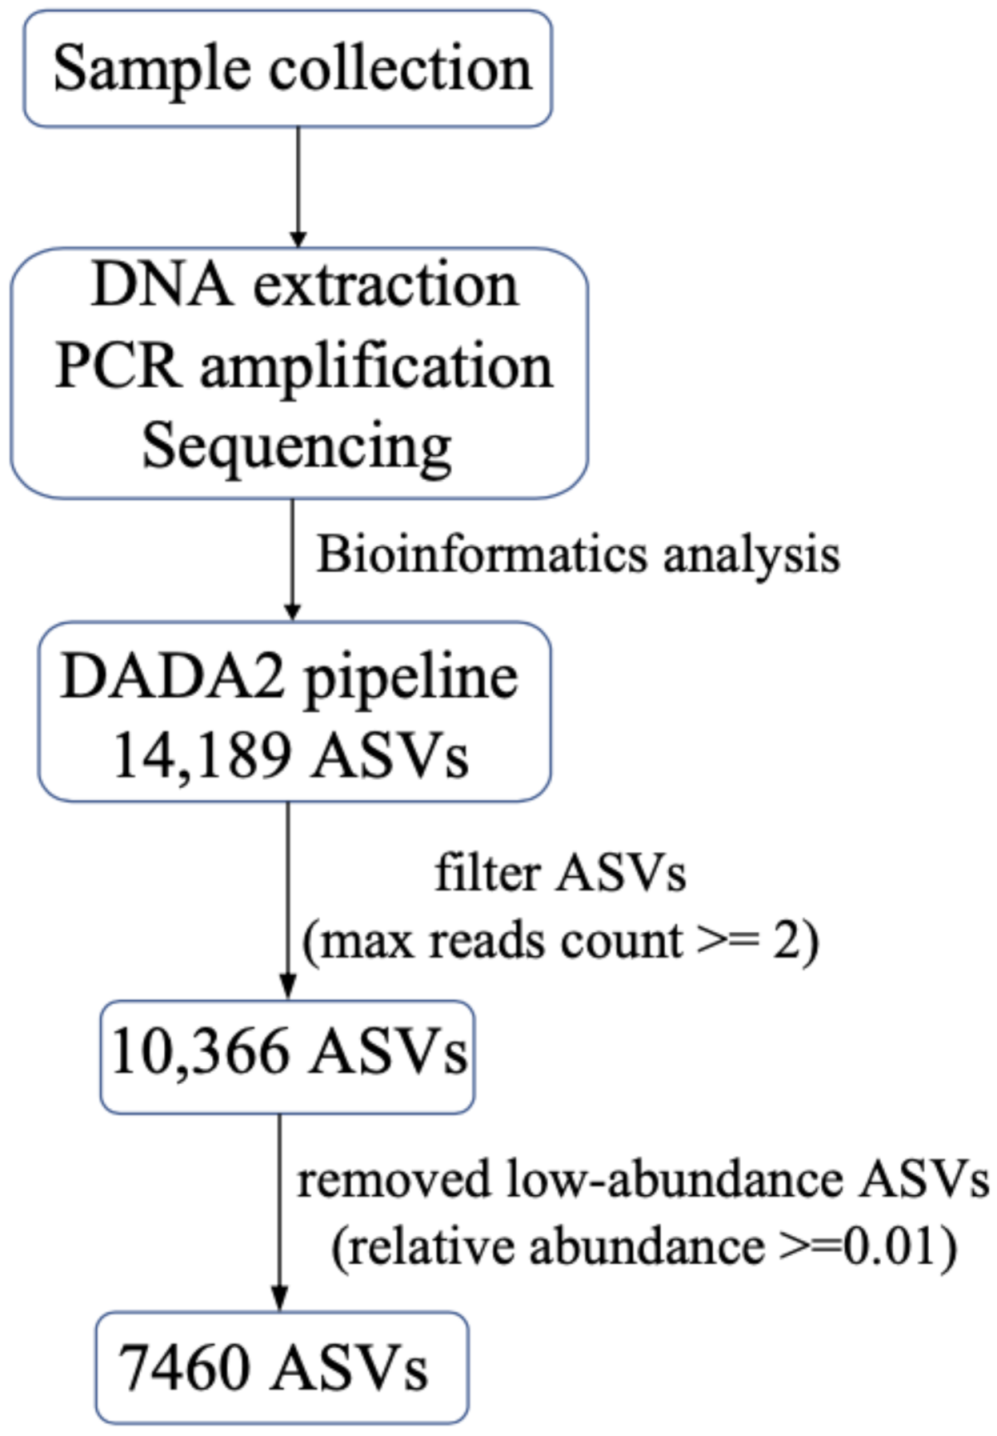
The sequencing results were analyzed using the R package DADA2 [17,18]. We set the parameters as follows: maxEE = c (2,2); minLen = 200; truncLen = c (220,220); Min overlap = 12; basesminBoot = 80. In this study, ASVs supported by two or more reads were selected for further analysis. Then, we removed low-abundance ASVs. Only ASVs that were supported by 0.01% of reads in at least one sample were included in further detailed analysis (Figure 2). The ASVs were annotated as part of the DADA2 analysis pipeline to the species according to Protist Ribosomal Reference database [21] (https://github.com/pr2database/pr2database, PR2, accessed on March 2021). For the ASVs that were not annotated in this step, we searched the NCBI NT database using blastn (E-value = 10−6, qcovs > 95) with a PID threshold of 99.00%. Based on the relationship between ASVs and species, ASVs were divided into two groups. The first group contained ASVs that had clear one ASV–one species relationship, while the second group contained ASVs in which multiple ASVs corresponded to one species (in this group, we chose the five ASVs with the highest abundance). An ASV was annotated as an HAB species if it had been reported as an HAB species in previous studies.
The rarefaction curves (Figure S1) were plotted with ASV richness using the R package vegan [22] for all samples. The alpha diversity indices of phytoplankton were analyzed using the R package vegan [22], including Richness (ASVs), Chao1 [23], ACE [24], Shannon diversity [25], Simpson’s diversity index [26], Pielou index [27], and Good’s coverage [28], and all of the indices were drawn using Prism 8 (GraphPad Software, San Diego, CA, USA). Surfer 16 (Golden Software LLC, Golden, CO, USA) was used to draw the spatial distributions of the alpha diversity index and HAB species from the expedition.
ASVs richness and relative abundance at the phylum and class levels were counted using Python scripts. The histogram figures, pie charts, and bubble chart were drawn with the R package ggplot2 [29]. Correlations of the environmental factors with HAB species were carried out by R package psych [30], and the figures were drawn by R package corrplot [31].
Phylogenetic trees of HAB species were generated in MEGA7 [32], using the Neighbor-Joining (NJ) method with 1000 bootstrap replicates. Phylogenetic haplotype networks were constructed using the statistical parsimony algorithm implemented in TCS network [33]. The haplotype file was obtained with DnaSP 6 [34]. Networks were visualized in PopART v1.7 [35], including the information of read abundances for each haplotype.

3. Results

3.1. Phytoplankton Composition and Relative Abundance in the Western Pacific Seamount Regions

Using 6,046,948 raw reads obtained through sequencing of 80 samples collected at 21 sampling sites in a seamount area of the Western Pacific Ocean (Figure 1) in 2019, we obtained 14,189 ASVs using DADA2 [17,18], among which 7460 ASVs were individually supported by at least 0.01% of reads in at least one of the 80 samples (Figure 2).
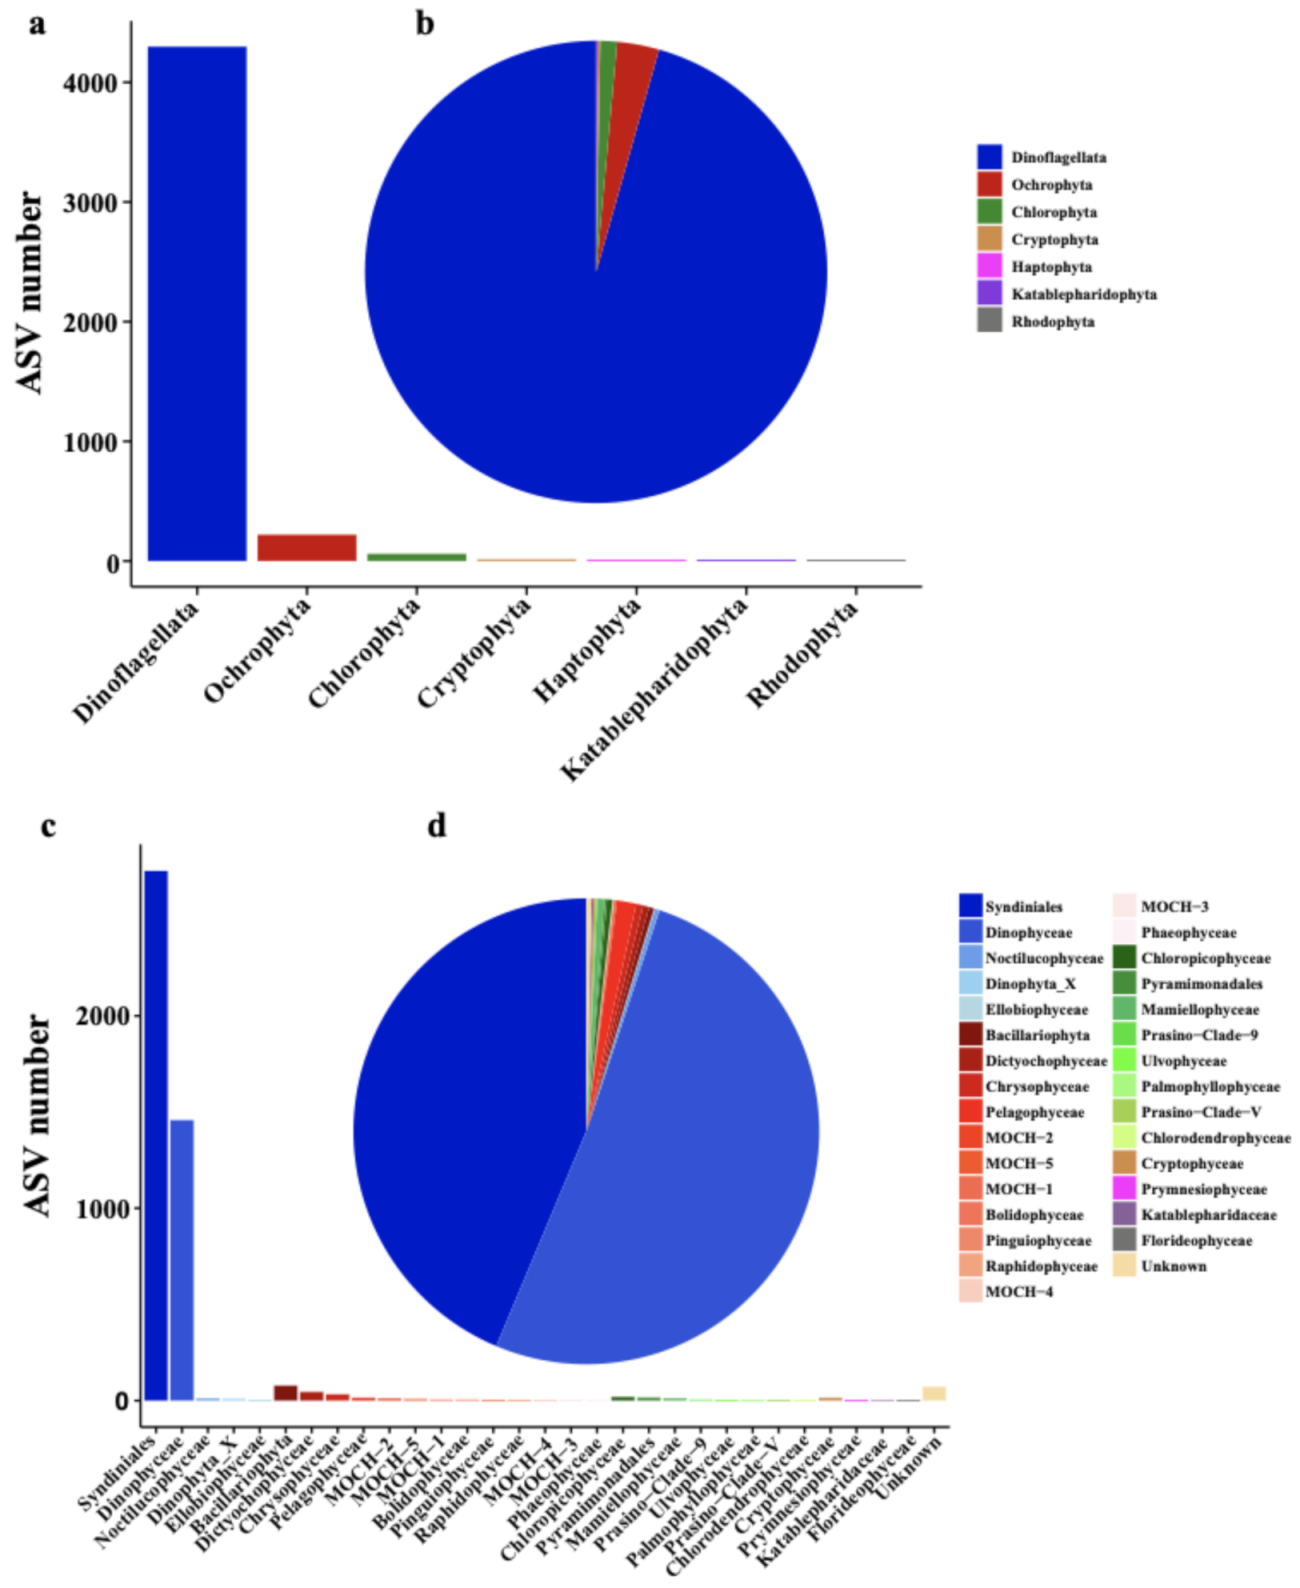
Among these 7460 ASVs, 4601 ASVs were further classified into seven phyla/divisions including Dinoflagellata (4298 ASVs), Ochrophyta (220 ASVs), Chlorophyta (60 ASVs), Cryptophyta (15 ASVs), Katablepharidophyta (5 ASVs), Haptophyta (2 ASVs), and Rhodophyta (1 ASV) (Figure 3a). Thus, the richness of Dinoflagellata was by far the most dominant among all phyla/divisions. The relative abundance of Dinoflagellata ASVs was also by far the highest (95.61%), followed by Ochrophyta (2.94%) and Chlorophyta (1.17%) (Figure 3b). Of all classes of these seven phytoplankton phyla/divisions, the richness of Syndiniales (2754 ASVs) was the highest (Figure 3c), and the relative abundance of Dinophyceae was the highest (51.22%) (Figure 3d); both classes belong to Dinoflagellata.
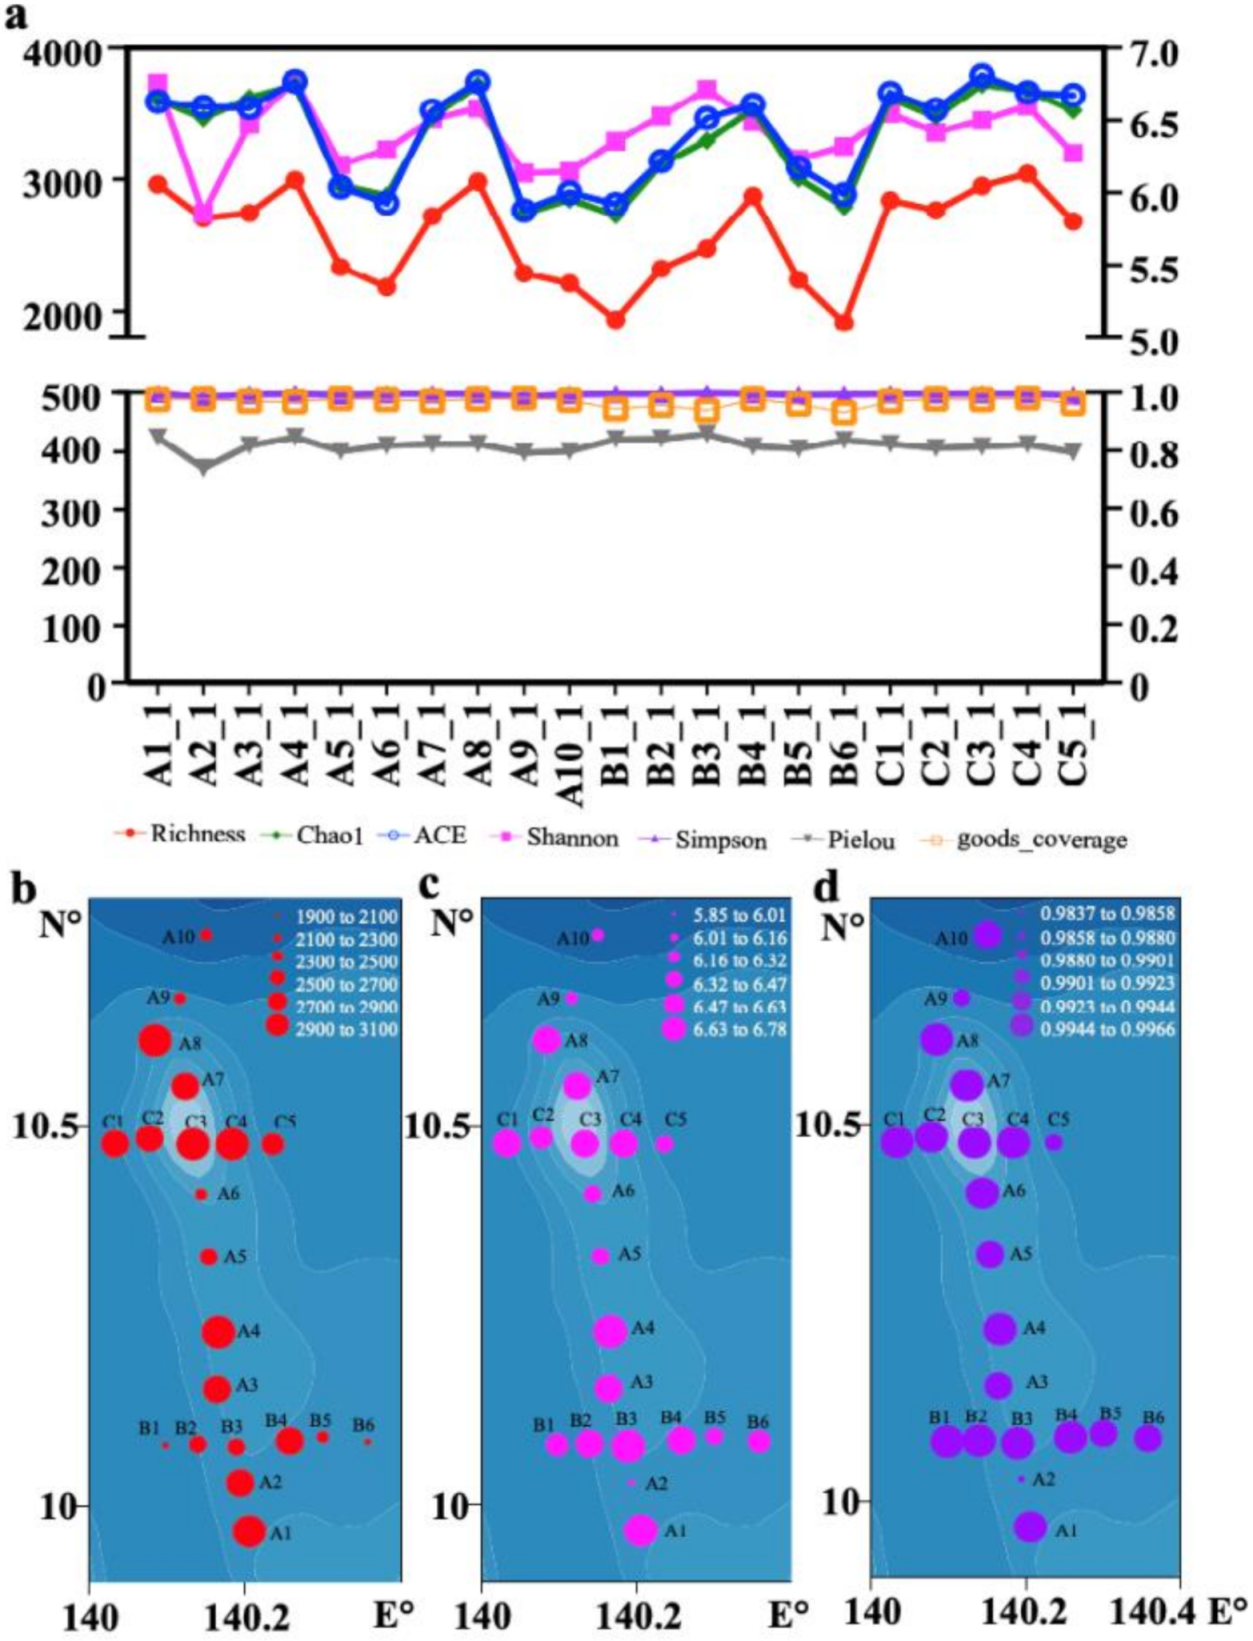
To explore the richness and evenness of phytoplankton at all sampling sites in the Western Pacific seamount regions, alpha diversity indices were calculated for each sampling site, from both sections A, B, and C (Figure 4, Figure S2). The phytoplankton richness at all the sampling sites fluctuated within a certain range, showing that C4 had the largest richness and B6 had the smallest richness. The Shannon index and Simpson’s diversity index at all the sampling sites were generally even, showing a slight increase at section C. The Good’s coverage index suggested that the sequencing depth of this study was sufficient.

3.2. Phytoplankton Composition, Diversity, and Distribution Patterns in the Western Pacific Seamount Regions

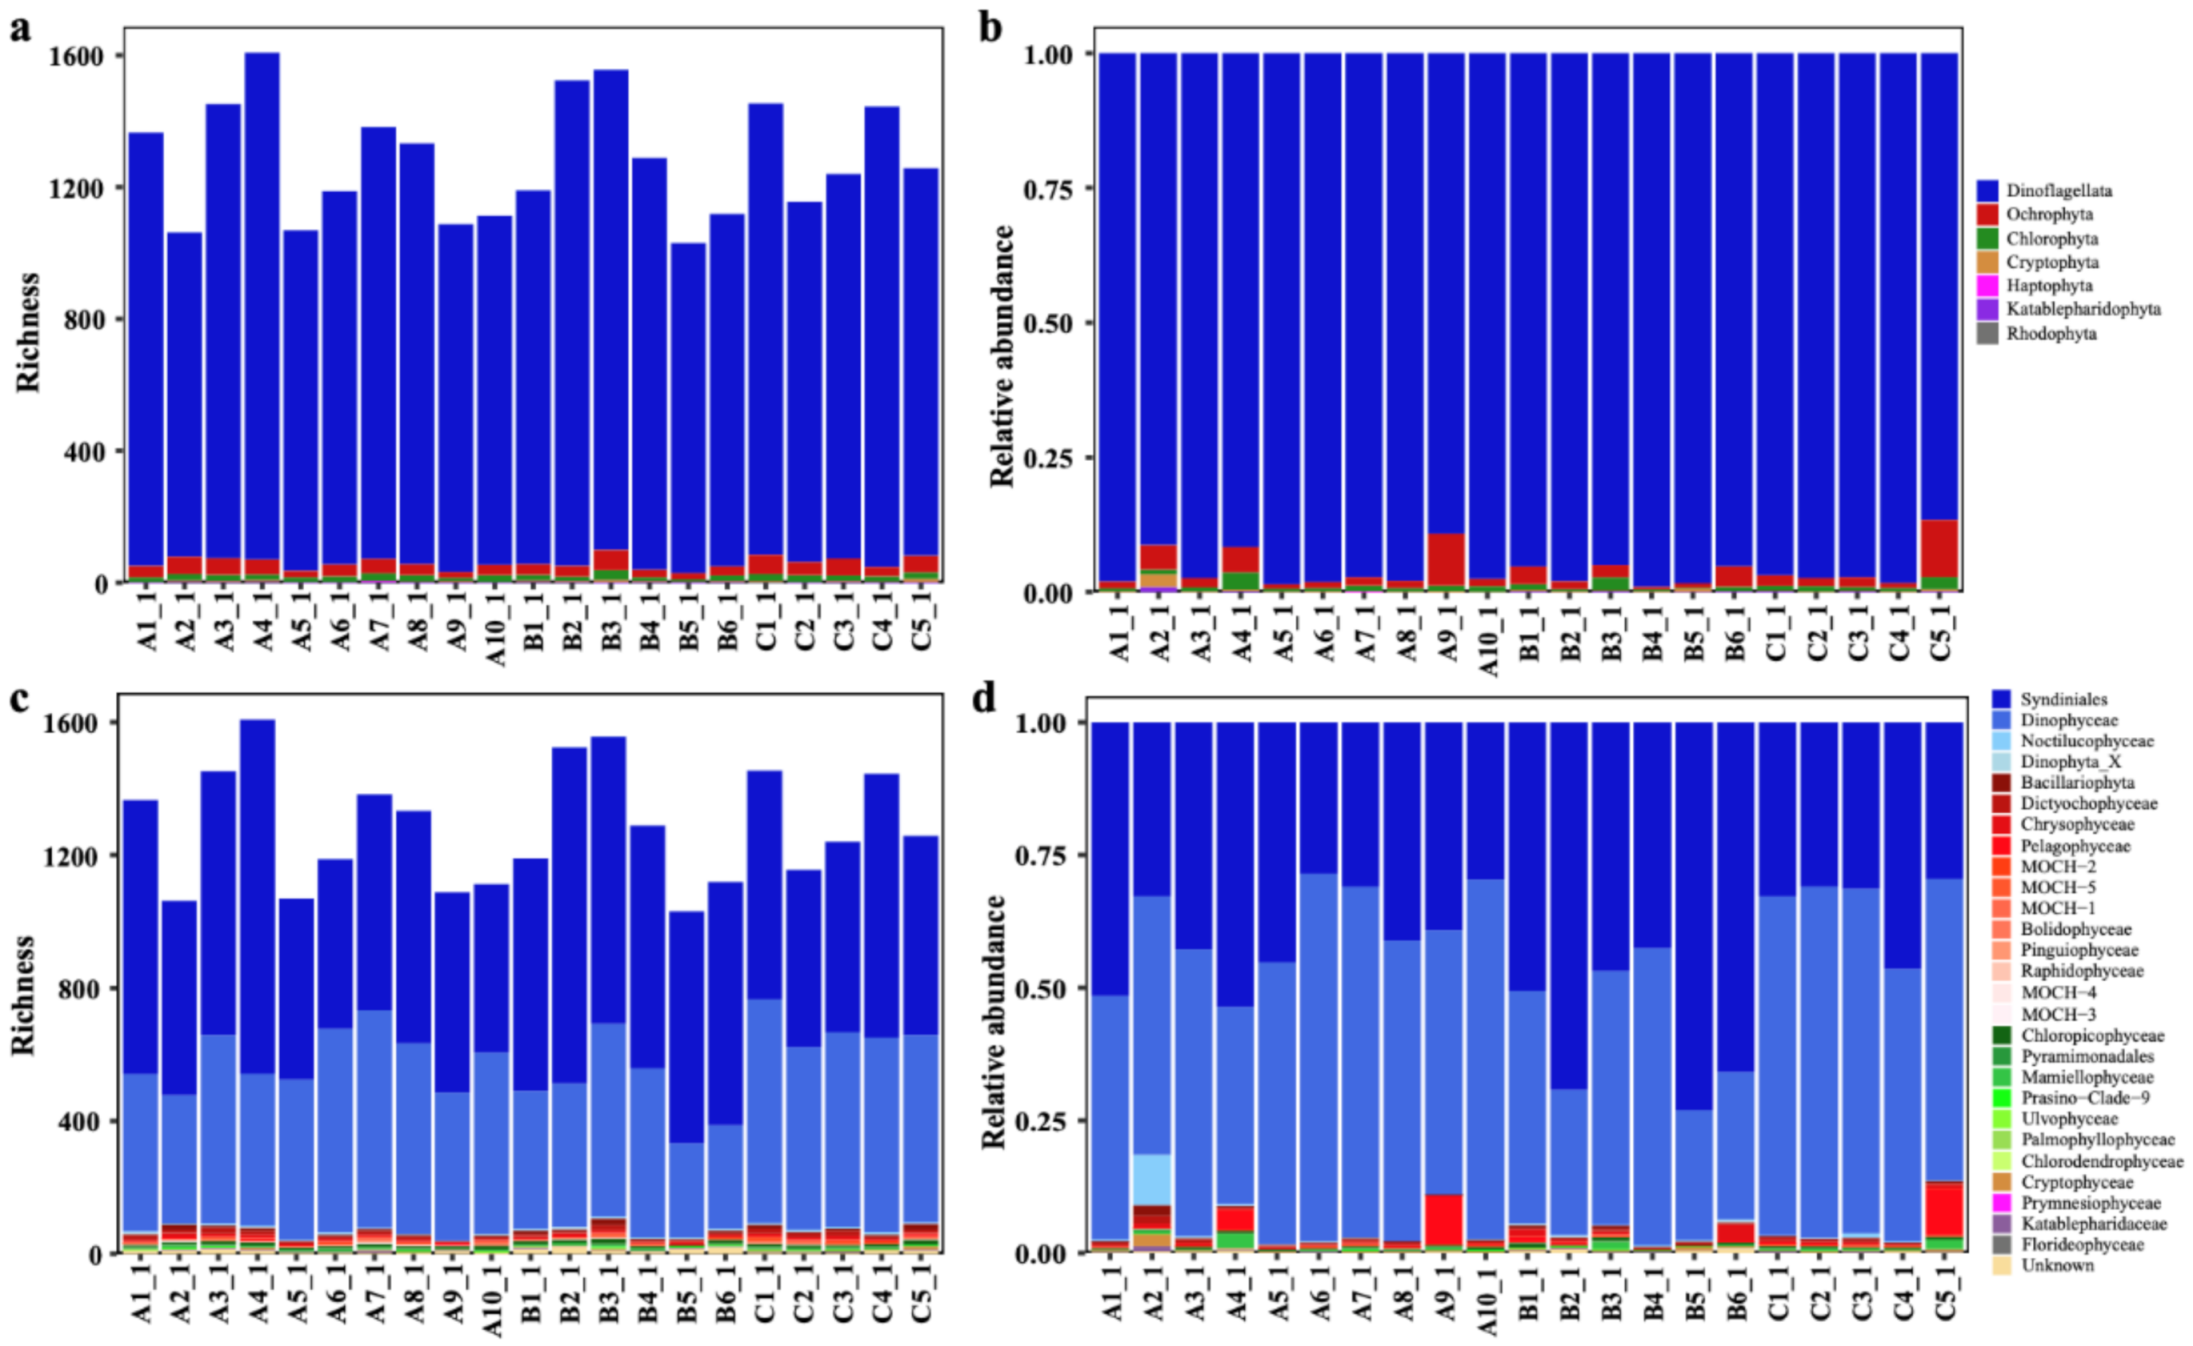
The richness and relative abundance of the phytoplankton at the different sampling sites were compared at phylum/division and class levels (Figure 5, Figure S3). At the phylum/division level, we found that Dinoflagellata was clearly dominant at all sampling sites (Figure 5a,b). At the class level, different classes of phytoplankton showed uneven distribution patterns among all sampling sites, with Syndiniales and Dinophyceae being the dominant phytoplankton groups (Figure 5c,d).
Among the 60 most abundant genera, the top-ranking genera were either of Syndiniales including Dino-Group-I-Clade-1_X, Dino-Group-II-Clade-10-and-11_X, Dino-Group-I-Clade-5_X, Dino-Group-II-Clade-7_X, Dino-Group-I-Clade-4_X, and Dino-Group-II-Clade-6_X, or of Dinophyceae including Prorocentrum, Lepidodinium, Gyrodinium, and Warnowia, all of which belonged to Dinoflagellata (Figure 6). These top-ranking genera had different composition at different depths, with the relative abundances in the surface samples higher than those in the DCM (deep chlorophyll maximum) samples. Different genera also displayed differential distribution between the different sampling sites (Figure 6).
Phylogenetic network analyses of 18S rDNA V4 sequences were constructed using an agglomerative approach where clusters are progressively combined with one or more connecting edges (Figure 7). We found that the main branches connecting the nodes showed little reticulation in genera Alexandrium, Azadinium, Gymnodinium, and Margalefidinium, suggesting limited gene flow. However, in the genera Karenia and Prorocentrum, the network structures were rather complex, suggesting the possibility of gene flow among different taxa. The genus Dino−Group−I−Clade−5_X demonstrated the most complex network structure (Figure 7g).
For each genus identified, a high level of biological diversity was generally uncovered, indicating the existence of a large number of species, many of which are currently unannotated, suggesting the existence of a large number of potentially novel species that have not been characterized previously (Figure 7). Notably, each genus contained multiple HAB species. For example, among 17 ASVs in the genus Alexandrium in the metabarcoding analysis of samples from this expedition in the Western Pacific seamount region, four were annotated as unique HAB species, including A. andersonii, A. affine, A. leei, and A. ostenfeldii (Figure 7a). All other ASVs in the genus Alexandrium remained currently unknown. Similarly, among the 32 ASVs annotated in the genus Karenia, 17 ASVs were annotated as HAB species, corresponding to K. papilionacea and K. selliformis. Among these, K. papilionacea displayed the highest diversity, corresponding to 15 ASVs, suggesting K. papilionacea may contain a larger number of cryptic diversities (Figure 7b). Among the 13 ASVs annotated in the genus Azadinium, two ASVs were annotated as the HAB A. dexteroporum, with the rest corresponding to unknown species (Figure 7c). Among the 16 ASVs identified in the genus Margalefidinium, one ASV was annotated as the HAB M. polykrikoides, with the rest corresponding to currently unknown species (Figure 7d). Among the 23 ASVs in the genus Gymnodinium, three ASVs were annotated as the HAB species G. aureolum and G. impudicum, with the rest corresponding to currently unknown species (Figure 7e). Among the 39 ASVs in the genus Prorocentrum, two were annotated as HAB species P. reticulatum and P. tyrrhenicum, respectively (Figure 7f).

3.3. HAB Species Composition and Distribution in the Western Pacific Seamount Regions

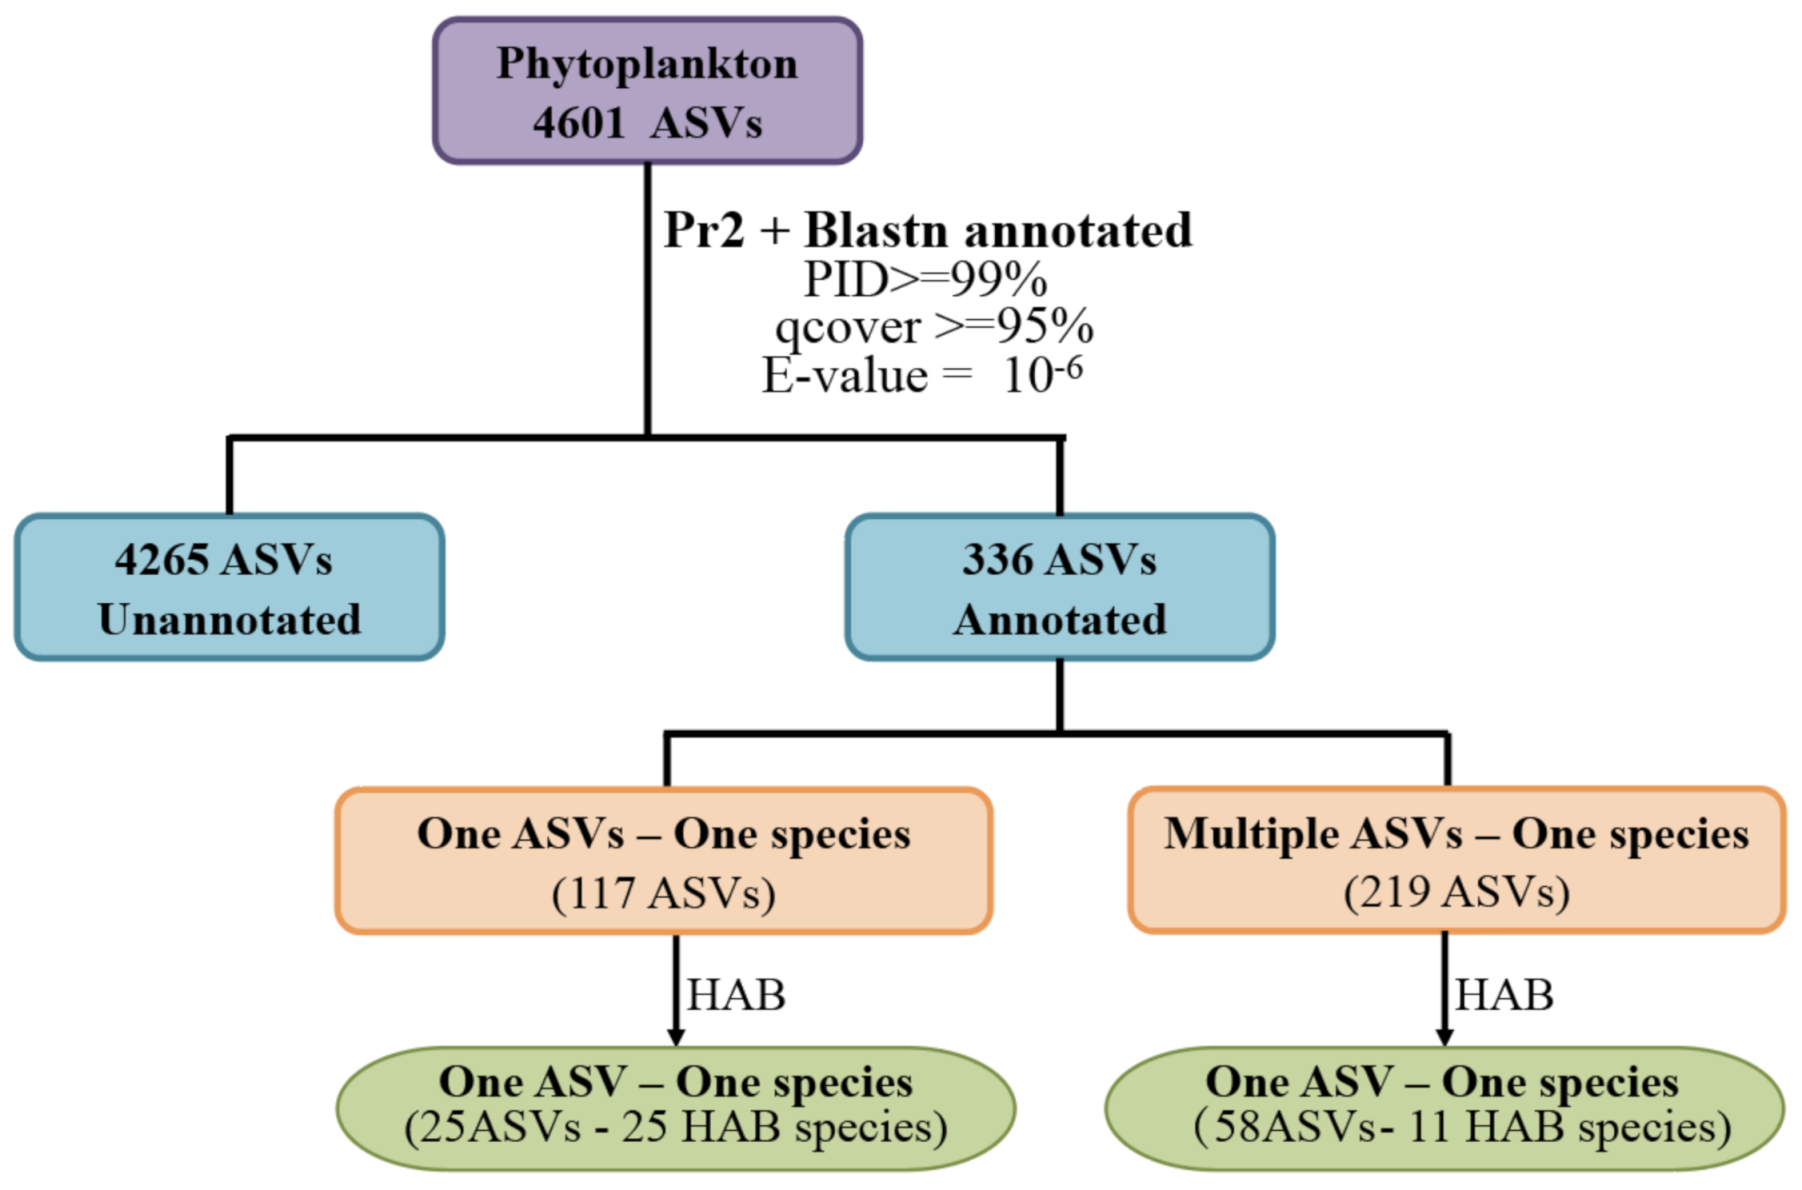
Of the 4601 phytoplankton ASVs, only a small percentage (7.3%, corresponding to 336 ASVs) were annotated to known species, suggesting the limitation of current databases and that most phytoplankton species in the Western Pacific are inadequately studied molecularly. Among these 336 ASVs, 117 ASVs were annotated with one ASV–one species relationship to 117 species and 219 ASVs were annotated to 46 species with multiple ASV–one species relationship, resulting in the identification of 163 phytoplankton species (Figure 8).
Among these 163 species annotated above, 25 were annotated as HAB species with one ASV–one species relationship; 11 HAB species were annotated with multiple ASV–one species relationship, corresponding to 58 ASVs. These 11 HAB species could have high genetic diversities, or represent potential cryptic diversity (Figure 8). Taking these observations together, we identified 36 potential HAB species (Table 1) in the seamount area of the Western Pacific Ocean based on evidence reported in previous studies. These 36 HAB species included 22 species in Dinoflagellata and 14 in Ochrophyta. Among the 22 dinoflagellates, almost all species were from the class Dinophyceae expect for Noctiluca scintillans, which was from the class Noctilucophyceae (Table 1). The 36 HAB species were widely distributed in the surface seawater of the investigation area (Figure 9), with some HAB species presenting in all 21 sampling sites, including Karlodinium veneficum, K. papilionacea, and Heterocapsa rotundata. K. veneficum (ASV11) (Figure 9b), which showed higher abundance in the Western Pacific seamount regions, was frequently found in marine water and often became the dominant species of HABs in coastal regions. Notably, N. scintillans was found to be the most abundant at the sampling site A2 (Figure 9a). Among 36 HAB species identified in the Western Pacific seamount regions, 13 HAB species were also commonly identified in the East China Sea and the Changjiang Estuary, including seven Dinoflagellata species (K. veneficum, Katodinium glaucum, Akashiwo sanguinea, Cochlodinium polykrikoides, Gonyaulax polygramma, Amphisolenia bidentate, and N. scintillans) and six Ochrophyta species (Eucampia cornuta, Chaetoceros peruvianus, Cerataulina pelagica, Rhizosolenia setigera, C. affinis, and C. curvisetus) [36,37].

3.4. Environmental Factors Correlated with HAB Species

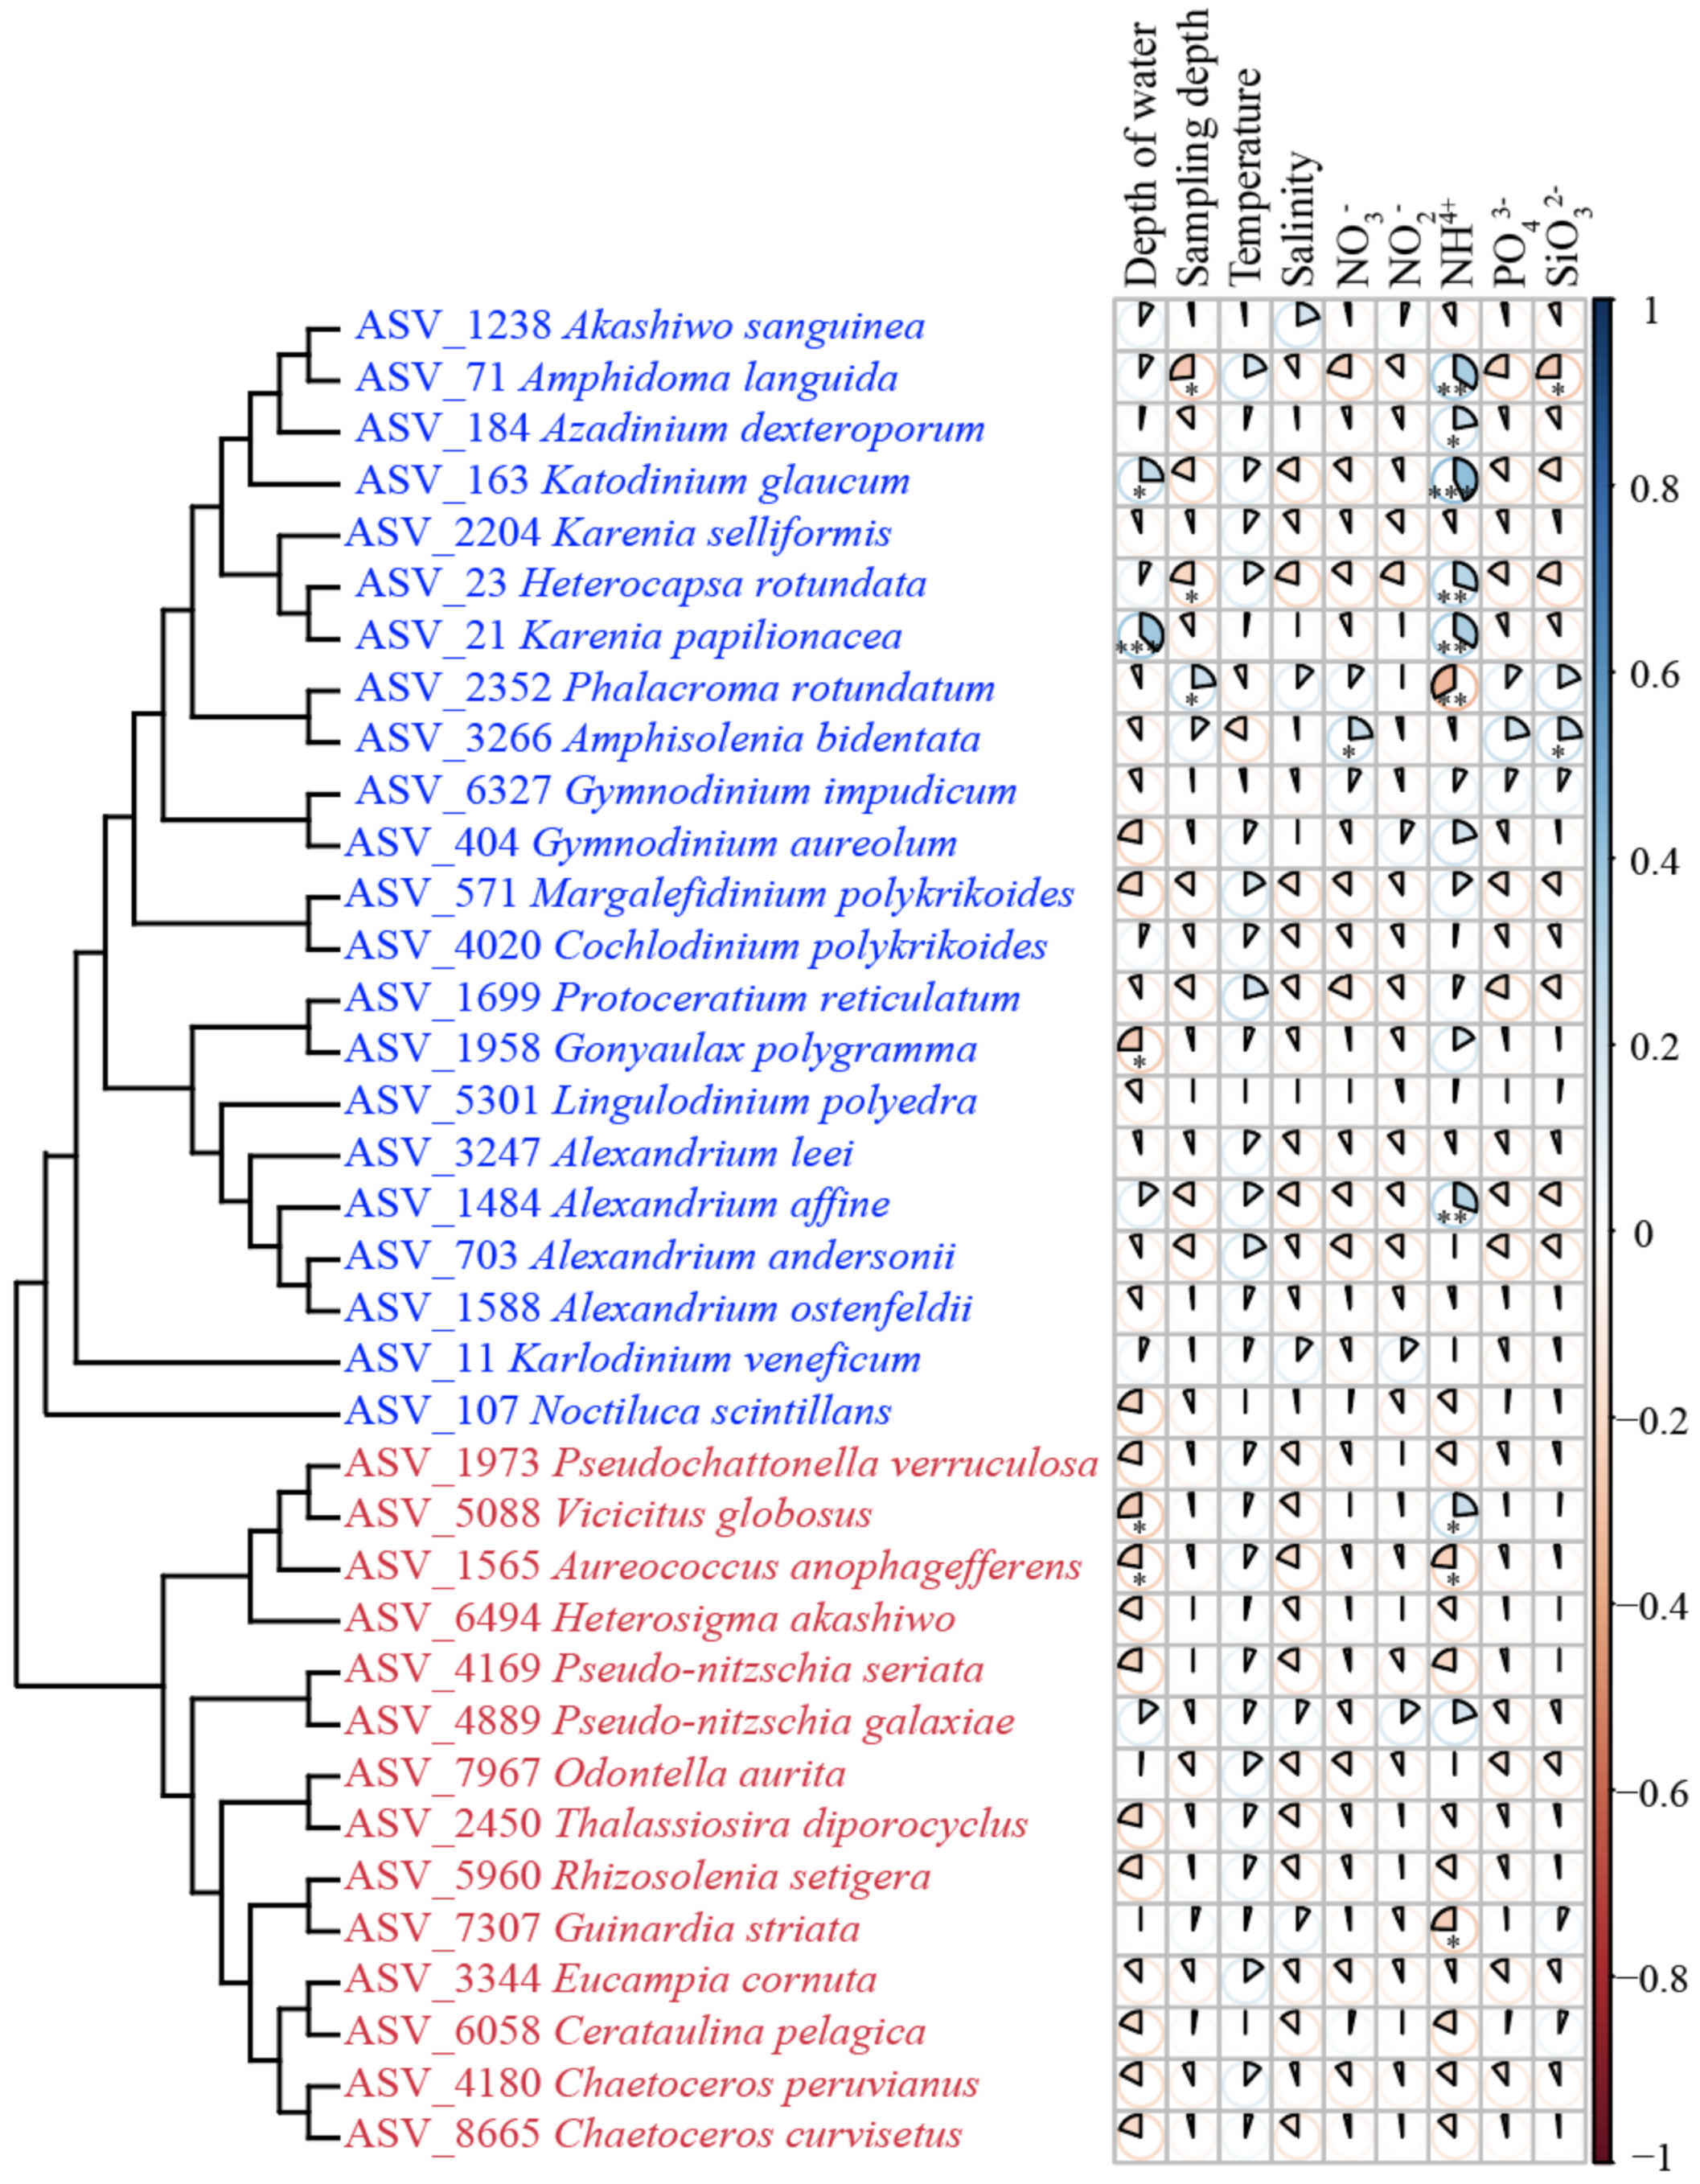
Among the HAB species, the relative abundance of K. papilionacea, Amphidoma languida, and K. glaucum had significant correlations with NH4+ (p < 0.01, |r| > 0.4) (Figure 10). The relative abundance of Phalacroma rotundatum had significant correlations with NH4+ (p < 0.01, |r| > 0.3). The relative abundance of K. papilionacea also had significant correlations with the depth of the water (p < 0.05, |r| > 0.4).

4. Discussion

Through an ASV-based metabarcoding analysis method, DADA2, we identified rich phytoplankton composition and many HAB species in the Western Pacific seamount regions. High phytoplankton diversity was successfully uncovered in the Western Pacific seamount regions in this study, suggesting that the richness of phytoplankton and HAB species was previously underestimated [13,14]. However, among the 4601 ASVs annotated as phytoplankton species, only a small portion (336 ASVs, 7.3%) could be annotated to known phytoplankton species, whereas the vast majority (4265, 92.7%) could not be annotated, suggesting that phytoplankton in the Western Pacific seamount regions are seriously understudied. Because of the limitation of current molecular marker databases, 18S rDNA V4 sequences of many species are absent from the reference databases, which is why most ASVs could not be properly annotated. Therefore, molecular markers of more phytoplankton species are urgently needed.
Of the small portion of the ASVs that could be annotated, our analysis revealed that Dinoflagellata was the most dominant group of phytoplankton in the Western Pacific seamount regions (Figure 3). This result was not totally surprising because Dinoflagellata was also previously reported to be the most dominant phyla in the Western Pacific regions [16,47], which may be due to environmental factors (including temperature) in these regions [16,48]. However, the relatively high abundance of species in Dinoflagellata estimated by ASVs cannot be simply interpreted as high cell density of these species because the relative abundance of ASVs highly depends on the copy numbers of rDNA genes. The numbers of rDNA genes in each dinoflagellate genome can reach up to tens of thousands [49,50]. In contrast, the numbers of rDNA genes in each diatom genome are usually below 100 [51]. Thus, the rDNA gene copy number information is critical for accurate interpretation of ASVs.
Analysis of the top 60 ranking genera in the surface and DCM seawaters revealed that the most abundant genera included Dino-Group-I-Clade-5_X (Figure 7g), Dino-Group-II-Clade-1_X, Dino-Group-II-Clade-10-and-11_X, Dino-Group-II-Clade-7_X, and Dino-Group-I-Clade-4_X, which belonged to parasitic Syndiniales. These parasitic species, which are ubiquitous in ocean regions and infect and kill a wide range of dinoflagellates including many harmful algal species [52], remained poorly characterized in general.
Phylogenetic network analysis of representative genera revealed rich diversity of many genera including Alexandrium (Figure 7a), Karenia (Figure 7b), Azadinium (Figure 7c), Margalefidinium (Figure 7d), Gymnodinium (Figure 7e), Prorocentrum (Figure 7f), and Dino−Group−I−Clade−5_X (Figure 7g). The genus Dino−Group−I−Clade−5_X showed the highest diversity. HAB species have been identified in many genera. For example, three HAB species were identified in the toxic genus Alexandrium, including A. andersonii, A. affine, and A. leei, which showed wide biogeographic distribution. The mixotrophic A. andersonii [53], which is toxic and can produce toxins including saxitoxin (STX) and neosaxitoxin (NEO) [54,55], has been identified in China [56] and Malaysia [57]. The mixotrophic A. affine [53] is a cosmopolitan species that has been identified in European, North American, Asian, and Australian waters [58]. A. leei exhibited potent toxicity to finfish, rotifer, and brine shrimp [59] and has been identified in Malaysia [60], Singapore [61], China [56], and Japan [62].
Among these 336 ASVs annotated to known phytoplankton species, 117 ASVs were annotated with one ASV–one species relationship, while 219 ASVs (65.18%) were annotated to 46 species with multiple ASV–one species relationship. Such multiple ASV–one species relationship suggest that some phytoplankton species including Aureococcus anophagefferens, K. papilionacea, and K. veneficum may have high levels of genetic diversity, and that these species may have cryptic diversity corresponding to different ASVs. These results were consistent with previous studies showing that some species exhibited genetic diversity and a large number of cryptic diversities corresponding to A. anophagefferens [63] and K. veneficum [64], respectively. Additionally, some ASVs each corresponded to multiple species in the Western Pacific seamount regions, suggesting that the 18S rDNA V4 region did not have adequate resolution for resolving phytoplankton species. For example, P. donghaiense, which is common in coastal waters in China, Japan, and Korea [65,66,67], was not identified (Figure 7f) because its 18S rDNA V4 sequence is identical to that of many other Prorocentrum species. Full-length 18S rDNA sequences may be needed to resolve these phytoplankton species.
We identified 36 HAB species in the Western Pacific seamount regions, among which 29 were identified for the first time in the Western Pacific Ocean, partly because studies of HAB species in this region have been limited. Other reasons are also possible. First, the relative abundances of some HAB species were low, meaning they were unlikely to have been collected on previous expeditions. Second, the small cell size of some HAB species might prevent them from being properly identified with a microscope. Third, some of these HAB species might not have been well-preserved in samples, preventing their observation [68]. Of these identified Dinoflagellata HAB species, only A. bidentata and G. polygramma were previously reported in the Western Pacific Ocean [13]. K. veneficum, K. glaucum, and A. andersonii were frequently found in marine waters and often became the dominant species of HABs [13,19,69]. However, these species had never been documented in previous studies in the Western Pacific Ocean, which demonstrated the advantage of the metabarcoding approach in identifying the HAB species composition in the phytoplankton community. Of these identified Ochrophyta HAB species, 9 HAB species have never been reported in previous studies in the Western Pacific Ocean [13,70]. The co-occurrence of 13 HAB species in the Western Pacific seamount regions, the East China Sea, and the Changjiang Estuary [36,37] suggests potential correlation among these ocean regions, possibly via diverse ocean currents including the North Equatorial Current and the Kuroshio branch. This result was consistent with previous findings that the Kuroshio branch can carry HAB species into coastal waters [71].
For future studies, time-series samples of more seamount regions of the Western Pacific will be collected. For comparative analysis, morphological analysis and cell density analysis of different species would be beneficial. A significant limitation of metabarcoding analysis is the limited representation of current molecular marker databases. Thus, enrichment of molecular marker databases is urgently needed. In addition, the availability of rDNA copy number information also will be valuable for the accurate interpretation of results from metabarcoding analyses.

5. Conclusions

Through metabarcoding analysis of samples collected from seamount regions in the Western Pacific Ocean, we revealed that these ocean regions have high phytoplankton biodiversity. We identified 4601 ASVs representing 34 classes in seven protist phyla/divisions, among which Dinoflagellata was the dominant group of phytoplankton. Among the 4601 ASVs annotated as phytoplankton species, the vast majority failed to be annotated, suggesting that phytoplankton in the Western Pacific seamount regions are seriously understudied. Our research identified 36 potential HAB species, most of which displayed unique spatial distribution patterns in the Western Pacific seamount regions. We also identified 13 HAB species shared by the Western Pacific seamount regions and coastal regions, suggesting potential correlation among these ocean regions.

Supplementary Materials

The following are available online at https://www.mdpi.com/article/10.3390/ijerph182111470/s1, Figure S1: Alpha Rarefaction curves of ASVs for all samples collected from the Western Pacific seamount regions, Figure S2: Alpha diversity of DCM samples from the Western Pacific seamount regions, Figure S3: Phytoplankton richness and relative abundance at each DCM samples in the Western Pacific seamount regions.

Author Contributions

Conceptualization, N.C.; Data curation, Q.X.; formal analysis, Q.X. and C.W.; funding acquisition, K.X. and N.C.; sample collection, C.W. and Kuidong Xu; methodology, Q.X. and N.C.; project administration, N.C.; resources, C.W. and Kuidong Xu; software, Q.X.; supervision, N.C.; validation, Q.X., C.W. and N.C.; visualization, Q.X.; writing—original draft, Q.X., C.W. and N.C.; writing—review & editing, Q.X. and N.C. All authors have read and agreed to the published version of the manuscript.

Funding

This research was supported by the Strategic Priority Research Program of the Chinese Academy of Sciences (Grant No. XDB42000000), the Chinese Academy of Sciences Pioneer Hundred Talents Program (to Nansheng Chen), the Taishan Scholar Project Special Fund (to Nansheng Chen), and the Qingdao Innovation and Creation Plan (Talent Development Program—5th Annual Pioneer and Innovator Leadership Award to Nansheng Chen, 19-3-2-16-zhc). Data acquisition and sample collections were supported by the Science & Technology Basic Resources Investigation Program of China (2017FY100804). This cruise was conducted onboard R/V “Science” by The Institute of Oceanology, the Chinese Academy of Sciences, China.

Institutional Review Board Statement

Not applicable.

Informed Consent Statement

Not applicable.

Data Availability Statement

The sequencing results (raw data) have been submitted to NCBI, and the BioProject number is PRJNA764782.

Acknowledgments

We are thankful to all members of the Marine Ecological and Environment Genomics Research Group at Institute of Oceanology, Chinese Academy of Sciences.

Conflicts of Interest

The authors declare no conflict of interest.

References

  1. Granéli, E.; Weberg, M.; Salomon, P.S. Harmful algal blooms of allelopathic microalgal species: The role of eutrophication. Harmful Algae 2008, 8, 94–102. [Google Scholar] [CrossRef]
  2. Lin, S.; Ji, N.; Luo, H. Recent progress in marine harmful algal bloom research. Oceanol. Et Limnol. Sinica 2019, 50, 496–508. [Google Scholar]
  3. Smayda, T.J. Reflections on the ballast water dispersal—harmful algal bloom paradigm. Harmful Algae 2007, 6, 601–622. [Google Scholar] [CrossRef]
  4. Doblin, M.A.; Popels, L.C.; Coyne, K.J.; Hutchins, D.A.; Cary, S.C.; Dobbs, F.C. Transport of the harmful bloom alga Aureococcus anophagefferens by oceangoing ships and coastal boats. Appl. Environ. Microbiol. 2004, 70, 6495–6500. [Google Scholar] [CrossRef] [PubMed] [Green Version]
  5. Probyn, T.; Pitcher, G.; Pienaar, R.; Nuzzi, R. Brown Tides and Mariculture in Saldanha Bay, South Africa. Mar. Pollut. Bull. 2001, 42, 405–408. [Google Scholar] [CrossRef]
  6. Zhang, Q.C.; Qiu, L.M.; Yu, R.C.; Kong, F.Z.; Wang, Y.F.; Yan, T.; Gobler, C.J.; Zhou, M.-J. Emergence of brown tides caused by Aureococcus anophagefferens Hargraves et Sieburth in China. Harmful Algae 2012, 19, 117–124. [Google Scholar] [CrossRef]
  7. Tang, Y.Z.; Ma, Z.; Hu, Z.; Deng, Y.; Yang, A.; Lin, S.; Yi, L.; Chai, Z.; Gobler, C.J. 3000 km and 1500-year presence of Aureococcus anophagefferens reveals indigenous origin of brown tides in China. Mol. Ecol. 2019, 28, 4065–4076. [Google Scholar] [CrossRef]
  8. Pitcher, T.J.; Bulman, C. Raiding the larder: A quantitative evaluation framework and strophic signature for seamount food webs. In Seamounts: Ecology, Fisheries, and Conservation; Pitcher, T.J., Morato, T., Hart, P.J.B., Clark, M.R., Haggan, N., Santos, R.S., Eds.; Blackwell: Oxford, UK, 2007; pp. 282–295. [Google Scholar]
  9. Comeau, L.A.; Vezina, A.F.; Bourgeois, M.; Juniper, S.K. Relationship between phytoplankton production and the physical structure of the water column near Cobb Seamount, northeast Pacific. Deep-Sea Res. 1995, 42, 993–1005. [Google Scholar] [CrossRef]
  10. Mourino, B.; Fernandez, E.; Serret, P.; Harbour, D.; Sinha, B.; Pingree, R. Variability and seasonality of physical and biological fields at the Great Meteor Tablemount (subtropical NE Atlantic). Oceanol. Acta. 2001, 24, 167–185. [Google Scholar] [CrossRef] [Green Version]
  11. Oliveira, A.P.; Coutinho, T.P.; Cabeçadas, G.; Brogueira, M.J.; Coca, J.; Ramos, M.; Calado, G.; Duarte, P. Primary production enhancement in a shallow seamount (Gorringe—Northeast Atlantic). J. Mar. Syst. 2016, 164, 13–29. [Google Scholar] [CrossRef]
  12. Zhao, L.; Zhao, Y.; Wang, C.; Zhang, W.; Sun, X.; Li, X.; Zhao, Y.; Xiao, T. Comparison in the distribution of microbial food web components in the Y3 and M2 seamounts in the tropical western pacific. Oceanol. Limnol. Sinica 2017, 48, 1446–1455. [Google Scholar]
  13. Chen, Z.; Sun, J.; Zhang, G. Netz-phytoplankton community structure of the tropical Western Pacific Ocean in summer 2016. Mar. Sci. 2018, 42, 114–130. [Google Scholar]
  14. Guo, S.; Sun, X.; Zheng, S.; Luo, X.; Zhu, M.; Liang, J. Net phytoplankton community structure in the Y3 and M2 seamount zone in the Western Tropical Pacific. Mar. Sci. 2018, 42, 31–40. [Google Scholar]
  15. Bik, H.M.; Porazinska, D.L.; Creer, S.; Caporaso, J.G.; Knight, R.; Thomas, W.K. Sequencing our way towards understanding global eukaryotic biodiversity. Trends Ecol. Evol. 2012, 27, 233–243. [Google Scholar] [CrossRef] [Green Version]
  16. Wu, P.F.; Li, D.X.; Kong, L.F.; Li, Y.Y.; Zhang, H.; Xie, Z.X.; Lin, L.; Wang, D.Z. The diversity and biogeography of microeukaryotes in the euphotic zone of the northwestern Pacific Ocean. Sci. Total Environ. 2020, 698, 134289. [Google Scholar] [CrossRef] [PubMed]
  17. Callahan, B.J.; McMurdie, P.J.; Rosen, M.J.; Han, A.W.; Johnson, A.J.; Holmes, S.P. DADA2: High-resolution sample inference from Illumina amplicon data. Nat. Method 2016, 13, 581–583. [Google Scholar] [CrossRef] [Green Version]
  18. Callahan, B.J.; McMurdie, P.J.; Holmes, S.P. Exact sequence variants should replace operational taxonomic units in marker-gene data analysis. ISME J. 2017, 11, 2639–2643. [Google Scholar] [CrossRef] [PubMed] [Green Version]
  19. Liu, S.; Gibson, K.; Cui, Z.; Chen, Y.; Sun, X.; Chen, N. Metabarcoding analysis of harmful algal species in Jiaozhou Bay. Harmful Algae 2020, 92, 101772. [Google Scholar] [CrossRef] [PubMed]
  20. Stoeck, T.; Bass, D.; Nebel, M.; Christen, R.; Jones, M.D.; Breiner, H.W.; Richards, T.A. Multiple marker parallel tag environmental DNA sequencing reveals a highly complex eukaryotic community in marine anoxic water. Mol. Ecol. 2010, 19 (Suppl. S1), 21–31. [Google Scholar] [CrossRef]
  21. Guillou, L.; Bachar, D.; Audic, S.; Bass, D.; Berney, C.; Bittner, L.; Boutte, C.; Burgaud, G.; de Vargas, C.; Decelle, J.; et al. The Protist Ribosomal Reference database (PR2): A catalog of unicellular eukaryote small sub-unit rRNA sequences with curated taxonomy. Nucleic Acids Res. 2013, 41, D597–D604. [Google Scholar] [CrossRef] [Green Version]
  22. Dixon, P. VEGAN, a package of R functions for community ecology. J. Veg. Sci. 2003, 14, 927–930. [Google Scholar] [CrossRef]
  23. Chao, A. Nonparametric estimation of the number of classes in a population. Scand. J. Stat. 1984, 11, 265–270. [Google Scholar]
  24. Chao, A.; Yang, M. Stopping rules and estimation for recapture debugging with unequal failure rates. Biometrika 1993, 80, 193–201. [Google Scholar] [CrossRef]
  25. Shannon, C.E.; Weaver, W. A Mathematical Theory of Communication; University of Illinois Press: Urbana, IL, USA, 1949. [Google Scholar]
  26. Simpson, E.H. Measurement of diversity. Nature 1949, 163, 688. [Google Scholar] [CrossRef]
  27. Pielou, E.C. An Introduction to Mathematical Ecology; Wiley-Interscience: New York, NY, USA, 1969. [Google Scholar]
  28. Good, I.J. The population frequencies of species and the estimation of population parameters. Biometrika 1953, 40, 237–264. [Google Scholar] [CrossRef]
  29. Wickham, H. ggplot2: Elegant Graphics for Data Analysis; Springer: New York, NY, USA, 2016. [Google Scholar]
  30. Revelle, W. psych: Procedures for Psychological, Psychometric, and Personality Research; Illinois R Package Version 2.0.8; Northwestern University: Evanston, IL, USA, 2020. [Google Scholar]
  31. Pering, T.D.; Tamburello, G.; McGonigle, A.J.S.; Hanna, E.; Aiuppa, A. Correlation of oscillatory behaviour in Matlab using wavelets. Comput. Geosci. 2014, 70, 206–212. [Google Scholar] [CrossRef]
  32. Kumar, S.; Stecher, G.; Tamura, K. MEGA7: Molecular Evolutionary Genetics Analysis Version 7.0 for Bigger Datasets. Mol. Biol. Evol. 2016, 33, 1870–1874. [Google Scholar] [CrossRef] [Green Version]
  33. Clement, M.; Posada, D.; Crandall, K.A. TCS: A computer program to estimate gene genealogies. Mol. Ecol. 2000, 9, 1657–1659. [Google Scholar] [CrossRef] [Green Version]
  34. Rozas, J.; Ferrer-Mata, A.; Sanchez-DelBarrio, J.C.; Guirao-Rico, S.; Librado, P.; Ramos-Onsins, S.E.; Sanchez-Gracia, A. DnaSP 6: DNA Sequence Polymorphism Analysis of Large Data Sets. Mol. Biol. Evol. 2017, 34, 3299–3302. [Google Scholar] [CrossRef]
  35. Leigh, J.W.; Bryant, D.; Nakagawa, S. popart: Full-feature software for haplotype network construction. Methods Ecol. Evol. 2015, 6, 1110–1116. [Google Scholar] [CrossRef]
  36. Chen, N.S.; Chen, Y. Advances in the study of biodiversity of phytoplankton and red tide species in China (II): The East China Sea. Oceanol. Et Limnol. Sinica 2021, 52, 363–384. [Google Scholar]
  37. Chen, N.S.; Cui, Z.M.; Xu, Q. Advances in the study of biodiversity of phytoplankton and red tide species in China (IV): The Changjiang Estuary. Oceanol. Et Limnol. Sinica 2021, 52, 402–417. [Google Scholar]
  38. Wang, J. HAB alga nearby Changjiang Estuary. Mar. Environ. Sci. 2002, 21, 37–41. [Google Scholar]
  39. Qin, Q.; Shen, J.; Reece, K.S.; Mulholland, M.R. Developing a 3D mechanistic model for examining factors contributing to harmful blooms of Margalefidinium polykrikoides in a temperate estuary. Harmful Algae 2021, 105, 102055. [Google Scholar] [CrossRef] [PubMed]
  40. Moestrup, Ø.; Akselmann-Cardella, R.; Churro, C.; Fraga, S.; Hoppenrath, M.; Iwataki, M.; Larsen, J.; Lundholm, N.; Zingone, A. IOC-UNESCO Taxonomic Reference List of Harmful Micro Algae; 2009; unpublished. [Google Scholar]
  41. MNR. Bulletin of China Marine Disaster; Ministry of Natural Resources: Beijing, China, 1989–2019.
  42. Guo, H. Illustrations of Planktons Responsible for the Blooms in Chinese Coastal Waters; Ocean Press: Beijing, China, 2004; pp. 1–107. [Google Scholar]
  43. Chang, F.H.; McVeagh, M.; Gall, M.; Smith, P. Chattonella globosa is a member of Dictyochophyceae: Reassignment to Vicicitus gen. nov., based on molecular phylogeny, pigment composition, morphology and life history. Phycologia 2012, 51, 403–420. [Google Scholar] [CrossRef]
  44. Cui, Y.; Zhang, H.; Lin, S. Enhancement of Non-photochemical Quenching as an Adaptive Strategy under Phosphorus Deprivation in the Dinoflagellate Karlodinium veneficum. Front. Microbiol. 2017, 8, 404. [Google Scholar] [CrossRef] [PubMed]
  45. Yamaguchi, H.; Hirano, T.; Yoshimatsu, T.; Tanimoto, Y.; Matsumoto, T.; Suzuki, S.; Hayashi, Y.; Urabe, A.; Miyamura, K.; Sakamoto, S.; et al. Occurrence of Karenia papilionacea (Dinophyceae) and its novel sister phylotype in Japanese coastal waters. Harmful Algae 2016, 57, 59–68. [Google Scholar] [CrossRef] [PubMed]
  46. Zhang, J.; Zhou, M.; Fukuyo, Y.; Matsuda, O.; Lee, S.G.; Lee, C.K.; Shulkin, V.; Orlova, T.; Kim, H.G.; Lu, S. Integrated Report on Harmful Algal Blooms (HABs) for the NOWPAP Region; NOWPAP CEARAC: Toyama, Japan, 2005. [Google Scholar]
  47. Chen, Z.; Sun, J.; Chen, D.; Wang, S.; Yu, H.; Chen, H.; Wang, M. Effects of Ocean Currents in the Western Pacific Ocean on Net-Phytoplankton Community Compositions. Diversity 2021, 13, 428. [Google Scholar] [CrossRef]
  48. Xiao, W.; Liu, X.; Irwin, A.J.; Laws, E.A.; Wang, L.; Chen, B.; Zeng, Y.; Huang, B. Warming and eutrophication combine to restructure diatoms and dinoflagellates. Water Res. 2018, 128, 206–216. [Google Scholar] [CrossRef]
  49. Lin, S. Genomic understanding of dinoflagellates. Res. Microbiol. 2011, 162, 551–569. [Google Scholar] [CrossRef] [PubMed]
  50. Howard, M.D.; Jones, A.C.; Schnetzer, A.; Countway, P.D.; Tomas, C.R.; Kudela, R.M.; Hayashi, K.; Chia, P.; Caron, D.A. Quantitative Real-Time Polymerase Chain Reaction for Cochlodinium fulvescens (Dinophyceae), a Harmful Dinoflagellate from California Coastal Waters(1). J. Phycol. 2012, 48, 384–393. [Google Scholar] [CrossRef]
  51. Zhu, F.; Massana, R.; Not, F.; Marie, D.; Vaulot, D. Mapping of picoeucaryotes in marine ecosystems with quantitative PCR of the 18S rRNA gene. FEMS Microbiol. Ecol. 2005, 52, 79–92. [Google Scholar] [CrossRef] [Green Version]
  52. Anderson, S.R.; Harvey, E.L. Temporal Variability and Ecological Interactions of Parasitic Marine Syndiniales in Coastal Protist Communities. mSphere 2020, 5, e00209-20. [Google Scholar] [CrossRef]
  53. Lee, K.H.; Jeong, H.J.; Kwon, J.E.; Kang, H.C.; Kim, J.H.; Jang, S.H.; Park, J.Y.; Yoon, E.Y.; Kim, J.S. Mixotrophic ability of the phototrophic dinoflagellates Alexandrium andersonii, A. affine, and A. fraterculus. Harmful Algae 2016, 59, 67–81. [Google Scholar] [CrossRef] [PubMed]
  54. Ciminiello, P.; Fattorussoa, E.; Forinoa, M.; Montresorb, M. Saxitoxin and neosaxitoxin as toxic principles of Alexandrium andersoni (Dinophyceae) from the Gulf of Naples, Italy. Toxicon 2000, 38, 1871–1877. [Google Scholar] [CrossRef]
  55. Sampedro, N.; Franco, J.M.; Zapata, M.; Riobó, P.; Garcés, E.; Penna, A.; Caillaud, A.; Diogène, J.; Cacho, E.; Camp, J. The toxicity and intraspecific variability of Alexandrium andersonii Balech. Harmful Algae 2013, 25, 26–38. [Google Scholar] [CrossRef] [Green Version]
  56. Gu, H.; Zeng, N.; Liu, T.; Yang, W.; Müller, A.; Krock, B. Morphology, toxicity, and phylogeny of Alexandrium (Dinophyceae) species along the coast of China. Harmful Algae 2013, 27, 68–81. [Google Scholar] [CrossRef]
  57. Razali, R.M.; Leaw, C.-P.; Lim, H.-C.; Ayub, M.N.A.; Rahim, M.; Lim, P.T. First report of a marine dinoflagellate, Alexandrium andersonii (Dinophyceae) in Malaysian waters. Malays. J. Sci. 2016, 35, 304–315. [Google Scholar] [CrossRef] [Green Version]
  58. Lim, Y.K.; Chun, S.J.; Kim, J.H.; Park, B.S.; Baek, S.H. Short-term response of pelagic planktonic communities after inoculation with the mass cultured dinoflagellate Alexandrium affine in a large-scale mesocosm experiment. J. Appl. Phycol. 2021, 33, 3123–3137. [Google Scholar] [CrossRef]
  59. Shang, L.; Xu, Y.; Leaw, C.P.; Lim, P.T.; Wang, J.; Chen, J.; Deng, Y.; Hu, Z.; Tang, Y.Z. Potent allelopathy and non-PSTs, non-spirolides toxicity of the dinoflagellate Alexandrium leei to phytoplankton, finfish and zooplankton observed from laboratory bioassays. Sci. Total Environ. 2021, 780, 146484. [Google Scholar] [CrossRef] [PubMed]
  60. Usup, G.; Pin, L.C.; Ahmad, A.; Teen, L.P. Alexandrium (Dinophyceae) species in Malaysian waters. Harmful Algae 2002, 1, 265–275. [Google Scholar] [CrossRef]
  61. Tang, Y.Z.; Kong, L.; Holmes, M.J. Dinoflagellate Alexandrium leei (Dinophyceae) from Singapore coastal waters produces a water-soluble ichthyotoxin. Mar. Biol. 2006, 150, 541–549. [Google Scholar] [CrossRef]
  62. Shikata, T.; Taniguchi, E.; Sakamoto, S.; Kitatsuji, S.; Yamasaki, Y.; Yoshida, M.; Oikawa, H. Phylogeny, growth and toxicity of the noxious red-tide dinoflagellate Alexandrium leei in Japan. Reg. Stud. Mar. Sci. 2020, 36, 101265. [Google Scholar] [CrossRef]
  63. Gobler, C.J.; Sunda, W.G. Ecosystem disruptive algal blooms of the brown tide species, Aureococcus anophagefferens and Aureoumbra lagunensis. Harmful Algae 2012, 14, 36–45. [Google Scholar] [CrossRef]
  64. Nézan, E.; Siano, R.; Boulben, S.; Six, C.; Bilien, G.; Chèze, K.; Duval, A.; Le Panse, S.; Quéré, J.; Chomérat, N. Genetic diversity of the harmful family Kareniaceae (Gymnodiniales, Dinophyceae) in France, with the description of Karlodinium gentienii sp. nov.: A new potentially toxic dinoflagellate. Harmful Algae 2014, 40, 75–91. [Google Scholar] [CrossRef] [Green Version]
  65. Lu, D.D.; Jeanette, G. Five red tide species in genus Prorocentrum including the description of Prorocentrum donghaiense Lu SP. nov. from the East China Sea. Chin. J. Oceanol. Limnol. 2001, 19, 337–344. [Google Scholar]
  66. Li, J.; Glibert, P.M.; Zhou, M. Temporal and spatial variability in nitrogen uptake kinetics during harmful dinoflagellate blooms in the East China Sea. Harmful Algae 2010, 9, 531–539. [Google Scholar] [CrossRef]
  67. Shin, H.H.; Li, Z.; Mertens, K.N.; Seo, M.H.; Gu, H.; Lim, W.A.; Yoon, Y.H.; Soh, H.Y.; Matsuoka, K. Prorocentrum shikokuense Hada and P. donghaiense Lu are junior synonyms of P. obtusidens Schiller, but not of P. dentatum Stein (Prorocentrales, Dinophyceae). Harmful Algae 2019, 89, 101686. [Google Scholar] [CrossRef]
  68. Zarauz, L.; Irigoien, X. Effects of Lugol’s fixation on the size structure of natural nano-microplankton samples, analyzed by means of an automatic counting method. J. Plankton Res. 2008, 30, 1297–1303. [Google Scholar] [CrossRef] [Green Version]
  69. Gomez, F.; Takayama, H.; Moreira, D.; Lopez-Garcia, P. Unarmoured dinoflagellates with a small hyposome: Torodinium and Lebouridinium gen. nov. for Katodinium glaucum (Gymnodiniales, Dinophyceae). Eur. J. Phycol. 2016, 51, 226–241. [Google Scholar] [CrossRef] [PubMed] [Green Version]
  70. Santos, M.; Moita, M.T.; Bashmachnikov, I.; Menezes, G.M.; Carmo, V.; Loureiro, C.M.; Mendonça, A.; Silva, A.F.; Martins, A. Phytoplankton variability and oceanographic conditions at Condor seamount, Azores (NE Atlantic). Deep. Sea Res. Part II Top. Stud. Oceanogr. 2013, 98, 52–62. [Google Scholar] [CrossRef]
  71. Yu, R.C.; Zhang, Q.C.; Kong, F.Z.; Zhou, Z.X.; Chen, Z.F.; Zhou, Y.; Geng, H.X.; Dai, L.; Yan, T.; Zhou, M.J. Status, impacts and long-term changes of harmful algal blooms in the sea area adjacent to the Changjiang river estuary. Oceanol. Et Limnol. Sinica 2017, 48, 1178–1186. [Google Scholar]
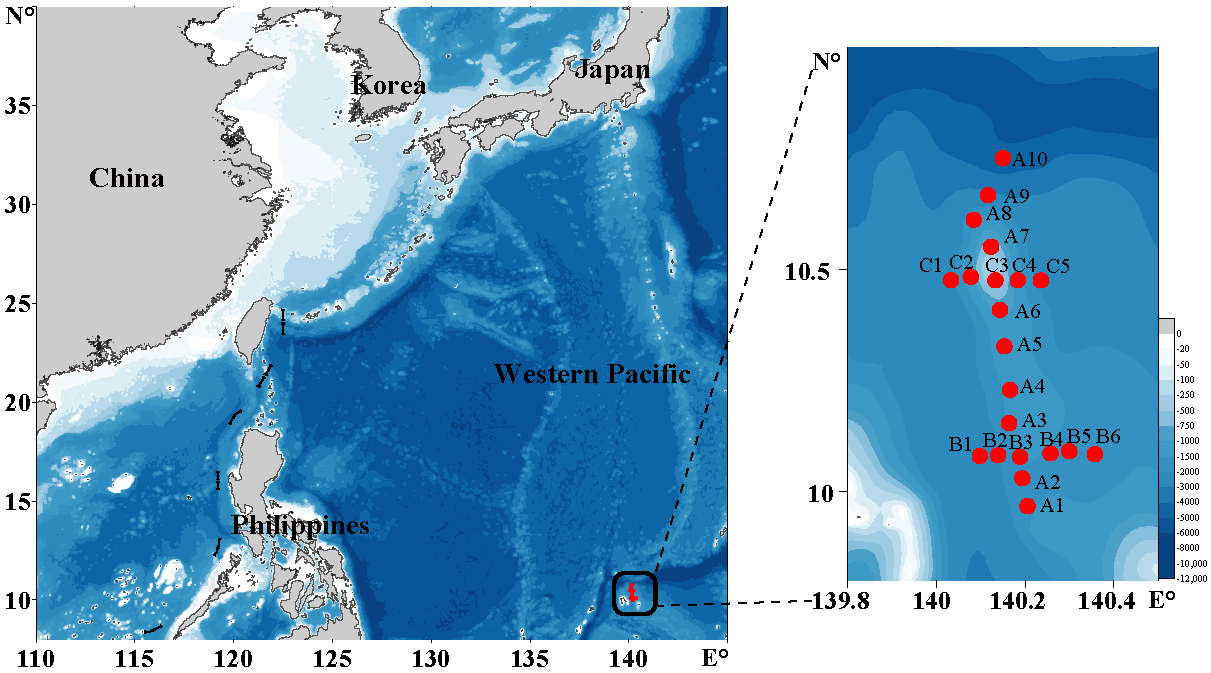
Figure 1. Sampling sites in the Western Pacific seamount regions. Red dots represent sampling stations.
Ijerph 18 11470 g001
Figure 2. A flowchart describing the bioinformatics processing procedure.
Ijerph 18 11470 g002
Figure 3. Phytoplankton richness and relative abundance at division/class level in the Western Pacific seamount regions. (a) Richness of phytoplankton at division level; (b) relative abundance of phytoplankton at division level; (c) richness of phytoplankton at class level; (d) relative abundance of phytoplankton at class level.
Ijerph 18 11470 g003
Figure 4. Alpha diversity of surface samples from the Western Pacific seamount regions. (a) The alpha diversity of surface samples. The data are all phytoplankton ASVs; (b) Richness, (c) Shannon’s diversity, and (d) Simpson’s diversity of surface samples in the Western Pacific seamount regions.
Ijerph 18 11470 g004
Figure 5. Phytoplankton richness and relative abundance at each surface sampling site in the Western Pacific seamount regions. (a,b) Richness and relative abundance of phytoplankton at the division level, respectively; (c,d) richness and relative abundance of phytoplankton at the class level.
Ijerph 18 11470 g005
Figure 6. The composition and distribution of top 60 genera in the Western Pacific seamount regions.
Ijerph 18 11470 g006
Figure 7. Phylogenetic network analysis of representative genera identified in the Western Pacific seamount regions. (a) Alexandrium; (b) Karenia; (c) Azadinium; (d) Margalefidinium; (e) Gymnodinium; (f) Prorocentrum; (g) Dino−Group−I−Clade−5_X. The size of the circles represents relative abundance of each ASV, while red color represents HAB species.
Ijerph 18 11470 g007
Figure 8. A flowchart describing the ASV annotations.
Ijerph 18 11470 g008
Figure 9. Distribution of HAB species in the Western Pacific seamount regions. (a) The distribution and relative abundance of 36 HAB species identified in the surface seawaters of the Western Pacific seamount regions. Cladogram was constructed using the 18S rDNA V4 region sequences of 36 HAB species. The sizes of the blue circles represent the species’ relative abundances; (b) Karlodinium veneficum (ASV_11), (c) Karenia papilionacea (ASV_21), (d) Heterocapsa rotundata (ASV_23), (e) Amphidoma languida (ASV_71), (f) Noctiluca scintillans (ASV_107), and (g) Katodinium glaucum (ASV_163).
Ijerph 18 11470 g009
Figure 10. Pairwise comparisons of environmental factors and 36 HAB species. The pies with * indicate that p-value < 0.05; the pies with ** indicate p-value < 0.01; the pies with *** indicate p-value < 0.001.
Ijerph 18 11470 g010
Table 1. List of 36 HAB species in this study.
Group HAB SpeciesASV NumberASV IdDivisionClassAccessionPID (%) Literature ReportHAB
Evidence
G1Katodinium glaucum1ASV_163DinoflagellataDinophyceaeKP790162100.00 N[38]
G1Margalefidinium polykrikoides1ASV_571DinoflagellataDinophyceaeAY347309100.00 N[39]
G1Alexandrium andersonii1ASV_703DinoflagellataDinophyceaeKF92533499.74 N[40]
G1Akashiwo sanguinea1ASV_1238DinoflagellataDinophyceaeAY421770100.00 N[41]
G1Alexandrium affine1ASV_1484DinoflagellataDinophyceaeAY421778100.00 N[42]
G1Alexandrium ostenfeldii1ASV_1588DinoflagellataDinophyceaeKJ361986100.00 N[40]
G1Protoceratium reticulatum1ASV_1699DinoflagellataDinophyceaeMK99562399.74 N[40]
G1Pseudochattonella verruculosa1ASV_1973OchrophytaDictyochophyceaeAB217629100.00 N[40]
G1Phalacroma rotundatum1ASV_2352DinoflagellataDinophyceaeEU780657100.00 N[42]
G1Alexandrium leei1ASV_3247DinoflagellataDinophyceaeAY641565100.00 N[42]
G1Amphisolenia bidentata1ASV_3266DinoflagellataDinophyceaeGU196149100.00 [13][41]
G1Eucampia cornuta1ASV_3344OchrophytaBacillariophytaKJ577856100.00 [13][41]
G1Cochlodinium polykrikoides1ASV_4020DinoflagellataDinophyceaeEU41897199.21 N[40]
G1Pseudo-nitzschia seriata1ASV_4169OchrophytaBacillariophytaAY485490100.00 N[40]
G1Chaetoceros peruvianus1ASV_4180OchrophytaBacillariophytaHQ91265099.48 [14][42]
G1Pseudo-nitzschia galaxiae1ASV_4889OchrophytaBacillariophytaKJ608079100.00 N[40]
G1Vicicitus globosus1ASV_5088OchrophytaDictyochophyceaeHQ64655899.49 N[43]
G1Lingulodinium polyedra1ASV_5301DinoflagellataDinophyceaeAB693194100.00 N[41]
G1Rhizosolenia setigera1ASV_5960OchrophytaBacillariophytaKY980291100.00 [13][41]
G1Cerataulina pelagica1ASV_6058OchrophytaBacillariophytaHQ91266999.74 [13][41]
G1Gymnodinium impudicum1ASV_6327DinoflagellataDinophyceaeAF022197100.00 N[41]
G1Heterosigma akashiwo1ASV_6494OchrophytaRaphidophyceaeAB001287100.00 N[40]
G1Guinardia striata1ASV_7307OchrophytaBacillariophytaKT86101599.74 [13][42]
G1Odontella aurita1ASV_7967OchrophytaBacillariophytaJX413551100.00 N[41]
G1Chaetoceros curvisetus1ASV_8665OchrophytaBacillariophytaMG97224199.48 N[42]
G2Karlodinium veneficum9ASV_11DinoflagellataSyndinialesKY979983100.00 N[44]
G2Karenia papilionacea15ASV_21DinoflagellataDinophyceaeHM067005100.00 N[45]
G2Heterocapsa rotundata14ASV_23DinoflagellataDinophyceaeKY980288100.00 N[46]
G2Amphidoma languida3ASV_71DinoflagellataDinophyceaeLS97414999.21 N[40]
G2Noctiluca scintillans2ASV_107DinoflagellataNoctilucophyceaeAF022200100.00 N[42]
G2Azadinium dexteroporum2ASV_184DinoflagellataDinophyceaeKR362889100.00 N[40]
G2Gymnodinium aureolum2ASV_404DinoflagellataDinophyceaeKR36289199.48 N[42]
G2Aureococcus anophagefferens5ASV_1565OchrophytaPelagophyceaeKY98030899.74 N[6]
G2Gonyaulax polygramma2ASV_1958DinoflagellataDinophyceaeAY77528799.74 [13][42]
G2Karenia selliformis2ASV_2204DinoflagellataDinophyceaeHM06700799.74 N[41]
G2Thalassiosira diporocyclus2ASV_2450OchrophytaBacillariophytaMF405351100.00 N[46]
Publisher’s Note: MDPI stays neutral with regard to jurisdictional claims in published maps and institutional affiliations.