
A Structural Equation Modelling Approach to Determine Factors of Bone Mineral Density in Korean Women


Abstract
:1. Introduction
2. Materials and Methods
2.1. Materials
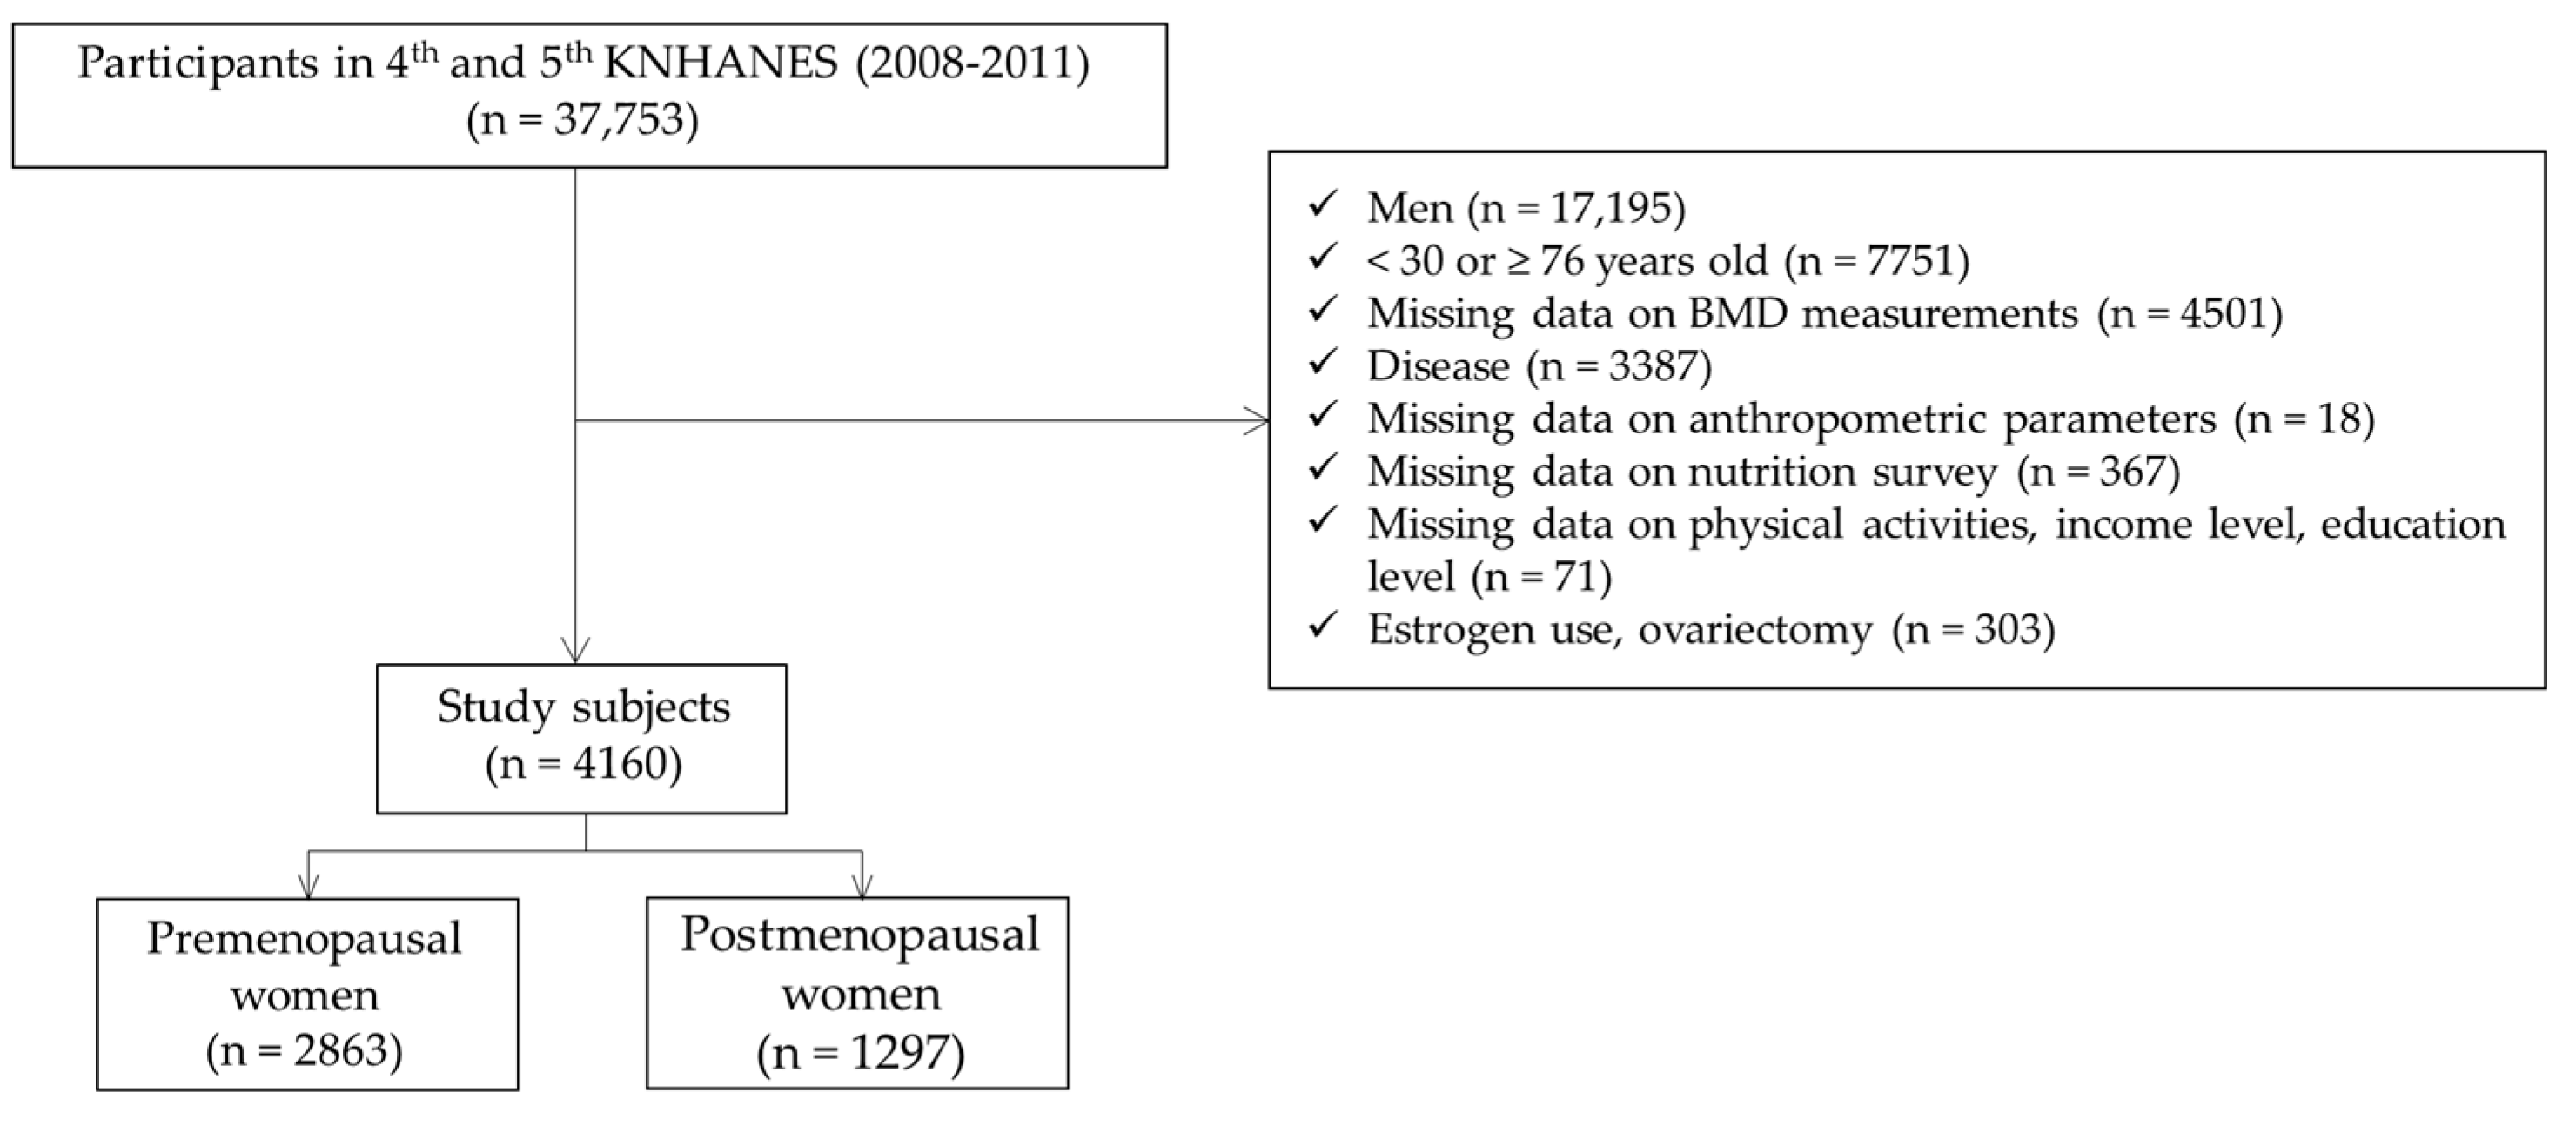
2.2. Participants
2.3. Measurements of Anthropometric Parameters and Bone Mineral Density
2.4. Nutrient Intakes
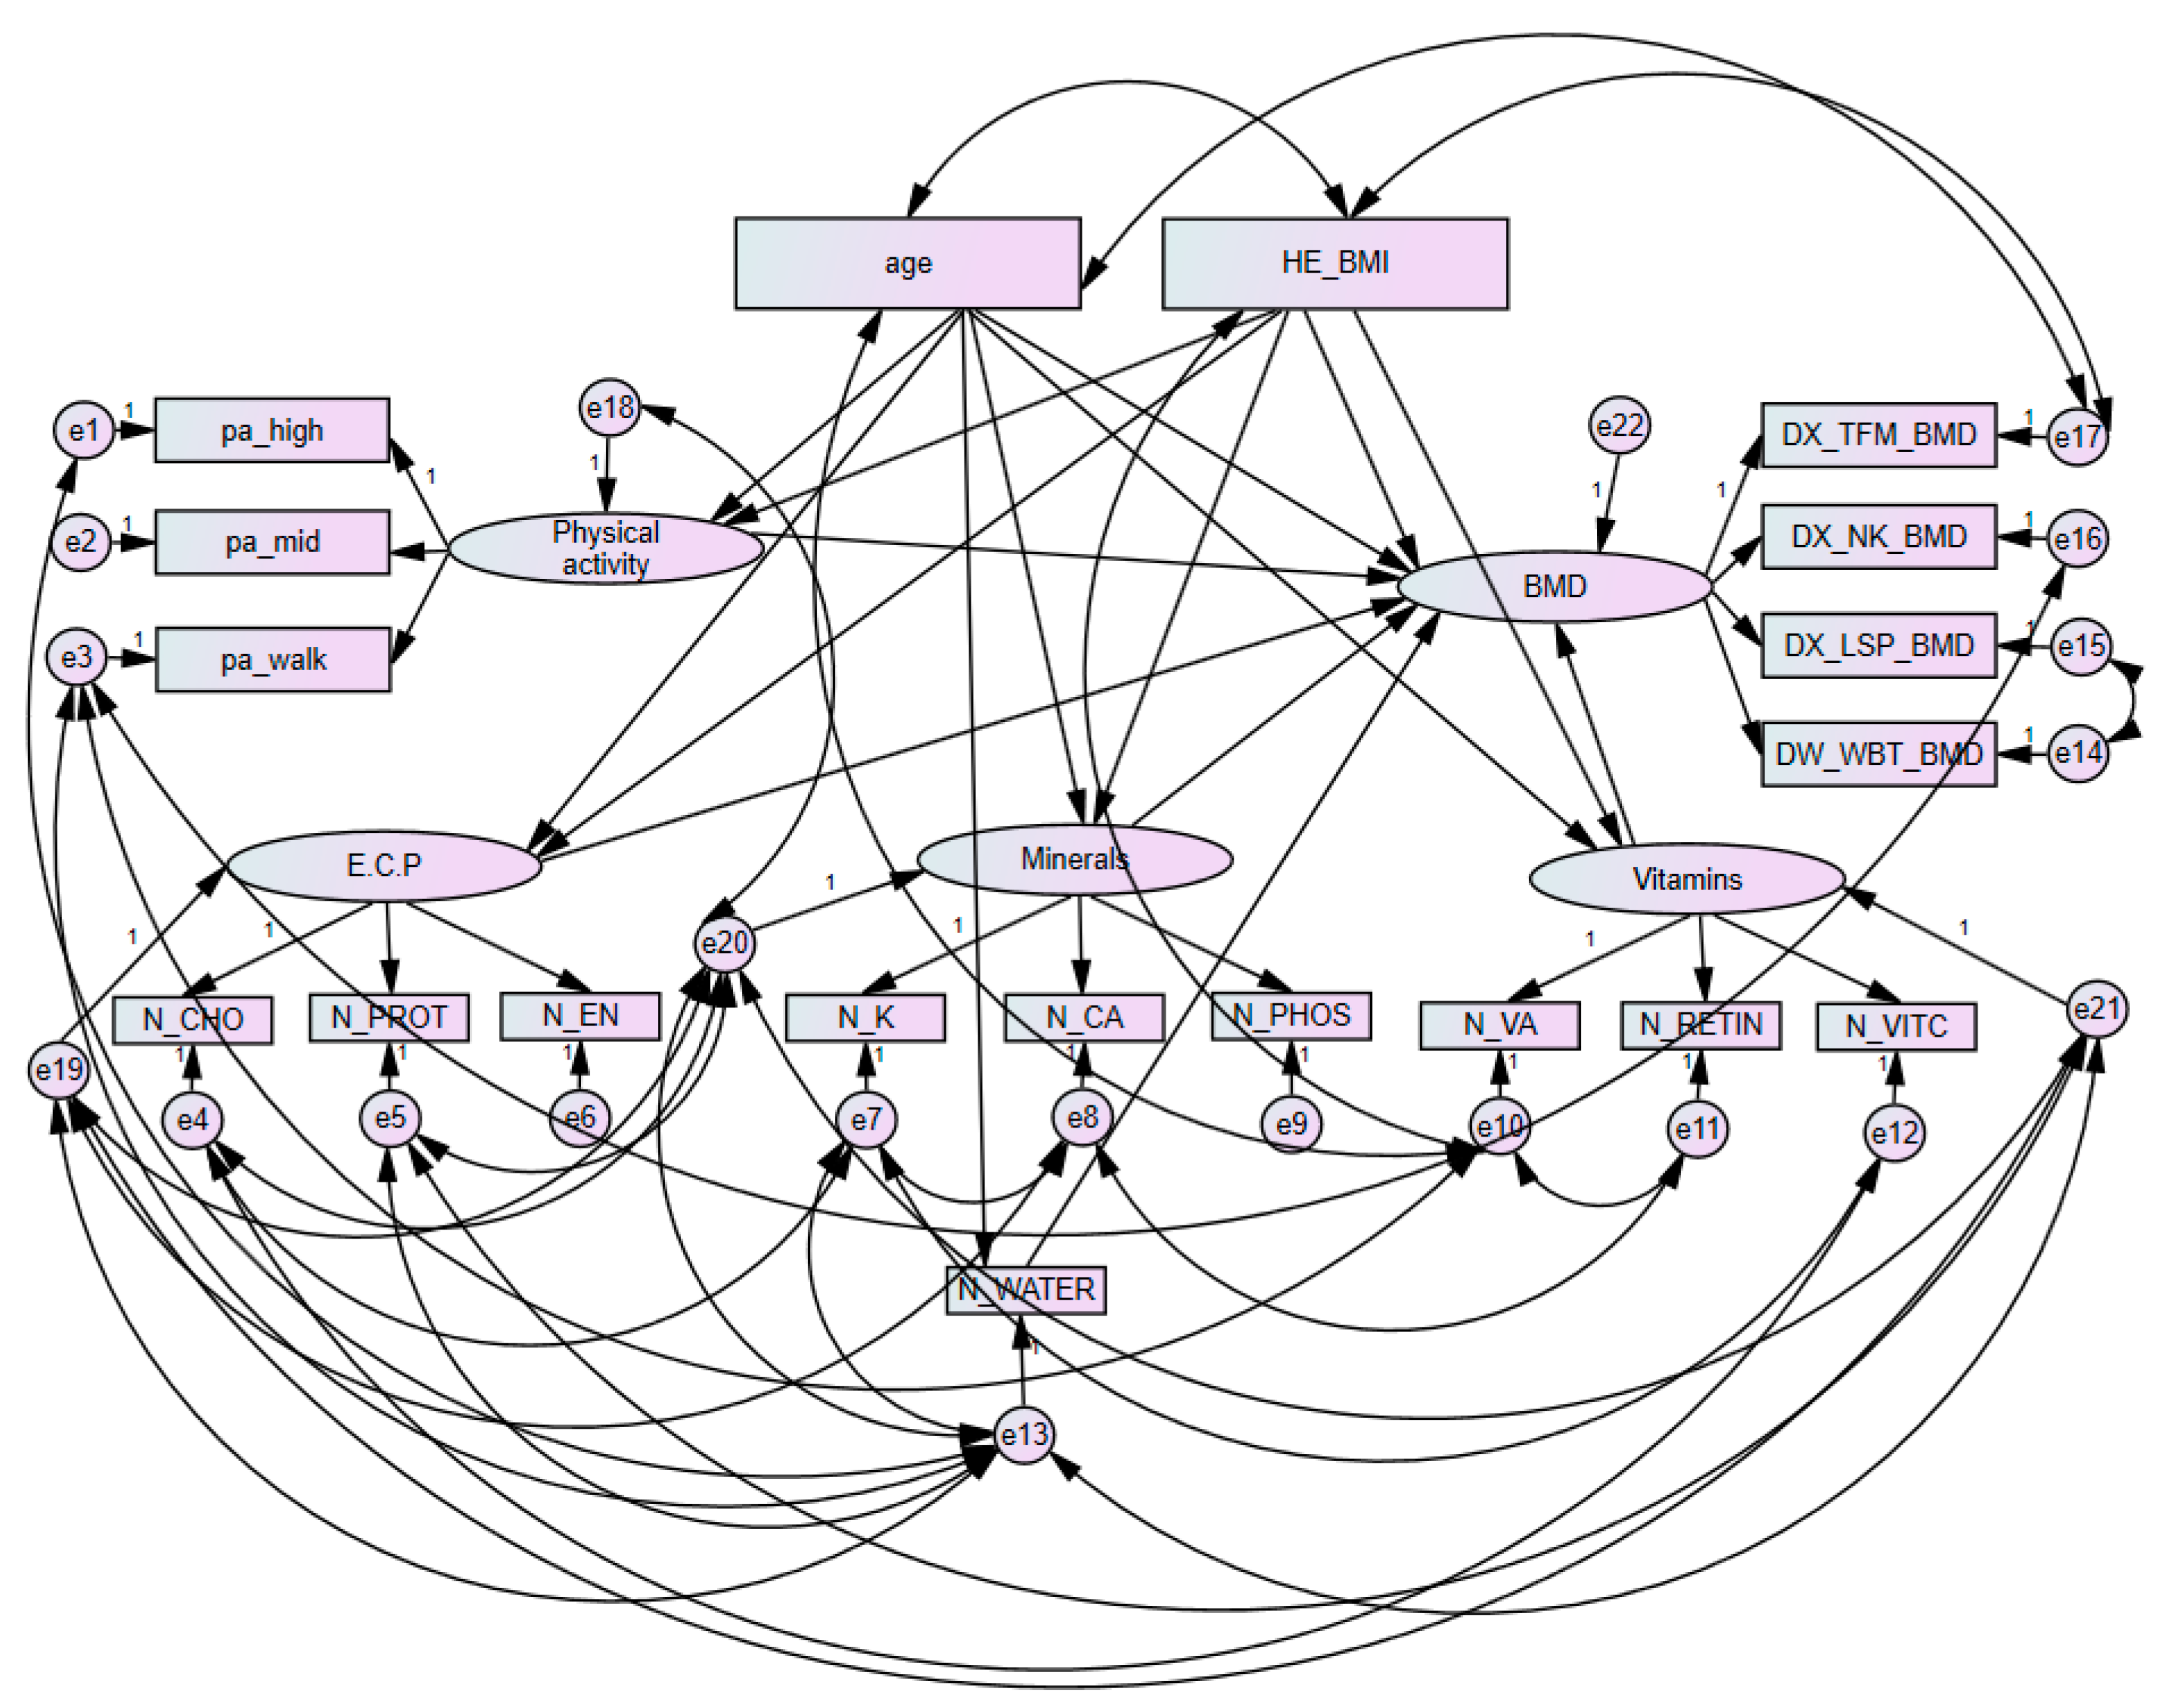
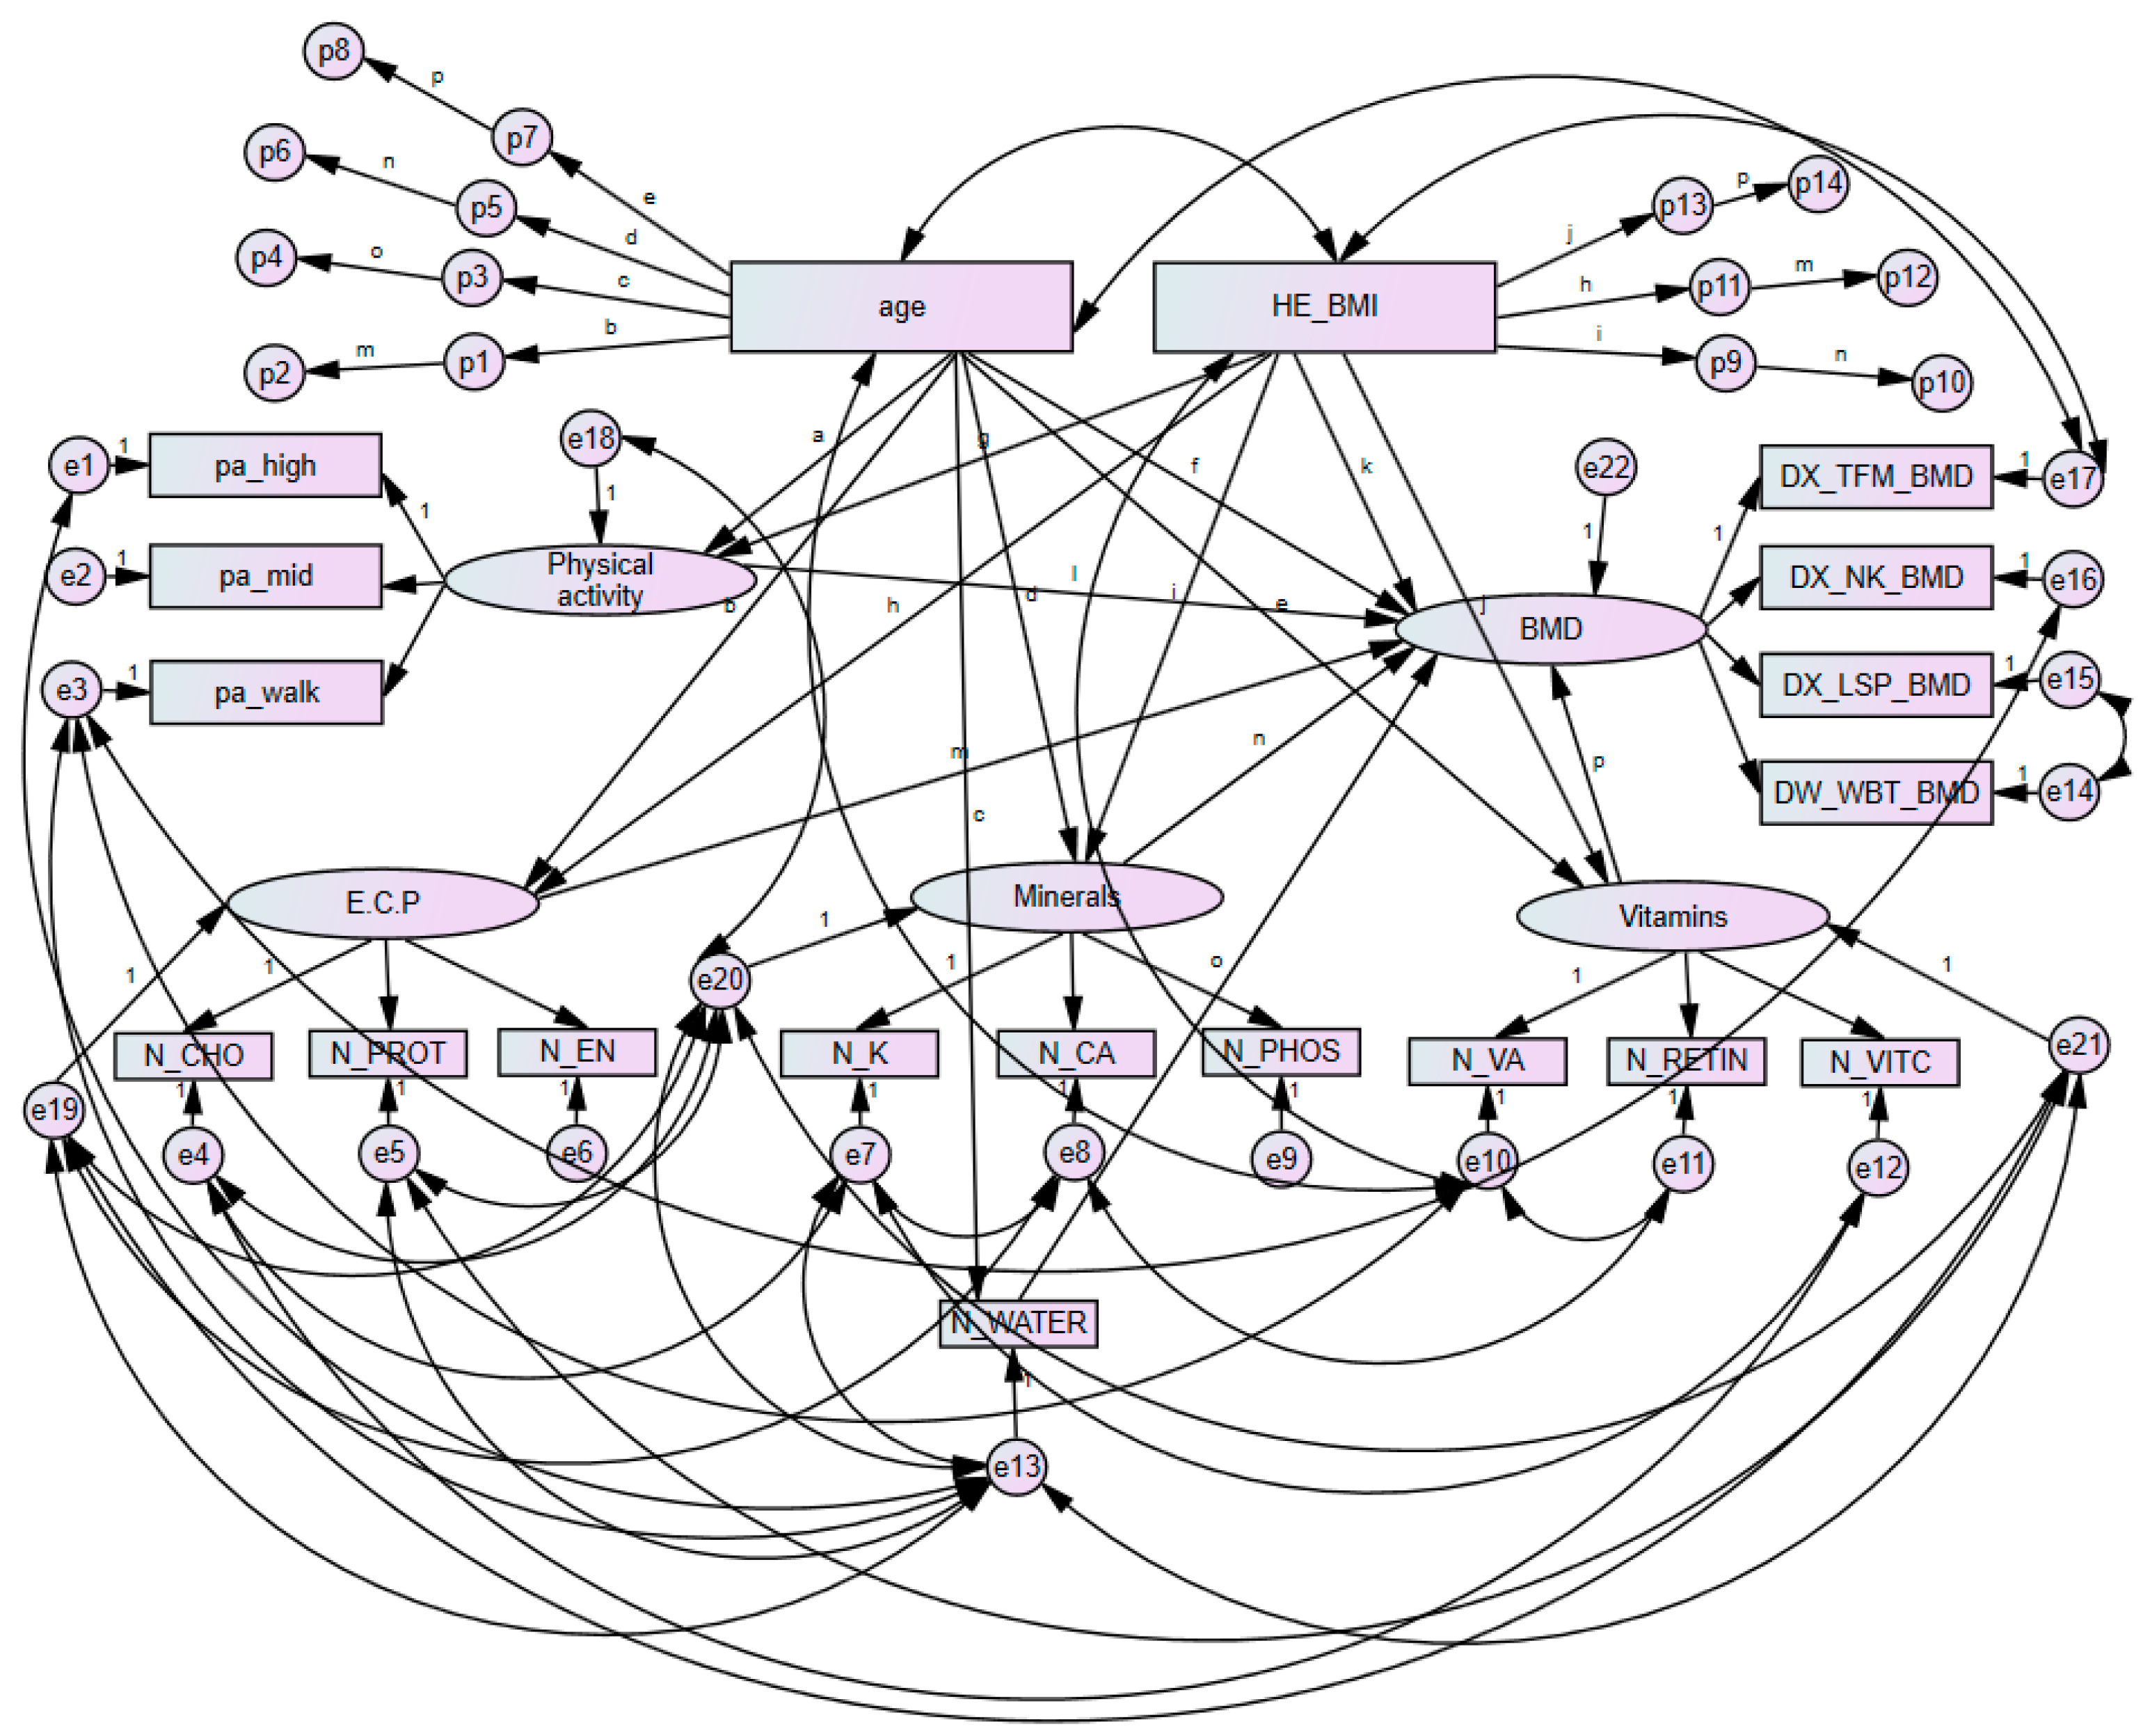
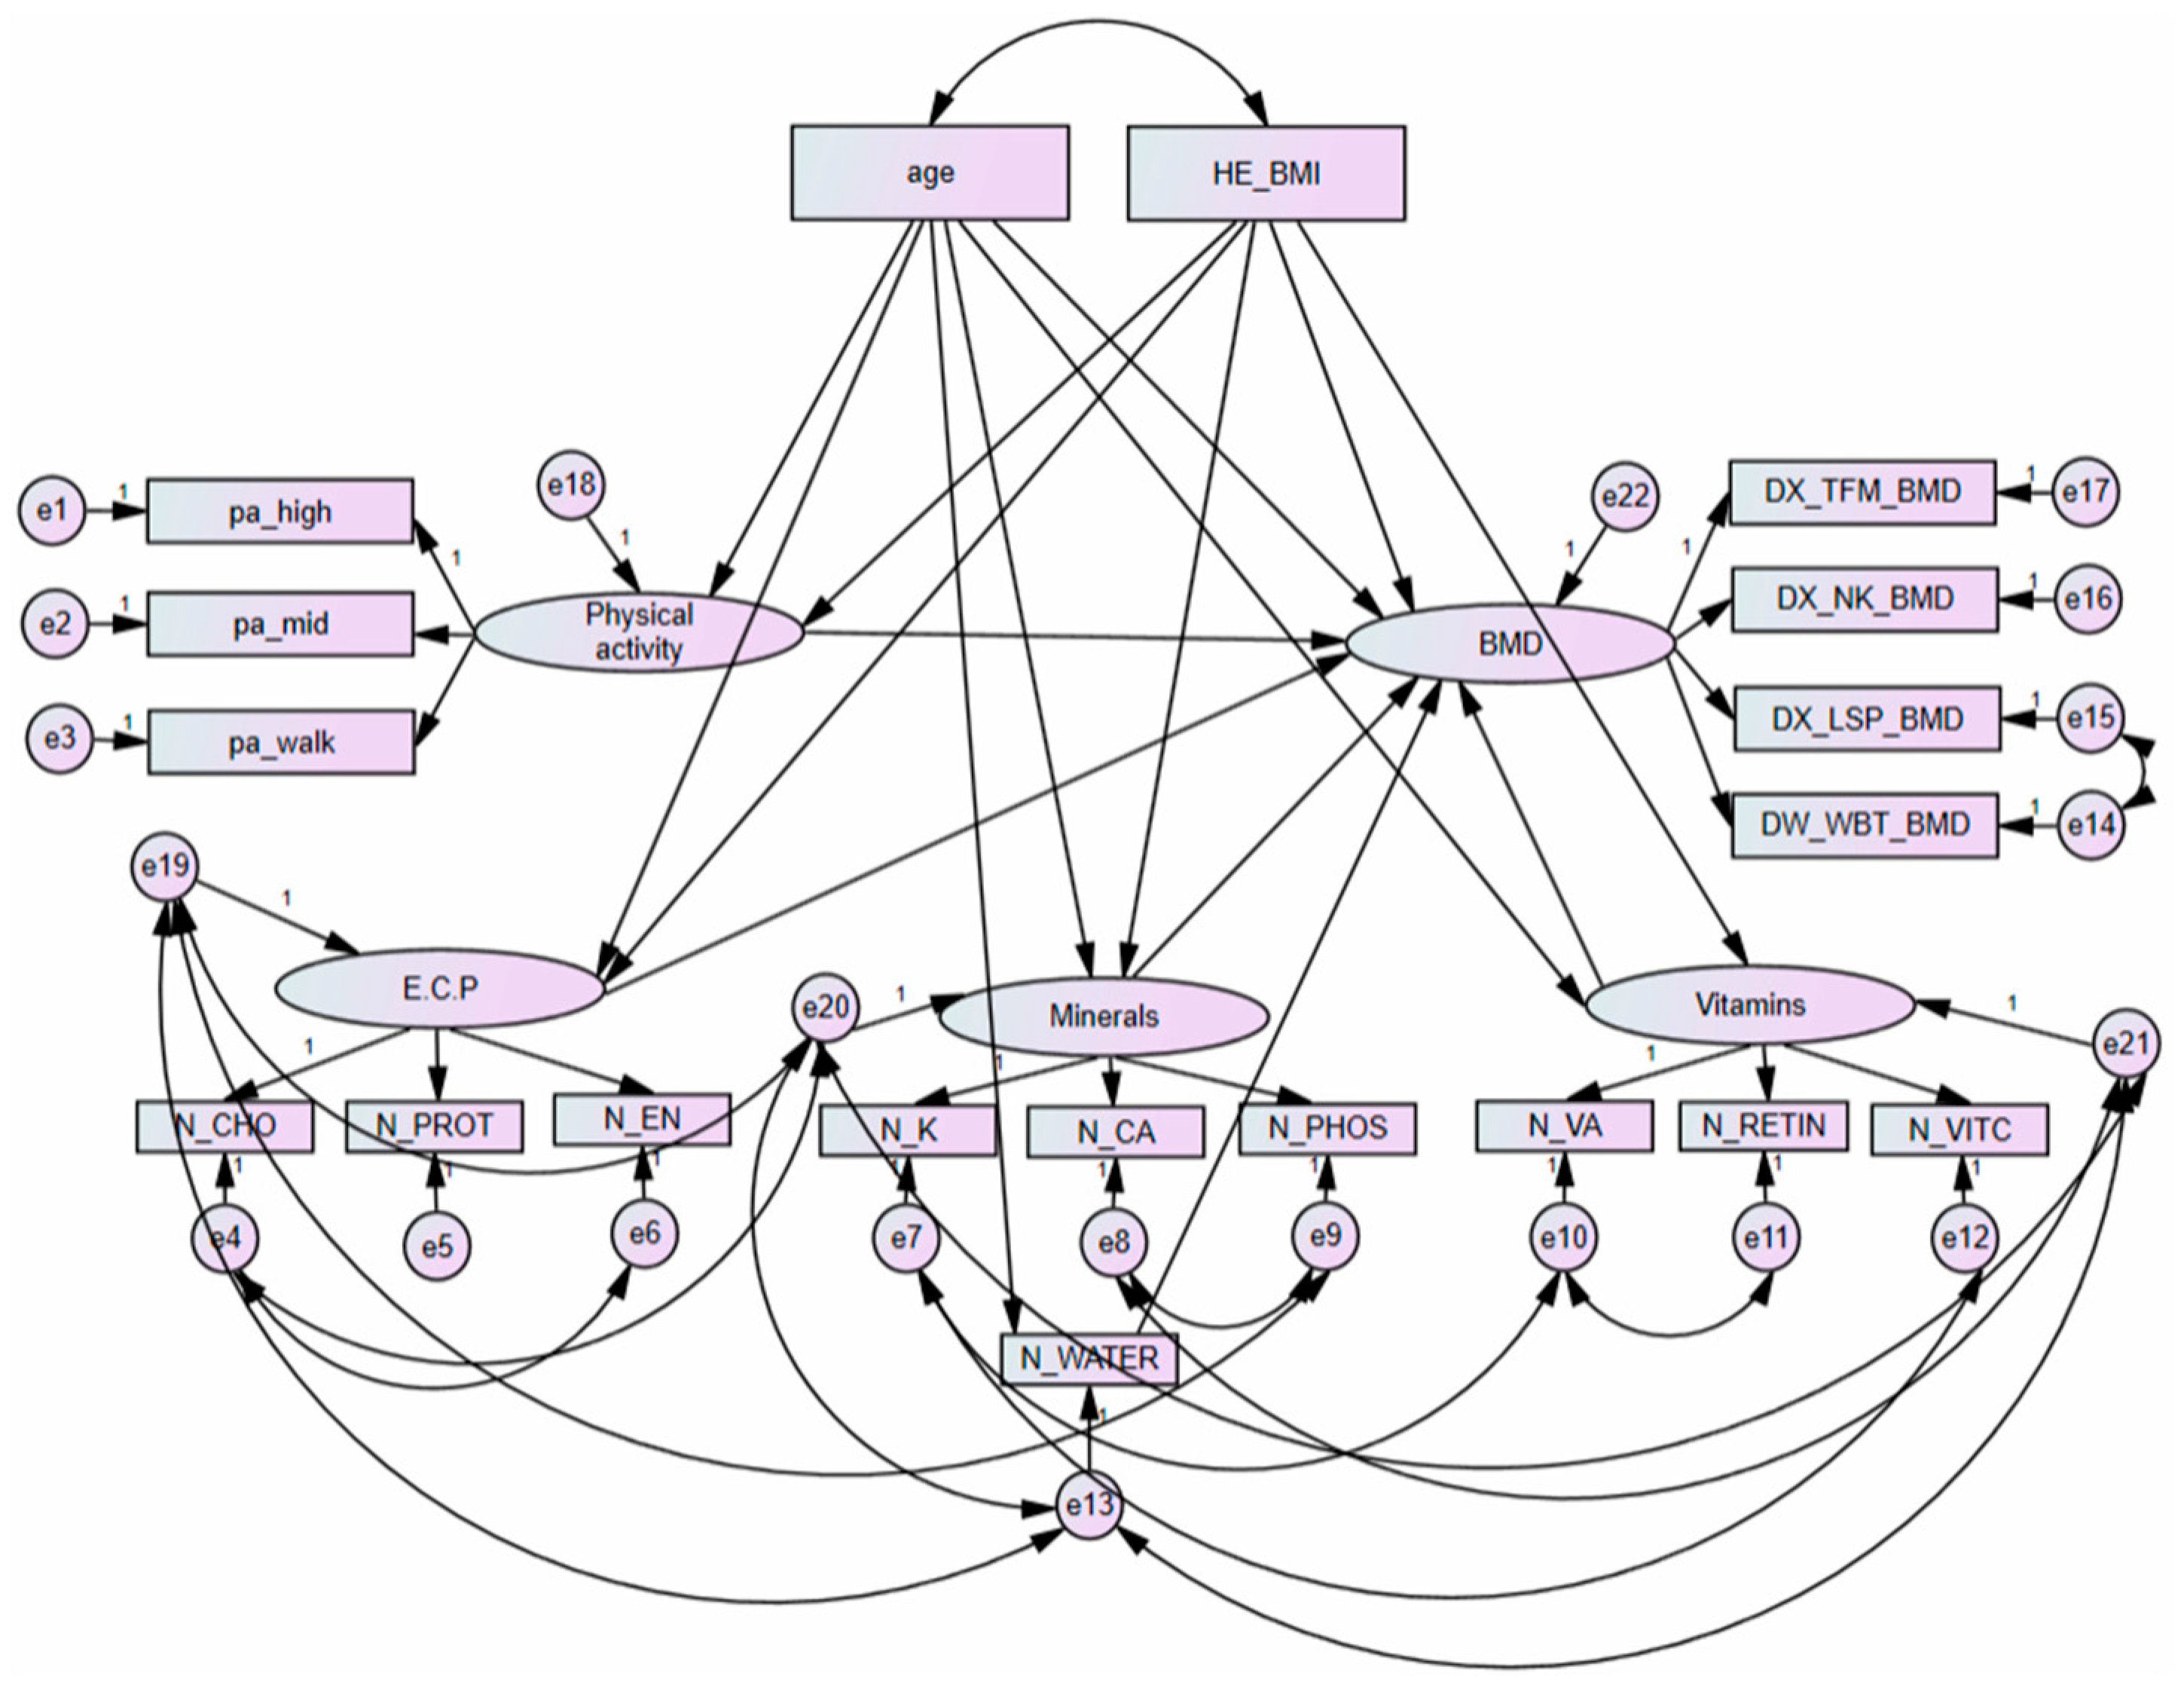
2.5. Structural Equation Modelling
2.6. Statistical Analysis
3. Results
3.1. Participant Characteristics
3.2. Nutrient Intakes
3.3. Bone Health Status
3.4. Goodness of Fit Structural Equation Models and Variable Weights
3.5. Analysis of Direct and Total Effects of Each Component in Premenopausal Women with Bone Mineral Density
3.6. Analysis of Mediating Pathways among Component in Premenopausal Women
3.7. Analysis of Direct and Total Effects of Each Component in Postmenopausal Women with Bone Mineral Density
3.8. Analysis of Mediating Pathways among Each Component in Postmenopausal Women
3.9. Analysis of Partial Correlation Coefficients between Bone Mineral Density and Nutrient Intake in Premenopausal Women
3.10. Analysis of Partial Correlation Coefficients between Bone Mineral Density and Nutrient Intake in Postmenopausal Women
4. Discussion
5. Conclusions
Author Contributions
Funding
Institutional Review Board Statement
Informed Consent Statement
Conflicts of Interest
References
- Je, M.; Kim, H.; Kim, Y. A Structural Equation Modelling Approach to Determine Factors of Bone Mineral Density in Korean Women. Int. J. Environ. Res. Public Health 2021, 18, 11658. [Google Scholar] [CrossRef]
- The United Nations. World Population Ageing 2017 Highlights; Department of Economic and Social Affairs: New York, NY, USA, 2017. [Google Scholar]
- OCED. Elderly Population (Demography). Available online: https://www.oecd-ilibrary.org/social-issues-migration-health/elderly-population/indicator/english_8d805ea1-en (accessed on 6 September 2021).
- Karaguzel, G.; Holick, M.F. Diagnosis and treatment of osteopenia. Rev. Endocr. Metab. Disord. 2010, 11, 237–251. [Google Scholar] [CrossRef]
- Clarke, B. Normal bone anatomy and physiology. Clin. J. Am. Soc. Nephrol. CJASN 2008, 3 (Suppl. 3), S131–S139. [Google Scholar] [CrossRef] [PubMed] [Green Version]
- Siris, E.S.; Adler, R.; Bilezikian, J.; Bolognese, M.; Dawson-Hughes, B.; Favus, M.J.; Harris, S.T.; Jan de Beur, S.M.; Khosla, S.; Lane, N.E.; et al. The clinical diagnosis of osteoporosis: A position statement from the National Bone Health Alliance Working Group. Osteoporos. Int. 2014, 25, 1439–1443. [Google Scholar] [CrossRef] [Green Version]
- Gullberg, B.; Johnell, O.; Kanis, J.A. World-wide projections for hip fracture. Osteoporos. Int. 1997, 7, 407–413. [Google Scholar] [CrossRef]
- Tajeu, G.S.; Delzell, E.; Smith, W.; Arora, T.; Curtis, J.R.; Saag, K.G.; Morrisey, M.A.; Yun, H.; Kilgore, M.L. Death, debility, and destitution following hip fracture. J. Gerontol. Ser. A Biol. Sci. Med Sci. 2014, 69, 346–353. [Google Scholar] [CrossRef]
- Burge, R.; Dawson-Hughes, B.; Solomon, D.H.; Wong, J.B.; King, A.; Tosteson, A. Incidence and economic burden of osteoporosis-related fractures in the United States, 2005-2025. J. Bone Miner. Res. Res. 2007, 22, 465–475. [Google Scholar] [CrossRef]
- Pike, C.T.; Birnbaum, H.G.; Schiller, M.; Swallow, E.; Burge, R.T.; Edgell, E.T. Prevalence and costs of osteoporotic patients with subsequent non-vertebral fractures in the US. Osteoporos. Int. 2011, 22, 2611–2621. [Google Scholar] [CrossRef] [PubMed]
- Yusuf, A.A.; Matlon, T.J.; Grauer, A.; Barron, R.; Chandler, D.; Peng, Y. Utilization of osteoporosis medication after a fragility fracture among elderly Medicare beneficiaries. Arch. Osteoporos. 2016, 11, 31. [Google Scholar] [CrossRef]
- Szulc, P.; Munoz, F.; Duboeuf, F.; Marchand, F.; Delmas, P.D. Bone mineral density predicts osteoporotic fractures in elderly men: The MINOS study. Osteoporos. Int. 2005, 16, 1184–1192. [Google Scholar] [CrossRef]
- Henry, M.J.; Pasco, J.A.; Korn, S.; Gibson, J.E.; Kotowicz, M.A.; Nicholson, G.C. Bone mineral density reference ranges for Australian men: Geelong Osteoporosis Study. Osteoporos. Int. 2010, 21, 909–917. [Google Scholar] [CrossRef] [PubMed] [Green Version]
- Dao, H.H.; Do, Q.T.; Sakamoto, J. Bone mineral density and frequency of osteoporosis among Vietnamese women with early rheumatoid arthritis. Clin. Rheumatol. 2011, 30, 1353–1361. [Google Scholar] [CrossRef] [PubMed]
- Weaver, C.M.; Gordon, C.M.; Janz, K.F.; Kalkwarf, H.J.; Lappe, J.M.; Lewis, R.; O’Karma, M.; Wallace, T.C.; Zemel, B.S. The National Osteoporosis Foundation’s position statement on peak bone mass development and lifestyle factors: A systematic review and implementation recommendations. Osteoporos. Int. 2016, 27, 1281–1386. [Google Scholar] [CrossRef] [PubMed] [Green Version]
- Wong, P.K.; Christie, J.J.; Wark, J.D. The effects of smoking on bone health. Clin. Sci. (Lond. Engl. 1979) 2007, 113, 233–241. [Google Scholar] [CrossRef] [Green Version]
- Beran, T.N.; Violato, C. Structural equation modeling in medical research: A primer. BMC Res. Notes 2010, 3, 267. [Google Scholar] [CrossRef] [PubMed] [Green Version]
- Kweon, S.; Kim, Y.; Jang, M.J.; Kim, Y.; Kim, K.; Choi, S.; Chun, C.; Khang, Y.H.; Oh, K. Data resource profile: The Korea National Health and Nutrition Examination Survey (KNHANES). Int. J. Epidemiol. 2014, 43, 69–77. [Google Scholar] [CrossRef] [Green Version]
- Roessingh Research and Development. Food Composition Table, 7th ed.; Korean Rural Development Associations: Suwon, Korea, 2006.
- Korean Ministry of Health and Welfare; The Korean Nutrition Society. 2020 Dietary Reference Intakes for Koreans: Energy and Macronutrients; Ministry of Health and Welfare: Seoul, Korea, 2020.
- Korean Ministry of Health and Welfare; The Korean Nutrition Society. 2020 Dietary Reference Intakes for Koreans: Vitamins; Ministry of Health and Welfare: Seoul, Korea, 2020.
- Korean Ministry of Health and Welfare; The Korean Nutrition Society. 2020 Dietary Reference Intakes for Koreans: Minerals; Ministry of Health and Welfare: Seoul, Korea, 2020.
- Fung, T.T.; Meyer, H.E.; Willett, W.C.; Feskanich, D. Protein intake and risk of hip fractures in postmenopausal women and men age 50 and older. Osteoporos. Int. 2017, 28, 1401–1411. [Google Scholar] [CrossRef] [Green Version]
- Rapuri, P.B.; Gallagher, J.C.; Haynatzka, V. Protein intake: Effects on bone mineral density and the rate of bone loss in elderly women. Am. J. Clin. Nutr. 2003, 77, 1517–1525. [Google Scholar] [CrossRef] [Green Version]
- New, S.A.; Bolton-Smith, C.; Grubb, D.A.; Reid, D.M. Nutritional influences on bone mineral density: A cross-sectional study in premenopausal women. Am. J. Clin. Nutr. 1997, 65, 1831–1839. [Google Scholar] [CrossRef] [Green Version]
- Franceschi, R.T.; Iyer, B.S.; Cui, Y. Effects of ascorbic acid on collagen matrix formation and osteoblast differentiation in murine MC3T3-E1 cells. J. Bone Miner. Res. 1994, 9, 843–854. [Google Scholar] [CrossRef]
- Choi, H.K.; Kim, G.J.; Yoo, H.S.; Song, D.H.; Chung, K.H.; Lee, K.J.; Koo, Y.T.; An, J.H. Vitamin C Activates Osteoblastogenesis and Inhibits Osteoclastogenesis via Wnt/β-Catenin/ATF4 Signaling Pathways. Nutrients 2019, 11, 506. [Google Scholar] [CrossRef] [Green Version]
- Malmir, H.; Shab-Bidar, S.; Djafarian, K. Vitamin C intake in relation to bone mineral density and risk of hip fracture and osteoporosis: A systematic review and meta-analysis of observational studies. Br. J. Nutr. 2018, 119, 847–858. [Google Scholar] [CrossRef]
- Chan, R.; Woo, J.; Leung, J. Effects of food groups and dietary nutrients on bone loss in elderly Chinese population. J. Nutr. Health Aging 2011, 15, 287–294. [Google Scholar] [CrossRef]
- Wang, M.C.; Luz Villa, M.; Marcus, R.; Kelsey, J.L. Associations of vitamin C, calcium and protein with bone mass in postmenopausal Mexican American women. Osteoporos. Int. 1997, 7, 533–538. [Google Scholar] [CrossRef]
- Beasley, J.M.; LaCroix, A.Z.; Larson, J.C.; Huang, Y.; Neuhouser, M.L.; Tinker, L.F.; Jackson, R.; Snetselaar, L.; Johnson, K.C.; Eaton, C.B.; et al. Biomarker-calibrated protein intake and bone health in the Women’s Health Initiative clinical trials and observational study. Am. J. Clin. Nutr. 2014, 99, 934–940. [Google Scholar] [CrossRef] [PubMed] [Green Version]
- Lim, L.S.; Harnack, L.J.; Lazovich, D.; Folsom, A.R. Vitamin A intake and the risk of hip fracture in postmenopausal women: The Iowa Women’s Health Study. Osteoporos. Int. 2004, 15, 552–559. [Google Scholar] [CrossRef] [PubMed] [Green Version]
- Caire-Juvera, G.; Ritenbaugh, C.; Wactawski-Wende, J.; Snetselaar, L.G.; Chen, Z. Vitamin A and retinol intakes and the risk of fractures among participants of the Women’s Health Initiative Observational Study. Am. J. Clin. Nutr. 2009, 89, 323–330. [Google Scholar] [CrossRef] [Green Version]
- Melhus, H.; Michaëlsson, K.; Kindmark, A.; Bergström, R.; Holmberg, L.; Mallmin, H.; Wolk, A.; Ljunghall, S. Excessive dietary intake of vitamin A is associated with reduced bone mineral density and increased risk for hip fracture. Ann. Intern. Med. 1998, 129, 770–778. [Google Scholar] [CrossRef]
- Feskanich, D.; Singh, V.; Willett, W.C.; Colditz, G.A. Vitamin A intake and hip fractures among postmenopausal women. JAMA 2002, 287, 47–54. [Google Scholar] [CrossRef]
- Promislow, J.H.; Goodman-Gruen, D.; Slymen, D.J.; Barrett-Connor, E. Retinol intake and bone mineral density in the elderly: The Rancho Bernardo Study. J. Bone Miner. Res. 2002, 17, 1349–1358. [Google Scholar] [CrossRef] [PubMed]
- Zhang, X.; Zhang, R.; Moore, J.B.; Wang, Y.; Yan, H.; Wu, Y.; Tan, A.; Fu, J.; Shen, Z.; Qin, G.; et al. The Effect of Vitamin A on Fracture Risk: A Meta-Analysis of Cohort Studies. Int. J. Environ. Res. Public Health 2017, 14, 1043. [Google Scholar] [CrossRef] [PubMed] [Green Version]
- Kong, S.H.; Kim, J.H.; Hong, A.R.; Lee, J.H.; Kim, S.W.; Shin, C.S. Dietary potassium intake is beneficial to bone health in a low calcium intake population: The Korean National Health and Nutrition Examination Survey (KNHANES) (2008-2011). Osteoporos. Int. 2017, 28, 1577–1585. [Google Scholar] [CrossRef]
- Muzylak, M.; Arnett, T.R.; Price, J.S.; Horton, M.A. The in vitro effect of pH on osteoclasts and bone resorption in the cat: Implications for the pathogenesis of FORL. J. Cell. Physiol. 2007, 213, 144–150. [Google Scholar] [CrossRef] [PubMed]
- El Sayed, S.A.; Nezwek, T.A.; Varacallo, M. Physiology, Bone. In StatPearls; StatPearls Publishing Copyright© 2021; StatPearls Publishing LLC: Treasure Island, FL, USA, 2021. [Google Scholar]
- Meghji, S.; Morrison, M.S.; Henderson, B.; Arnett, T.R. pH dependence of bone resorption: Mouse calvarial osteoclasts are activated by acidosis. Am. J. Physiol. Endocrinol. Metab. 2001, 280, E112–E119. [Google Scholar] [CrossRef]
- Lemann, J., Jr.; Litzow, J.R.; Lennon, E.J. The effects of chronic acid loads in normal man: Further evidence for the participation of bone mineral in the defense against chronic metabolic acidosis. J. Clin. Investig. 1966, 45, 1608–1614. [Google Scholar] [CrossRef] [Green Version]
- Maurer, M.; Riesen, W.; Muser, J.; Hulter, H.N.; Krapf, R. Neutralization of Western diet inhibits bone resorption independently of K intake and reduces cortisol secretion in humans. Am. J. Physiol. Ren. Physiol. 2003, 284, F32–F40. [Google Scholar] [CrossRef] [PubMed]
- Barzel, U.S. The skeleton as an ion exchange system: Implications for the role of acid-base imbalance in the genesis of osteoporosis. J. Bone Miner. Res. 1995, 10, 1431–1436. [Google Scholar] [CrossRef] [PubMed]
- Liu, Z.M.; Leung, J.; Wong, S.Y.; Wong, C.K.; Chan, R.; Woo, J. Greater fruit intake was associated with better bone mineral status among Chinese elderly men and women: Results of Hong Kong Mr. Os and Ms. Os studies. J. Am. Med. Dir. Assoc. 2015, 16, 309–315. [Google Scholar] [CrossRef]
- Brondani, J.E.; Comim, F.V.; Flores, L.M.; Martini, L.A.; Premaor, M.O. Fruit and vegetable intake and bones: A systematic review and meta-analysis. PLoS ONE 2019, 14, e0217223. [Google Scholar] [CrossRef]
- Benetou, V.; Orfanos, P.; Feskanich, D.; Michaëlsson, K.; Pettersson-Kymmer, U.; Eriksson, S.; Grodstein, F.; Wolk, A.; Bellavia, A.; Ahmed, L.A.; et al. Fruit and Vegetable Intake and Hip Fracture Incidence in Older Men and Women: The CHANCES Project. J. Bone Miner. Res. 2016, 31, 1743–1752. [Google Scholar] [CrossRef]
- Vannucci, L.; Fossi, C.; Quattrini, S.; Guasti, L.; Pampaloni, B.; Gronchi, G.; Giusti, F.; Romagnoli, C.; Cianferotti, L.; Marcucci, G.; et al. Calcium Intake in Bone Health: A Focus on Calcium-Rich Mineral Waters. Nutrients 2018, 10, 1930. [Google Scholar] [CrossRef] [Green Version]
- Riedt, C.S.; Schlussel, Y.; von Thun, N.; Ambia-Sobhan, H.; Stahl, T.; Field, M.P.; Sherrell, R.M.; Shapses, S.A. Premenopausal overweight women do not lose bone during moderate weight loss with adequate or higher calcium intake. Am. J. Clin. Nutr. 2007, 85, 972–980. [Google Scholar] [CrossRef] [PubMed] [Green Version]


| Variables | Women (n = 4160) | p Value | |
|---|---|---|---|
| Premenopausal (n = 2863) (%) | Postmenopausal (n = 1297) (%) | ||
| Age (year) | 39.0, 35.0 | 59.0, 53.0 | <0.001 |
| 30–39 | 1515 (52.9) | 6 (0.5) | |
| 40–49 | 1175 (41.1) | 85 (6.6) | |
| 50–59 | 173 (6.0) | 583 (44.9) | |
| 60–69 | 0 (0.0) | 437 (33.8) | |
| 70–75 | 0 (0.0) | 186 (14.4) | |
| Height (cm) | 158.9 ± 5.4 | 154.0 ± 0.2 | 0.077 |
| Weight (kg) | 56.5, 51.6 | 55.8, 51.0 | 0.002 |
| Body Mass Index (kg/m2) | 22.5, 20.5 | 23.6, 21.8 | <0.001 |
| Waist circumference (cm) | 75.1, 70.0 | 80.4, 75.2 | <0.001 |
| Education | <0.001 | ||
| ≤Elementary | 120 (4.2) | 730 (56.3) | |
| Middle school | 212 (7.4) | 217 (16.7) | |
| High school | 1402 (49.0) | 274 (21.1) | |
| ≥University | 1129 (39.4) | 76 (5.9) | |
| Income level | 0.635 | ||
| Low | 677 (23.6) | 328 (25.3) | |
| Middle–low | 728 (25.4) | 324 (25.0) | |
| Middle–high | 747 (26.1) | 340 (26.2) | |
| High | 711 (24.8) | 305 (23.5) | |
| Occupation | 0.047 | ||
| Yes | 1552 (54.2) | 660 (50.9) | |
| No | 1311 (45.8) | 637 (49.1) | |
| Average sleep time per day | <0.001 | ||
| <7 h | 895 (31.3) | 606 (46.7) | |
| 7–9 h | 1894 (66.2) | 659 (50.8) | |
| >9 h | 74 (2.6) | 32 (2.5) | |
| Alcohol consumption status | <0.001 | ||
| Yes | 2598 (90.7) | 890 (68.6) | |
| No | 265(9.3) | 407 (31.4) | |
| Smoking status | 0.005 | ||
| <100 cigarettes in lifetime | 59 (2.1) | 11 (0.8) | |
| ≥100 cigarettes in lifetime | 248 (8.7) | 87 (6.7) | |
| Never smoked | 2554 (89.2) | 1198 (92.4) | |
| Don’t know | 2 (0.01) | 1 (0.1) | |
| Nutrient intakes (per day) | |||
| Energy (Kcal) | 1210.9, 872.4 | 1510.9, 1206.3 | <0.001 |
| Water (g) | 796.6, 537.5 | 639.4, 409.3 | <0.001 |
| Protein (g) | 57.51, 43.15 | 47.4, 35.1 | <0.001 |
| Carbohydrate (g) | 274.0, 211.5 | 284.0, 223.0 | 0.014 |
| Calcium (mg) | 473.3 ± 5.8 | 424.6 ± 8.3 | 0.854 |
| Phosphorus (mg) | 1002.4, 766.0 | 894.6, 686.7 | <0.001 |
| Potassium (mg) | 2607.22, 1916.15 | 2389.5, 1702.5 | <0.001 |
| Total vitamin A (μgRE) | 581.7, 354.1 | 491.7, 244.2 | <0.001 |
| Retinol only (μg) | 61.8, 18.8 | 20.4, 3.1 | <0.001 |
| Vitamin C (mg) | 82.0, 49.5 | 77.3, 43.3 | 0.001 |
| Physical activity | |||
| High-intense | 0.080 | ||
| Yes | 432 (15.1) | 169 (13.0) | |
| No | 2431 (84.9) | 1128 (87.0) | |
| Moderate-intense | 0.141 | ||
| Yes | 388 (13.6) | 198 (15.3) | |
| No | 2475 (86.4) | 1099 (84.7) | |
| Regular walking | <0.001 | ||
| Yes | 1103 (38.5) | 583 (44.9) | |
| No | 1760 (61.5) | 714 (55.1) | |
| Bone mineral density | |||
| Total femur BMD (g/cm2) | 0.903, 0.824 | 0.787, 0.717 | <0.001 |
| Femoral neck BMD (g/cm2) | 0.760 ± 0.002 | 0.643 ± 0.003 | 0.740 |
| Lumbar spine BMD (g/cm2) | 0.995 ± 0.002 | 0.809 ± 0.004 | <0.001 |
| Whole body BMD (g/cm2) | 1.143, 1.073 | 0.995, 0.922 | <0.001 |
| Bone health status | |||
| Total femur | |||
| Normal | 2708 (94.6) | 891 (68.7) | |
| Osteopenia | 154 (5.4) | 386 (29.8) | |
| Osteoporosis | 1 (0.0) | 20 (1.5) | |
| Femoral neck | |||
| Normal | 2055 (71.8) | 370 (28.5) | |
| Osteopenia | 788 (27.5) | 746 (57.5) | |
| Osteoporosis | 20 (0.7) | 181 (14.0) | |
| Lumbar spine | |||
| Normal | 2316 (80.9) | 352 (27.1) | |
| Osteopenia | 525 (18.3) | 584 (45.0) | |
| Osteoporosis | 22 (0.8) | 361 (27.8) | |
| Cronbach’s Alpha If Variables Deleted | |||
|---|---|---|---|
| Observed Variables | Variables | Premenopausal Women (n = 2863) | Postmenopausal Women (n = 1297) |
| Age | age | 0.758 | 0.751 |
| HE_BMI | Body mass index | 0.758 | 0.751 |
| Physical activity | |||
| pa_high | High-intense | 0.758 | 0.751 |
| pa_mid | Moderate-intense | 0.758 | 0.751 |
| pa_walk | Regular walking | 0.758 | 0.751 |
| Nutrient intakes | |||
| N_CHO | Carbohydrate | 0.745 | 0.739 |
| N_PROT | Protein | 0.754 | 0.748 |
| N_EN | Energy | 0.696 | 0.695 |
| N_K | Potassium | 0.727 | 0.740 |
| N_CA | Calcium | 0.730 | 0.724 |
| N_PHOS | Phosphorus | 0.703 | 0.696 |
| N_VA | Total vitamin A | 0.730 | 0.716 |
| N_RETIN | Retinol only | 0.752 | 0.744 |
| N_VITC | Vitamin C | 0.749 | 0.741 |
| N_WATER | Water | 0.710 | 0.695 |
| Bone mineral density | |||
| DX_TFM_BMD | Total femur BMD | 0.758 | 0.751 |
| DX_NK_BMD | Femoral neck BMD | 0.758 | 0.751 |
| DX_LSP_BMD | Lumbar spine BMD | 0.758 | 0.751 |
| DX_WBT_BMD | Whole body BMD | 0.758 | 0.751 |
| Cronbach’s alpha | 0.755 | 0.749 | |
| Subjects | Χ2 | df | p | Χ2/df | TLI | CFI | RMSEA |
|---|---|---|---|---|---|---|---|
| Premenopausal | 1193.239 | 110 | <0.001 | 10.848 | 0.949 | 0.967 | 0.059 |
| Postmenopausal | 1123.090 | 124 | <0.001 | 9.057 | 0.924 | 0.945 | 0.079 |
| Estimate | ||||
|---|---|---|---|---|
| Code Name | Variables Name | Premenopausal Women | Postmenopausal Women | |
| Physical activity | pa_high | High intense | 0.501 | 0.218 |
| pa_mid | Moderate intense | 0.483 | 0.645 | |
| pa_walk | Regular walking | 0.323 | 0.258 | |
| E.C.P | N_EN | Energy | 1.099 | 0.865 |
| N_CHO | Carbohydrate | 0.795 | 0.606 | |
| N_PROT | Protein | 0.727 | 0.955 | |
| Minerals | N_K | Potassium | 0.807 | 0.907 |
| N_CA | Calcium | 0.732 | 0.563 | |
| N_PHOS | Phosphorus | 0.990 | 0.787 | |
| Vitamins | N_VA | Total vitamin A | 0.390 | 0.490 |
| N_RETIN | Retinol only | 0.258 | 0.088 | |
| N_VITC | Vitamin C | 0.503 | 0.896 | |
| Pathways | β | S.E. | C.R. | p | |||
|---|---|---|---|---|---|---|---|
| Direct pathways | Age | → | Vitamins | −6.031 | 1.626 | −3.708 | <0.001 |
| HE_BMI | → | Physical activity | 0.003 | 0.002 | 1.904 | 0.057 | |
| HE_BMI | → | Minerals | −9.898 | 3.679 | −2.690 | 0.007 | |
| HE_BMI | → | Vitamins | −3.775 | 2.591 | −1.457 | 0.145 | |
| Age | → | Physical activity | 0.003 | 0.001 | 3.463 | <0.001 | |
| HE_BMI | → | E.C.P | −0.701 | 0.310 | −2.260 | 0.024 | |
| Age | → | Minerals | −1.318 | 2.685 | −0.491 | 0.623 | |
| Age | → | E.C.P | −0.643 | 0.220 | −2.919 | 0.004 | |
| Age | → | N_WATER | −0.748 | 1.593 | −0.469 | 0.639 | |
| Physical activity | → | BMD | 0.020 | 0.016 | 1.268 | 0.205 | |
| Age | → | BMD | −0.002 | 0.000 | −4.664 | <0.001 | |
| E.C.P | → | BMD | 0.000 | 0.000 | 2.498 | 0.013 | |
| Minerals | → | BMD | 0.000 | 0.000 | 2.008 | 0.045 | |
| Vitamins | → | BMD | 0.000 | 0.000 | −2.419 | 0.016 | |
| HE_BMI | → | BMD | 0.012 | 0.001 | 19.581 | <0.001 | |
| N_WATER | → | BMD | 0.000 | 0.000 | 2.490 | 0.013 | |
| Total pathways | Age | → | BMD | −0.001 | 0.000 | - | 0.002 |
| HE_BMI | → | BMD | 0.012 | 0.001 | - | 0.002 | |
| Mediated Pathways | B | p |
|---|---|---|
| Age → E.C.P. → BMD | 0.000 | 0.006 |
| Age → N_WATER → BMD | 0.000 | 0.632 |
| Age → Minerals → BMD | 0.000 | 0.646 |
| Age → Vitamins → BMD | 0.001 | 0.023 |
| HE_BMI → Minerals → BMD | 0.000 | 0.072 |
| HE_BMI → E.C.P. → BMD | 0.000 | 0.028 |
| HE_BMI → Vitamins → BMD | 0.000 | 0.152 |
| Pathways | β | S.E. | C.R. | p | |||
|---|---|---|---|---|---|---|---|
| Direct pathways | Age | → | Vitamins | −10.931 | 1.495 | −7.313 | <0.001 |
| Age | → | N_WATER | −14.864 | 1.581 | −9.405 | <0.001 | |
| Age | → | E.C.P | −1.705 | 0.191 | −8.905 | <0.001 | |
| Age | → | Physical activity | −0.001 | 0.000 | −1.281 | 0.200 | |
| Age | → | Minerals | −38.321 | 4.330 | −8.850 | <0.001 | |
| HE_BMI | → | Minerals | −4.638 | 7.645 | −0.607 | 0.544 | |
| HE_BMI | → | E.C.P | 0.006 | 0.324 | 0.020 | 0.984 | |
| HE_BMI | → | Physical activity | 0.001 | 0.001 | 0.576 | 0.565 | |
| HE_BMI | → | Vitamins | −0.002 | 2.700 | −0.001 | 0.999 | |
| N_WATER | → | BMD | 0.000 | 0.000 | −0.034 | 0.973 | |
| Age | → | BMD | −0.007 | 0.000 | −21.204 | <0.001 | |
| Physical activity | → | BMD | 0.058 | 0.051 | 1.133 | 0.257 | |
| E.C.P | → | BMD | 0.000 | 0.000 | −1.386 | 0.166 | |
| Minerals | → | BMD | 0.000 | 0.000 | 1.978 | 0.048 | |
| Vitamins | → | BMD | 0.000 | 0.000 | 0.855 | 0.393 | |
| HE_BMI | → | BMD | 0.011 | 0.001 | 12.928 | <0.001 | |
| Total pathways | Age | → | BMD | −0.007 | 0.000 | - | 0.002 |
| HE_BMI | → | BMD | 0.011 | 0.001 | - | 0.002 | |
| Mediated Pathways | B | p |
|---|---|---|
| Age → E.C.P. → BMD | 0.000 | 0.240 |
| Age → N_WATER → BMD | 0.000 | 0.991 |
| Age → Minerals → BMD | 0.000 | 0.065 |
| Age → Vitamins → BMD | 0.000 | 0.427 |
| HE_BMI → Minerals → BMD | 0.000 | 0.554 |
| HE_BMI → E.C.P. → BMD | 0.000 | 0.987 |
| HE_BMI → Vitamins → BMD | 0.000 | 0.969 |
| BMD | Unadjusted | r | p | Adjusted | r | p | ||
|---|---|---|---|---|---|---|---|---|
| Total femur a | E.C.P | Energy ‡ | −0.003 | 0.885 | E.C.P | Energy ‡ | 0.029 | 0.121 |
| Carbohydrate ‡ | 0.031 | 0.097 | Carbohydrate ‡ | 0.046 | 0.014 | |||
| Protein † | −0.029 | 0.122 | Protein † | 0.003 | 0.872 | |||
| Minerals | Potassium † | 0.012 | 0.522 | Minerals | Potassium † | 0.042 | 0.024 | |
| Calcium † | −0.001 | 0.947 | Calcium † | 0.020 | 0.286 | |||
| Phosphorus ‡ | −0.022 | 0.241 | Phosphorus ‡ | 0.009 | 0.621 | |||
| Vitamins | Total vitamin A ‡ | 0.020 | 0.284 | Vitamins | Total vitamin A ‡ | 0.016 | 0.392 | |
| Retinol only ‡ | −0.057 | 0.002 | Retinol only ‡ | −0.009 | 0.649 | |||
| Vitamin C ‡ | 0.028 | 0.133 | Vitamin C ‡ | 0.032 | 0.085 | |||
| Water | Water ‡ | 0.004 | 0.840 | Water | Water ‡ | 0.015 | 0.410 | |
| Femoral neck a | E.C.P | Energy ‡ | 0.015 | 0.431 | E.C.P | Energy ‡ | 0.043 | 0.021 |
| Carbohydrate ‡ | 0.037 | 0.047 | Carbohydrate ‡ | 0.056 | 0.003 | |||
| Protein † | −0.012 | 0.515 | Protein † | 0.013 | 0.480 | |||
| Minerals | Potassium † | 0.017 | 0.370 | Minerals | Potassium † | 0.046 | 0.014 | |
| Calcium † | 0.017 | 0.359 | Calcium † | 0.039 | 0.038 | |||
| Phosphorus ‡ | −0.004 | 0.849 | Phosphorus ‡ | 0.024 | 0.206 | |||
| Vitamins | Total vitamin A ‡ | 0.026 | 0.164 | Vitamins | Total vitamin A ‡ | 0.018 | 0.337 | |
| Retinol only ‡ | −0.023 | 0.221 | Retinol only ‡ | −0.011 | 0.548 | |||
| Vitamin C ‡ | 0.020 | 0.293 | Vitamin C ‡ | 0.030 | 0.103 | |||
| Water | Water ‡ | 0.017 | 0.352 | Water | Water ‡ | 0.029 | 0.120 | |
| Lumbar spine b | E.C.P | Energy ‡ | −0.004 | 0.834 | E.C.P | Energy ‡ | −0.003 | 0.864 |
| Carbohydrate ‡ | 0.020 | 0.292 | Carbohydrate ‡ | 0.011 | 0.571 | |||
| Protein † | −0.015 | 0.423 | Protein † | −0.015 | 0.420 | |||
| Minerals | Potassium † | 0.000 | 0.994 | Minerals | Potassium † | 0.000 | 0.987 | |
| Calcium † | −0.006 | 0.743 | Calcium † | −0.006 | 0.747 | |||
| Phosphorus ‡ | −0.029 | 0.123 | Phosphorus ‡ | −0.030 | 0.113 | |||
| Vitamins | Total vitamin A ‡ | 0.021 | 0.254 | Vitamins | Total vitamin A ‡ | 0.017 | 0.371 | |
| Retinol only ‡ | −0.031 | 0.092 | Retinol only ‡ | −0.010 | 0.592 | |||
| Vitamin C ‡ | 0.011 | 0.547 | Vitamin C ‡ | −0.024 | 0.204 | |||
| Water | Water ‡ | 0.014 | 0.464 | Water | Water ‡ | −0.003 | 0.868 | |
| Whole body b | E.C.P | Energy ‡ | −0.025 | 0.185 | E.C.P | Energy ‡ | −0.014 | 0.444 |
| Carbohydrate ‡ | −0.011 | 0.568 | Carbohydrate ‡ | −0.011 | 0.563 | |||
| Protein † | −0.020 | 0.287 | Protein † | −0.017 | 0.357 | |||
| Minerals | Potassium † | 0.003 | 0.880 | Minerals | Potassium † | −0.002 | 0.925 | |
| Calcium † | 0.009 | 0.623 | Calcium † | 0.006 | 0.728 | |||
| Phosphorus ‡ | −0.033 | 0.079 | Phosphorus ‡ | −0.024 | 0.207 | |||
| Vitamins | Total vitamin A ‡ | −0.006 | 0.731 | Vitamins | Total vitamin A ‡ | −0.002 | 0.894 | |
| Retinol only ‡ | −0.038 | 0.044 | Retinol only ‡ | −0.023 | 0.213 | |||
| Vitamin C ‡ | −0.003 | 0.872 | Vitamin C ‡ | −0.013 | 0.502 | |||
| Water | Water ‡ | −0.002 | 0.907 | Water | Water ‡ | 0.004 | 0.825 |
| BMD | Unadjusted | r | p | Adjusted | r | p | ||
|---|---|---|---|---|---|---|---|---|
| Total femur a | E.C.P | Energy ‡ | 0.105 | <0.001 | E.C.P | Energy ‡ | 0.025 | 0.364 |
| Carbohydrate ‡ | 0.061 | 0.028 | Carbohydrate ‡ | 0.037 | 0.182 | |||
| Protein ‡ | 0.154 | <0.001 | Protein ‡ | 0.027 | 0.334 | |||
| Minerals | Potassium ‡ | 0.172 | <0.001 | Minerals | Potassium ‡ | 0.065 | 0.020 | |
| Calcium † | 0.154 | <0.001 | Calcium † | 0.064 | 0.021 | |||
| Phosphorus ‡ | 0.145 | <0.001 | Phosphorus ‡ | 0.041 | 0.144 | |||
| Vitamins | Total vitamin A ‡ | 0.144 | <0.001 | Vitamins | Total vitamin A ‡ | 0.038 | 0.173 | |
| Retinol only ‡ | 0.148 | <0.001 | Retinol only ‡ | 0.055 | 0.050 | |||
| Vitamin C ‡ | 0.167 | <0.001 | Vitamin C ‡ | 0.053 | 0.058 | |||
| Water | Water ‡ | 0.208 | <0.001 | Water | Water ‡ | 0.073 | 0.009 | |
| Femoral neck a | E.C.P | Energy ‡ | 0.116 | <0.001 | E.C.P | Energy ‡ | 0.034 | 0.221 |
| Carbohydrate ‡ | 0.063 | 0.024 | Carbohydrate ‡ | 0.038 | 0.173 | |||
| Protein ‡ | 0.172 | <0.001 | Protein ‡ | 0.049 | 0.081 | |||
| Minerals | Potassium ‡ | 0.180 | <0.001 | Minerals | Potassium ‡ | 0.082 | 0.003 | |
| Calcium † | 0.173 | <0.001 | Calcium † | 0.080 | 0.004 | |||
| Phosphorus ‡ | 0.162 | <0.001 | Phosphorus ‡ | 0.063 | 0.024 | |||
| Vitamins | Total vitamin A ‡ | 0.166 | <0.001 | Vitamins | Total vitamin A ‡ | 0.059 | 0.034 | |
| Retinol only ‡ | 0.169 | <0.001 | Retinol only ‡ | 0.040 | 0.150 | |||
| Vitamin C ‡ | 0.174 | <0.001 | Vitamin C ‡ | 0.056 | 0.044 | |||
| Water | Water ‡ | 0.218 | <0.001 | Water | Water ‡ | 0.082 | 0.003 | |
| Lumbar spine b | E.C.P | Energy ‡ | 0.073 | 0.009 | E.C.P | Energy ‡ | −0.008 | 0.770 |
| Carbohydrate ‡ | 0.002 | 0.946 | Carbohydrate ‡ | −0.027 | 0.325 | |||
| Protein ‡ | 0.143 | <0.001 | Protein ‡ | 0.024 | 0.381 | |||
| Minerals | Potassium ‡ | 0.148 | <0.001 | Minerals | Potassium ‡ | 0.046 | 0.095 | |
| Calcium † | 0.174 | <0.001 | Calcium † | 0.092 | 0.001 | |||
| Phosphorus ‡ | 0.138 | <0.001 | Phosphorus ‡ | 0.039 | 0.165 | |||
| Vitamins | Total vitamin A ‡ | 0.134 | <0.001 | Vitamins | Total vitamin A ‡ | 0.026 | 0.355 | |
| Retinol only ‡ | 0.176 | <0.001 | Retinol only ‡ | 0.019 | 0.505 | |||
| Vitamin C ‡ | 0.132 | <0.001 | Vitamin C ‡ | 0.019 | 0.484 | |||
| Water | Water ‡ | 0.190 | <0.001 | Water | Water ‡ | 0.066 | 0.017 | |
| Whole body b | E.C.P | Energy ‡ | 0.071 | 0.011 | E.C.P | Energy ‡ | 0.004 | 0.895 |
| Carbohydrate ‡ | 0.010 | 0.706 | Carbohydrate ‡ | −0.012 | 0.679 | |||
| Protein ‡ | 0.135 | <0.001 | Protein ‡ | 0.026 | 0.354 | |||
| Minerals | Potassium ‡ | 0.134 | <0.001 | Minerals | Potassium ‡ | 0.038 | 0.172 | |
| Calcium † | 0.171 | <0.001 | Calcium † | 0.089 | 0.001 | |||
| Phosphorus ‡ | 0.131 | <0.001 | Phosphorus ‡ | 0.038 | 0.175 | |||
| Vitamins | Total vitamin A ‡ | 0.143 | <0.001 | Vitamins | Total vitamin A ‡ | 0.018 | 0.522 | |
| Retinol only ‡ | 0.186 | <0.001 | Retinol only ‡ | 0.042 | 0.130 | |||
| Vitamin C ‡ | 0.120 | <0.001 | Vitamin C ‡ | 0.005 | 0.871 | |||
| Water | Water ‡ | 0.182 | <0.001 | Water | Water ‡ | 0.062 | 0.025 |
Publisher’s Note: MDPI stays neutral with regard to jurisdictional claims in published maps and institutional affiliations. |
© 2021 by the authors. Licensee MDPI, Basel, Switzerland. This article is an open access article distributed under the terms and conditions of the Creative Commons Attribution (CC BY) license (https://creativecommons.org/licenses/by/4.0/).
Share and Cite
Je, M.; Kim, H.; Kim, Y. A Structural Equation Modelling Approach to Determine Factors of Bone Mineral Density in Korean Women. Int. J. Environ. Res. Public Health 2021, 18, 11658. https://doi.org/10.3390/ijerph182111658
Je M, Kim H, Kim Y. A Structural Equation Modelling Approach to Determine Factors of Bone Mineral Density in Korean Women. International Journal of Environmental Research and Public Health. 2021; 18(21):11658. https://doi.org/10.3390/ijerph182111658
Chicago/Turabian StyleJe, Minkyung, Hyerim Kim, and Yoona Kim. 2021. "A Structural Equation Modelling Approach to Determine Factors of Bone Mineral Density in Korean Women" International Journal of Environmental Research and Public Health 18, no. 21: 11658. https://doi.org/10.3390/ijerph182111658
APA StyleJe, M., Kim, H., & Kim, Y. (2021). A Structural Equation Modelling Approach to Determine Factors of Bone Mineral Density in Korean Women. International Journal of Environmental Research and Public Health, 18(21), 11658. https://doi.org/10.3390/ijerph182111658