Abstract
Decreased air quality is connected to an increase in daily mortality rates. Thus, people’s behavioural response to sometimes elevated air pollution levels is vital. We aimed to analyse spatial and seasonal changes in air pollution-related information-seeking behaviour in response to nationwide reported air quality in Poland. Google Trends Search Volume Index data was used to investigate Poles’ interest in air pollution-related keywords. PM10 and PM2.5 concentrations measured across Poland between 2016 and 2019 as well as locations of monitoring stations were collected from the Chief Inspectorate of Environmental Protection databases. Pearson Product-Moment Correlation Coefficients were used to measure the strength of spatial and seasonal relationships between reported air pollution levels and the popularity of search queries. The highest PM10 and PM2.5 concentrations were observed in southern voivodeships and during the winter season. Similar trends were observed for Poles’ interest in air pollution-related keywords. Greater interest in air quality data in Poland strongly correlates with both higher regional and higher seasonal air pollution levels. It appears that Poles are socially aware of this issue and that their intensification of the information-seeking behaviour seems to indicate a relevant ad hoc response to variable threat severity levels.
1. Introduction
Air pollution is defined as the contamination of the environment by any chemical, physical or biological agent that modifies the natural characteristics of the atmosphere [1]. It can be divided into indoor and outdoor (ambient) air pollution. The most common indicators of air pollution are the atmospheric concentration of particles with a diameter of 10 microns or less and 2.5 microns or less, described respectively as coarse particulate matter 10 (PM10) and fine particulate matter 2.5 (PM2.5). These particles are composed of organic and elemental carbon, nitrates, sulphates and trace elements, including nickel, cadmium, arsenic and lead particles [2,3]. The World Health Organisation (WHO) sets the guideline values at 20 μg·m−3 annual mean and 50 μg·m−3 24-h mean for PM10 concentration and 10 μg·m−3 annual mean and 25 μg·m−3 24-h mean for PM2.5 concentration [4].
In 2016, about 90% of the world population was breathing polluted air [5]. The highest levels of air pollution are found in low-income and middle-income countries. In Europe, the value of the PM10 annual mean concentration set by the WHO guidelines was exceeded at 51% of the stations supervised by the European Environment Agency and in all the reporting countries, except Estonia, Finland and Ireland [5]. As 36 of the 50 most polluted cities in the European Union are in Poland [6], the issue of air pollution is of particular importance in this country. The greatest contributors to the problem are the coal-based economy and household heating systems [6]. Ambient air pollution is estimated to cause about 4,200,000 premature deaths worldwide [1,4].
It is of high importance that individuals exposed to polluted air take active steps to reduce associated risks. To reduce direct exposure to high outdoor particulate matter concentrations people can, for example, avoid exercising outdoors or close to high-traffic areas [7], stay indoors and close windows, or utilise air purifiers. Studies carried out in China and the US found that people reduced their outdoor activity when atmospheric PM2.5 concentration rose [8,9,10]. Moreover, an increase in PM2.5 concentration in China is associated with higher online searches for anti-PM2.5 masks and air filters [11]. Other research showed that individuals limited their transportation-related physical activity and spent more time at home when particulate matter concentrations increased [9,12]. These results show that people not only search for the information on their local air quality index but use it as a guideline to adapt their behavioural patterns. To date, no such study has been carried out in Poland [13].
Despite growing general awareness and specific information-seeking and self-protection behaviours, an increased number of hospital admissions correlates with the worse air quality in Poland [14,15]. A similar trend is observed worldwide [16,17,18]. Moreover, it was demonstrated that short-term exposure to polluted air correlates with increased mortality [19]. This includes cardiovascular and respiratory diseases’ cause-specific mortality rates [14,15,20,21].
However, before active prevention, individuals must understand what air pollution is in general. It may be possible to achieve this passively, for instance by governmental promotion of the issue [22]. This said, what would likely be more effective is active and purposeful information-seeking, self-education and acquisition of air pollution awareness by individuals. This process can be illustrated by, for example, societal emphasis on the importance of checking your local daily air quality index. This in turn can be measured by investigating the popularity of relevant search terms entered into internet search engines, for example with the use of the Google Trends Search Volume Index (GTSVI). It shows the level of interest in a given search term, by a specifically located population within the specified period. If these data are compared to the reported national air quality data, an analysis of people’s response to reported air pollution levels can be performed.
The primary aim of this study is to analyse spatial and seasonal changes in air pollution-related information-seeking behaviour measured by the prevalence of specific keywords in the GTSVI, in response to nationwide reported air quality in Poland.
Secondary objectives include a description of the aerial distribution of air quality monitoring stations and a simple spatial and seasonal analysis of changes in air quality in Poland.
2. Materials and Methods
2.1. Keyword Search
First, the authors proposed keywords related to air pollution. As Google Trends displays only a relative level of interest in a given search term, keywords were entered into KWFinder [23], a keyword research tool, part of a suite of search engine optimization (SEO) tools developed by Mangools, to find words with significant general search volume based on absolute values.
After initial analysis, seven keywords were selected. Subsequently, keywords were entered into Google Trends [24], to generate data. The search was performed in Polish. Three of the initially selected keywords: “air purity” (czystość powietrza), “PM2.5” and “PM10” were rejected, as data related to these keywords was available only nationally, making voivodeship-level spatial analysis impossible. Eventually, four keywords were selected: “smog” (smog), “air pollution” (zanieczyszczenie powietrza), “air quality” (jakość powietrza) and “air purifier” (oczyszczacz powietrza). Based on the KWFinder data, the average annual search volumes for these keywords were 19,900, 11,000, 8600 and 66,700, respectively. This amounts to a total number of about 420,000 searches over four years. The validity of the selection as related to air pollution was confirmed by checking that entering them into the Google search engine [25] resulted in a display of general information about smog and air pollution (1st keyword), particulate matter concentration maps and pollution alerts (2nd and 3rd keyword) or air purifiers (4th keyword).
Keyword-specific daily search Index between 1 January 2016 and 31 December 2019 was extracted from Google Trends for further analyses. This period was selected as at the beginning of 2016, when Google introduced an improvement to their Google Trends data collection system [24]. The year 2020 was not included as the ongoing COVID-19 pandemic [26] may have affected people’s behaviour which would result in biased data.
Google Trends shows interest in a given keyword using a search volume index (SVI). The relative value indicating the popularity of a term on a selected day ranges between 0 and 100. A value of 100 is ascribed to the day during which a keyword was searched the greatest number of times in the given investigated time frame (in this case between 2016 and 2019). A value of 0 expresses a relative quantity of search queries for the analysed phrase of less than 1% of its greatest popularity over the given period. All data were accessed and downloaded on 9 November 2020. The Google Trends analysis was based on the methodology framework proposed by Mavragani et al. [27].
2.2. Data Acquisition
The division of Poland into 16 voivodeships was used in the spatial analysis (Figure 1). A voivodeship represents the highest-level administrative division of Poland and is a regional administrative unit of Poland [28]. The area, population and population density of each voivodeship was extracted from Statistics Poland (Table 1) [29]. Moreover, in each voivodeship, a capital was selected to investigate potential differences in air quality and SVI values between rural and capitals. The latitude and longitude of each capital were extracted from LatitudeLongitude.org (Table 1) [30].
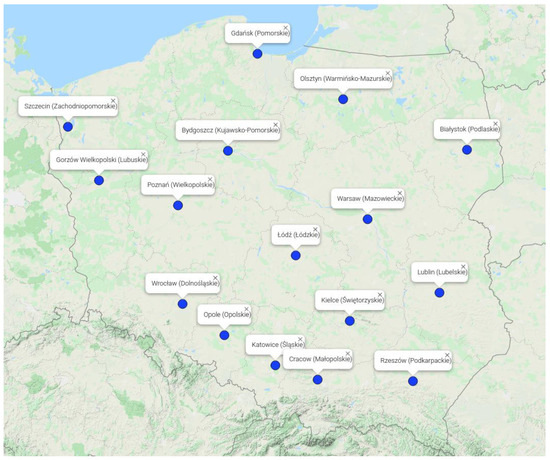
Figure 1.
Locations of the capitals of the voivodeships. The name of the voivodeship is provided in brackets.

Table 1.
General geographical and demographical characteristics of voivodeships of Poland.
The data collected by the Chief Inspectorate of Environmental Protection between 2016 and 2019 inclusive were included in the analysis [3]. To analyse seasonal air quality changes, data for daily 24-h (24 h) mean PM10 and PM2.5 concentrations for each monitoring station between the years 2016 and 2019 were taken into account. Moreover, the number of PM10 and PM2.5 monitoring stations operating in a given year in a given voivodeship was determined, too (Table 2 and Table 3). In total, for this period, records from 284 monitoring stations reporting PM10 concentrations, and 130 monitoring stations reporting PM2.5 concentrations were analysed (Figure 1). To analyse spatial relationships, the same data points collected in the same monitoring stations were used. However, due to the availability of straightforward summary data, to minimize the risk of miscalculations, a database that summarises air pollution in Poland for the years 2000–2019 was used [3].
Table 2.
General characteristics of PM10 monitoring stations operating between years 2016–2019 in Poland.
Table 3.
General characteristics of PM2.5 monitoring stations operating between years 2016–2019 in Poland.
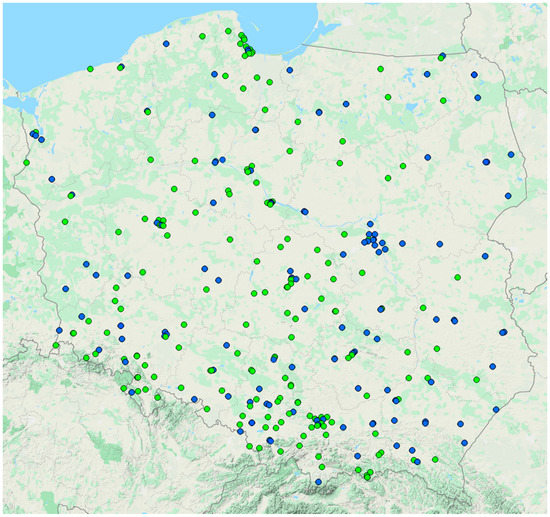
Figure 2.
Locations of air quality monitoring stations in Poland. Blue dots represent PM2.5 and PM10 monitoring stations. Green dots represent the PM10 monitoring station.
2.3. Data Analysis
All data were analysed in Microsoft Office Excel 2016 software developed by Microsoft Corporation.
- For seasonal analysis, mean monthly GTSVI for all keywords in a given voivodeship were averaged over the whole country (data generated by Google Trends [24]). Using this data four-year monthly GTSVI for all keywords in Poland were calculated (Figure 3a).
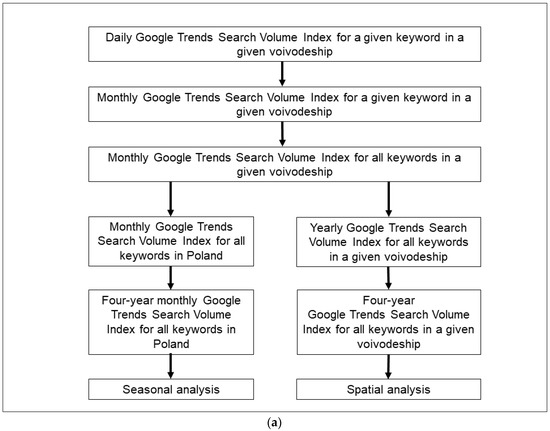
 Figure 3. Methodology of GTSVI data synthesis (a) and air quality data synthesis (b).
 - To conduct spatial analysis, the yearly GTSVI for all keywords in a given voivodeship was computed. Finally, the four-year GTSVI for all keywords in a given voivodeship was determined (Table 1).
With the intention of air quality evaluation, mean 24-h daily concentrations of PM10 or PM2.5 recorded by a given monitoring station were averaged over all monitoring stations for a given day for a given voivodeship/capital (Figure 3b, data were acquired from the database of the Chief Inspectorate of Environmental Protection [3]). Next, daily measurements were averaged over months.
- For seasonal analysis, mean monthly PM10/PM2.5 concentrations data were averaged over the whole country. Using this data four-year monthly PM10/PM2.5 concentrations for Poland were determined.
In addition to that, the mean number of monitoring stations per voivodeship, mean area per monitoring station, mean population per monitoring station and mean population density per monitoring station were computed (Table 2 and Table 3).
Corresponding data sets were paired to investigate the spatial and seasonal changes in actual air pollution levels as well as between actual air pollution levels and the popularity of the search queries related to them. Pearson Product-Moment Correlation coefficients (PCC) and p-values were calculated to determine the strength of association between the variables [32,33]. To determine PCC values in the two correlated datasets were always arranged in ascending order. Assessment of the strength of association between the two corresponding datasets was based on the absolute value of PCC. Strength of association was classified as large (PCC > 0.5), medium (0.5 > PCC > 0.3), small (0.3 > PCC > 0.1) or minimal (0.1 > PCC). The threshold of statistical significance was set at p < 0.05.
3. Results and Discussion
3.1. Spatial Distribution of Air Quality Monitoring Stations
Monitoring stations are more clustered in cities than in rural areas (Figure 1 and Figure 2). It was also found that more polluted regions have a greater number of available air quality monitoring stations as well as that the area per monitoring station is lower in more polluted regions compared to territories that have better air quality (Table 4). The number of active stations per voivodeship also varies, both for PM10 and PM2.5 monitoring stations (Table 2 and Table 3).
Table 4.
Pearson product-moment correlation coefficients for correlations between geographic coordinates of capital cities of voivodeships and corresponding particulate matter concentration changes.
An increase in the mean number of monitoring stations per voivodeship is strongly positively correlated with the incrementation of particulate matter concentrations (PCC > 0.5, p < 0.05, Table 4). Conversely, an increase in mean area per monitoring station is strongly or mildly negatively correlated with the increase in particulate matter concentrations.
Neither the increase in mean population per monitoring station nor mean population density per monitoring station is significantly correlated with the rise in PM10 or PM2.5 concentrations as well as latitude or longitude of the voivodeship’s capital (p > 0.05, Table 4).
On the one hand, city-centred distribution of the stations allows for more precise monitoring of air pollution in cities, which have potentially worse air quality due to high traffic and population density. Conversely, such uneven distribution of the measurement locations might have biased calculated mean PM10 and PM2.5 concentration values. Nevertheless, as in all voivodeships the urban clustering of monitoring stations is observed, all calculations have a similar bias. Therefore, spatial and seasonal analyses based on a comparison of the PM10 and PM2.5 between the voivodeships can be performed and may be a reasonable source of data.
3.2. Spatial Distribution of Air Pollution in Poland
As the latitude of capitals of the voivodeships increases both PM10 and PM2.5 concentrations recorded in the voivodeship as well as its capital decreases (p < 0.05, Table 5). For all four relationships, the strength of association is large.
Table 5.
Pearson product-moment correlation coefficients for correlations between aerial distribution of monitoring stations and corresponding variables.
With the increase in longitude, minimal changes in PM10 concentrations were noticed. Moreover, small increases in PM2.5 were observed. However, all relationships are not statistically significant (p > 0.05).
The highest mean 2016–2019 PM10 concentrations were observed in the Opole (42.6), Cracow (38.5) and Łódź (36.7), while the lowest were observed in the Białystok (20.9), Tricity (22.4) and Szczecin (22.9) capitals (Table 2). Similarly, the highest PM2.5 concentrations were observed in the Opole (29.7), Cracow (29.4) and Łódź (24.0) capitals. However, the lowest ones were recorded in the Szczecin (13.5), Tricity (15.8) and Bydgoszcz (15.9) capitals (Table 3).
The highest mean 2016–2019 PM10 concentrations were observed in the Śląskie (39.8), Dolnośląskie (35.0) and Łódzkie (34.9) Voivodeships, while the lowest were in the Podlaskie (21.0), Warmińsko-Mazurskie (22.9) and Zachodniopomorskie (23.3) Voivodeships (Table 2). The same trend was recorded for PM2.5 concentrations, however, the values were equal to 28.1, 26.8, 25.5 and 15.6, 15.9, 16.2, respectively (Table 3).
Neither any individual capital’s nor any voivodeship’s air quality complies with the WHO air quality guidelines in either annual mean PM10 or PM2.5 concentrations [4]. Moreover, in the Cracow and Opole capitals, the PM10 concentrations were about twice as high as recommended, while the PM2.5 concentrations were about three times higher (Table 2 and Table 3). The same situation is observed in the whole of the Małopolskie and Śląskie Voivodeships, where these capitals are located. On the other hand, in other capitals, for example, Białystok, Tricity and Szczecin, as well as their corresponding voivodeships, the mean annual atmospheric PM10 concentration was just slightly higher than advised by the guidelines (Table 2). However, the PM2.5 concentrations in these locations were still about 50% higher than recommended by the WHO (Table 3).
For the most polluted regions, the data from the Chief Inspectorate of Environmental Protection reports are in line with independently collected data in other studies [34,35]. Moreover, these and other studies [36] show that in these regions submicron PM1 concentrations are also elevated and that the smaller the particle, the more toxic it is [36].
In general, the southern regions of the country are more polluted than the northern regions (p < 0.05, Table 5) [37]. This gradual improvement in air quality may be caused by increased proximity to the Baltic Sea and the predominantly lowland character of the northern part of the country. These factors allow air to be seamlessly and continuously exchanged [38]. On the other hand, southern regions of Poland are made up of upland, mountainous regions [39] and have a heavily coal-based economy and energy production [40]. In addition, larger cities in the south are located in basins and valleys. Such environmental conditions reduce air movement, cause trapping, and result in the formation of smog and decreased air quality [41].
3.3. Google Trends Search Volume Index
The greatest mean GTSVI for the years 2016–2019 was observed in the Małopolskie (94.5), Śląskie (75.8) and Dolnośląskie (63.8) Voivodeships. The lowest one was recorded in the Warmińsko-Mazurskie (18.8), Podlaskie (23.3) and Lubuskie (23.8) Voivodeships (Table 1).
3.4. Analysis of the Relationships between GTSVI and Air Pollution Levels
Mean voivodeship’s GTSVI is strongly, positively and significantly related to an increase in PM10 and PM2.5 concentrations in both voivodeships and their capitals (p < 0.05, Table 6). Moreover, mean voivodeship’s GTSVI is strongly, negatively and significantly correlated with the increase in latitude. For longitude, no correlation was observed. In addition to that, the rise in mean voivodeship’s GTSVI closely corresponds with the increase in the mean number of monitoring stations per voivodeship (PCC = 0.71, p < 0.05) as well as decrementation of mean area per monitoring station (PCC = −0.63, p < 0.05).
Table 6.
Pearson product-moment correlation coefficients for correlations between mean voivodeship’s GTSVI for years 2016–2019 and corresponding variables.
Neither increase in mean population per monitoring station nor mean population density per monitoring station is significantly correlated with mean voivodeship’s GTSVI (PCC = −0.03, 0.28, respectively; p < 0.05).
3.5. Spatial Analysis of Poles’ Interest in Air Pollution
Whether people are aware of elevated pollution levels in their local area or not is an important issue. Evidence for this interest can be seen in the high mean Google Trends GTSVI values found in the Cracow or Opole capitals, and the corresponding voivodeships (Table 1). Moreover, a strong linear correlation between the annual level of air pollution in a given area and the frequency of air pollution-related search queries is observed (Table 6) [32]. This means that the higher the mean yearly concentration of PM10 and/or PM2.5 concentration in a given area, the more frequently people are looking for their local air quality indexes, for example searching online for “air quality” or “air pollution”. It was also found that the Google Trends GTSVI have higher correlations with PM concentrations for capitals’ than for voivodeships’. Of all calculated PCCs, the highest one was observed for the correlation between PM2.5 concentration and capitals’ SVI. On the other hand, the weakest correlation was observed for PM2.5 concentration and voivodeship’s SVI. The correlations observed for PM10 concentration and voivodeship’s GTSVI as well as capitals’ GTSVI are placed in-between the PM2.5-related correlations. Thus, it cannot be stated whether changes in PM2.5 or PM10 concentration are more connected with changes in Poles’ air pollution-related information-seeking behaviour.
3.6. Seasonal Analysis of Air Pollution Levels and the Popularity of the Search Queries
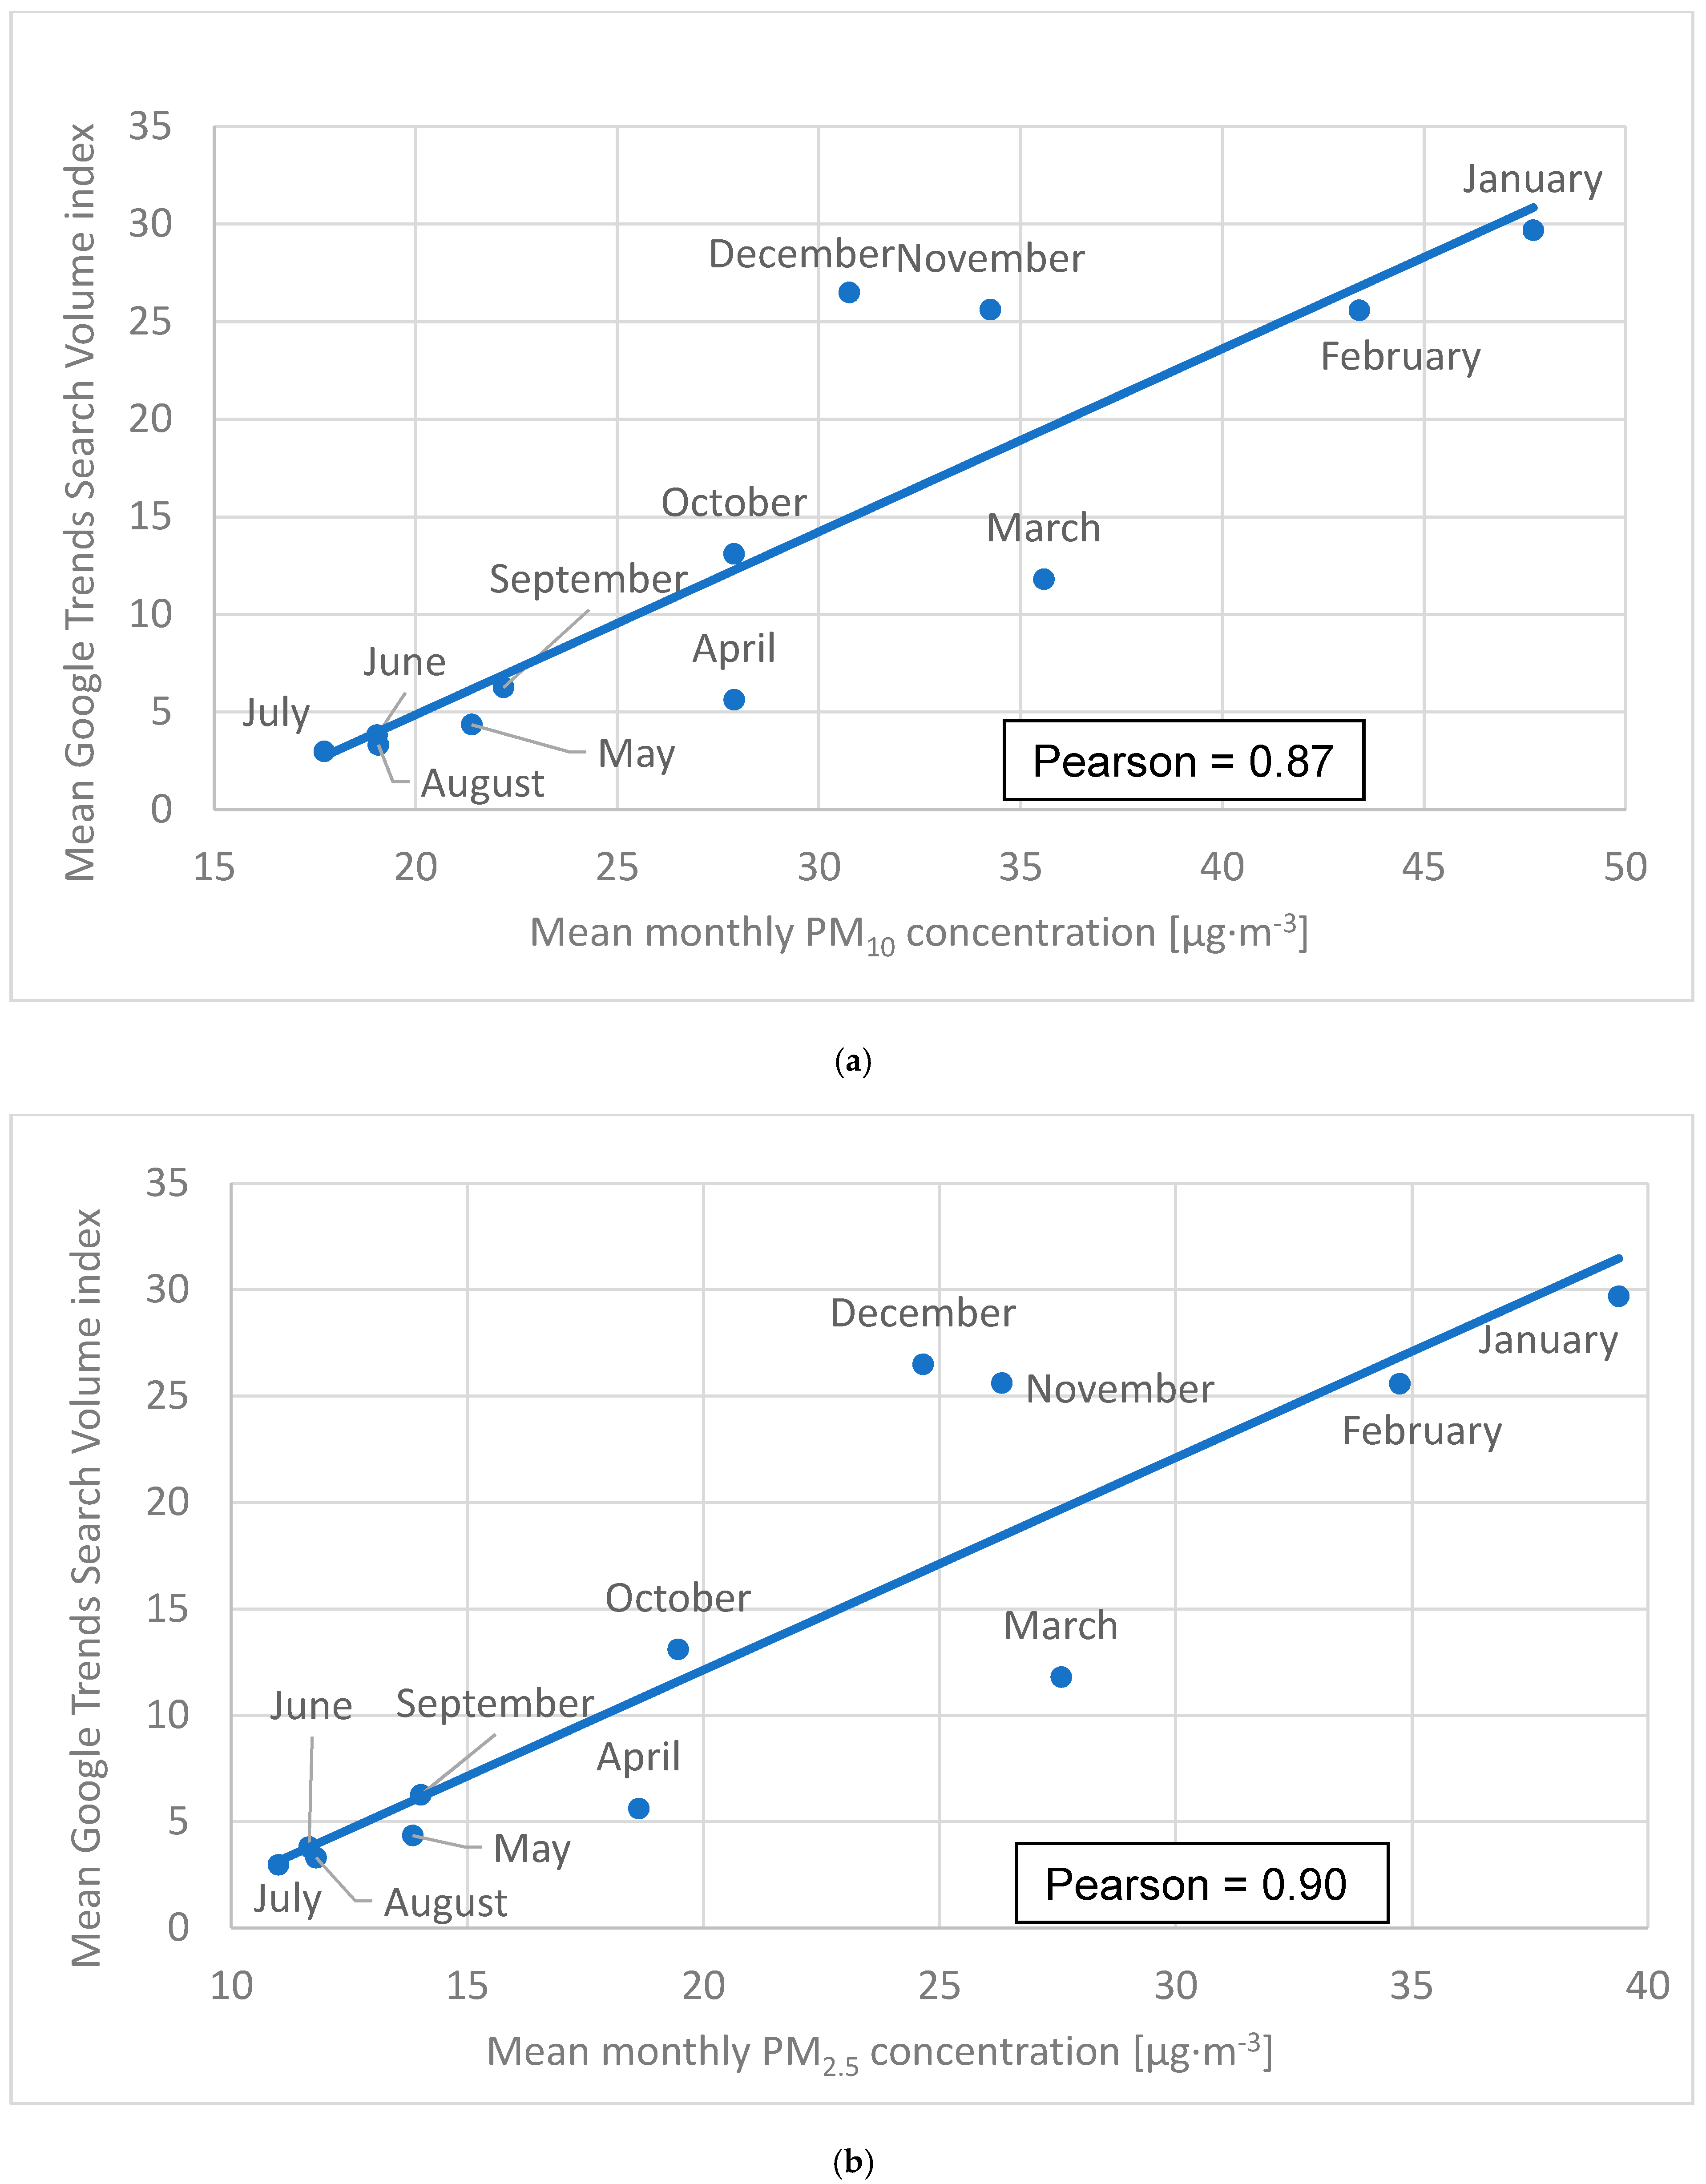
The greatest mean monthly GTSVI value was observed for January (29.7), followed by December (26.5) and November (25.6). Conversely, the lowest values were noted for July (3.0), August (3.3) and June (3.8, Figure 4a,b). Mean monthly PM10 concentrations [μg·m−3] were the highest for January (35.6), February (43.4) and March (47.7), while the lowest were observed for July (17.7), June (19.0) and August (19.1, Figure 4a). The same trend was observed for mean monthly PM2.5 concentrations (Figure 4b). The PCC between mean monthly GTSVI and mean monthly PM10/PM2.5 concentrations were equal to 0.87 (p < 0.05) and 0.90 (p < 0.05), respectively.
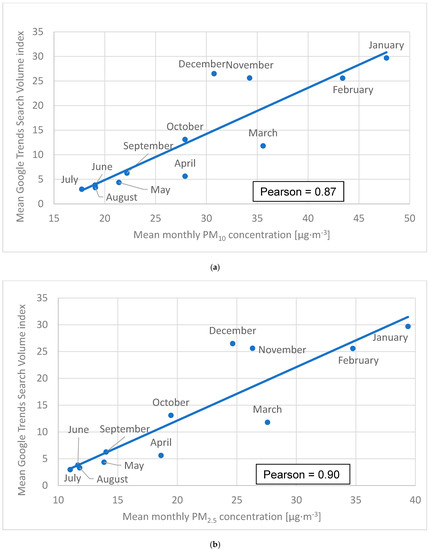
Figure 4.
Mean monthly Search Volume Index in relation tomean monthly PM10 concentrations (a) and mean monthly PM2.5 concentrations (b).
When it comes to seasonal air pollution distribution, the WHO-recommended annual PM10 concentrations were met in June, July, and August (Figure 4a,b). On the other hand, in the November–March period, the WHO guidelines were greatly exceeded. Annual PM2.5 requirements were not satisfied in any month, but in June, July and August these values were only slightly exceeded. Again, a similar pattern was observed by other researchers [34,35,36].
In general, air quality is much worse in winter than in summer which is confirmed by other studies (Figure 4a,b) [34,35]. This happens due to temperature inversion episodes that occur throughout the whole year, but they are more frequent and intensive in the winter season [41,42].
Similar to geographical distribution, the greater the seasonal PM10 and/or PM2.5 concentration, the greater Poles’ interest in air pollution-related search queries. Thus, Poles seem to recognize the importance of checking their local daily air quality index in general, and especially in the winter season when smog is the most harmful [41,42]. Nevertheless, this correlation does not indicate a causal relationship.
During March and April air pollution appears to be underestimated, as evidenced by a relatively lower number of searches for air quality data despite still relatively high pollution levels (Figure 4a,b). On the other hand, November and December data points are situated over the trend line. Therefore, in this period Poles pay more than average attention to air quality relative to the reported levels of air pollution. This may indicate the general public expectation of smog before and during winter. Nonetheless, significant pollution levels are also present during the spring season.
3.7. Future Perspectives
Our study as well as others on the same subject show that people are aware of air pollution and execute prevention strategies to protect themselves from potential harms [11,43,44,45]. Interestingly, except for GTSVI people’s response to changing air quality levels can be also monitored via Twitter or Sina Weibo interactions [44,46,47]. Moreover, efforts are being made to inform people about the poor air quality more effectively [48,49]. However, the general public may not link air pollution with its potential to increase the prevalence and/or exacerbation of cardiovascular or respiratory diseases. Therefore, they do not show enough interest in local air quality levels. In addition, society may not recognize the symptoms in an early stage of chronic disease exacerbation. Late admission to the hospital increases the probability of death which results in greater mortality rates [14,15,20,21]. Thus, the general public may not be aware of secondary and tertiary prevention measures, which aim to reduce the impact of a disease that has already occurred [43]. For example, some researchers propose that there is no link between chronic inflammatory skin diseases symptoms and air pollution, which has been shown with the use of Google Trends GTSVI analyses [50,51]. In addition, increased air pollution levels may exacerbate the course of ongoing chronic diseases [52] and affected individuals may not know that. Therefore, starting with chronically ill patients and individuals who live in the most polluted regions worldwide, there is a need for health promotion programs focused on air pollution-related secondary and tertiary prevention strategies, including accurate symptom recognition. Such interventions would result in faster responses to rapid, acute exacerbation of chronic disease symptoms and would probably reduce the cause-specific mortalities related to high air pollution levels, both in the short and long term.
Last but not least, the greatest contributors to the problem of air quality in Poland are the coal-based economy and household heating systems [6]. To reduce the hospital admission and mortality rates potentially caused by air pollution as well as to comply with WHO air quality guidelines, there seems to be a very urgent need for a shift towards more ecological energy production sources.
3.8. Limitations
Due to the use of databases, the data were not directly collected by the authors, and thus this study is subject to methodological limitations. The meteorological monitoring stations that measure PM10 and PM2.5 concentrations were pre-existing and arbitrarily positioned. This may have generated bias in the data, as the concentration of particulate matter is highly dependent on measurement location and locations of the monitoring stations analysed in this study are city-centred. However, as such a pattern is observed in all voivodeships the data are uniformly biased. In addition to that, similar trends in air quality observations were made by other studies which used their measurement stations [34,35,36]. In addition, as mentioned in the Google Trends methodological framework [27] sometimes Google Trends SVIs may differ, even though the keywords used are the same, for example, because the search query was embedded in quotation marks. To reduce this bias, all keywords analysed in this study were always entered without quotation marks, plus signs or any other special characters. Only spaces were used to separate double-word keywords, allowing for the broadest tracking possible. Moreover, Google Trends GTSVI shows the relative, not the absolute number of search queries. However, correlation coefficients can be calculated from either absolute or relative values, thus the calculations in this study remain valid.
Finally, sometimes the data for a given monitoring station were incomplete (below 2% in total). In such a case the average PM10/PM2.5 concentrations for a given day were calculated from data available from other monitoring stations for this particular voivodeship/capital.
4. Conclusions
Neither any capital’s nor any voivodeship’s annual ambient particulate matter concentration complies with the WHO air quality guidelines for either annual mean PM10 or PM2.5 concentrations. Moreover, in the Cracow and Opole capitals, the PM10 concentrations were about twice as high as recommended, while the PM2.5 concentrations were about three times higher. It was also found that the south of Poland is more polluted than the north. This gradual improvement in air quality may be caused by increased proximity to the Baltic Sea and the predominantly lowland character of the northern part of the country.
In addition to that, air quality is much worse in winter than in summer. WHO-advised annual PM10 concentrations were satisfied in June, July and August, but the desired PM2.5 concentrations were not achieved at any time of the year. In the November-March period, the WHO guidelines were greatly exceeded. However, these conclusions might have been slightly biased due to the uneven distribution of air quality monitoring stations.
A strong linear correlation between the annual level of air pollution in a given area and the frequency of air pollution-related search queries is observed (PCC ≥ 0.64). It was also found that the GTSVI have higher correlations with PM concentrations for capitals’ than for voivodeships’. Even stronger correlations were found between mean monthly GTSVI values and seasonal PM10 and PM2.5 quality variations (PCC = 0.87 and 0.90, respectively). Thus, Poles seem to recognize the importance of checking their local daily air quality index in general, and especially in the winter season when smog is the most harmful. As shown by other researches, even better tracking of the societies’ response to elevated air pollution levels as well as a rise in social awareness regarding the issue can be achieved by a smartphone app or information distribution via social media and news reports [44,46,47,48,49].
To conclude, it appears that Poles are aware of the spatial and seasonal changes in air pollution levels, as similar trends were observed for Poles’ interest in air pollution-related keywords. Moreover, the seasonal and regional intensification of their information-seeking behaviour seems to indicate a relevant ad hoc response to the variable threat severity levels. However, the correlations presented in our study do not indicate causal relationships and the need for further research to answer the foremost question of causality is strongly endorsed.
Author Contributions
W.N. and K.P.-N. developed the study concept and wrote the draft of the manuscript. K.P.-N. applied for the approval of the Bioethics Committee of the Medical University of Gdańsk. W.N. collected the data and performed statistical analysis. All authors have read and agreed to the published version of the manuscript.
Funding
This research received no external funding.
Institutional Review Board Statement
Bioethics Committee of the Medical University of Gdańsk had given its approval to carry out this study. Bioethics Committee of the Medical University of Gdańsk approval number: NK BBN/707/2020.
Informed Consent Statement
Not applicable.
Data Availability Statement
The data presented in this study are available on request from the corresponding author.
Conflicts of Interest
The authors declare no conflict of interest.
References
- World Health Organization. Regional Office for Africa: Air Pollution. Available online: https://www.afro.who.int/health-topics/air-pollution (accessed on 15 November 2020).
- Yang, Y.; Pun, V.C.; Sun, S.; Lin, H.; Mason, T.G.; Qiu, H. Particulate matter components and health: A literature review on exposure assessment. J. Public Health Emerg. 2018, 2, 14. [Google Scholar] [CrossRef]
- Główny Inspektorat Ochrony Środowiska: Bank Danych Pomiarowych. Available online: http://powietrze.gios.gov.pl/pjp/archives (accessed on 15 November 2020).
- World Health Organization. Ambient (Outdoor) Air Pollution. Available online: https://www.who.int/news-room/fact-sheets/detail/ambient-(outdoor)-air-quality-and-health (accessed on 15 November 2020).
- Derwent, R.; Hjellbrekke, A.-G. Air Quality in Europe—2019 Report 1994–2019 EEA Report No. 10/2019; European Environment Agency: Luxembourg, 2019; ISBN 978-92-9480-088-6.
- World Bank Group: In the spotlight. Air Quality in Poland, What Are the Issues and What Can Be Done? 2019. Available online: https://documents1.worldbank.org/curated/en/426051575639438457/pdf/Air-Quality-in-Poland-What-are-the-Issues-and-What-can-be-Done.pdf (accessed on 15 November 2020).
- American Lung Association: 10 Tips to Protect Yourself from Unhealthy Air. Available online: https://www.lung.org/clean-air/outdoors/10-tips-to-protect-yourself (accessed on 15 November 2020).
- An, R.; Zhang, S.; Ji, M.; Guan, C. Impact of ambient air pollution on physical activity among adults: A systematic review and meta-analysis. Perspect. Public Health 2018, 138, 111–121. [Google Scholar] [CrossRef] [PubMed]
- Yu, H.; An, R.; Andrade, F. Ambient fine particulate matter air pollution & physical activity: A longitudinal study of university retirees in Beijing, China. Am. J. Health Behav. 2017, 41, 401–410. [Google Scholar]
- Yu, H.; Yu, M.; Gordon, S.P.; Zhang, R. The association between ambient fine particulate air pollution and physical activity: A cohort study of university students living in Beijing. Int. J. Behav. Nutr. Phys. Act. 2017, 14, 1–10. [Google Scholar] [CrossRef] [PubMed]
- Liu, T.; He, G.; Lau, A. Avoidance behavior against air pollution: Evidence from online search indices for anti-PM2.5 masks and air filters in Chinese cities. Environ. Econ. Policy Stud. 2018, 20, 325–363. [Google Scholar] [CrossRef]
- An, R.; Shen, J.; Ying, B.; Tainio, M.; Andersen, Z.J.; de Nazelle, A. Impact of ambient air pollution on physical activity and sedentary behavior in China: A systematic review. Environ. Res. 2019, 176, 108545. [Google Scholar] [CrossRef]
- PubMed: Poland Air Pollution Physical Activity. Available online: https://pubmed.ncbi.nlm.nih.gov/?term=poland+air+pollution+physical+activity (accessed on 22 November 2020).
- Slama, A.; Śliwczyński, A.; Woźnica, J.; Zdrolik, M.; Wiśnicki, B.; Kubajek, J.; Turżańska-Wieczorek, O.; Gozdowski, D.; Wierzba, W.; Franek, E. Impact of air pollution on hospital admissions with a focus on respiratory diseases: A time-series multi-city analysis. Environ. Sci. Pollut. Res. 2019, 26, 16998–17009. [Google Scholar] [CrossRef] [PubMed] [Green Version]
- Dyląg, K.A.; Wroński, B.; Przybyszewska, K.; Dumnicka, P. Air pollution is associated with incidence of viral croup among children living in Kraków area, Poland. Folia Med. Cracov. 2018, 58, 69–79. [Google Scholar] [PubMed]
- Liu, Y.; Wang, H.D.; Yu, Z.X.; Hua, S.C.; Zhou, L.T.; Peng, L.P. Influence of Air Pollution on Hospital Admissions in Adult Asthma in Northeast China. Chin. Med. J. 2018, 131, 1030–1033. [Google Scholar] [CrossRef] [PubMed]
- Dastoorpoor, M.; Sekhavatpour, Z.; Masoumi, K.; Mohammadi, M.J.; Aghababaeian, H.; Khanjani, N.; Hashemzadeh, B.; Vahedian, M. Air pollution and hospital admissions for cardiovascular diseases in Ahvaz, Iran. Sci. Total Environ. 2019, 652, 1318–1330. [Google Scholar] [CrossRef] [PubMed]
- Tian, Y.; Liu, H.; Zhao, Z.; Xiang, X.; Li, M.; Juan, J.; Song, J.; Cao, Y.; Wang, X.; Chen, L.; et al. Association between ambient air pollution and daily hospital admissions for ischemic stroke: A nationwide time-series analysis. PLoS Med. 2018, 15, e1002668. [Google Scholar] [CrossRef] [Green Version]
- Chen, R.; Yin, P.; Meng, X.; Liu, C.; Wang, L.; Xu, X.; Ross, J.A.; Tse, L.A.; Zhao, Z.; Kan, H.; et al. Fine particulate air pollution and daily mortality: A nationwide analysis in 272 Chinese cities. Am. J. Respir. Crit. Care Med. 2017, 196, 73–81. [Google Scholar] [CrossRef] [PubMed]
- Chen, R.; Yin, P.; Meng, X.; Wang, L.; Liu, C.; Niu, Y.; Liu, Y.; Liu, J.; Qi, J.; You, J.; et al. Associations between coarse particulate matter air pollution and cause-specific mortality: A nationwide analysis in 272 Chinese cities. Environ. Health Perspect. 2019, 127, 017008. [Google Scholar] [CrossRef] [PubMed] [Green Version]
- Le, T.G.; Ngo, L.; Mehta, S.; Do, V.D.; Thach, T.Q.; Vu, X.D.; Nguyen, D.T.; Cohen, A. Effects of short-term exposure to air pollution on hospital admissions of young children for acute lower respiratory infections in Ho Chi Minh City, Vietnam. Res. Rep. Health. Eff. Inst. 2012, 169, 5–72. [Google Scholar]
- Huet, A.L.; Frail, C.K.; Lake, L.M.; Snyder, M.E. Impact of passive and active promotional strategies on patient acceptance of medication therapy management services. J. Am. Pharm. Assoc. 2015, 55, 178–181. [Google Scholar] [CrossRef] [Green Version]
- KWFinder: Keyword Research and Analysis Tool. Available online: https://kwfinder.com/ (accessed on 15 November 2020).
- Google: Google Trends. Available online: https://trends.google.com/trends/?geo=PL (accessed on 15 November 2020).
- Google: Google. Available online: https://www.google.com/ (accessed on 15 November 2020).
- World Health Organisation: WHO Timeline-COVID-19. Available online: https://www.who.int/news/item/27-04-2020-who-timeline---covid-19 (accessed on 15 November 2020).
- Mavragani, A.; Ochoa, G. Google Trends in Infodemiology and Infoveillance: Methodology Framework. JMIR Public Health Surveill. 2019, 5, e13439. [Google Scholar] [CrossRef] [Green Version]
- Kaczmarek, T. Administrative division of Poland-25 years of experience during the systemic transformation. EchoGéo 2016, 19, 14514. [Google Scholar] [CrossRef]
- Statistics Poland: Area and Population in the Territorial Profile in 2020. Available online: https://stat.gov.pl/en/topics/population/population/area-and-population-in-the-territorial-profile-in-2020,4,14.html (accessed on 18 August 2021).
- LatitudeLongitude.org. Available online: https://latitudelongitude.org/about (accessed on 18 August 2021).
- Map Maker: Analyze Data & Share Maps. Available online: https://maps.co/ (accessed on 18 August 2021).
- Laerd Statistics: Pearson Product-Moment Correlation-When You Should Run This Test, the Range of Values the Coefficient Can Take and How to Measure Strength of Association. Available online: https://statistics.laerd.com/statistical-guides/pearson-correlation-coefficient-statistical-guide.php (accessed on 15 November 2020).
- Top Tip Bio: How To Perform a Pearson Correlation Test in Excel. Available online: https://toptipbio.com/pearson-correlation-excel/ (accessed on 16 November 2020).
- Samek, L.; Stegowski, Z.; Styszko, K.; Furman, L.; Fiedor, J. Seasonal contribution of assessed sources to submicron and fine particulate matter in a Central European urban area. Environ. Pollut. 2018, 241, 406–411. [Google Scholar] [CrossRef]
- Samek, L.; Furman, L.; Mikrut, M.; Regiel-Futyra, A.; Macyk, W.; Stochel, G.; van Eldik, R. Chemical composition of submicron and fine particulate matter collected in Krakow, Poland. Consequences for the APARIC project. Chemosphere 2017, 187, 430–439. [Google Scholar] [CrossRef]
- Mainka, A.; Zajusz-Zubek, E. PM1 in ambient and indoor air-urban and rural areas in the upper Silesian Region, Poland. Atmosphere 2019, 10, 662. [Google Scholar] [CrossRef] [Green Version]
- Nations Online: Administrative Map of Poland-Nations Online Project. Available online: https://www.nationsonline.org/oneworld/map/poland-administrative-map.htm (accessed on 21 November 2020).
- Britannica: Sea Breeze. Available online: https://www.britannica.com/science/sea-breeze (accessed on 21 November 2020).
- Bartoszek, K.; Krzyżewska, A. The atmospheric circulation conditions of the occurrence of heatwaves in Lublin, southeast Poland. Weather 2017, 72, 176–180. [Google Scholar] [CrossRef]
- Pytlak, A.; Stepniewska, Z.; Kuźniar, A.; Szafranek-Nakonieczna, A.; Wolińska, A.; Banach, A. Potential for Aerobic Methane Oxidation in Carboniferous Coal Measures. Geomicrobiol. J. 2014, 31, 737–747. [Google Scholar] [CrossRef]
- Steyn, D.G.; De Wekker, S.F.J.; Kossmann, M.; Martilli, A. Boundary Layers and Air Quality in Mountainous Terrain; Springer: Dordrecht, The Netherlands, 2013; pp. 261–289. [Google Scholar]
- The Weather Network: Winter Air Quality Is Often Worse Than in Summer. Here’s Why. Available online: https://www.theweathernetwork.com/news/articles/winter-air-quality-can-be-just-as-bad-as-summer/122739 (accessed on 21 November 2020).
- Laumbach, R.; Meng, Q.; Kipen, H. What can individuals do to reduce personal health risks from air pollution? J. Thorac. Dis. 2015, 7, 96–107. [Google Scholar] [PubMed]
- Gurajala, S.; Dhaniyala, S.; Matthews, J.N. Understanding Public Response to Air Quality Using Tweet Analysis. Soc. Media + Soc. 2019, 5, 2056305119867656. [Google Scholar] [CrossRef] [Green Version]
- Delmas, M.A.; Kohli, A. Can Apps Make Air Pollution Visible? Learning About Health Impacts Through Engagement with Air Quality Information. J. Bus. Ethics 2020, 161, 279–302. [Google Scholar] [CrossRef] [Green Version]
- Wang, S.; Paul, M.J.; Dredze, M. Social Media as a Sensor of Air Quality and Public Response in China. J. Med. Internet Res. 2015, 17, e22. [Google Scholar] [CrossRef]
- Jiang, W.; Wang, Y.; Tsou, M.-H.; Fu, X. Using Social Media to Detect Outdoor Air Pollution and Monitor Air Quality Index (AQI): A Geo-Targeted Spatiotemporal Analysis Framework with Sina Weibo (Chinese Twitter). PLoS ONE 2015, 10, e0141185. [Google Scholar] [CrossRef] [Green Version]
- D’Antoni, D.; Auyeung, V.; Walton, H.; Fuller, G.W.; Grieve, A.; Weinman, J. The effect of evidence and theory-based health advice accompanying smartphone air quality alerts on adherence to preventative recommendations during poor air quality days: A randomised controlled trial. Environ. Int. 2019, 124, 216–235. [Google Scholar] [CrossRef]
- Limaye, V.S.; Knowlton, K.; Sarkar, S.; Ganguly, P.S.; Pingle, S.; Dutta, P.; Sathish, M.; Tiwari, A.; Solanki, B.; Shah, C.; et al. Development of Ahmedabad’s Air Information and Response (AIR) Plan to Protect Public Health. Int. J. Environ. Res. Public Health 2018, 15, 1460. [Google Scholar] [CrossRef] [PubMed] [Green Version]
- Whang, K.A.; Huang, A.H.; Miller, L.S.; Kang, S.; Kwatra, S.G. Association of particulate matter air pollution and itch: A digital epidemiology approach. J. Am. Acad. Dermatol. 2019, 81, 1409–1410. [Google Scholar] [CrossRef] [Green Version]
- Chu, B.; Markeson, C.D.; Barbieri, J.S. Association of air pollution and chronic inflammatory skin diseases: Challenges of Google Trends data and importance of local data. J. Am. Acad. Dermatol. 2020, 83, e217–e218. [Google Scholar] [CrossRef]
- Zhou, T.; Zhong, Y.; Liao, J.; Wang, G.; Li, X.; Qian, X.; Xiang, P.; Chen, X.; Xu, Z.; Zhang, F.; et al. A prospective study of salvational intervention with ICS/LABA for reducing chronic obstructive pulmonary disease exacerbation under severe air pollution (SIRCAP) in Beijing: Protocol of a multi-center randomized controlled trial. BMC Pulm. Med. 2019, 19, 22. [Google Scholar] [CrossRef]


Publisher’s Note: MDPI stays neutral with regard to jurisdictional claims in published maps and institutional affiliations. |
© 2021 by the authors. Licensee MDPI, Basel, Switzerland. This article is an open access article distributed under the terms and conditions of the Creative Commons Attribution (CC BY) license (https://creativecommons.org/licenses/by/4.0/).