
Radioactivity, Metals Pollution and Mineralogy Assessment of a Beach Stretch from the Ionian Coast of Calabria (Southern Italy)

 ,
,  ,
,  ,
,  ,
, 

 ,
, 
 ,
, 

Abstract
:1. Introduction
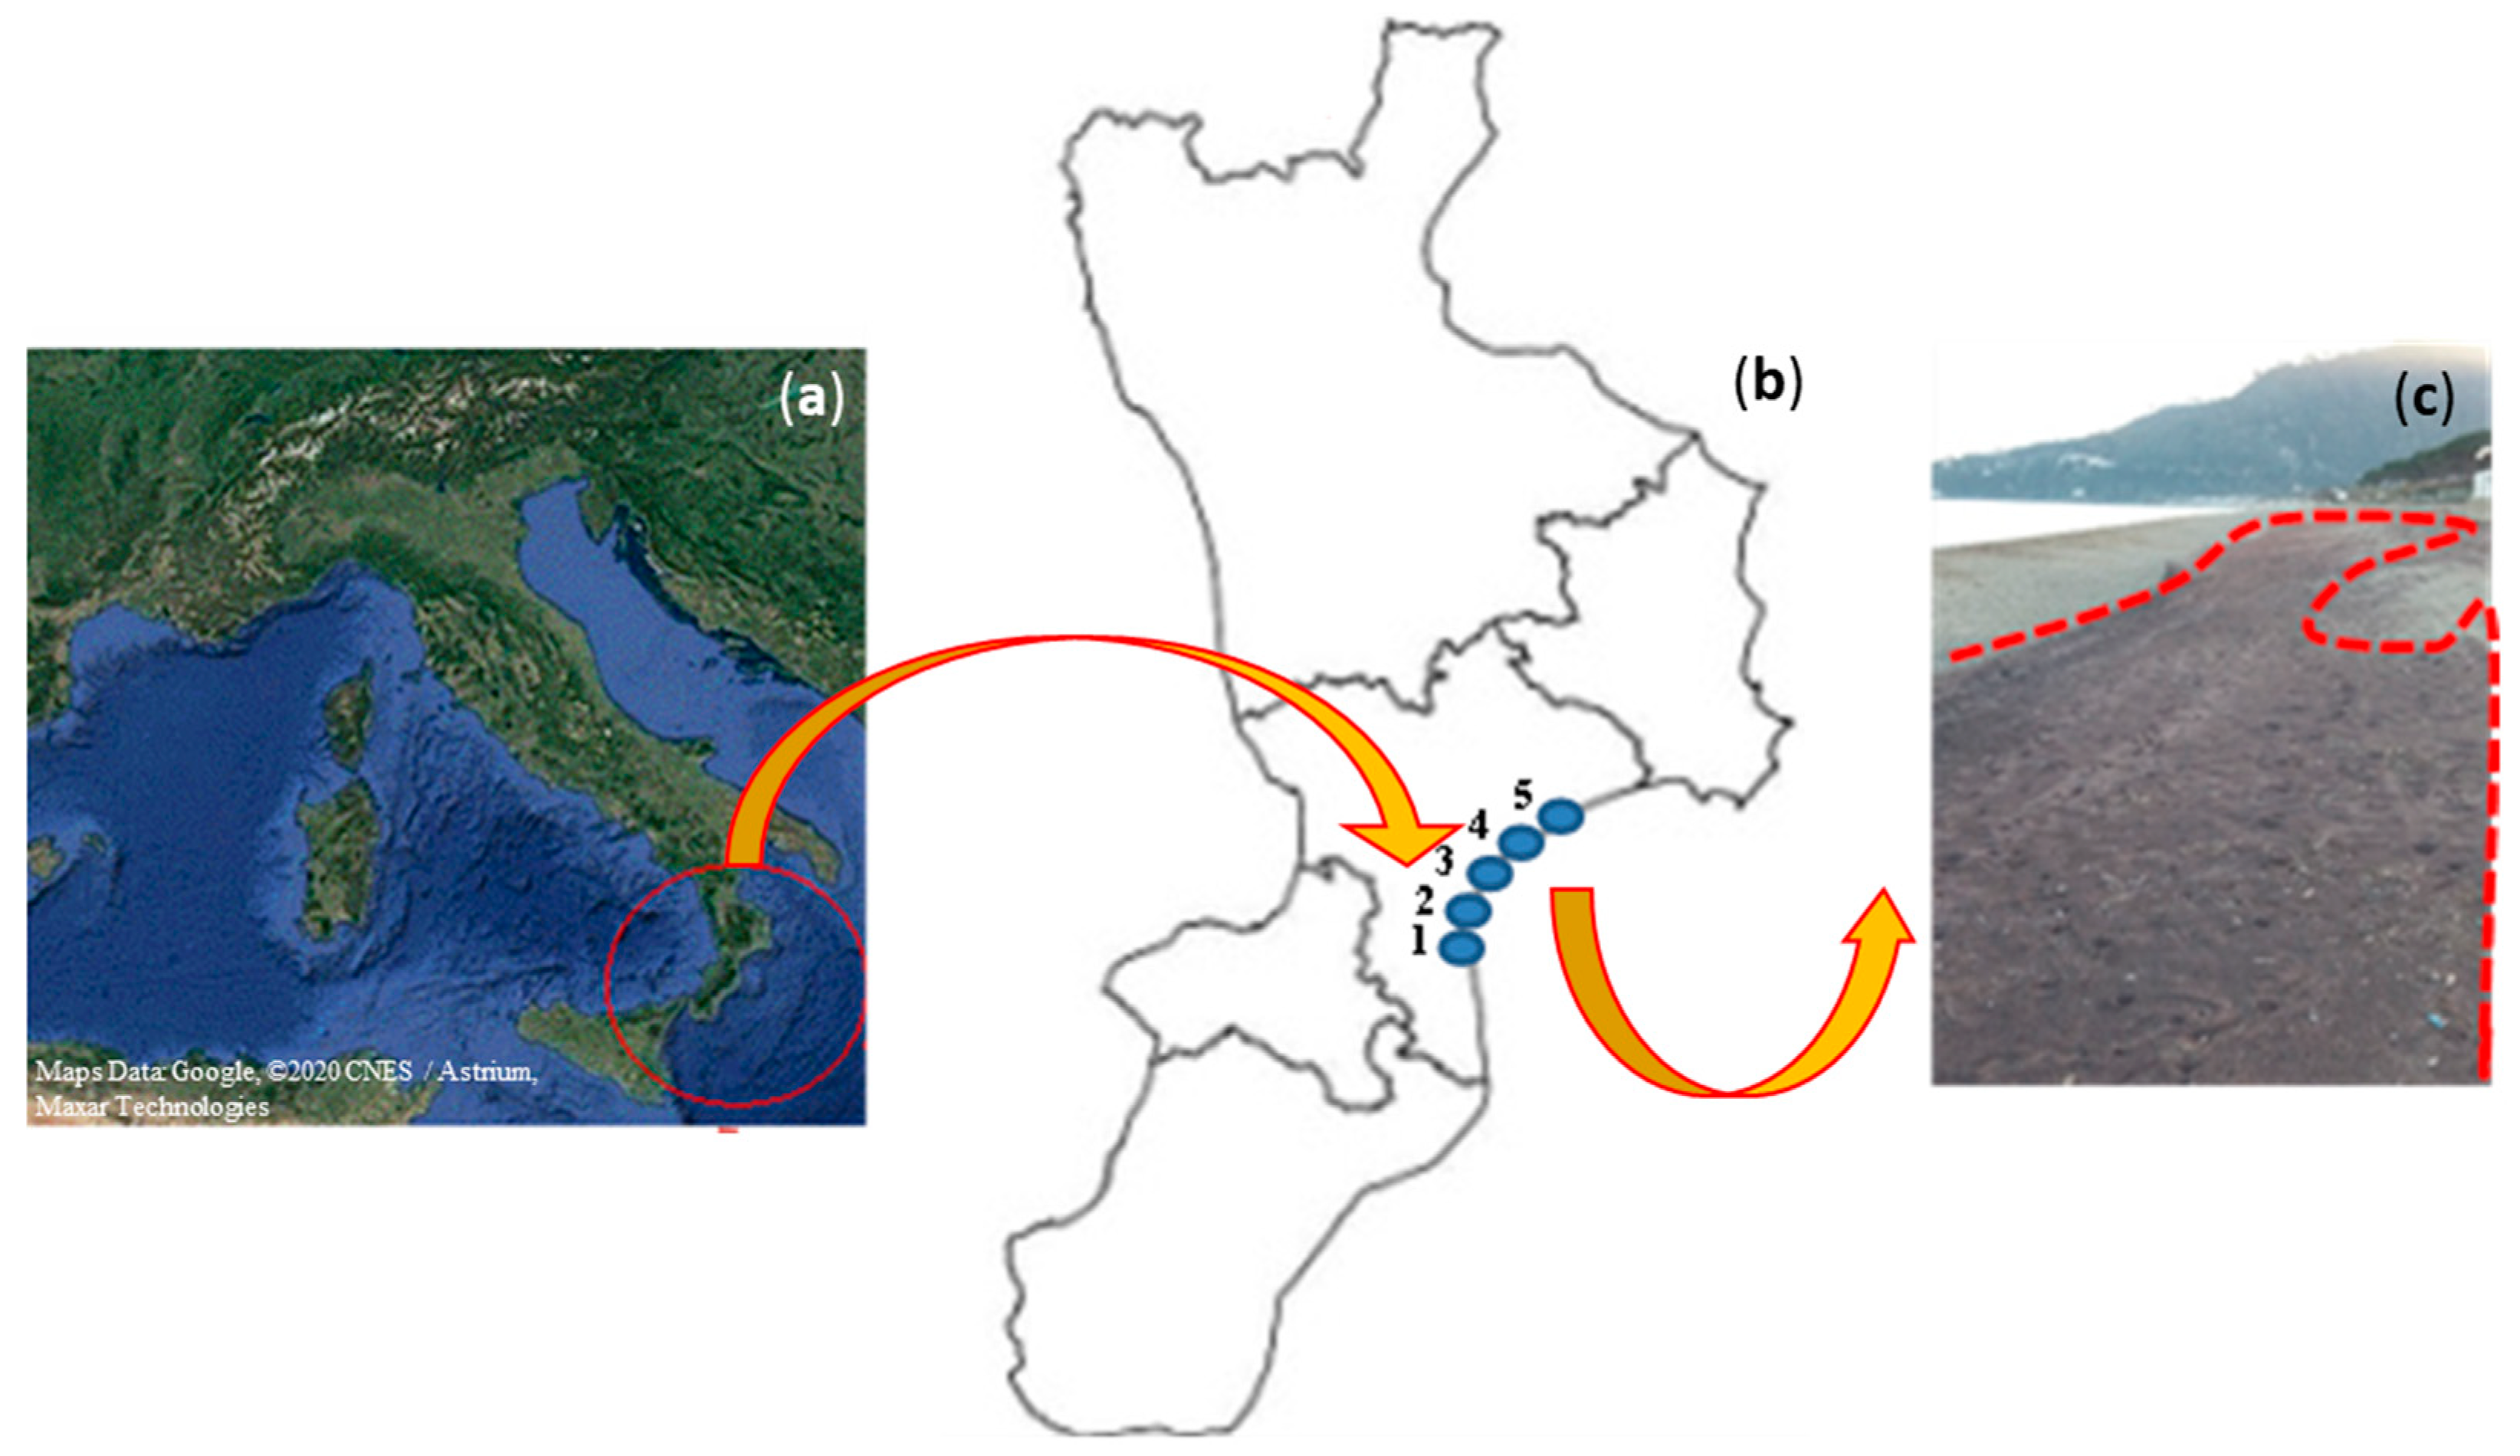
2. Geological Setting
3. Materials and Methods
3.1. In Situ Radiometric Analysis
3.2. Sand Sampling and Preparation
3.3. Gamma Spectrometry Analysis
3.4. Evaluation of Radiological Indices
3.4.1. Absorbed γ-Dose Rate
3.4.2. The Annual Effective Dose Equivalent
3.5. X-ray Fluorescence
3.6. Assessing the Level of Contamination of Heavy Metals
3.6.1. The Enrichment Factor
3.6.2. The Geoaccumulation Index
3.6.3. The Contamination Factor
3.6.4. The Pollution Load Index
3.7. X-ray Diffraction
3.8. Micro-Raman Scattering
4. Results and Discussion
4.1. Radioactivity Analysis
4.2. Evaluation of Radiological Hazard Effects
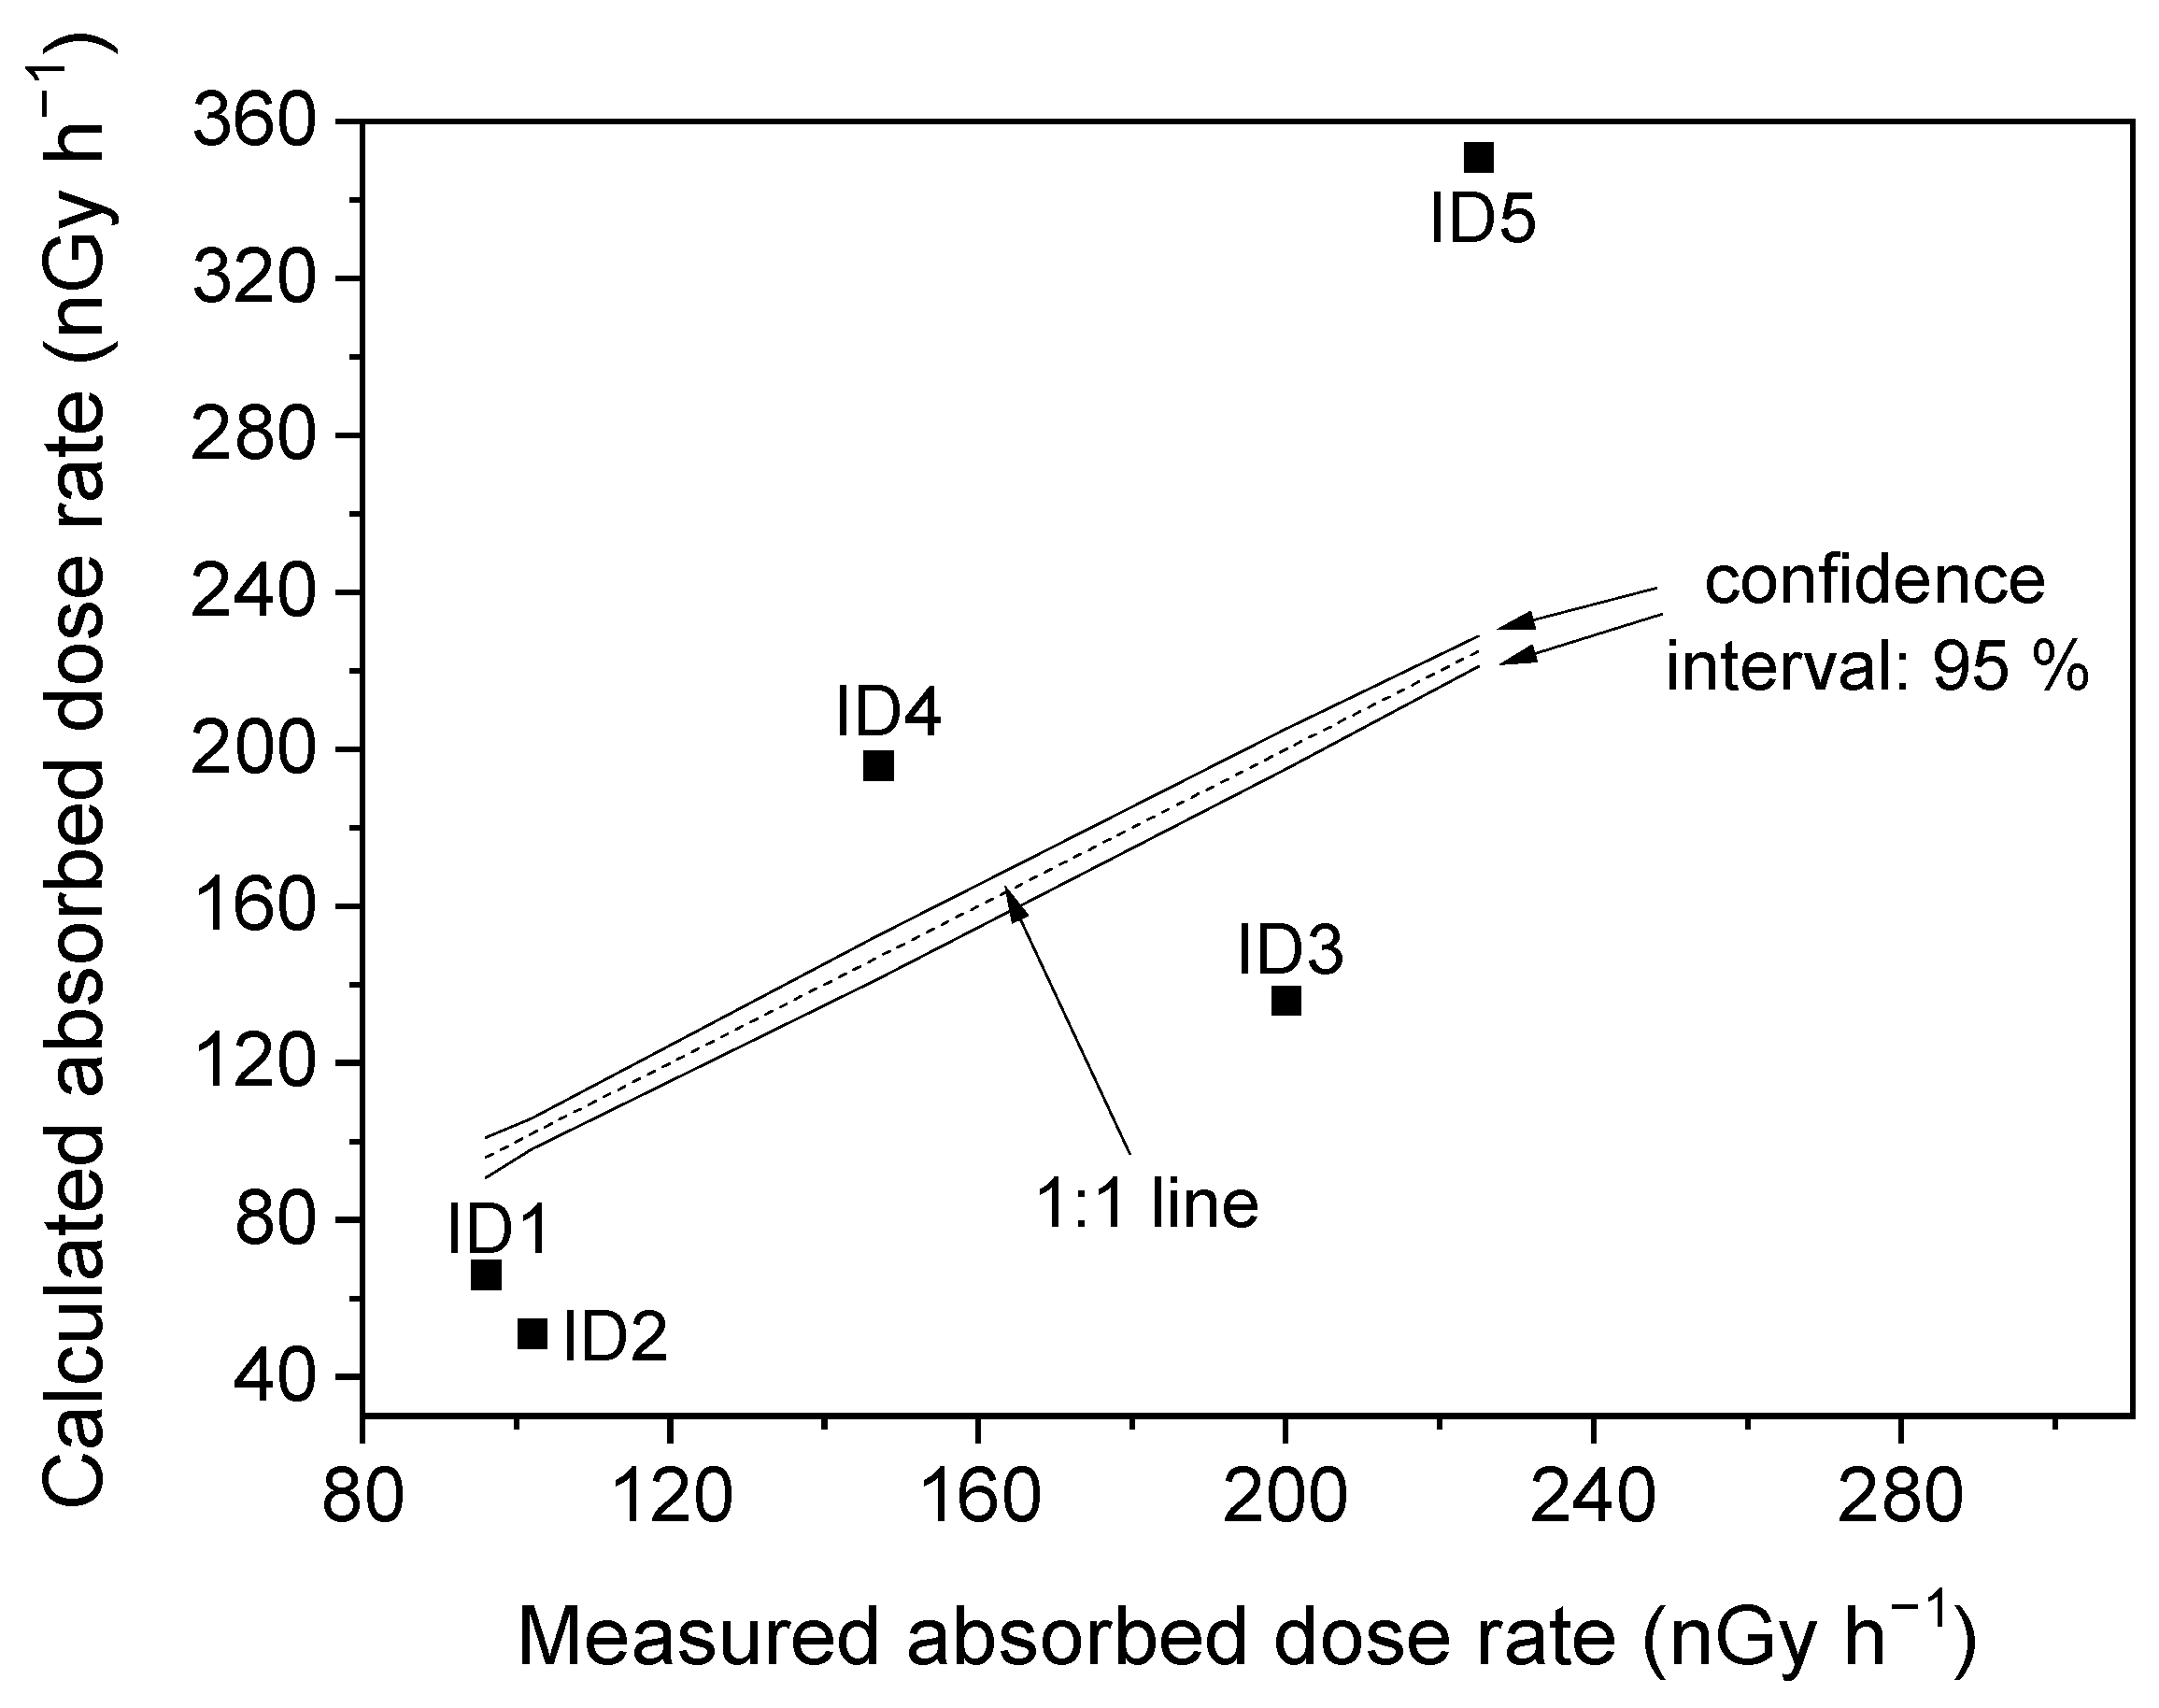
4.2.1. Absorbed Dose Rate
4.2.2. AEDE
4.3. Heavy Metals Analysis
4.4. Estimation of the Level of Heavy Metals Contamination
4.4.1. EF
4.4.2. Igeo
4.4.3. CF
4.4.4. PLI
4.5. XRD Analysis
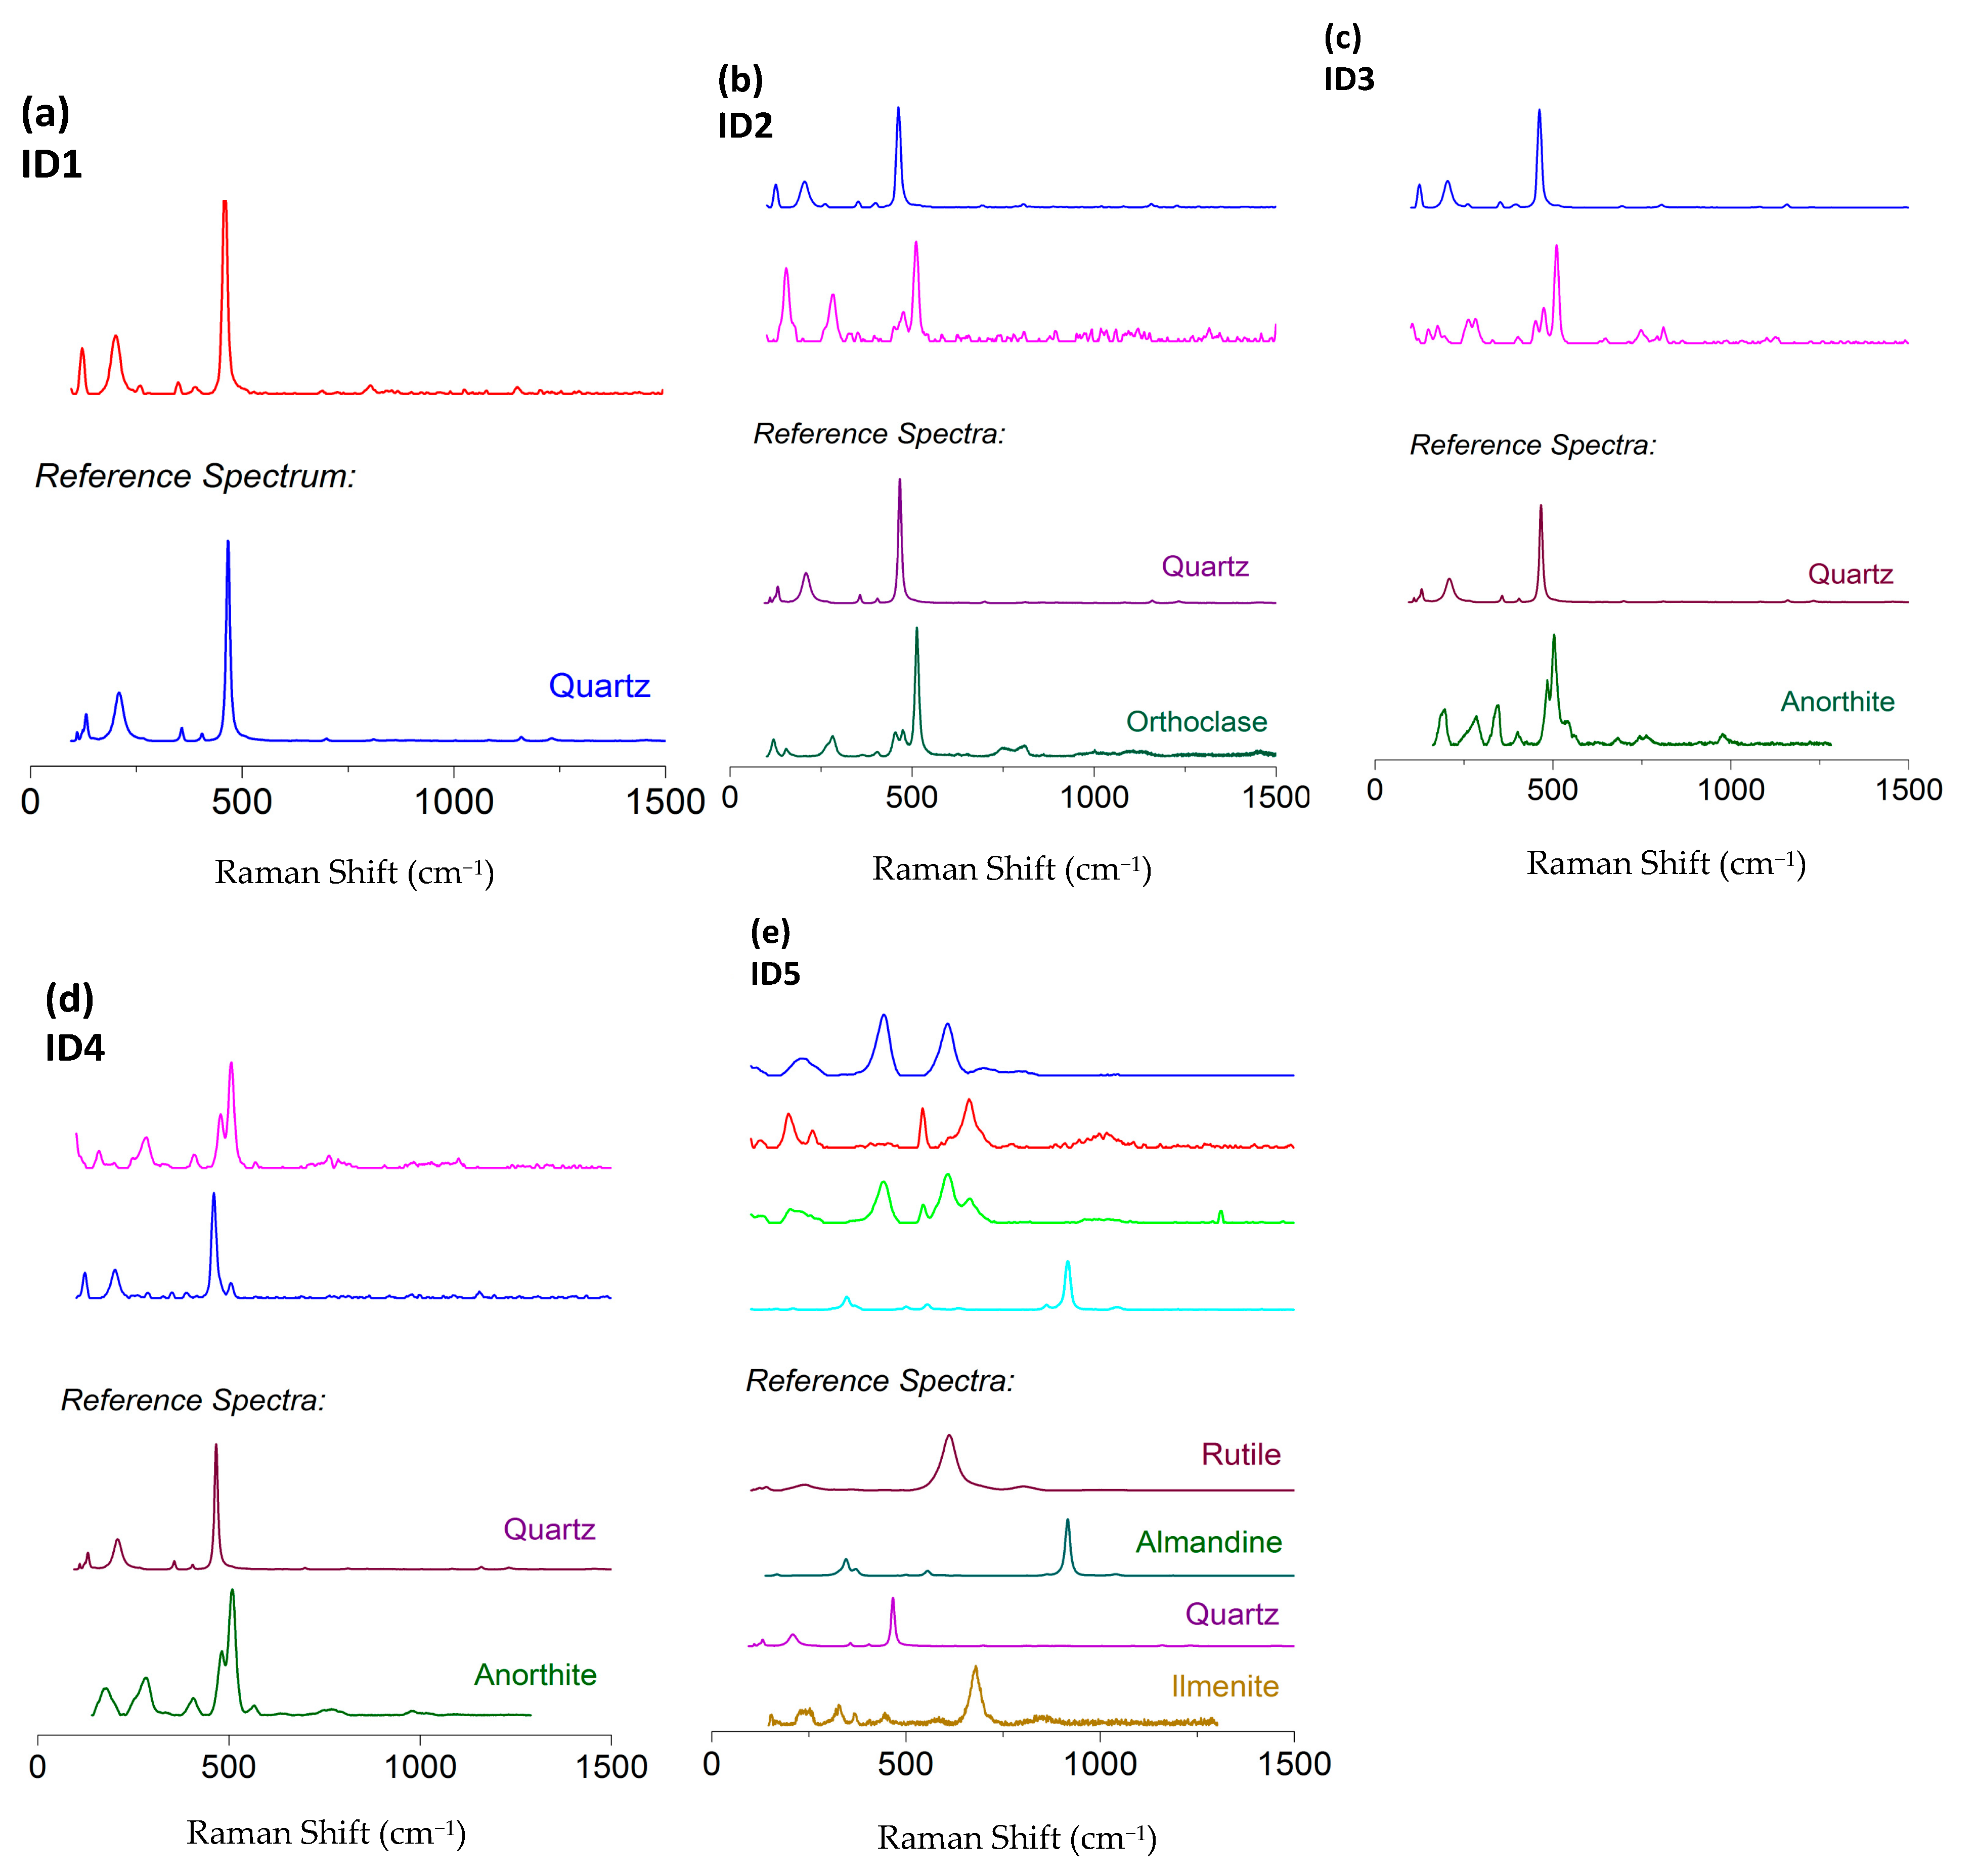
4.6. MRS Analysis
5. Conclusions
Author Contributions
Funding
Institutional Review Board Statement
Informed Consent Statement
Data Availability Statement
Conflicts of Interest
References
- United Nations Scientific Committee on the Effects of Atomic Radiation. Sources and Effects of Ionizing Radiation: Report to the General Assembly, with Scientific Annexes; UN: New York, NY, USA, 2000; Volume I, ISBN 92-1-142238-8. [Google Scholar]
- Caridi, F.; D’Agostino, M.; Belvedere, A.; Marguccio, S.; Belmusto, G. Radon radioactivity in groundwater from the Calabria region, south of Italy. J. Instrum. 2016, 11, P05012. [Google Scholar] [CrossRef]
- Caridi, F.; Di Bella, M.; Sabatino, G.; Belmusto, G.; Fede, M.R.; Romano, D.; Italiano, F.; Mottese, A. Assessment of natural radioactivity and radiological risks in river sediments from calabria (Southern Italy). Appl. Sci. 2021, 11, 1729. [Google Scholar] [CrossRef]
- Rosell, J.R.; Ortega, X.; Dies, X. Natural and artificial radionuclides on the northeast coast of Spain. Health Phys. 1991, 60, 709–712. [Google Scholar] [CrossRef] [PubMed]
- Papadopoulos, A.; Christofides, G.; Koroneos, A.; Stoulos, S. Natural radioactivity distribution and gamma radiation exposure of beach sands from Sithonia Peninsula. Open Geosci. 2014, 6, 229–242. [Google Scholar] [CrossRef]
- Ravisankar, R.; Chandramohan, J.; Chandrasekaran, A.; Prince Prakash Jebakumar, J.; Vijayalakshmi, I.; Vijayagopal, P.; Venkatraman, B. Assessments of radioactivity concentration of natural radionuclides and radiological hazard indices in sediment samples from the East coast of Tamilnadu, India with statistical approach. Mar. Pollut. Bull. 2015, 97, 419–430. [Google Scholar] [CrossRef] [PubMed]
- Günoğlu, K.; Seçkiner, S. Evaluation of dose parameters and radiological hazards in gravel samples of Konyaaltı Beach, Antalya. Arab. J. Geosci. 2018, 11, 457. [Google Scholar] [CrossRef]
- Shahrokhi, A.; Adelikhah, M.; Chalupnik, S.; Kovács, T. Multivariate statistical approach on distribution of natural and anthropogenic radionuclides and associated radiation indices along the north-western coastline of Aegean Sea, Greece. Mar. Pollut. Bull. 2021, 163, 112009. [Google Scholar] [CrossRef]
- Walencik-Łata, A.; Smolka-Danielowska, D. 234U, 238U, 226Ra, 228Ra and 40K concentrations in feed coal and its combustion products during technological processes in the Upper Silesian Industrial Region, Poland. Environ. Pollut. 2020, 267, 115462. [Google Scholar] [CrossRef]
- Sabatino, G.; Di Bella, M.; Caridi, F.; Italiano, F.; Romano, D.; Magazù, S.; Gnisci, A.; Faggio, G.; Messina, G.; Santangelo, S.; et al. Radiological assessment, mineralogy and geochemistry of the heavy-mineral placers from the Calabrian coast (South Italy). J. Instrum. 2019, 14, P05015. [Google Scholar] [CrossRef]
- Omar-Nazir, L.; Shi, X.; Moller, A.; Mousseau, T.; Byun, S.; Hancock, S.; Seymour, C.; Mothersill, C. Long-term effects of ionizing radiation after the Chernobyl accident: Possible contribution of historic dose. Environ. Res. 2018, 165, 55–62. [Google Scholar] [CrossRef]
- Jaafar, L.; Podolsky, R.H.; Dynan, W.S. Long-Term Effects of Ionizing Radiation on Gene Expression in a Zebrafish Model. PLoS ONE 2013, 8, e69445. [Google Scholar] [CrossRef] [PubMed] [Green Version]
- Kamiya, K.; Ozasa, K.; Akiba, S.; Niwa, O.; Kodama, K.; Takamura, N.; Zaharieva, E.K.; Kimura, Y.; Wakeford, R. Long-term effects of radiation exposure on health. Lancet 2015, 386, 469–478. [Google Scholar] [CrossRef]
- Ali, H.; Khan, E.; Ilahi, I. Environmental Chemistry and Ecotoxicology of Hazardous Heavy Metals: Environmental Persistence, Toxicity, and Bioaccumulation. J. Chem. 2019, 2019, 6730305. [Google Scholar] [CrossRef] [Green Version]
- Vertinsky, Alexey Problems of environmental pollution with heavy metals in the Russian Federation. E3S Web Conf. 2021, 244, 1006. [CrossRef]
- Balali-Mood, M.; Naseri, K.; Tahergorabi, Z.; Khazdair, M.R.; Sadeghi, M. Toxic Mechanisms of Five Heavy Metals: Mercury, Lead, Chromium, Cadmium, and Arsenic. Front. Pharmacol. 2021, 12, 227. [Google Scholar] [CrossRef]
- Liang, L.; Gong, P. Urban and air pollution: A multi-city study of long-term effects of urban landscape patterns on air quality trends. Sci. Rep. 2020, 10, 18618. [Google Scholar] [CrossRef]
- Tchounwou, P.B.; Yedjou, C.G.; Patlolla, A.K.; Sutton, D.J. Heavy metal toxicity and the environment. Exp. Suppl. 2012, 101, 133–164. [Google Scholar] [CrossRef] [PubMed] [Green Version]
- Briffa, J.; Sinagra, E.; Blundell, R. Heavy metal pollution in the environment and their toxicological effects on humans. Heliyon 2020, 6, e04691. [Google Scholar] [CrossRef]
- Jaishankar, M.; Tseten, T.; Anbalagan, N.; Mathew, B.B.; Beeregowda, K.N. Toxicity, mechanism and health effects of some heavy metals. Interdiscip. Toxicol. 2014, 7, 60–72. [Google Scholar] [CrossRef] [PubMed] [Green Version]
- Iwuoha, G.N.; Osuji, L.; Horsfall, M.J. Index model analysis approach to heavy metal pollution assessment in sediments of Nworie and Otamiri Rivers in Imo State of Nigeria. Res. J. Chem. Sci. 2012, 2, 606X. [Google Scholar]
- Caridi, F.; D’Agostino, M.; Messina, M.; Marcianò, G.; Grioli, L.; Belvedere, A.; Marguccio, S.; Belmusto, G. Lichens as environmental risk detectors. Eur. Phys. J. Plus 2017, 132. [Google Scholar] [CrossRef]
- Ravisankar, R.; Chandrasekaran, A.; Vijayagopal, P.; Venkatraman, B.; Senthilkumar, G.; Eswaran, P.; Rajalakshmi, A. Natural radioactivity in soil samples of Yelagiri Hills, Tamil Nadu, India and the associated radiation hazards. Radiat. Phys. Chem. 2012, 81, 1789–1795. [Google Scholar] [CrossRef]
- Regione Calabria. Available online: https://www.regione.calabria.it/website/organizzazione/dipartimento10/ (accessed on 15 October 2021).
- Amodio-Morelli, L.; Bonardi, G.; Colonna, V.; Dietrich, D.; Giunta, G.; Ippolito, F. L’Arco Calabro-Peloritano nell’Orogene Appenninico-Maghrebide. Mem. Soc. Geol. It. 1976, 17, 1–60. [Google Scholar]
- Ogniben, L. Schema geologico della Calabria in base ai dati odierni. Geol. Rom. 1973, 12, 243–585. [Google Scholar]
- Gasparini, C.; Iannaccone, G.; Scandone, P.; Scarpa, R. Seismotectonics of the Calabrian arc. Tectonophysics 1982, 84, 267–286. [Google Scholar] [CrossRef]
- Faccenna, C.; Becker, T.W.; Lucente, F.P.; Jolivet, L.; Rossetti, F. History of subduction and back arc extension in the Central Mediterranean. Geophys. J. Int. 2001, 145, 809–820. [Google Scholar] [CrossRef] [Green Version]
- Dietrich, D. Sense of overthrust shear in the Alpine nappes of Calabria (Southern Italy). J. Struct. Geol. 1988, 10, 373–381. [Google Scholar] [CrossRef]
- Schenk, V. U-Pb and Rb-Sr radiometric dates and their correlation with metamorphic events in the granulite-facies basement of the serre, Southern Calabria (Italy). Contrib. Mineral. Petrol. 1980, 73, 23–38. [Google Scholar] [CrossRef]
- Ortolano, G.; Visalli, R.; Fazio, E.; Fiannacca, P.; Godard, G.; Pezzino, A.; Punturo, R.; Sacco, V.; Cirrincione, R. Tectono-metamorphic evolution of the Calabria continental lower crust: The case of the Sila Piccola Massif. Int. J. Earth Sci. 2020, 109, 1295–1319. [Google Scholar] [CrossRef]
- Apollaro, C.; Perri, F.; Le Pera, E.; Fuoco, I.; Critelli, T. Chemical and minero-petrographical changes on granulite rocks affected by weathering processes. Front. Earth Sci. 2019, 13, 247–261. [Google Scholar] [CrossRef]
- Tortorici, G.; Bianca, M.; De Guidi, G.; Monaco, C.; Tortorici, L. Fault activity and marine terracing in the Capo Vaticano area (southern Calabria) during the Middle-Late Quaternary. Quat. Int. 2003, 101, 269–278. [Google Scholar] [CrossRef]
- Calcaterra, D.; Parise, M. Landslide types and their relationships with weathering in a Calabrian basin, southern Italy. Bull. Eng. Geol. Environ. 2005, 64, 193–207. [Google Scholar] [CrossRef]
- Bianca, M.; Catalano, S.; De Guidi, G.; Gueli, A.M.; Monaco, C.; Ristuccia, G.M.; Stella, G.; Tortorici, G.; Tortorici, L.; Troja, S.O. Luminescence chronology of Pleistocene marine terraces of Capo Vaticano peninsula (Calabria, Southern Italy). Quat. Int. 2011, 232, 114–121. [Google Scholar] [CrossRef]
- Fornelli, A.; Piccarreta, G.; Del Moro, A.; Acquafredda, P. Multi-stage Melting in the Lower Crust of the Serre (Southern Italy). J. Petrol. 2002, 43, 2191–2217. [Google Scholar] [CrossRef]
- Ludlum-Measurements. Ion Chamber Survey Meter 9 DP User Manual 2014; Ludlum-Measurements: Sweetwater, TX, USA, 2021. [Google Scholar]
- UNI 10802:2013. Available online: http://store.uni.com/catalogo/uni-10802-2013?josso_back_to=http://store.uni.com/josso-security-check.php&josso_cmd=login_optional&josso_partnerapp_host=store.uni.com (accessed on 15 October 2021).
- Paiva, J.D.S.; Farias, E.E.G.; Franca, E.J. De Assessment of the equilibrium of Th-228 and Ra-228 by gamma-ray spectrometry in mangrove soils. In Proceedings of the INAC 2015: International Nuclear Atlantic Conference Brazilian Nuclear Program State Policy for a Sustainable World, Sao Paulo, Brazil, 4–9 October 2015. [Google Scholar]
- Shahrokhi, A.; Kovacs, T. Radiological survey on radon entry path in an underground mine and implementation of an optimized mitigation system. Environ. Sci. Eur. 2021, 33, 66. [Google Scholar] [CrossRef]
- Caridi, F.; D’Agostino, M.; Belvedere, A.; Marguccio, S.; Belmusto, G.; Gatto, M.F. Diagnostics techniques and dosimetric evaluations for environmental radioactivity investigations. J. Instrum. 2016, 11, 1147. [Google Scholar] [CrossRef]
- Caridi, F.; Acri, G.; Belvedere, A.; Crupi, V.; Agostino, M.D.; Marguccio, S.; Messina, M.; Paladini, G.; Venuti, V.; Majolino, D. Evaluation of the Radiological and Chemical Risk for Public Health from Flour Sample Investigation. Appl. Sci. 2021, 11, 3646. [Google Scholar] [CrossRef]
- ACCREDIA. Available online: https://www.accredia.it/ (accessed on 15 October 2021).
- Caridi, F.; Santangelo, S.; Faggio, G.; Gnisci, A.; Messina, G.; Belmusto, G. Compositional and Mineralogical Analysis of Marine Sediments from Calabrian Selected Areas, Southern Italy. Int. J. Environ. Res. 2019, 13, 571–580. [Google Scholar] [CrossRef]
- Spectro Xepos User Manual. Available online: https://www.spectro.com/landingpages/user-manual-spectro-xepos-xrf (accessed on 15 October 2021).
- Turekian, K.; Wedepohl, K. Distribution of the Elements in Some Major Units of the Earth’s Crust. Bull. Geol. Soc. Am. 1961, 72, 175–192. [Google Scholar] [CrossRef]
- Håkanson, L. An Ecological Risk Index for Aquatic Pollution Control—A Sedimentological Approach. Water Res. 1980, 14, 975–1001. [Google Scholar] [CrossRef]
- Chandrasekaran, A.; Ravisankar, R.; Harikrishnan, N.; Satapathy, K.K.; Prasad, M.V.R.; Kanagasabapathy, K.V. Multivariate statistical analysis of heavy metal concentration in soils of Yelagiri Hills, Tamilnadu, India—Spectroscopical approach. Spectrochim. Acta Part A Mol. Biomol. Spectrosc. 2015, 137, 589–600. [Google Scholar] [CrossRef]
- Ramasamy, V.; Meenakshisundaram, V.; Venkatachalapathy, R.; Ponnusamy, V. Influence of mineralogical and heavy metal composition on natural radionuclide concentrations in the river sediments. Appl. Radiat. Isot. 2011, 69, 1466–1474. [Google Scholar] [CrossRef]
- Malvern Panalytical. Empyrean Diffractometer User Manual. 2013. Available online: https://www.malvernpanalytical.com/en/support/product-support/empyrean-range/empyrean (accessed on 15 October 2021).
- International Centre for Diffraction Data. Available online: https://www.icdd.com/ (accessed on 15 October 2021).
- Available online: https://www.horiba.com/en_en/products/detail/action/show/Product/labram-hr-evolution-1083/ (accessed on 15 October 2021).
- Roviello, V.; De Cesare, M.; D’Onofrio, A.; Gialanella, L.; Guan, Y.J.; Roos, P.; Ruberti, D.; Sabbarese, C.; Terrasi, F. New analytical methods for the assessment of natural (238U, 232Th, 226Ra, 40K) and anthropogenic (137Cs) radionuclides as actinides (239Pu, 240Pu): The case study of the Garigliano NPP releases along the Domitia sandy beaches (Southern Italy). Catena 2020, 193, 104612. [Google Scholar] [CrossRef]
- Khandaker, M.U.; Asaduzzaman, K.; Sulaiman, A.F.B.; Bradley, D.A.; Isinkaye, M.O. Elevated concentrations of naturally occurring radionuclides in heavy mineral-rich beach sands of Langkawi Island, Malaysia. Mar. Pollut. Bull. 2018, 127, 654–663. [Google Scholar] [CrossRef] [PubMed]
- Huang, Y.; Lu, X.; Ding, X.; Feng, T. Natural radioactivity level in beach sand along the coast of Xiamen Island, China. Mar. Pollut. Bull. 2015, 91, 357–361. [Google Scholar] [CrossRef]
- Korkulu, Z.; Özkan, N. Determination of natural radioactivity levels of beach sand samples in the black sea coast of Kocaeli (Turkey). Radiat. Phys. Chem. 2013, 88, 27–31. [Google Scholar] [CrossRef]
- Malanca, A.; Gaidolfi, L.; Pessina, V.; Dallara, G. Distribution of 226Ra, 232Th, and 40K in soils of Rio Grande do Norte (Brazil). J. Environ. Radioact. 1996, 30, 55–67. [Google Scholar] [CrossRef]
- Orgün, Y.; Altinsoy, N.; Sahin, S.Y.; Güngör, Y.; Gültekin, A.H.; Karahan, G.; Karacik, Z. Natural and anthropogenic radionuclides in rocks and beach sands from Ezine region (Canakkale), Western Anatolia, Turkey. Appl. Radiat. Isot. 2007, 65, 739–747. [Google Scholar] [CrossRef] [PubMed]
- Italian Legislation D.Lgs. 101/20. Available online: www.normattiva.it (accessed on 15 October 2021).
- Harmesa; Cordova, M.R. A preliminary study on heavy metal pollutants chrome (Cr), cadmium (Cd), and lead (Pb) in sediments and beach morning glory vegetation (Ipomoea pes-caprae) from Dasun Estuary, Rembang, Indonesia. Mar. Pollut. Bull. 2021, 162, 111819. [Google Scholar] [CrossRef]
- Cabrini, T.M.B.; Barboza, C.A.M.; Skinner, V.B.; Hauser-Davis, R.A.; Rocha, R.C.; Saint’Pierre, T.D.; Valentin, J.L.; Cardoso, R.S. Heavy metal contamination in sandy beach macrofauna communities from the Rio de Janeiro coast, Southeastern Brazil. Environ. Pollut. 2017, 221, 116–129. [Google Scholar] [CrossRef]
- Khaled, A.; Hessein, A.; Abdel-Halim, A.M.; Morsy, F.M. Distribution of heavy metals in seaweeds collected along marsa-matrouh beaches, Egyptian mediterranean sea. Egypt. J. Aquat. Res. 2014, 40, 363–371. [Google Scholar] [CrossRef] [Green Version]
- Vidinha, J.M.; Rocha, F.; Patinha, C.; Silva, E.; Andrade, C. Heavy metals contents on beach and dune sediments from Espinho to Mondego Cape (Portugal)—Influence of human activities. J. Geochemical Explor. 2006, 88, 404–407. [Google Scholar] [CrossRef]
- Hassan, N.M.; Rasmussen, P.E.; Dabek-Zlotorzynska, E.; Celo, V.; Chen, H. Analysis of Environmental Samples Using Microwave-Assisted Acid Digestion and Inductively Coupled Plasma Mass Spectrometry: Maximizing Total Element Recoveries. Water Air Soil Pollut. 2007, 178, 323–334. [Google Scholar] [CrossRef]
- Zheng, L.-G.; Liu, G.-J.; Kang, Y.; Yang, R.-K. Some potential hazardous trace elements contamination and their ecological risk in sediments of western Chaohu Lake, China. Environ. Monit. Assess. 2010, 166, 379–386. [Google Scholar] [CrossRef] [PubMed]
- Naji, A.; Ismail, A. Assessment of Metals Contamination in Klang River Surface Sediments by using Different Indexes. Environ. Asia 2011, 4, 30–38. [Google Scholar] [CrossRef]
- Yuan, H.; Song, J.; Li, X.; Li, N.; Duan, L. Distribution and contamination of heavy metals in surface sediments of the South Yellow Sea. Mar. Pollut. Bull. 2012, 64, 2151–2159. [Google Scholar] [CrossRef] [PubMed]
- Selvaraj, K.; Ram Mohan, V.; Szefer, P. Evaluation of metal contamination in coastal sediments of the Bay of Bengal, India: Geochemical and statistical approaches. Mar. Pollut. Bull. 2004, 49, 174–185. [Google Scholar] [CrossRef] [PubMed]
- Wada, M.; Hori, R.; Kim, U.-J.; Sasaki, S. X-ray diffraction study on the thermal expansion behavior of cellulose Iβ and its high-temperature phase. Polym. Degrad. Stab. 2010, 95, 1330–1334. [Google Scholar] [CrossRef]


| Site ID | Sampling Site | GPS Position | |
|---|---|---|---|
| Latitude | Longitude | ||
| 1 | Soverato | 38°41′16′′ N | 16°33′20′′ E |
| 2 | Montepaone | 38°43′17′′ N | 16°32′17′′ E |
| 3 | Montauro | 38°44′07′′ N | 16°33′07′′ E |
| 4 | Stalettì | 3846′ 08′′ N | 16°34′10′′ E |
| 5 | Squillace | 38°46′40′′ N | 16°34′26′′ E |
| Site ID | 226Ra (Bq kg−1 d.w.) | 232Th (Bq kg−1 d.w.) | 40K (Bq kg−1 d.w.) | 137Cs (Bq kg−1 d.w.) |
|---|---|---|---|---|
| 1 | 8.3 ± 0.8 | 57.9 ± 7.6 | 656 ± 84 | <0.15 |
| 2 | 7.9 ± 0.8 | 26.3 ± 3.5 | 759 ± 98 | <0.11 |
| 3 | 12.3 ± 1.3 | 183 ± 24 | 469 ± 60 | <0.31 |
| 4 | 15.8 ± 1.6 | 277 ± 36 | 505 ± 65 | <0.15 |
| 5 | 60.2 ± 6.4 | 524 ± 73 | 148 ± 20 | <0.30 |
| Site ID | Calculated Absorbed Dose Rate (nGy h−1) | Measured Absorbed Dose Rate (nGy h−1) | AEDE (µSv y−1) |
|---|---|---|---|
| 1 | 66.2 | 96 | 20 |
| 2 | 51.2 | 102 | 15 |
| 3 | 136 | 200 | 41 |
| 4 | 196 | 147 | 59 |
| 5 | 351 | 225 | 106 |
| XRF Analysis | ||||||
|---|---|---|---|---|---|---|
| Site ID | Threshold Limit | |||||
| 1 | 2 | 3 | 4 | 5 | ||
| Sb (µg g−1 d.w.) | <0.5 | <0.5 | <0.5 | <0.5 | <0.5 | 10 |
| As (µg g−1 d.w.) | <0.5 | <0.5 | <0.5 | <0.5 | <0.5 | 20 |
| Cd (µg g−1 d.w.) | <0.3 | <0.2 | <0.3 | <0.3 | <0.7 | 2 |
| Co (µg g−1 d.w.) | 3.0 ± 0.1 | <3.0 | <3.0 | <2.1 | 18.8 ± 5.4 | 20 |
| Hg (µg g−1 d.w.) | <0.7 | <0.7 | <0.7 | <0.7 | <0.7 | 1 |
| Ni (µg g−1 d.w.) | 3.4 ± 0.8 | 3.4 ± 0.7 | 3.4 ± 0.7 | 5.7 ± 0.8 | <0.5 | 120 |
| Pb (µg g−1 d.w.) | 13.6 ± 0.4 | 12.8 ± 0.4 | 10.7 ± 0.4 | 11.4 ± 0.4 | 12.5 ± 1.1 | 100 |
| Cu (µg g−1 d.w.) | 1.8 ± 0.6 | <0.7 | 2.1 ± 0.6 | 1.2 ± 0.6 | 4.9 ± 1.8 | 120 |
| Tl (µg g−1 d.w.) | <0.7 | <0.7 | <0.7 | 0.8 ± 0.3 | <0.7 | 1 |
| V (µg g−1 d.w.) | 11.9 ± 1.3 | 3.6 ± 0.5 | 11.9 ± 1.1 | 5.2 ± 0.4 | <1.0 | 90 |
| Zn (µg g−1 d.w.) | 15.4 ± 0.5 | 14.3 ± 0.5 | 15.0 ± 0.5 | 15.7 ± 0.5 | 73.0 ± 2.0 | 150 |
| Site ID | Metal | Index of Contamination | |||
|---|---|---|---|---|---|
| EF | Igeo | CF | PLI | ||
| 1 | Co | 0.76 | −3.25 | 0.16 | 0.05 |
| Ni | 0.24 | −4.91 | 0.05 | ||
| Pb | 3.26 | −1.14 | 0.68 | ||
| Cu | 0.19 | −5.23 | 0.04 | ||
| Tl | - | - | - | ||
| V | 0.44 | −4.03 | 0.09 | ||
| Zn | 0.78 | −3.21 | 0.16 | ||
| 2 | Co | - | - | - | 0.08 |
| Ni | 0.37 | −4.91 | 0.05 | ||
| Pb | 4.77 | −1.23 | 0.64 | ||
| Cu | - | - | - | ||
| Tl | - | - | - | ||
| V | 0.21 | −5.76 | 0.03 | ||
| Zn | 1.12 | −3.32 | 0.15 | ||
| 3 | Co | - | - | - | 0.07 |
| Ni | 0.22 | −4.91 | 0.05 | ||
| Pb | 2.39 | −1.49 | 0.54 | ||
| Cu | 0.21 | −5.01 | 0.05 | ||
| Tl | - | - | - | ||
| V | 0.41 | −4.03 | 0.09 | ||
| Zn | 0.71 | −3.25 | 0.16 | ||
| 4 | Co | - | - | - | 0.06 |
| Ni | 0.38 | −4.16 | 0.08 | ||
| Pb | 2.60 | −1.40 | 0.57 | ||
| Cu | 0.12 | −5.81 | 0.03 | ||
| Tl | 4.24 | −0.69 | 0.93 | ||
| V | 0.18 | −5.23 | 0.04 | ||
| Zn | 0.75 | −3.18 | 0.17 | ||
| 5 | Co | 0.49 | −0.45 | 1.09 | 0.58 |
| Ni | - | - | - | ||
| Pb | 0.28 | −1.26 | 0.63 | ||
| Cu | 0.05 | −3.78 | 0.11 | ||
| Tl | - | - | - | ||
| V | - | - | - | ||
| Zn | 0.34 | −0.96 | 0.77 | ||
Publisher’s Note: MDPI stays neutral with regard to jurisdictional claims in published maps and institutional affiliations. |
© 2021 by the authors. Licensee MDPI, Basel, Switzerland. This article is an open access article distributed under the terms and conditions of the Creative Commons Attribution (CC BY) license (https://creativecommons.org/licenses/by/4.0/).
Share and Cite
Caridi, F.; Paladini, G.; Venuti, V.; Crupi, V.; Procopio, S.; Belvedere, A.; D’Agostino, M.; Faggio, G.; Grillo, R.; Marguccio, S.; et al. Radioactivity, Metals Pollution and Mineralogy Assessment of a Beach Stretch from the Ionian Coast of Calabria (Southern Italy). Int. J. Environ. Res. Public Health 2021, 18, 12147. https://doi.org/10.3390/ijerph182212147
Caridi F, Paladini G, Venuti V, Crupi V, Procopio S, Belvedere A, D’Agostino M, Faggio G, Grillo R, Marguccio S, et al. Radioactivity, Metals Pollution and Mineralogy Assessment of a Beach Stretch from the Ionian Coast of Calabria (Southern Italy). International Journal of Environmental Research and Public Health. 2021; 18(22):12147. https://doi.org/10.3390/ijerph182212147
Chicago/Turabian StyleCaridi, Francesco, Giuseppe Paladini, Valentina Venuti, Vincenza Crupi, Salvatore Procopio, Alberto Belvedere, Maurizio D’Agostino, Giuliana Faggio, Rossella Grillo, Santina Marguccio, and et al. 2021. "Radioactivity, Metals Pollution and Mineralogy Assessment of a Beach Stretch from the Ionian Coast of Calabria (Southern Italy)" International Journal of Environmental Research and Public Health 18, no. 22: 12147. https://doi.org/10.3390/ijerph182212147
APA StyleCaridi, F., Paladini, G., Venuti, V., Crupi, V., Procopio, S., Belvedere, A., D’Agostino, M., Faggio, G., Grillo, R., Marguccio, S., Messina, G., & Majolino, D. (2021). Radioactivity, Metals Pollution and Mineralogy Assessment of a Beach Stretch from the Ionian Coast of Calabria (Southern Italy). International Journal of Environmental Research and Public Health, 18(22), 12147. https://doi.org/10.3390/ijerph182212147