
Evaluation Method for Urban Public Service Carrying Capacity (UPSCC): A Qualitative–Quantitative Bi-Dimensional Perspective


Abstract
:1. Introduction
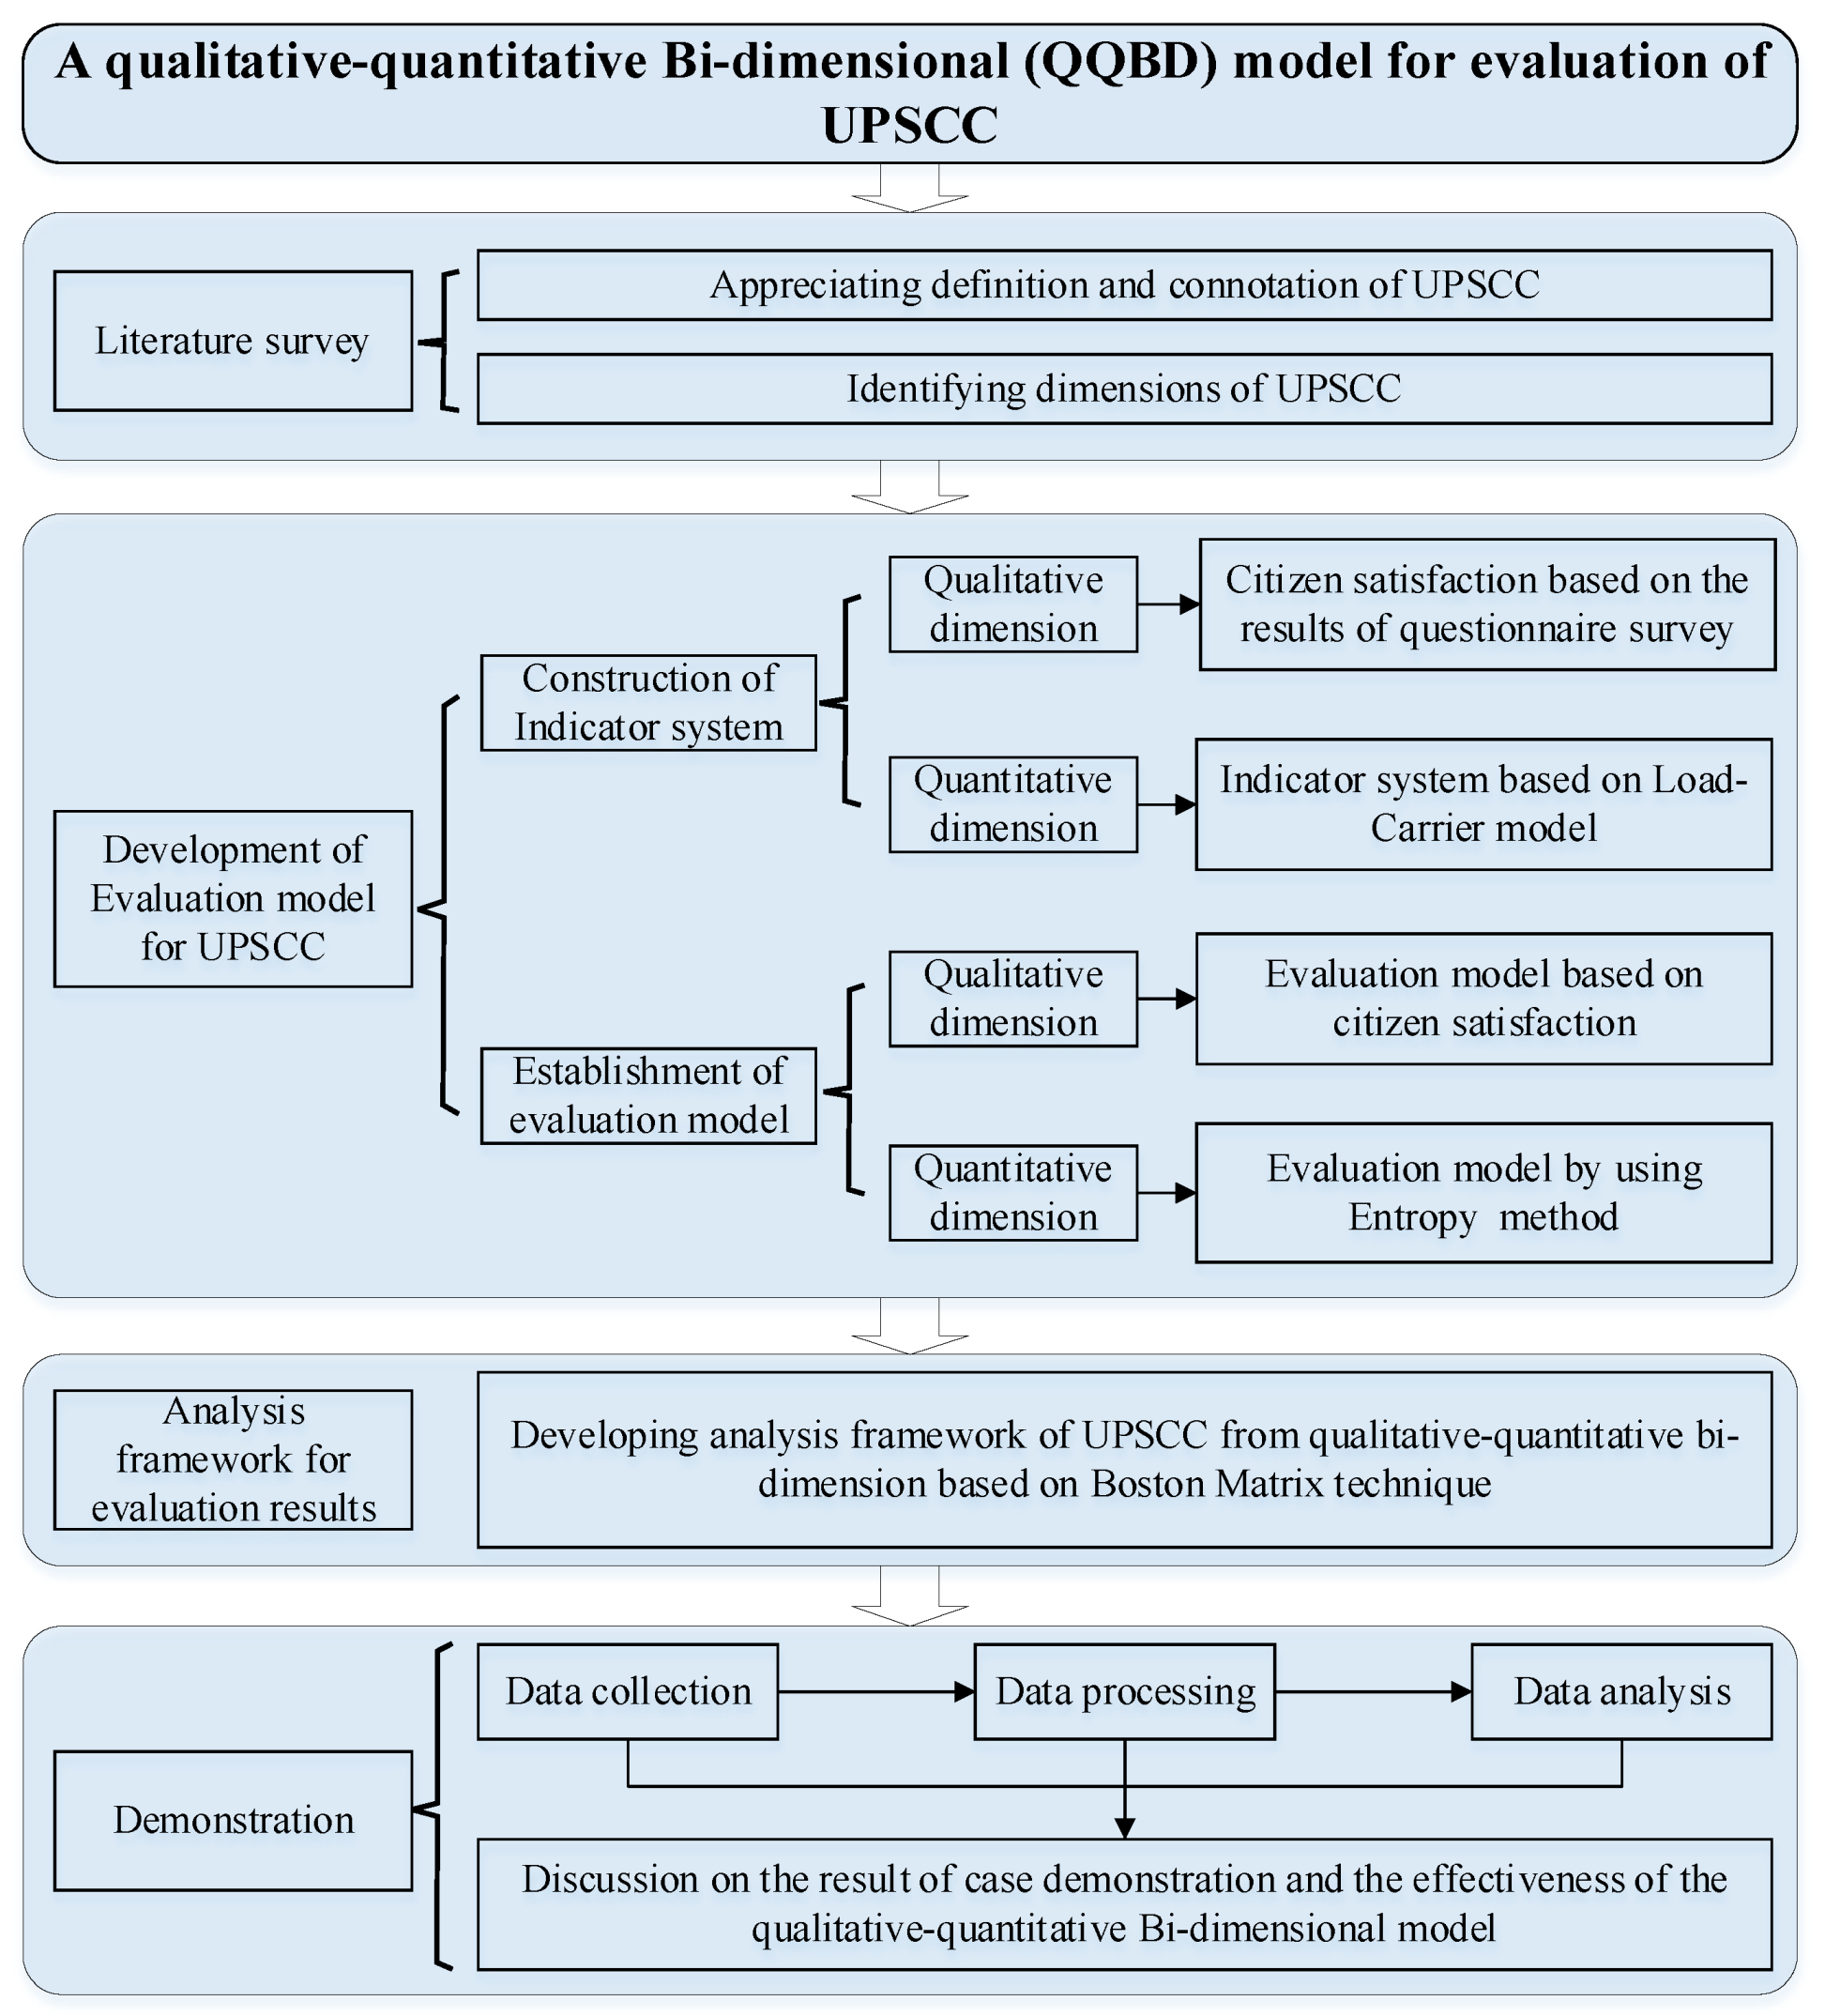
2. Methodology
3. Development of Qualitative–Quantitative Bi-Dimensional (QQBD) Indicators for Measuring UPSCC
3.1. Definition and Connotation of UPSCC
3.2. Dimensions of UPSCC
3.3. Indicators for Measuring Qualitative Carrying Capacity of Urban Public Services
3.4. Indicators for Measuring Quantitative Carrying Capacity of Urban Public Services
3.4.1. Carrier-Load Principle for Selecting UPSCC Quantitative Indicators
3.4.2. Selection of UPSCC Carrier-Load Indicators
3.4.3. Calculation of UPSCC Quantitative Indicators Based on Carrier-Load Principle
4. Development of Qualitative–Quantitative Bi-Dimensional (QQBD) Evaluation Model for UPSCC
4.1. Establishment of Weighting Values between Indicators
4.1.1. Weighting Method for Quantitative Indicators
- a.
- Standardization of indicators
- b.
- Calculate the entropy value of each indicator
4.1.2. Weighting Method for Qualitative Indicators
4.2. Linear Weighted Sum Method for Calculating Values of UPSCC Performance
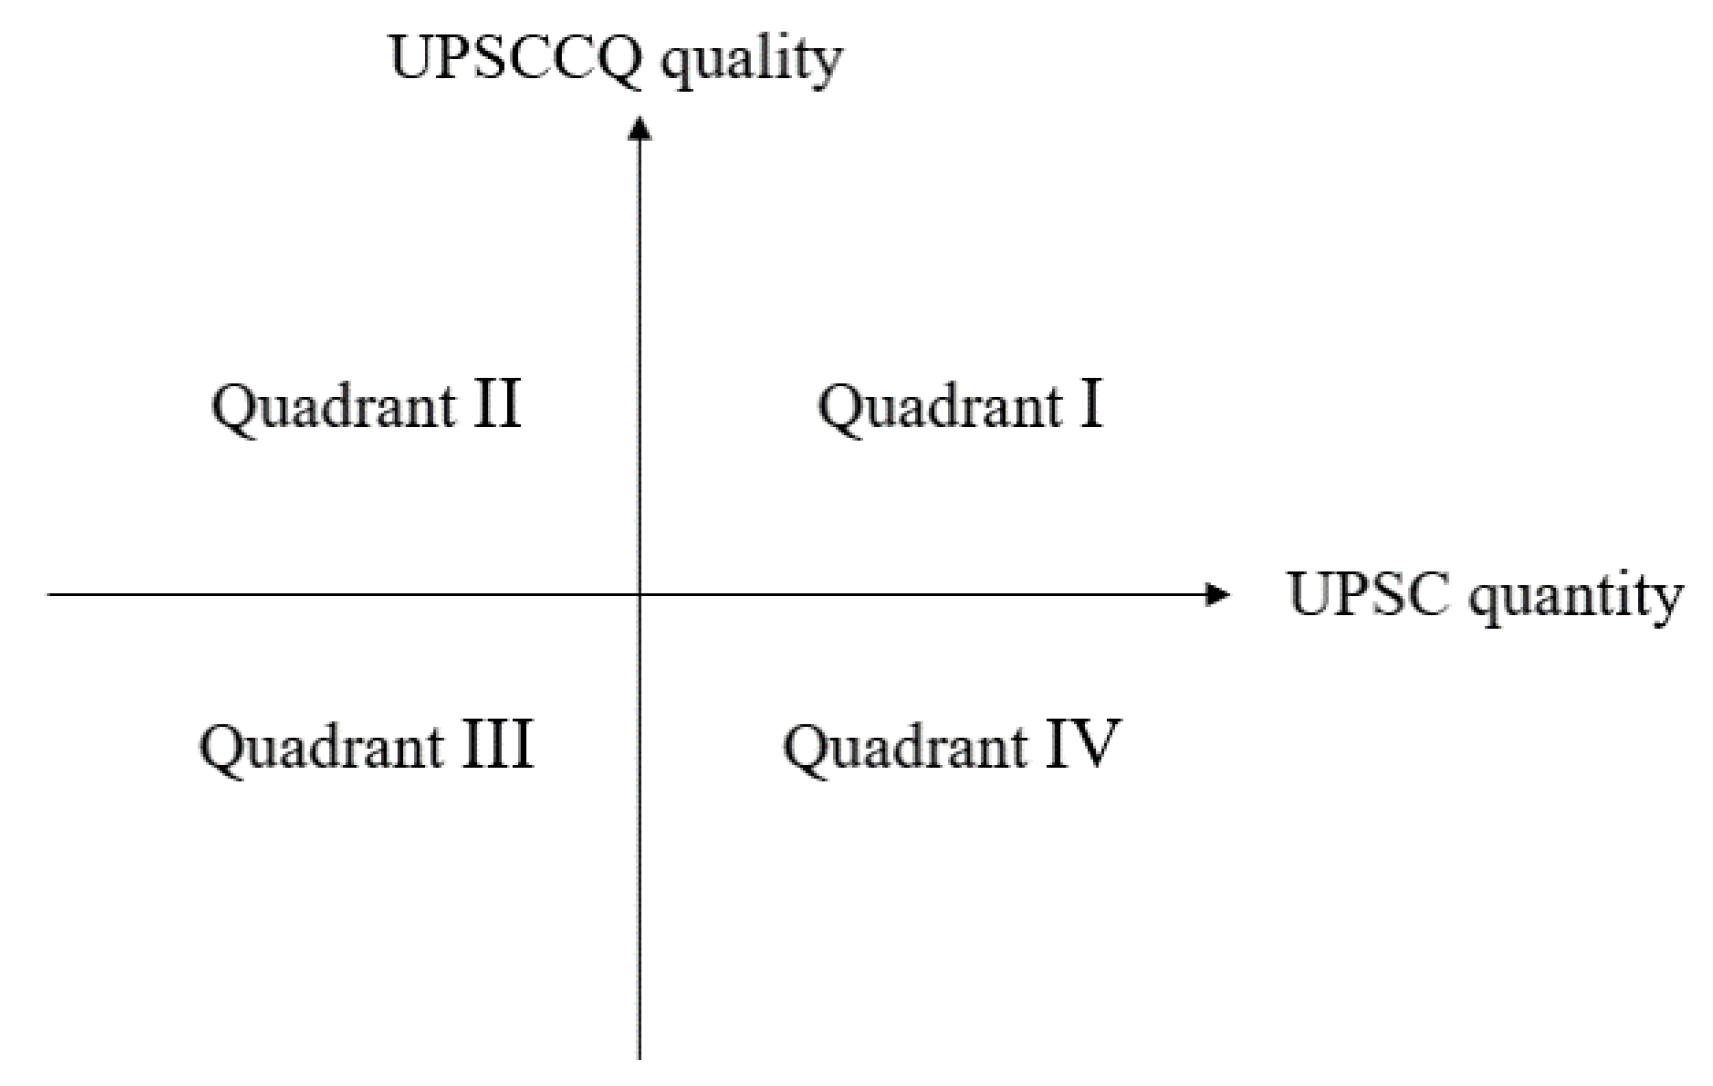
4.3. Boston Matrix Method for Analyzing QQBD-UPSCC Performance
5. Case Demonstration
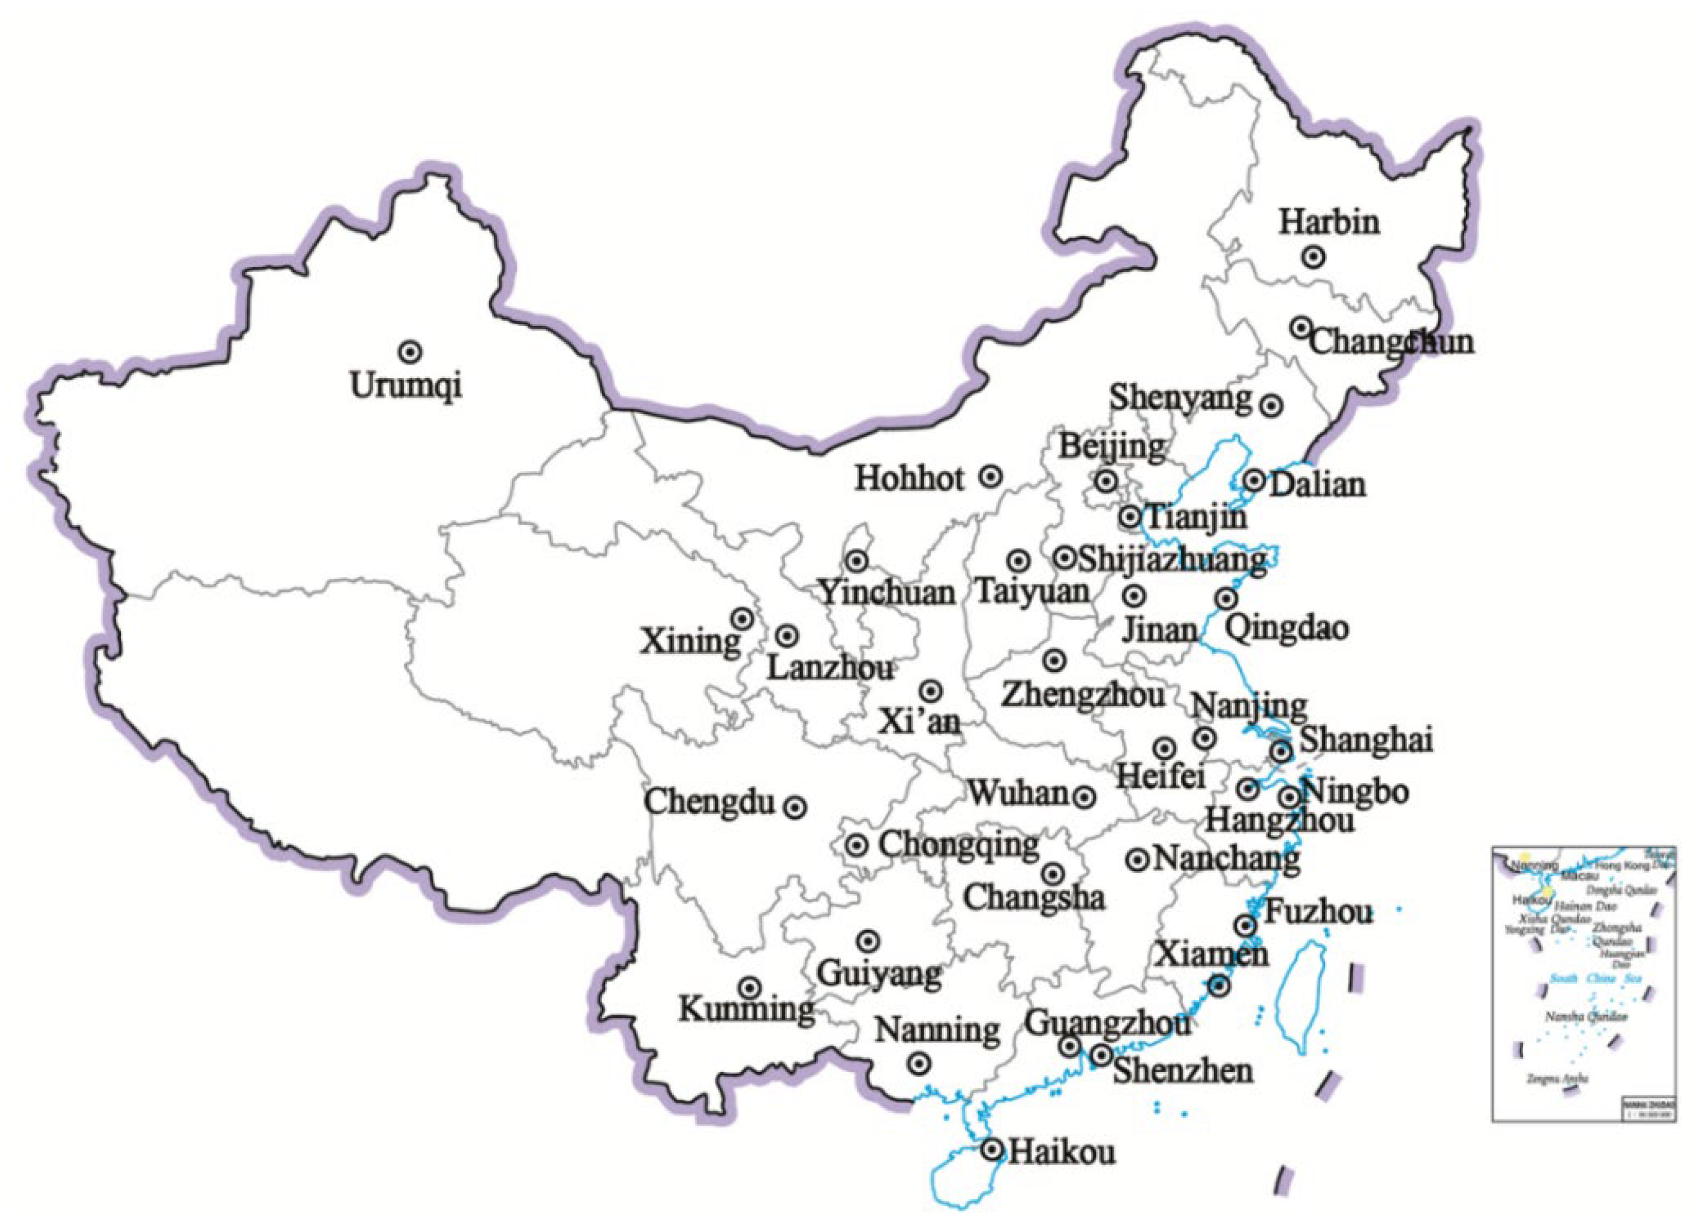
5.1. Sample Cities
5.2. Calculation Results
5.2.1. Qualitative Carrying Capacity of Urban Public Services
5.2.2. Quantitative Carrying Capacity of Urban Public Services
5.2.3. Qualitative–Quantitative Bi-Dimensional (QQBD) Carrying Capacity of Urban Public Services
6. Discussion
6.1. Effectiveness of QQBD UPSCC Evaluation Method
6.2. Interesting Findings from Case Demonstration
7. Conclusions
Author Contributions
Funding
Institutional Review Board Statement
Informed Consent Statement
Data Availability Statement
Conflicts of Interest
Appendix A

| City | Code | GDP | Proportion of Tertiary Industry | Population | City | Code | GDP | Proportion of Tertiary Industry | Population |
|---|---|---|---|---|---|---|---|---|---|
| Beijing | C1 | 35,371.3 | 83.52 | 2154 | Qingdao | C19 | 11,741.3 | 60.89 | 950 |
| Tianjin | C2 | 14,104.3 | 63.46 | 1562 | Zhengzhou | C20 | 11,586.42 | 58.95 | 1035 |
| Shijiazhuang | C3 | 5809.9 | 60.74 | 1039.42 | Wuhan | C21 | 16,223.2 | 60.75 | 1121.2 |
| Taiyuan | C4 | 4029 | 61.24 | 446.1875 | Changsha | C22 | 11,574.22 | 58.54 | 839.45 |
| Hohhot | C5 | 2791.5 | 66.41 | 313.7 | Guangzhou | C23 | 23,628.6 | 71.62 | 1530.6 |
| Shenyang | C6 | 6470.3 | 61.94 | 832.2 | Shenzhen | C24 | 26,927.1 | 60.93 | 1343.9 |
| Dalian | C7 | 7001.7 | 53.46 | 598.7 | Nanning | C25 | 4507 | 65.55 | 734.48 |
| Changchun | C8 | 5904.1 | 51.84 | 753.8 | Haikou | C26 | 1672 | 79.23 | 232.79 |
| Harbin | C9 | 5249.43 | 67.68 | 1076.3 | Chongqing | C27 | 23,606 | 53.2 | 3124 |
| Shanghai | C10 | 38,155.3 | 72.73 | 2428 | Chengdu | C28 | 17,013 | 65.57 | 1658.1 |
| Nanjing | C11 | 14,031 | 62.02 | 850 | Guiyang | C29 | 4040 | 58.98 | 497.14 |
| Hangzhou | C12 | 15,373 | 66.17 | 1036 | Kunming | C30 | 6476 | 63.73 | 695 |
| Ningbo | C13 | 11,985 | 49.06 | 854.2 | Xi’an | C31 | 9321.2 | 63.03 | 1020.4 |
| Hefei | C14 | 9409.4 | 60.6 | 818.9 | Lanzhou | C32 | 2837.4 | 64.87 | 379.09 |
| Fuzhou | C15 | 9392 | 53.61 | 780 | Xining | C33 | 1328 | 66.09 | 238.71 |
| Xiamen | C16 | 5995 | 57.96 | 429 | Yinchuan | C34 | 1896.788 | 52.89 | 229.31 |
| Nanchang | C17 | 5596 | 48.78 | 560.06 | Urumqi | C35 | 3413.259 | 72.65 | 355.2 |
| Jinan | C18 | 9443.4 | 61.79 | 890.9 |
References
- Ai, J.; Sun, X.; Feng, L.; Li, Y.; Zhu, X. Analyzing the spatial patterns and drivers of ecosystem services in rapidly urbanizing Taihu Lake Basin of China. Front. Earth Sci. 2015, 9, 531–545. [Google Scholar] [CrossRef]
- Yu, W.; Li, M.; Ge, Y.; Li, L.; Zhang, L. Transformation of potential medical demand in China: A system dynamics simulation model. J. Biomed. Inform. 2015, 57, 399–414. [Google Scholar] [CrossRef] [Green Version]
- Spyratos, S.; Stathakis, D. Evaluating the services and facilities of European cities using crowdsourced place data. Environ. Plan. B Urban Anal. City Sci. 2017, 4, 18. [Google Scholar] [CrossRef]
- Weng, H.; Kou, J.; Shao, Q. Evaluation of urban comprehensive carrying capacity in the Guangdong–Hong Kong–Macao Greater Bay Area based on regional collaboration. Environ. Sci. Pollut. Res. 2020, 27, 20025–20036. [Google Scholar] [CrossRef]
- Cen, Y.; Zhang, L.; Bao, H.; Lv, K. Local public goods on migration: The experience of the Tiebout model from China. Int. J. Serv. Econ. Manag. 2014, 6, 357. [Google Scholar]
- Lu, J.; Li, B.; Li, H. The influence of land finance and public service supply on peri-urbanization: Evidence from the counties in China. Habitat Int. 2019, 92, 102039. [Google Scholar] [CrossRef]
- Department of Economic and Social Affairs, United Nations. World Urbanization Prospects: The 2018 Revision. 2018. Available online: https://www.un.org/development/desa/pd/content/world-urbanization-prospects-2018-revision (accessed on 20 May 2021).
- Węziak-Białowolska, D. Quality of life in cities—Empirical evidence in comparative European perspective. Cities 2016, 58, 87–96. [Google Scholar] [CrossRef]
- Jia, H. Green Travel Behavior in Urban China: Influencing Factors and their Effects. Sustain. Dev. 2018, 26, 350–364. [Google Scholar] [CrossRef]
- Smith, P.; House, J.I.; Bustamante, M.; Sobocká, J.; Harper, R.; Pan, G.; West, P.C.; Clark, J.M.; Adhya, T.; Rumpel, C.; et al. Global change pressures on soils from land use and management. Glob. Chang. Biol. 2016, 22, 1008–1028. [Google Scholar] [CrossRef]
- Asfour, O.S. Towards an effective strategy to cope with housing land scarcity in the Gaza Strip as a sustainable development priority. Habitat Int. 2012, 36, 295–303. [Google Scholar] [CrossRef]
- Wei, F.C.; Hu, H.S. Equalization of Basic Public Services in China: Evaluation Indicators and Empirical Research. J. Zhongnan Univ. Econ. Law 2015, 5, 26–36. (In Chinese) [Google Scholar]
- Osborne, S.P.; Radnor, Z.; Kinder, T.; Vidal, I. The SERVICE Framework: A Public-service-dominant Approach to Sustainable Public Services. Br. J. Manag. 2015, 26, 424–438. [Google Scholar] [CrossRef] [Green Version]
- Ye, W.; Xu, X.; Wang, H.; Wang, H.; Yang, H.; Yang, Z. Quantitative assessment of resources and environmental carrying capacity in the northwest temperate continental climate ecotope of China. Environ. Earth Sci. 2016, 75, 868. [Google Scholar] [CrossRef]
- Liu, S.; Zhang, Y. Cities without slums? China’s land regime and dual-track urbanization. Cities 2020, 101, 102652. [Google Scholar] [CrossRef]
- Bhattacharya, S.; Saha, S.; Banerjee, S. Income inequality and the quality of public services: A developing country perspective. J. Dev. Econ. 2016, 123, 1–17. [Google Scholar] [CrossRef]
- Zhong, J.; Liu, Z.; Chen, Y. Public Service Blue Book: Evaluation of Basic Public Service Capability of Chinese Cities; Social Sciences Academic Press: Beijing, China, 2019. [Google Scholar]
- Yang, S.J.; Gu, G.H. Differential evaluation of the carrying capacity of urban public service facilities based on the principal component cluster analysis method. Pract. Underst. Math. 2019, 49, 261–273. (In Chinese) [Google Scholar]
- Yang, G. Performance evaluation of inter-provincial equalization of basic public service supply. Financ. Stud. 2015, 1, 111–116. (In Chinese) [Google Scholar]
- Billie, G.P.D.; Robert, J.D.P.D. Socioeconomic status differences in recreational physical activity levels and real and perceived access to a supportive physical environment. Prev. Med. 2002, 35, 601–611. [Google Scholar]
- Yin, C.; He, Q.; Liu, Y.; Chen, W.; Gao, Y. Inequality of public health and its role in spatial accessibility to medical facilities in China. Pergamon 2018, 92, 13. [Google Scholar] [CrossRef]
- Wang, Y.; Wei, C.; Wang, Y.; Li, L. Empirical Study on Evaluation of Carrying Capacity of Urban Public Service in Four Chinese Mega Cities (2005–2015). J. Shanghai Adm. Inst. 2018, 19, 18–26. [Google Scholar]
- Wang, Y.; Wei, C.R.; Dai, S.S. An evaluation index system of the carrying capacity of urban public services and its empirical study: A case study of ten urban areas in Shanghai. J. Shanghai Jiaotong Univ. 2018, 120, 7–17. (In Chinese) [Google Scholar]
- Khan, M.M. Development of Private Healthcare Facilities in Dhaka City: Impacts on Cost, Access, and Quality; Seminar Paper; Center for Development Research of Bangladesh: Banani, Bangladesh, 1996. [Google Scholar]
- Andaleeb, S.S. Service quality perceptions and patient satisfaction: A study of hospitals in a developing country. Soc. Sci. Med. 2001, 52, 1359–1370. [Google Scholar] [CrossRef]
- Yin, F.; Liu, M. Analysis of Policy Focus Points for Promoting Urbanization in Beijing-Tianjin-Hebei Region-Based on the Comparison of Infrastructure Carrying Capacity and Public Service Carrying Capacity. Urban Dev. Res. 2017, 195, 140–143. (In Chinese) [Google Scholar]
- Feng, Z.; Sun, T.; Yang, Y.; Yan, H. The Progress of Resources and Environment Carrying Capacity: From Single-factor Carrying Capacity Research to Comprehensive Research. J. Resour. Ecol. 2018, 9, 125–134. [Google Scholar]
- Liu, R.Z.; Borthwick, A.G.L. Measurement and assessment of carrying capacity of the environment in Ningbo, China. J. Environ. Manag. 2011, 92, 2047–2053. [Google Scholar] [CrossRef]
- Malthus, T. An Essay on the Principle of Population, as It Affects the Future Improvement of Society, with Remarks on the Speculations of Mr. Godwin, M. Condorcet, and Other Writers; J. Johnson: London, UK, 1798. [Google Scholar]
- Onishi, T. A Capacity Approach for Sustainable Urban Development: An Empirical Study. Reg. Stud. 1994, 28, 39–51. [Google Scholar] [CrossRef]
- Hou, K.; Zhou, J.; Li, X.; Ge, S. Study on GIS Visualization in Evaluation of the Human Living Environment in Shenyang-Dalian Urban Agglomeration. Scientifica 2016, 2016, 1–10. [Google Scholar] [CrossRef] [PubMed] [Green Version]
- Wei, Y.; Huang, C.; Patrick, L.; Yong, S.; Feng, Y. Using Urban-Carrying Capacity as a Benchmark for Sustainable Urban Development: An Empirical Study of Beijing. Sustainability 2015, 7, 3244–3268. [Google Scholar] [CrossRef] [Green Version]
- Wang, Y. Definition and Improvement of Carrying Capacity of Urban Public Services. J. Sjtu 2016, 24, 15–22. [Google Scholar]
- Godschalk, D.R.; Parker, F.H. Carrying capacity: A key to environmental planning? J. Soil Water Conserv. 1975, 30, 160–165. [Google Scholar]
- Schneider, D.M.; Godschalk, D.R.; Axler, N. The Carrying Capacity Concept as a Planning Tool; American Planning Association: Chicago, IL, USA, 1978. [Google Scholar]
- Oh, K.; Jeong, Y.; Lee, D.; Lee, W. An Integrated Framework for the Assessment of Urban Carrying Capacity. J. Korea Plan. Assoc. 2002, 37, 7–26. [Google Scholar]
- Oh, K.; Jeong, Y.; Lee, D.; Lee, W.; Choi, J. Determining development density using the Urban Carrying Capacity Assessment System. Landsc. Urban Plan. 2004, 73, 1–15. [Google Scholar] [CrossRef]
- Yang, W. The Carrying Capacity of Compulsory Education and Its Countermeasures in China City. Mod. Educ. Manag. 2016, 4, 25–29. [Google Scholar]
- Chelleri, L. From the «Resilient City» to Urban Resilience. A review essay on understanding and integrating the resilience perspective for urban systems. Doc. Danàlisi Geogràfica 2012, 58, 287–306. [Google Scholar] [CrossRef]
- Finka, M.; Kluvánková, T. Managing complexity of urban systems: A polycentric approach. Land Use Policy 2015, 42, 602–608. [Google Scholar] [CrossRef]
- Shen, L.; Shu, T.; Liao, X.; Yang, N.; Ren, Y.; Zhu, M.; Cheng, G.; Wang, J. A new method to evaluate urban resources environment carrying capacity from the load-and-carrier perspective. Resour. Conserv. Recycl. 2020, 154, 104616. [Google Scholar] [CrossRef]
- Delinom, R.M.; Assegaf, A.; Abidin, H.Z.; Taniguchi, M.; Suherman, D.; Lubis, R.F.; Yulianto, E. The contribution of human activities to subsurface environment degradation in Greater Jakarta Area, Indonesia. Sci. Total Environ. 2009, 407, 3129–3141. [Google Scholar] [CrossRef]
- Nugroho, S.S. After Jokowi’s First Term–Moving the Nation’s “Keraton”: A Javanese Perspective; RSIS Commentaries, No. 174; Nanyang Technological University: Singapore, 2019. [Google Scholar]
- OECD. COFOG: Classifcation of the Functions of Government. Government at a Glance, 194–195. 2011. Available online: https://www.oecd.org/gov/48250728.pdf (accessed on 5 May 2021).
- Afonso, A.; Fernandes, S. Assessing and explaining the relative efficiency of local government. J. Socio-Econ. 2008, 37, 1946–1979. [Google Scholar] [CrossRef]
- Andrews, R.; Brewer, G.A. Social capital, management capacity and public service performance: Evidence from the US states. Public Manag. Rev. 2013, 15, 19–42. [Google Scholar] [CrossRef]
- Andrews, R.; Entwistle, T. Does cross-sectoral partnership deliver? An empirical exploration of public service effectiveness, efficiency, and equity. J. Public Adm. Res. Theory 2010, 20, 679–701. [Google Scholar] [CrossRef]
- Šťastná, L.; Gregor, M. Local Government Efficiency: Evidence from the Czech Municipalities; Working Papers IES; Charles University: Prague, Czechia, 2012. [Google Scholar]
- Sun, C.; Chen, L.; Tian, Y. Study on the urban state carrying capacity for unbalanced sustainable development regions: Evidence from the yangtze river economic belt. Ecol. Indic. 2018, 89, 9. [Google Scholar] [CrossRef]
- Domingues, A.R.; Pires, S.M.; Caeiro, S.; Ramos, T.B. Defining criteria and indicators for a sustainability label of local public services. Ecol. Indic. 2015, 57, 452–464. [Google Scholar] [CrossRef]
- Diao, S.; Yuan, J.; Wu, Y. Performance evaluation of urban comprehensive carrying capacity of Harbin, Heilongjiang Province in China. Chin. Geogr. Sci. 2019, 29, 579–590. [Google Scholar] [CrossRef] [Green Version]
- An, T.F.; Ren, Q. Construction of an index system for the level of equalization of public services in China—A quantitative analysis based on the perspective of regional differences. Financ. Trade Econ. 2008, 6, 79–82. (In Chinese) [Google Scholar]
- Wang, X.M.; Nan, R. Construction and Application of Evaluation System of Equalization Level of Basic Public Services—An Empirical Study Based on 31 Provinces in China. Soft Sci. 2011, 25, 21–26. (In Chinese) [Google Scholar]
- Ma, H.; Zeng, X.X. Construction of an Evaluation Index System for Equalization of Basic Public Services in China—An Empirical Study Based on Representative Provinces in the East, Middle and West. Jianghan Forum 2011, 11, 23–25. (In Chinese) [Google Scholar]
- Wei, Y.; Huang, C.; Lam, P.T.I.; Yuan, Z. Sustainable urban development: A review on urban carrying capacity assessment. Habitat Int. 2015, 46, 64–71. [Google Scholar] [CrossRef]
- Li, J. Research on basic public service evaluation index system. Bus. Res. 2011, 409, 48–56. (In Chinese) [Google Scholar]
- Zhang, X. Theoretic Basis for Public Service Supply: Systematic Distinction and Framework Construction. J. Sichuan Univ. 2015, 4, 135–140. [Google Scholar]
- Xu, H.; Bechle, M.J.; Wang, M.; Szpiro, A.A.; Vedal, S.; Bai, Y.; Marshall, J.D. National PM2.5 and NO2 exposure models for China based on land use regression, satellite measurements, and universal kriging. Sci. Total Environ. 2019, 655, 423–433. [Google Scholar] [CrossRef] [Green Version]
- Yin, F.; Liu, M. The Policy Focus Analysis of Beijing-Tianjin-Hebei region urbanization: The Comparison Between the Bearing Capacity of the Infrastructure and the Carrying Capacity of the Public Service. Urban Dev. Stud. 2017, 24, 10–13. [Google Scholar]
- Yang, N.; Shen, L.; Shu, T.; Liao, S.; Peng, Y.; Wang, J. An integrative method for analyzing spatial accessibility in the hierarchical diagnosis and treatment system in China. Soc. Sci. Med. 2021, 270, 113656. [Google Scholar] [CrossRef]
- Zhang, X.J. Research on the Equalization of Basic Public Services in the Process of Rapid Urbanization. Ph.D. Thesis, Fudan University, Shanghai, China, 2011. (In Chinese). [Google Scholar]
- Liao, X.; Ren, Y.; Shen, L.; Shu, T.; He, H.; Wang, J. A “carrier-load” perspective method for investigating regional water resource carrying capacity. J. Clean. Prod. 2020, 269, 122043. [Google Scholar] [CrossRef]
- Zimbelman, J.L.; Juraschek, S.P.; Zhang, X.; Lin, V.W.H. Physical Therapy Workforce in the United States: Forecasting Nationwide Shortages. Hum. Resour. Health 2020, 2, 1021–1029. [Google Scholar] [CrossRef]
- Shen, L.; Du, X.; Cheng, G.; Wei, X. Capability maturity model (cmm) method for assessing the performance of low-carbon city practice. Environ. Impact Assess. Rev. 2021, 87, 106549. [Google Scholar] [CrossRef]
- Wang, J.; Ren, Y.; Shen, L.; Liu, Z.; Wu, Y.; Shi, F. A novel evaluation method for urban infrastructures carrying capacity. Cities 2020, 105, 102846. [Google Scholar] [CrossRef]
- Fang, C.; Yu, D. Urban agglomeration: An evolving concept of an emerging phenomenon. Landsc. Urban Plan. 2017, 162, 126–136. [Google Scholar] [CrossRef]
- Liu, T.; Wu, Y.; Tian, X.; Gong, Y. Urban household solid waste generation and collection in Beijing, China. Resour. Conserv. Recycl. 2015, 104, 31–37. [Google Scholar] [CrossRef]


| References | Definition of CC in the Context of Urban Management |
|---|---|
| Godschalk and Parker, 1975 | Carrying capacity is said to be the ability of natural and man-made systems to support the demands of various uses, and subsequently it refers to inherent limits in the systems beyond which instability, degradation, or irreversible damage occurs [34]. |
| Schneider et al., 1978 | Environmental carrying capacity is the ability of an ecosystem to sustain the human population without the natural or artificial environment system being severely degraded [35]. |
| Oh et al., 2002 | Urban carrying capacity is defined as a level of population growth, human activity, physical development and land us, which supports the urban habitat system to maintain sustainable development and does not cause its degradation and irreversible damage [36]. |
| Oh et al., 2004 | Urban carrying capacity concept in this research is defined as the maximum level of human activities which can be sustained by the urban environment without causing serious degradation and irreversible damage [37]. |
| Liu and Borthwick, 2011 | Carrying Capacity of the Environment is the combined threshold in time and space of natural resources, environmental assimilative capacity, ecosystem services, and social supporting capacity of the environment that could carry socio-economic activities without causing obvious changes or damage to structures and functions of the environment [28]. |
| Ye et al., 2016 | Resources and environmental carrying capacity is the social and economic pressure that can be placed on ecological surroundings on the condition that the ecosystem can maintain a stable structure and complete function [38]. |
| Wang, 2016 | The carrying capacity of urban public services refers to the maximum load and optimal scale of population and socio-economic activities that can be carried by various public services, within certain period of time and under the conditions of sustainable urban development [33]. |
| Reference | Dimension |
|---|---|
| OECD, 2011 [44] | General public service; defense; public order and safety; economic affairs; environmental protection; housing and community amenities; health; recreation; culture and religion; education; social protection |
| Afonso and Fernandes, 2008 [45] | Municipal expenditures; social services; basic education; cultural services; sanitation; territory organization; road infrastructure; |
| Andrews and Brewer, 2013 [46] | education; health; corrections; police protection; highways |
| Andrews and Entwistle, 2010 [47] | Education; social services; housing; highways; public protection; benefits and revenues |
| Stastna and Gregor, 2011 [48] | Public expenditures; administrative management; culture; education; urban environment; housing and industrial; public safety |
| Wei et al., 2015a [12] | basic municipal facilities; cultural and recreational facilities; sports facilities; educational facilities; housing conditions; healthcare facilities; public traffic |
| Sun et al., 2018 [49] | population; public health; education; technology innovation; public housing; transport infrastructure; industrial economy; |
| Domingues et al., 2015 [50] | Environmental protection and management; economic aspects; ethics and social responsibility |
| Weng et al., 2020 [51] | Economics; social; environment; transportation |
| Diao et al., 2019 [52] | Resource endowment; environmental protection; transportation; scientific and technological innovation; demographic factors; economic development |
| An and Ren, 2008 [53] | Social security; public security; public health; education; infrastructure; environmental protection; science and technology |
| Wang and Nan, 2011 [54] | Education; basic health care; public employment services and basic social security |
| Ma and Zeng, 2011 [55] | Education; public health; social security; infrastructure |
| Wei et al., 2015 [56] | Public security; education; culture; sports and media; social security; medical and health care; environmental protection; transportation |
| Li, 2011 [57] | Education; public health and basic medical care; basic social security and employment; public welfare infrastructure; public safety; environmental protection |
| Zhang, 2011 [58] | Education; basic medical and health care; social security; public employment; infrastructure; environmental protection; public security |
| Yang, 2015 [59] | Infrastructure; education; public employment; public health; social protection |
| Yin and Liu, 2017b [60] | Government expenditures on public services; education; medical and health care; scientific research and innovation; culture and sports; environmental protection; social security; and support for related industries |
| Wang et al., 2018 [23] | Compulsory education; medical and health care; social security; environmental governance; housing; population; economic development; household registration system; urban planning policies; public financial expenditures |
| Yang and Gu, 2019 [61] | Primary and secondary education; medical and health care; culture and sports; social welfare and security; basic life; roads and transportation; environmental protection; health and greening |
| Dimension | Indicator |
|---|---|
| D1—Basic Education | Number of elementary school teachers per 10,000 people; number of middle school teachers per 10,000 people; number of elementary school per 10,000 people; number of junior high schools per 10,000 people; number of elementary school per administrative area; number of junior high schools per administrative area; school-age children enrollment rate; primary school promotion rate; middle school promotion rate; financial resources for education per pupil in primary schools; financial resources for education per student in junior high school; per capita state financial expenditure on education; ratio of education expenditure to regional financial expenditure; number of elementary school students per 10,000 people; number of junior high school students per 10,000 people; percentage of illiterate population aged 15 and over; number of students accommodated per junior high school; number of students accommodated per elementary school; number of middle school students per 10,000 people; number of elementary school students per 10,000 people; compulsory education expenditure per capita |
| D2—Public Health | Number of health facilities per 10,000 people; number of health facility personnel per 10,000 people; number of beds in medical institutions per 10,000 people; number of maternal and child health centers per million population; disease prevention and control per million population; number of health supervision offices per million population; hospital facility space per capita; average life expectancy per capita; medical institution bed use rate; per capita financial expenditure on health care; number of visits per unit of medical facility |
| D3—Social Security | proportion of basic pension insurance participants to total population; proportion of unemployment insurance participants to total population; proportion of basic medical insurance participants to total population; number of preferential placement units per 10,000 population; number of under-insurance per 100 people; unemployment rate; ratio of social security funding to fiscal spending; average wage; urban minimum living standard treatment; the amount of urban low income insurance payment per 10,000 people; minimum wage for employees; the minimum standard of living security for urban residents; older people as a proportion of the total population; social security spending per capita |
| D4—Housing security | Number of subsidized housing units per 10,000 people; Protected housing area per 10,000 people; Average price per square meter of housing; Average price of rent per square meter; House price to income ratio; Rent-to-income ratio; Housing security expenditure per capita |
| D5—Urban Environment | Number of wastewater treatment facilities per 10,000 people; number of abandoned treatment facilities per 10,000 people; sanitation vehicle population density; urban sewage treatment rate; harmless treatment rate of urban domestic waste; industrial “three wastes” treatment rate; greenery rate; green area per capita; air quality ratio; per capita financial expenditure on environmental protection; the proportion of environmental protection expenditure to fiscal expenditure; industrial wastewater emissions per 10,000 people; exhaust emissions per 10,000 people; industrial solid waste emissions per 10,000 people; domestic waste emissions per 10,000 people; respirable particulate matter concentration; sulfur dioxide concentration |
| D6—Public Transportation | Road area per capita; number of public transportation vehicles per 10,000 people; number of urban bus lines per 10,000 people; operating miles of urban rail transit per 10,000 people; average speed during peak hours; number of passengers carried per 100 buses; number of passengers carried per km of rail; number of cabs per 10,000 people; transportation expenditure per capita |
| D7—Public Culture and Sports | Number of cultural venues per 10,000 people; library population density; population density of public library collections; per capita financial expenditure on culture, sports and media |
| Dimension | Carrier Indictor (Unit) | Load Indicator (Unit) |
|---|---|---|
| D1—Basic Education | C1 Number of primary schools (unit) | L1 Number of students in primary schools (person) |
| C2 Number of teachers in primary schools (person) | L2 Number of students in primary schools (person) | |
| C3 Number of secondary schools (unit) | L3 Number of students in primary schools (person) | |
| C4 Number of teachers in secondary schools (person) | L4 Number of students in secondary schools (person) | |
| C5 Expenditure for education (104 yuan) | L5 Resident population(person) | |
| D2—Public Health | C6 Number of hospitals (unit) | L6 Visits of health institutions (104 person-times) |
| C7 Number of sickbeds (unit) | L7 Visits of health institutions (104 person-times) | |
| C8 Number of physicians (person) | L8 Visits of health institutions (104 person-times) | |
| C9 Financial investment in public health (104 yuan) | L9 Resident population (person) | |
| D3—Social Security | C10 Number of urban workers joining pension insurance (104 person) | L10 Resident population (person) |
| C11 Number of urban workers joining medical care insurance (104 person) | L11 Resident population (person) | |
| C12 Number of urban workers joining unemployment insurance (104 person) | L12 Resident population (person) | |
| C13 Number of urban employee (104 person) | L13 Number of residents receiving subsistence allowances in urban areas (104 person) | |
| D4—Housing Security | C14 Per capita consumption expenditure of urban households (yuan/person) | L14 Per capita housing expenditure of urban households (yuan/person) |
| C15 Average annual wage of fully employed staff and workers (yuan/person) | L15 Average selling price of commercial building (yuan/m2) | |
| D5—Urban Environment | C16 Treatment of wastewater (104 m3) | L16Annual quantity of wastewater discharged (104 m3) |
| C17 Volume of harmless disposal of wastes (104 ton) | L17 Municipal wastes collected and transported (104 ton) | |
| C18 Area of parks and green land (hectare) | L18 Urban area (km2) | |
| D6—Public Transportation | C19 Number of taxis (unit) | L19 Resident population (person) |
| C20 Number of buses and trolley buses under operation (unit) | L20 Resident population (person) | |
| C21 Area of paved roads (104 m2) | L21 Resident population (person) | |
| D7—Public Culture and Sports | C22 Total collections of public libraries | L22 Resident population (person) |
| C23 Number of mass cultural centers | L23 Resident population (person) | |
| C24 Number of sport halls | L24 Resident population (person) |
| D1 | D2 | D3 | D4 | D5 | D6 | D7 | D | D1 | D2 | D3 | D4 | D5 | D6 | D7 | D | ||
|---|---|---|---|---|---|---|---|---|---|---|---|---|---|---|---|---|---|
| C1 | 56.12 | 64.45 | 57.72 | 48.16 | 64.14 | 58.59 | 64.12 | 413.30 | C19 | 63.18 | 65.97 | 61.07 | 51.47 | 61.28 | 66.86 | 66.05 | 435.88 |
| C2 | 57.99 | 63.00 | 56.18 | 50.83 | 63.80 | 63.68 | 62.99 | 418.47 | C20 | 54.88 | 61.19 | 54.86 | 46.93 | 62.26 | 61.77 | 58.61 | 400.50 |
| C3 | 55.44 | 62.40 | 55.43 | 49.81 | 61.42 | 62.55 | 60.47 | 407.52 | C21 | 55.59 | 62.77 | 54.28 | 45.70 | 63.85 | 61.04 | 61.08 | 404.31 |
| C4 | 63.48 | 66.94 | 61.67 | 51.14 | 64.49 | 61.90 | 65.58 | 435.20 | C22 | 58.61 | 61.67 | 55.79 | 49.07 | 64.21 | 62.92 | 59.36 | 411.63 |
| C5 | 61.91 | 65.84 | 61.66 | 52.42 | 66.39 | 59.97 | 64.84 | 433.03 | C23 | 56.07 | 63.25 | 55.82 | 45.85 | 68.75 | 58.04 | 61.14 | 408.92 |
| C6 | 59.71 | 63.75 | 56.64 | 50.84 | 63.42 | 62.09 | 66.00 | 422.45 | C24 | 57.46 | 63.24 | 56.60 | 45.58 | 69.86 | 61.43 | 62.71 | 416.88 |
| C7 | 65.49 | 66.94 | 62.36 | 52.80 | 67.90 | 63.11 | 67.51 | 446.11 | C25 | 61.12 | 64.49 | 57.55 | 48.64 | 68.91 | 62.22 | 65.61 | 428.54 |
| C8 | 62.41 | 65.93 | 60.69 | 51.15 | 65.46 | 60.87 | 66.17 | 432.68 | C26 | 59.49 | 58.30 | 55.35 | 51.30 | 65.16 | 57.28 | 71.50 | 418.38 |
| C9 | 59.96 | 65.50 | 60.09 | 50.99 | 63.62 | 58.20 | 64.29 | 422.65 | C27 | 57.64 | 63.05 | 56.73 | 51.91 | 68.73 | 63.88 | 62.72 | 424.66 |
| C10 | 61.13 | 67.24 | 61.40 | 51.25 | 68.93 | 64.94 | 67.30 | 442.19 | C28 | 56.22 | 62.94 | 56.46 | 47.37 | 66.37 | 63.67 | 62.64 | 415.67 |
| C11 | 56.01 | 63.88 | 57.78 | 47.78 | 72.47 | 66.13 | 64.74 | 428.79 | C29 | 68.78 | 71.11 | 66.42 | 50.00 | 72.90 | 58.12 | 71.38 | 458.71 |
| C12 | 60.35 | 67.92 | 61.04 | 48.52 | 71.59 | 64.69 | 67.37 | 441.48 | C30 | 64.92 | 67.12 | 61.74 | 48.51 | 69.67 | 57.89 | 64.83 | 434.68 |
| C13 | 68.26 | 70.61 | 66.54 | 52.86 | 63.31 | 65.99 | 70.42 | 457.99 | C31 | 44.93 | 59.17 | 51.01 | 43.99 | 59.35 | 59.10 | 57.96 | 375.51 |
| C14 | 60.15 | 64.96 | 58.38 | 48.56 | 68.89 | 62.86 | 62.19 | 425.99 | C32 | 69.31 | 72.29 | 67.28 | 53.13 | 70.93 | 63.31 | 71.06 | 467.31 |
| C15 | 62.73 | 64.76 | 59.06 | 50.98 | 74.60 | 63.01 | 64.67 | 439.81 | C33 | 67.46 | 69.62 | 65.66 | 58.61 | 71.92 | 65.72 | 68.86 | 467.85 |
| C16 | 68.77 | 70.82 | 65.98 | 52.11 | 65.13 | 64.60 | 71.36 | 458.77 | C34 | 60.64 | 65.95 | 60.27 | 53.74 | 68.20 | 64.64 | 65.94 | 439.38 |
| C17 | 62.74 | 64.63 | 61.55 | 55.80 | 65.88 | 62.21 | 64.60 | 437.41 | C35 | 61.91 | 65.15 | 61.71 | 52.96 | 65.41 | 60.84 | 61.94 | 429.92 |
| C18 | 64.10 | 66.78 | 62.08 | 52.11 | 68.69 | 59.84 | 64.13 | 437.73 | Average | 60.71 | 65.25 | 59.57 | 50.37 | 66.80 | 62.11 | 64.92 | 429.72 |
| D1 | D2 | D3 | D4 | D5 | D6 | D7 | D | D1 | D2 | D3 | D4 | D5 | D6 | D7 | D | ||
|---|---|---|---|---|---|---|---|---|---|---|---|---|---|---|---|---|---|
| C1 | 0.19 | 0.15 | 0.22 | 0.02 | 0.09 | 0.06 | 0.08 | 0.81 | C19 | 0.13 | 0.11 | 0.15 | 0.04 | 0.06 | 0.10 | 0.07 | 0.67 |
| C2 | 0.16 | 0.07 | 0.11 | 0.04 | 0.05 | 0.11 | 0.06 | 0.59 | C20 | 0.08 | 0.15 | 0.16 | 0.04 | 0.07 | 0.06 | 0.06 | 0.61 |
| C3 | 0.09 | 0.10 | 0.08 | 0.06 | 0.07 | 0.04 | 0.07 | 0.52 | C21 | 0.13 | 0.14 | 0.16 | 0.04 | 0.06 | 0.11 | 0.05 | 0.70 |
| C4 | 0.15 | 0.15 | 0.15 | 0.04 | 0.07 | 0.12 | 0.07 | 0.75 | C22 | 0.09 | 0.13 | 0.15 | 0.04 | 0.06 | 0.07 | 0.06 | 0.61 |
| C5 | 0.06 | 0.11 | 0.08 | 0.04 | 0.07 | 0.11 | 0.07 | 0.55 | C23 | 0.11 | 0.12 | 0.21 | 0.01 | 0.09 | 0.11 | 0.05 | 0.72 |
| C6 | 0.13 | 0.11 | 0.12 | 0.05 | 0.07 | 0.11 | 0.06 | 0.65 | C24 | 0.09 | 0.07 | 0.23 | 0.02 | 0.09 | 0.10 | 0.04 | 0.64 |
| C7 | 0.15 | 0.13 | 0.14 | 0.04 | 0.05 | 0.11 | 0.07 | 0.69 | C25 | 0.07 | 0.13 | 0.09 | 0.06 | 0.07 | 0.09 | 0.07 | 0.58 |
| C8 | 0.17 | 0.11 | 0.14 | 0.04 | 0.04 | 0.11 | 0.07 | 0.67 | C26 | 0.10 | 0.14 | 0.17 | 0.04 | 0.04 | 0.11 | 0.07 | 0.66 |
| C9 | 0.15 | 0.05 | 0.05 | 0.05 | 0.06 | 0.09 | 0.06 | 0.50 | C27 | 0.08 | 0.11 | 0.13 | 0.05 | 0.06 | 0.03 | 0.05 | 0.51 |
| C10 | 0.17 | 0.10 | 0.20 | 0.03 | 0.08 | 0.05 | 0.07 | 0.71 | C28 | 0.11 | 0.14 | 0.19 | 0.04 | 0.07 | 0.08 | 0.08 | 0.71 |
| C11 | 0.15 | 0.13 | 0.18 | 0.04 | 0.07 | 0.13 | 0.08 | 0.77 | C29 | 0.12 | 0.13 | 0.16 | 0.04 | 0.07 | 0.08 | 0.07 | 0.67 |
| C12 | 0.13 | 0.15 | 0.21 | 0.03 | 0.07 | 0.10 | 0.08 | 0.77 | C30 | 0.11 | 0.15 | 0.10 | 0.04 | 0.05 | 0.06 | 0.07 | 0.59 |
| C13 | 0.12 | 0.10 | 0.18 | 0.04 | 0.07 | 0.03 | 0.07 | 0.61 | C31 | 0.11 | 0.13 | 0.14 | 0.04 | 0.05 | 0.11 | 0.07 | 0.65 |
| C14 | 0.09 | 0.11 | 0.12 | 0.04 | 0.06 | 0.09 | 0.06 | 0.57 | C32 | 0.16 | 0.13 | 0.13 | 0.04 | 0.05 | 0.13 | 0.06 | 0.70 |
| C15 | 0.09 | 0.09 | 0.15 | 0.03 | 0.07 | 0.05 | 0.07 | 0.54 | C33 | 0.10 | 0.15 | 0.00 | 0.04 | 0.07 | 0.09 | 0.05 | 0.50 |
| C16 | 0.05 | 0.09 | 0.21 | 0.03 | 0.07 | 0.13 | 0.07 | 0.64 | C34 | 0.04 | 0.13 | 0.12 | 0.05 | 0.07 | 0.12 | 0.07 | 0.60 |
| C17 | 0.09 | 0.11 | 0.14 | 0.04 | 0.05 | 0.07 | 0.06 | 0.56 | C35 | 0.08 | 0.12 | 0.16 | 0.04 | 0.03 | 0.14 | 0.07 | 0.65 |
| C18 | 0.13 | 0.13 | 0.18 | 0.03 | 0.06 | 0.12 | 0.05 | 0.70 | Average | 0.11 | 0.12 | 0.15 | 0.04 | 0.06 | 0.09 | 0.07 | 0.64 |
| Dimension | D1 | D2 | D3 | D4 | D5 | D6 | D7 | D | Dimension | D1 | D2 | D3 | D4 | D5 | D6 | D7 | D |
|---|---|---|---|---|---|---|---|---|---|---|---|---|---|---|---|---|---|
| Beijing | IV | IV | IV | III | IV | III | IV | IV | Qingdao | I | II | I | I | III | I | I | I |
| Tianjin | IV | III | III | II | III | I | III | III | Zhengzhou | III | IV | IV | III | IV | III | III | III |
| Shijiazhuang | III | III | III | IV | IV | II | IV | III | Wuhan | IV | IV | IV | III | III | IV | III | IV |
| Taiyuan | I | I | II | I | IV | IV | I | I | Changsha | III | IV | IV | IV | III | II | III | III |
| Hohhot | II | II | II | I | IV | IV | IV | II | Guangzhou | III | IV | IV | III | I | IV | III | IV |
| Shenyang | IV | III | III | I | IV | IV | II | IV | Shenzhen | III | III | IV | III | I | IV | III | III |
| Dalian | I | I | II | I | II | I | I | I | Nanning | II | IV | III | IV | I | II | I | III |
| Changchun | I | II | II | I | III | IV | I | I | Haikou | III | IV | IV | II | III | II | I | IV |
| Harbin | IV | II | II | I | III | III | III | III | Chongqing | III | III | III | I | II | II | III | III |
| Shanghai | I | II | I | II | I | II | I | I | Chengdu | IV | IV | IV | IV | IV | II | IV | IV |
| Nanjing | IV | IV | IV | IV | I | I | IV | IV | Guiyang | I | I | I | IV | I | III | I | I |
| Hangzhou | IV | I | I | III | I | I | I | I | Kunming | II | I | II | IV | II | III | IV | II |
| Ningbo | I | II | I | I | IV | II | I | II | Xi’an | III | IV | III | IV | III | IV | IV | IV |
| Hefei | III | III | III | IV | II | II | III | III | Lanzhou | I | I | II | I | II | I | II | I |
| Fuzhou | II | III | III | II | I | II | IV | II | Xining | II | I | II | I | I | II | II | II |
| Xiamen | II | II | I | II | IV | I | I | I | Yinchuan | III | I | II | I | I | I | I | II |
| Nanchang | II | III | II | II | III | II | III | II | Urumqi | II | IV | I | I | III | IV | IV | I |
| Jinan | I | I | I | II | II | IV | III | I |
Publisher’s Note: MDPI stays neutral with regard to jurisdictional claims in published maps and institutional affiliations. |
© 2021 by the authors. Licensee MDPI, Basel, Switzerland. This article is an open access article distributed under the terms and conditions of the Creative Commons Attribution (CC BY) license (https://creativecommons.org/licenses/by/4.0/).
Share and Cite
Liao, S.; Du, X.; Shen, L.; Lv, M. Evaluation Method for Urban Public Service Carrying Capacity (UPSCC): A Qualitative–Quantitative Bi-Dimensional Perspective. Int. J. Environ. Res. Public Health 2021, 18, 12539. https://doi.org/10.3390/ijerph182312539
Liao S, Du X, Shen L, Lv M. Evaluation Method for Urban Public Service Carrying Capacity (UPSCC): A Qualitative–Quantitative Bi-Dimensional Perspective. International Journal of Environmental Research and Public Health. 2021; 18(23):12539. https://doi.org/10.3390/ijerph182312539
Chicago/Turabian StyleLiao, Shiju, Xiaoyun Du, Liyin Shen, and Minghe Lv. 2021. "Evaluation Method for Urban Public Service Carrying Capacity (UPSCC): A Qualitative–Quantitative Bi-Dimensional Perspective" International Journal of Environmental Research and Public Health 18, no. 23: 12539. https://doi.org/10.3390/ijerph182312539