
Health Risk Assessment of Exposure to 15 Essential and Toxic Elements in Spanish Women of Reproductive Age: A Case Study

 , , , , ,
Abstract
:1. Introduction
2. Material and Methods
2.1. Study Area and Population
2.2. Samples and Data Collection
2.3. Chemical Analysis
2.3.1. Target Elements
2.3.2. Element Determination by ICP-MS
2.3.3. Internal Quality Control (QC) and Method Performance
2.4. Scientific Ethics Committee
2.5. Statistical Analysis
2.6. Risk Assessment
- EDI: estimated daily intake.
- CU: concentration of the element in urine (GM and P95).
- V24h: total urinary volume excreted within 24 h for adults (1.6 L·day−1) [51].
- Cre24h: total urinary creatinine excreted within 24 h (1.03 g·day−1) [52].
- FUE: urinary excretion factor of the element (see Table 1).
- BW: mean body weight of the participants (60 kg).
- HQ: hazard quotient.
- EDI: estimated daily intake.
- GV: oral intake health-based guidance values, such as tolerable daily intake (TDI), reference dose (RfD) or tolerable upper intake level (UL).
- CU: urinary concentration of the metal (at GM and P95 distribution levels).
- BE: biomonitoring equivalent.
3. Results
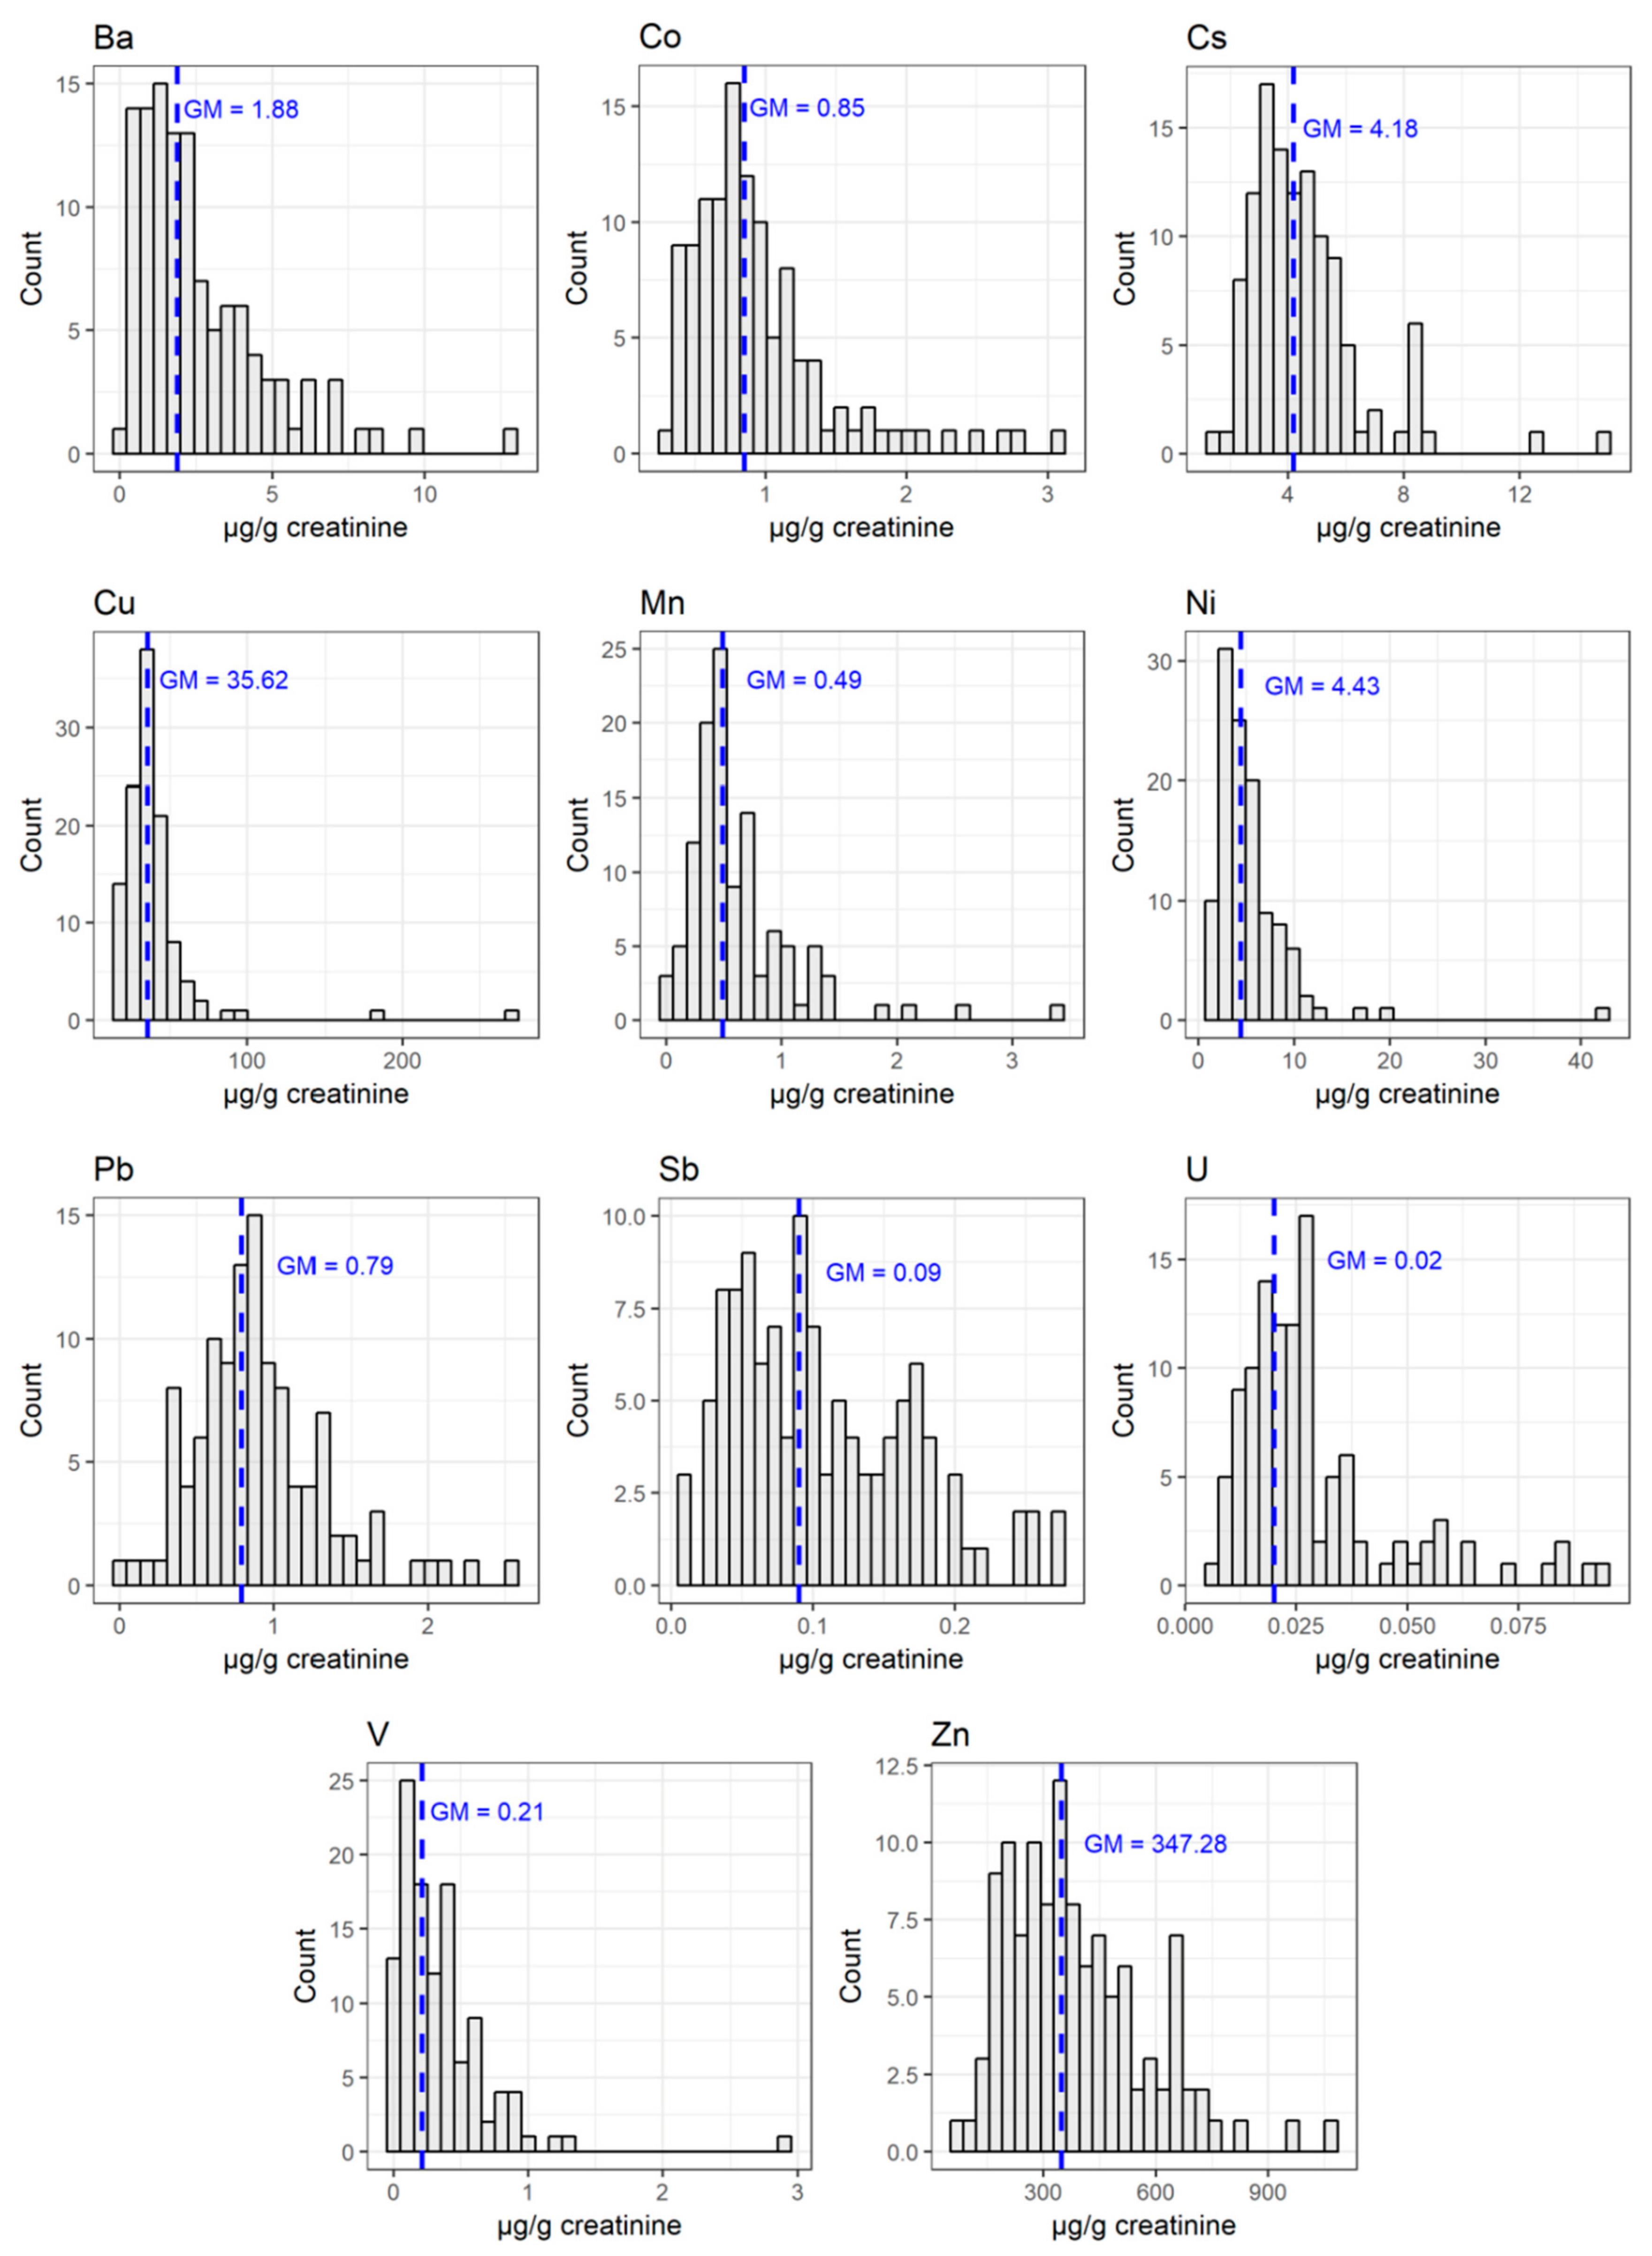
3.1. Urinary Levels of Metals
3.2. Factors of Influence on the Urine Levels of Elements
3.3. Risk Assessment
4. Discussion
4.1. Urinary Levels
4.2. Predictors of Exposure
4.3. Risk Assessment
5. Conclusions
Supplementary Materials
Author Contributions
Funding
Institutional Review Board Statement
Informed Consent Statement
Acknowledgments
Conflicts of Interest
References
- Coscollá, C.; Sánchez, A.; Corpas-Burgos, F.; López, A.; Pérez, R.; Kuligowski, J.; Vento, M.; Yusà, V. Exposure and Risk Assessment of Hg, Cd, As, Tl, Se, and Mo in Women of Reproductive Age Using Urinary Biomonitoring. Environ. Toxicol. Chem. 2021, 40, 1477–1490. [Google Scholar] [CrossRef] [PubMed]
- Avino, P.; Capannesi, G.; Manigrasso, M.; Sabbioni, E.; Rosada, A. Element assessment in whole blood, serum and urine of three Italian healthy sub-populations by INAA. Microchem. J. 2011, 99, 548–555. [Google Scholar] [CrossRef]
- Dereumeaux, C.; Saoudi, A.; Pecheux, M.; Berat, B.; de Crouy-Chanel, P.; Zaros, C.; Brunel, S.; Delamaire, C.; le Tertre, A.; Lefranc, A.; et al. Biomarkers of exposure to environmental contaminants in French pregnant women from the Elfe cohort in 2011. Environ. Int. 2016, 97, 56–67. [Google Scholar] [CrossRef] [PubMed]
- Watson, C.V.; Lewin, M.; Ragin-Wilson, A.; Jones, R.; Jarrett, J.M.; Wallon, K.; Ward, C.; Hilliard, N.; Irvin-Barnwell, E. Characterization of trace elements exposure in pregnant women in the United States, NHANES 1999-2016. Environ. Res. 2020, 183, 109208. [Google Scholar] [CrossRef]
- Karakis, I.; Landau, D.; Gat, R.; Shemesh, N.; Tirosh, O.; Yitshak-Sade, M.; Sarov, B.; Novack, L. Maternal metal concentration during gestation and pediatric morbidity in children: An exploratory analysis. Environ. Health Prev. Med. 2021, 26, 1–11. [Google Scholar] [CrossRef] [PubMed]
- Ashrap, P.; Watkins, D.J.; Mukherjee, B.; Boss, J.; Richards, M.J.; Rosario, Z.; Vélez-Vega, C.M.; Alshawabkeh, A.; Cordero, J.F.; Meeker, J.D. Predictors of urinary and blood Metal(loid) concentrations among pregnant women in Northern Puerto Rico. Environ. Res. 2020, 183, 109178. [Google Scholar] [CrossRef] [PubMed]
- Zhang, B.; Xia, W.; Li, Y.; Bassig, B.A.; Zhou, A.; Wang, Y.; Li, Z.; Yao, Y.; Hu, J.; Du, X.; et al. Prenatal exposure to lead in relation to risk of preterm low birth weight: A matched case-control study in China. Reprod. Toxicol. 2015, 57, 190–195. [Google Scholar] [CrossRef] [Green Version]
- Ding, C.; Pan, Y.; Zhang, A.; Wu, B.; Huang, H.; Zhu, C. Study of distribution and influencing factors of lead and cadmium in whole blood and urine among population in 8 provinces in China. Zhonghua Yu Fang Yi Xue Za Zhi 2014, 48, 91–106. [Google Scholar] [PubMed]
- Jain, R.B. Effect of pregnancy on the levels of urinary metals for females aged 17–39 years old: Data from National Health and Nutrition Examination Survey 2003–2010. J. Toxicol. Environ. Health 2013, 76, 86–97. [Google Scholar] [CrossRef] [PubMed]
- Woodruff, T.J.; Zota, A.R.; Schwartz, J.M. Environmental chemicals in pregnant women in the United States: NHANES 2003–2004. Environ. Health Perspect. 2011, 119, 878–885. [Google Scholar] [CrossRef] [PubMed] [Green Version]
- Shirai, S.; Suzuki, Y.; Yoshinaga, J.; Mizumoto, Y. Maternal exposure to low-level heavy metals during pregnancy and birth size. Environ. Sci. Health Part A 2010, 45, 1468–1474. [Google Scholar] [CrossRef] [PubMed]
- Hinwood, A.L.; Callan, A.C.; Ramalingam, M.; Boyce, M.; Heyworth, J.; McCafferty, P. Cadmium, lead and mercury exposure in non smoking pregnant women. Environ. Res. 2013, 126, 118–124. [Google Scholar] [CrossRef]
- Fort, M.; Cosin-Tomas, M.; Grimalt, J.O.; Querol, X.; Casas, M.; Sunyer, J. Assessment of exposure to trace metals in a cohort of pregnant women from an urban center by urine analysis in the first and third trimesters of pregnancy. Environ. Sci. Pollut. Res. Int. 2014, 21, 9234–9241. [Google Scholar] [CrossRef] [Green Version]
- Adekunle, I.M.; Ogundele, J.A.; Oguntoke, O.; Akinloye, O.A. Assessment of blood and urine lead levels of some pregnant women residing in Lagos, Nigeria. Environ. Monit. Assess. 2010, 170, 467–474. [Google Scholar] [CrossRef] [PubMed]
- NHANES, 2018. Fourth National Report on Human Exposure to Environmental Chemicals. Updated Tables, March 2018, Volume 1. Available online: https://www.cdc.gov/exposurereport/pdf/FourthReport_UpdatedTables_Volume1_Mar2018.pdf (accessed on 13 July 2021).
- Health Canada. Second Report on Human Biomonitoring on Environmental Chemicals in Canada. 2013. Available online: https://www.canada.ca/en/health-canada/services/environmental-workplace-health/reports-publications/environmental-contaminants/second-report-human-biomonitoring-environmental-chemicals-canada-health-canada-2013.html#ret-8.12.1 (accessed on 13 July 2021).
- Hoet, P.; Jacquerye, C.; Deumer, G.; Lison, D.; Haufroid, V. Reference values and upper reference limits for 26 trace elements in the urine of adults living in Belgium. Clin. Chem. Lab. Med. 2013, 51, 839–849. [Google Scholar] [CrossRef]
- Al-Saleh, I.; Al-Mohawes, S.; Al-Rouqi, R.; Elkhatib, R. Selenium status in lactating mothers-infants and its potential protective role against the neurotoxicity of methylmercury, lead, manganese, and DDT. Environ. Res. 2019, 176, 108562. [Google Scholar] [CrossRef] [PubMed]
- Ohashi, F.; Fukui, Y.; Takada, S.; Moriguchi, J.; Ezaki, T.; Ikeda, M. Reference values for cobalt, copper, manganese, and nickel in urine among women of the general population in Japan. Int. Arch. Occup. Environ. Health 2006, 80, 117–126. [Google Scholar] [CrossRef]
- Fréry, N.; Saoudi, A.; Garnier, R.; Zeghnoun, A.; Falq, G.; Guldner, L. Exposure of the French population to environmental pollutants environmental components of the french national survey on nutrition and health e initial results. Saint-Maurice Fr. Inst. Public Health Surveill. 2010, 1, 1–12. Available online: www.invs.sante.fr (accessed on 13 July 2021).
- Liu, Z.; Lin, Y.; Tian, X.; Li, J.; Chen, X.; Yang, J.; Li, X.; Deng, Y.; Li, N.; Liang, J.; et al. Association between maternal aluminium exposure and the risk of congenital heart defects in offspring. Birth Defects Res. Part A Clin. Mol. Teratol. 2016, 106, 95–103. [Google Scholar] [CrossRef] [PubMed]
- Rentschler, G.; Rodushkin, I.; Cerna, M.; Chen, C.; Harari, F.; Harari, R.; Horvat, M.; Hruba, F.; Kasparova, L.; Koppova, K.; et al. Platinum, palladium, rhodium, molybdenum and strontium in blood of urban women in nine countries. Int. J. Hyg. Environ. Health 2018, 221, 223–230. [Google Scholar] [CrossRef] [PubMed]
- Kamala, C.T.; Balaram, V.; Satyanarayanan, M.; Kumar, A.K.; Subramanyam, K.S.V. Biomonitoring of airborne platinum group elements in urban traffic police officers. Arch. Environ. Contam. Toxicol. 2015, 68, 421–431. [Google Scholar] [CrossRef] [PubMed]
- Starościak, E.; Rosiak, L. Determination of uranium reference levels in the urine of Warsaw residents (Poland). J. Radioanal. Nucl. Chem. 2014, 304, 75–79. [Google Scholar] [CrossRef] [Green Version]
- Agency for Toxic Substances and Disease Registry (ATSDR). Available online: https://wwwn.cdc.gov/TSP/PHS/PHS.aspx?phsid=658&toxid=121 (accessed on 13 July 2021).
- Centers for Disease Control and Prevention (CDC). National Biomonitoring Program. Biomonitoing Summary. Beryllium. Available online: https://www.cdc.gov/biomonitoring/Beryllium_BiomonitoringSummary.html (accessed on 1 July 2021).
- Centers for Disease Control and Prevention (CDC). National Biomonitoring Program. Biomonitoing Summary. Cesium. Available online: https://www.cdc.gov/biomonitoring/Cesium_BiomonitoringSummary.html (accessed on 1 July 2021).
- Li, Y.; Cha, C.; Lv, X.; Liu, J.; He, J.; Pang, Q.; Meng, L.; Kuang, H.; Fan, R. Association between 10 urinary heavy metal exposure and attention deficit hyperactivity disorder for children. Environ. Sci. Pollut. Res. 2020, 27, 31233–31242. [Google Scholar] [CrossRef] [PubMed]
- Bocca, B.; Ruggieri, F.; Pino, A.; Rovira, J.; Calamandrei, G.; Martínez, M.A.; Domingo, J.L.; Alimonti, A.; Schuhmacher, M. Human biomonitoring to evaluate exposure to toxic and essential trace elements during pregnancy. Part A. Concentrations in maternal blood, urine and cord blood. Environ. Res. 2019, 177, 1085999. [Google Scholar] [CrossRef] [PubMed]
- Jaishankar, M.; Tseten, T.; Anbalagan, N.; Mathew, B.B.; Beeregowda, K.N. Toxicity, mechanism and health effects of some heavy metals. Interdiscip. Toxicol. 2014, 7, 60–72. [Google Scholar] [CrossRef] [PubMed] [Green Version]
- Järup, L. Hazards of heavy metal contamination. Br. Med. Bull. 2003, 68, 167–182. [Google Scholar] [CrossRef] [Green Version]
- Tchounwou, P.B.; Yedjou, C.G.; Patlolla, A.K.; Sutton, D.J. Heavy metals toxicity and the environment. J. Pharmacogn. Phytochem. 2012, 101, 133–164. [Google Scholar]
- Vatanpour, N.; Malvandi, A.M.; Talouki, H.H.; Gattinoni, P.; Scesi, L. Impact of Rapid Urbanization on the Surface Water’s Quality: A Long-Term Environmental and Physicochemical Investigation of Tajan River, Iran (2007–2017). Env. Sci. Pollut. Res. 2020, 27, 8439–8450. [Google Scholar] [CrossRef] [PubMed]
- Sirot, V.; Traore, T.; Guérin, T.; Noël, L.; Bachelot, M.; Cravedi, J.-P.; Mazur, A.; Glorennec, P.; Vasseur, P.; Jean, J.; et al. French Infant Total Diet Study: Exposure to Selected Trace Elements and Associated Health Risks. Food Chem. Toxicol. 2018, 120, 625–633. [Google Scholar] [CrossRef] [PubMed]
- Ibrahim, D.; Froberg, B.; Wolf, A.; Rusyniak, D.E. Heavy metal poisoning: Clinical presentations and pathophysiology. Clin. Lab. Med. 2006, 26, 67–97. [Google Scholar] [CrossRef] [PubMed]
- Vaughan, G.T.; Florence, T.M. Platinum in the human diet, blood, hair and excreta. Sci. Total Environ. 1992, 111, 47–58. [Google Scholar] [CrossRef]
- Li, C.; Xia, W.; Jiang, Y.; Liu, W.; Zhang, B.; Xu, S.; Li, Y. Low level prenatal exposure to a mixture of Sr, Se and Mn and neurocognitive development of 2-year-old children. Sci. Total Environ. 2020, 735, 139403. [Google Scholar] [CrossRef]
- Yusà, V.; Pérez, R.; Suelves, T.; Corpas-Burgos, F.; Gormaz, M.; Dualde, P.; Coscollà, C.; Quiles, J.; Roca, M.; Vento, M. Biomonitoring of mercury in hair of breastfeeding mothers living in the Valencian Region (Spain). Levels and predictors of exposure. Chemosphere 2017, 187, 106–113. [Google Scholar] [CrossRef] [PubMed]
- Larsen, K. Creatinine assay by a reaction-kinetic principle. Clin. Chim. Acta 1972, 41, 209–217. [Google Scholar] [CrossRef]
- Kume, T.; Ohashi, F.; Nonomura, S. Group IV Clathrates for Photovoltaic Applications. Jpn. J. Appl. Phys. 2017, 56, 05DA05. [Google Scholar] [CrossRef] [Green Version]
- Schmidt, R.L.; Straseski, J.A.; Raphael, K.L.; Adams, A.H.; Lehman, C.M. A Risk Assessment of the Jaffe vs. Enzymatic Method for Creatinine Measurement in an Outpatient Population. PLoS ONE 2015, 10, e0143205. [Google Scholar] [CrossRef] [PubMed]
- World Health Organization (WHO). Trace Elements in Human Nutrition and Health. 1996. Available online: http://www.who.int/nutrition/publications/micronutrients/9241561734/en/ (accessed on 13 July 2021).
- European Food Safety Authority (EFSA). Management of Left-Censored Data in Dietary Exposure Assessment of Chemical Substances. EFSA J. 2010, 8, 96. Available online: www.efsa.europa.eu (accessed on 13 July 2021). [CrossRef] [Green Version]
- Gelman, A. Scaling Regression Inputs by Dividing by Two Standard Deviations. Stat. Med. 2008, 27, 2865–2873. [Google Scholar] [CrossRef]
- Konishi, S.; Kitagawa, G. Information Criteria and Statistical Modeling. In Information Criteria and Statistical Modeling; Springer: New York, NY, USA, 2008; pp. 1–273. [Google Scholar]
- Poddalgoda, D.; Macey, K.; Hancock, S. Derivation of biomonitoring equivalents (BE values) for zinc. Regul. Toxicol. Pharmacol. 2019, 106, 178–186. [Google Scholar] [CrossRef] [PubMed]
- Poddalgoda, D.; Macey, K.; Assad, H.; Krishnan, K. Development of biomonitoring equivalents for barium in urine and plasma for interpreting human biomonitoring data. Regul. Toxicol. Pharmacol. 2017, 86, 303–311. [Google Scholar] [CrossRef]
- Poddalgoda, D.; Hays, S.M.; Kirman, C.; Chander, N.; Nong, A. Derivation of Biomonitoring Equivalents for aluminium for the interpretation of population-level biomonitoring data. Regul. Toxicol. Pharmacol. 2021, 122, 104913. [Google Scholar] [CrossRef]
- Katsikantami, I.; Colosio, C.; Alegakis, A.; Tzatzarakis, M.N.; Vakonaki, E.; Rizos, A.K.; Sarigiannis, D.A.; Tsatsakis, A.M. Estimation of daily intake and risk assessment of organophosphorus pesticides based on biomonitoring data—The internal exposure approach. Food Chem. Toxicol. 2019, 123, 57–71. [Google Scholar] [CrossRef] [PubMed]
- Mojska, H.; Gielecińska, I.; Jasińska-Melon, E.; Winiarek, J.; Sawicki, W. Are AAMA and GAMA Levels in Urine after Childbirth a Suitable Marker to Assess Exposure to Acrylamide from Passive Smoking during Pregnancy?—A Pilot Study. Int. J. Environ. Res. Public Health 2020, 17, 7391. [Google Scholar] [CrossRef] [PubMed]
- Aylward, L.L.; Krishnan, K.; Kirman, C.R.; Nong, A.; Hays, S.M. Biomonitoring Equivalents for deltamethrin. Regul. Toxicol. Pharmacol. 2011, 60, 189–199. [Google Scholar] [CrossRef]
- Mage, D.T.; Allen, R.H.; Gondy, G.; Smith, W.; Barr, D.B.; Needham, L.L. Estimating pesticide dose from urinary pesticide concentration data by creatinine correction in the Third National Health and Nutrition Examination Survey (NHANES-III). J. Expo. Sci. Environ. Epidemiol. 2004, 14, 457–465. [Google Scholar] [CrossRef]
- Agency for Toxic Substances and Disease Registry (ATSDR). Toxicological Profile for Cobalt. Available online: https://www.atsdr.cdc.gov/toxprofiles/tp33.pdf (accessed on 15 July 2021).
- Finley, B.L.; Monnot, A.D.; Paustenbach, D.J.; Gaffney, S.H. Derivation of a chronic oral reference dose for cobalt. Regul. Toxicol. Pharmacol. 1970, 64, 491–503. [Google Scholar] [CrossRef] [PubMed]
- Agency for Toxic Substances and Disease Registry (ATSDR). Toxicological Profile for Copper. Available online: https://www.atsdr.cdc.gov/toxprofiles/tp132.pdf (accessed on 15 July 2021).
- European Food Safety Authority (EFSA). Tolerable Upper Intake Levels for Vitamins and Minerals. Available online: https://www.efsa.europa.eu/sites/default/files/efsa_rep/blobserver_assets/ndatolerableuil.pdf (accessed on 20 July 2021).
- Agency for Toxic Substances and Disease Registry (ATSDR). Toxicological Profile for Manganese. Available online: https://www.atsdr.cdc.gov/ToxProfiles/tp151.pdf (accessed on 15 July 2021).
- Agency for Toxic Substances and Disease Registry (ATSDR). Toxicological Profile for Vanadium. Available online: https://www.atsdr.cdc.gov/ToxProfiles/tp58.pdf (accessed on 15 July 2021).
- Institute of Medicine (US) Panel on Micronutrients. Arsenic, Boron, Nickel, Silicon, and Vanadium. In Dietary Reference Intakes for Vitamin A, Vitamin K, Arsenic, Boron, Chromium, Copper, Iodine, Iron, Manganese, Molybdenum, Nickel, Silicon, Vanadium, and Zinc; National Academies Press: Washington, WA, USA, 2001; pp. 502–554. [Google Scholar]
- Agency for Toxic Substances and Disease Registry (ATSDR). Toxicological Profile for Cesium. Available online: https://www.atsdr.cdc.gov/ToxProfiles/tp157.pdf (accessed on 15 July 2021).
- Agency for Toxic Substances and Disease Registry (ATSDR). Toxicological Profile for Nickel. Available online: https://www.atsdr.cdc.gov/ToxProfiles/tp15.pdf (accessed on 15 July 2021).
- Schrenk, D.; Bignami, M.; Bodin, L.; Chipman, J.K.; del Mazo, J.; Grasl-Kraupp, B.; Hogstrand, C.; Hoogenboom, L.R.; Leblanc, J.-C.; Nebbia, C.S.; et al. Scientific Opinion on the update of the risk assessment of nickel in food and drinking water. EFSA J. 2020, 18, 6268. [Google Scholar] [CrossRef]
- Agency for Toxic Substances and Disease Registry (ATSDR). Toxicological Profile for Lead. Available online: https://www.atsdr.cdc.gov/ToxProfiles/tp13.pdf (accessed on 15 July 2021).
- European Medicines Agency. ICH harmonised guideline. In Guideline for Elemental Impurities Q3D (R1); European Medicines Agency: Amsterdam, The Nehterlands, 2019. Available online: https://www.ema.europa.eu/en/documents/scientific-guideline/international-conference-harmonisation-technical-requirements-registration-pharmaceuticals-human-use_en-32.pdf (accessed on 27 October 2021).
- Tylenda, C.A.; Sullivan, D.W.; Fowler, B.A. Antimony. In Handbook on the Toxicology of Metals, 4th ed.; Elsevier: Waltham, MA, USA, 2015. [Google Scholar] [CrossRef]
- U.S. EPA. Chemical Assessment Summary: Antimony; U.S. EPA: Washington, WA, USA, 1987.
- Agency for Toxic Substances and Disease Registry (ATSDR). Toxicological Profile for Thorium. Available online: https://www.atsdr.cdc.gov/ToxProfiles/tp147.pdf (accessed on 15 July 2021).
- Agency for Toxic Substances and Disease Registry (ATSDR). Toxicological Profile for Uranium. Available online: https://www.atsdr.cdc.gov/ToxProfiles/tp150.pdf (accessed on 15 July 2021).
- EFSA. Scientific Opinion of the Panel on Contaminants in the Food Chain on a Request from GermanFederal Institute for Risk Assessment (BfR) on uranium in foodstuff, in particular mineral water. Question number EFSA-Q-2007–135 (accessed on 25 March 2009). EFSA J. 2009, 1018, 1–59. [Google Scholar]
- Zhang, T.; Ruan, J.; Zhang, B.; Lu, S.; Gao, C.; Huang, L.; Bai, X.; Xie, L.; Gui, M.; Qiu, R.L. Heavy metals in human urine, foods and drinking water from an e-waste dismantling area: Identification of exposure sources and metal-induced health risk. Ecotoxicol. Environ. Saf. 2019, 169, 707–713. [Google Scholar] [CrossRef]
- Snoj Tratnik, J.; Falnoga, I.; Mazej, D.; Kocman, D.; Fajon, V.; Jagodic, M.; Stajnko, A.; Trdin, A.; Slejkovec, Z.; Jeran, Z.; et al. Results of the first national human biomonitoring in Slovenia: Trace elements in men and lactating women, predictors of exposure and reference values. Int. J. Hyg. Environ. Health 2019, 222, 563–582. [Google Scholar] [CrossRef]
- Mora, A.M.; Córdoba, L.; Cano, J.C.; Hernandez-Bonilla, D.; Pardo, L.; Schnaas, L.; Smith, D.R.; Menezes-Filho, J.A.; Mergler, D.; Lindh, C.H.; et al. Prenatal mancozeb exposure, excess manganese, and neurodevelopment at 1 Year of age in the infants’ environmental health (ISA) study. Environ. Health Perspect. 2018, 126, 057007. [Google Scholar] [CrossRef] [PubMed] [Green Version]
- Hoover, J.H.; Erdei, E.; Begay, D.; Gonzales, M.; NBCS Study Team; Jarrett, J.M.; Cheng, P.Y.; Lewis, J. Exposure to uranium and co-ocurring metals among pregnant Navajo women. Environ. Res. 2020, 190, 100943. [Google Scholar] [CrossRef]
- Li, C.; Wu, C.; Zhang, J.; Li, Y.; Zhang, B.; Zhou, A.; Liu, W.; Chen, Z.; Li, R.; Cao, Z.; et al. Associations of prenatal exposure to vanadium with early-childhood growth: A prospective prenatal cohort study. J. Hazard. Mater. 2021, 411, 125102. [Google Scholar] [CrossRef]
- Hu, J.; Xia, W.; Pan, X.; Zheng, T.; Zhang, B.; Zhou, A.; Buka, S.L.; Bassig, B.A.; Liu, W.; Wu, C.; et al. Association of adverse birth outcomes with prenatal exposure to vanadium: A population-based cohort study. Lancet Planet. Health 2017, 1, 230–241. [Google Scholar] [CrossRef]
- Wang, R.; Zhang, L.; Chen, Y.; Zhang, S.; Zhuang, T.; Wang, L.; Xu, M.; Zhang, N.; Liu, S. Elevated non-essential metals and the disordered metabolism of essential metals are associated to abnormal pregnancy with spontaneous abortion. Environ. Int. 2020, 144, 106061. [Google Scholar] [CrossRef] [PubMed]
- Kazi, T.G.; Afridi, H.I.; Kazi, N.; Jamali, M.K.; Arain, M.B.; Jalbani, N.; Kandhro, G.A. Copper, chromium, manganese, iron, nickel, and zinc levels in biological samples of diabetes mellitus patients. Biol. Trace Elem. Res. 2008, 122, 1–18. [Google Scholar] [CrossRef]
- Karakis, I.; Landau, D.; Yitshak-Sade, M.; Hershkovitz, R.; Rotenberg, M.; Sarov, B.; Grotto, I.; Novack, L. Exposure to metals and congenital anomalies: A biomonitoring study of pregnant Bedouin-Arab women. Sci. Total Environ. 2015, 517, 106–112. [Google Scholar] [CrossRef]
- Fang, X.; Qu, J.; Huan, S.; Sun, X.; Li, J.; Liu, Q.; Jin, S.; Xia, W.; Xu, S.; Wu, Y.; et al. Associations of urine metals and metal mixtures during pregnancy with cord serum vitamin D Levels: A prospective cohort study with repeated measurements of maternal urinary metal concentrations. Environ. Int. 2021, 155, 106660. [Google Scholar] [CrossRef]
- Rahman, A.; Kumarathasan, P.; Gomes, J. Infant and mother related outcomes from exposure to metals with endocrine disrupting properties during pregnancy. Sci. Total Environ. 2016, 569, 1022–1031. [Google Scholar] [CrossRef] [PubMed]
- Afeiche, M.; Peterson, K.E.; Sanchez, B.N.; Cantonwine, D.; Lamadrid-Figueroa, H.; Schnaas, L. Prenatal lead exposure and weight of 0- to 5-year-old children in Mexico City. Environ. Health Perspect. 2011, 119, 1436–1441. [Google Scholar] [CrossRef] [Green Version]
- Feng, H.; Han, X.; Zhang, W.; Yu, L. A preliminary study of heavy metal contamination in Yangtze River intertidal zone due to urbanization. Mar. Pollut. Bull. 2004, 49, 910–915. [Google Scholar] [CrossRef]
- Yi, Y.; Yang, Z.; Zhang, S. Ecological risk assessment of heavy metals in sediment and human health risk assessment of heavy metals in fishes in the middle and lower reaches of the Yangtze River basin. Environ. Pollut. 2011, 159, 2575–2585. [Google Scholar] [CrossRef] [PubMed]
- Hinwood, A.L.; Stasinska, A.; Callan, A.C.; Heyworth, J.; Ramalingam, M.; Boyce, M.; McCafferty, P.; Odland, J.O. Maternal exposure to alkali, alkali earth, transition and other metals: Concentrations and predictors of exposure. Environ. Pollut. 2015, 204, 256–263. [Google Scholar] [CrossRef] [PubMed]
- Huang, S.; Xia, W.; Li, Y.; Zhang, B.; Zhou, A.; Zheng, T.; Qian, Z.; Huang, Z.; Lu, S.; Chen, Z.; et al. Association between maternal urinary chromium and premature rupture of membranes in the Healthy Baby Cohort study in China. Environ. Pollut. 2017, 230, 53–60. [Google Scholar] [CrossRef] [PubMed]
- Sandstead, H. Zinc. In Handbook on the Toxicology of Metals, 4th ed.; Nordberg, G.F., Fowler, B.A., Nordberg, M., Eds.; Elsevier: Waltham, MA, USA, 2015; pp. 1369–1385. [Google Scholar]


| Metal Group | Element | FUE | Health-Based Reference Value | ||||||
|---|---|---|---|---|---|---|---|---|---|
| Value | Considerations | Ref. | Value | Type | Units | Considerations | Ref. | ||
| Essential metals | Co | 0.019 (mean of 2 values) | Mostly excreted in feces after oral administration Data of cumulative urinary excretion in studies with animals following oral administration of Co3O4. After inhalation or dermal exposure Co is mainly excreted in urine. | [53] | 30 | RfD | μg/kg/day | POD/30 | [54] |
| Cu | 0.018 (mean of 2 values) | Mostly excreted in bile after oral administration. Data of urinary excretion after daily intake. At high Cu intakes, urinary Cu excretion increases | [55] | 5 | UL (EFSA) | mg/day | NOAEL/2 | [56] | |
| Mn | NF | Mn is mainly excreted in feces. Urinary excretion of Mn is not related with oral intake | [57] | NF | NF | NF | Owing to limitations of the human data and the non-availability of NOAELs, upper level cannot be set | [54] | |
| V | 0.009 | Study with rats. Data of 7-day cumulative excretion after oral administration as sodium metavanadate. Mostly excreted unabsorbed in feces after oral administration. After inhalation V is mainly excreted in urine. | [58] | 1.8 | UL | mg/day | UL for ≥19 years (LOAEL/300) Due to lack of data, it was not possible to determine ULs for pregnant and lactating women, children, and infants. These individuals should be particularly cautious about consuming vanadium supplements. | [59] | |
| Zn | NA | NA | NA | 159 (204) | BE for deficiency | μg/L (μg/g) | Based on IOM EAR (nutritional) for women (0.1 mg/kg/day) | [46] | |
| 439 (564) and 1316 (1693) | BE and BEPOD for toxicity | μg/L (μg/g) | ATSDR chronic MRL (0.3 mg/kg/day) 1 | ||||||
| Toxic metals 2 | Ba | NA | NA | NA | 192 (5.74) | BE (BEPOD) | μg/L (mg/L) | Based on U.S. EPA’s RfD (0.2 mg/kg/day) | [47] |
| 246 (7.39) | μg/g (mg/g) | ||||||||
| Cs | 0.10 (mean of 2 values) 3 | Data of 7-day cumulative excretion after oral administration as cesium chloride | [60] | NF | NF | NF | NF | NF | |
| Ni | 0.04 (24 h) | Based on ingested dose of Ni chloride in rats | [61] | 13 | TDI | μg/kg/day | Oral exposure | [62] | |
| Pb | 0.12 (24 h) | Based on ingested dose. Mostly excreted in feces. | [63] | 0.63 | BMDL10 | μg/kg/day | Renal Effects, oral exposure | [43] | |
| Pt | 0.51 (mean of 2 values, 24 h) | Approximation. Based on diet studies. | [63] | 2.6 | PDE | μg/kg/day | Oral exposure | [64] | |
| Sb | 0.55 (mean of 2 values, 24 h) | Based on intravenous injection in humans | [65] | 0.4 | RfD | μg/kg/day | Hematologic, oral exposure | [66] | |
| Th | 0.025 (24 h) | Mostly excreted in feces | [67] | NF | NF | NF | NF | NF | |
| Al | NA | NA | NA | 57 (20500) | BE (BEPOD) | μg/L, μg/g | Based on LOAEL (50 mg/kg/day) | [48] | |
| U | 0.05 (24 h) | Based on ingested dose. Mostly excreted in feces. | [68] | 0.6 | TDI | μg/kg/day | Oral exposure | [69] | |
| Element | DF % | Minimum | P25 | Median | AM | GM | P75 | P95 | Maximum | SD |
|---|---|---|---|---|---|---|---|---|---|---|
| Al | 100 | 2.9 (2.2) | 9 (8) | 12 (12) | 15(16) | 12 (12) | 15 (17) | 29 (32) | 164 (139) | 17 (18) |
| Ba | 100 | 0.13 (0.09) | 1.2 (1.1) | 2.0 (1.9) | 2.7 (2.6) | 1.9 (1.9) | 3.0 (3.5) | 7.3 (7.0) | 17.2 (12.9) | 2.7 (2.2) |
| Be | 32 | 0.002 (0.002) | 0.006 (0.005) | 0.008 (0.009) | 0.01 (0.01) | 0.009 (0.009) | 0.01 (0.01) | 0.02 (0.03) | 0.03 (0.04) | 0.007 (0.009) |
| Co | 100 | 0.2 (0.3) | 0.6 (0.6) | 0.8 (0.8) | 1.0 (1.0) | 0.8 (0.9) | 1.2 (1.1) | 2.4 (2.1) | 4.7 (3.1) | 0.8 (0.5) |
| Cs | 100 | 1.1 (1.6) | 3 (3) | 4 (4) | 5 (4) | 4 (4) | 6 (5) | 10 (8) | 15 (15) | 3 (2) |
| Cu | 100 | 9 (15) | 24 (28) | 35 (35) | 43 (40) | 35 (35) | 53 (41) | 79 (66) | 400 (268) | 42 (28) |
| Mn | 100 | 0.02 (0.04) | 0.4 (0.3) | 0.5 (0.5) | 0.6 (0.6) | 0.5 (0.5) | 0.7 (0.7) | 1.4 (1.4) | 2.4 (3.4) | 0.4 (0.5) |
| Ni | 100 | 0.8 (1.0) | 3 (3) | 4 (4) | 6 (5) | 4 (4) | 6 (6) | 14 (10) | 38 (42) | 5 (5) |
| Pb | 99 | 0.02 (0.02) | 0.5 (0.6) | 0.8 (0.9) | 1.0 (0.9) | 0.8 (0.8) | 1.3 (1.1) | 1.9 (1.6) | 3.2 (2.6) | 0.6 (0.4) |
| Pt | 81 | 0.001 (0.001) | 0.007 (0.005) | 0.01 (0.01) | 0.02 (0.02) | 0.01 (0.01) | 0.02 (0.02) | 0.07 (0.05) | 0.21 (0.11) | 0.02 (0.02) |
| Sb | 97 | 0.007 (0.009) | 0.05 (0.05) | 0.10 (0.09) | 0.12 (0.11) | 0.09 (0.09) | 0.16 (0.15) | 0.27 (0.23) | 0.55 (0.29) | 0.09 (0.06) |
| Th | 98 | 0.01 (0.02) | 0.04 (0.04) | 0.14 (0.13) | 0.17 (0.19) | 0.12 (0.12) | 0.23 (0.26) | 0.43 (0.54) | 1.12 (0.80) | 0.16 (0.18) |
| U | 100 | 0.005 (0.006) | 0.02 (0.02) | 0.02 (0.02) | 0.03 (0.03) | 0.02 (0.02) | 0.03 (0.03) | 0.06 (0.07) | 0.13 (0.09) | 0.02 (0.02) |
| V | 79 | 0.004 (0.004) | 0.09(0.10) | 0.3 (0.3) | 0.4 (0.3) | 0.2 (0.2) | 0.5 (0.4) | 0.84 (0.89) | 1.92 (2.91) | 0.31 (0.36) |
| Zn | 100 | 71 (80) | 230 (250) | 343 (353) | 417 (389) | 347 (348) | 560 (491) | 848 (705) | 1526 (1078) | 259 (184) |
| Metals | Factors | Estimated Coefficients (95% CI) | Standard Error | p-Value 1 |
|---|---|---|---|---|
| Cs | Place of residence (last 10 years): | |||
| Urban | - | - | - | |
| Rural | −0.1913 (−0.3659–−0.0168) | 0.088 | 0.032 | |
| Creatinine (mg/dL) | 0.9526 (0.7998–1.1055) | 0.0771 | <0.001 | |
| Ni | Legumes (nº portions 72 h) | 0.1586 (0.0335–0.2836) | 0.0631 | 0.013 |
| Creatinine (mg/dL) | 0.6844 (0.4693–0.8996) | 0.1085 | <0.001 | |
| Cu | Fish (nº portions 72 h) | 0.146 (0.0433–0.2488) | 0.0518 | 0.006 |
| Creatinine (mg/dL) | 0.8887 (0.7246–1.0529) | 0.0828 | <0.001 | |
| Ba | Shellfish (nº portions 72 h) | 0.355 (0.0695–0.6405) | 0.144 | 0.015 |
| Creatinine (mg/dL) | 0.6113 (0.2779–0.9447) | 0.1682 | <0.001 | |
| Co | Creatinine (mg/dL) | 0.8458 (0.6641–1.0276) | 0.0917 | <0.001 |
| Mn | Creatinine (mg/dL) | 0.3297 (0.0889–0.5706) | 0.1215 | 0.008 |
| Pb | Creatinine (mg/dL) | 0.9146 (0.6654–1.1638) | 0.1257 | <0.001 |
| Sb | Creatinine (mg/dL) | 0.9212 (0.6642–1.1782) | 0.1297 | <0.001 |
| V | Creatinine (mg/dL) | 0.5437 (0.1082–0.9792) | 0.2197 | 0.015 |
| Zn | Creatinine (mg/dL) | 0.7762 (0.5853–0.9672) | 0.0963 | <0.001 |
| U | Creatinine (mg/dL) | 0.4267 (0.2349–0.6186) | 0.0968 | <0.001 |
| Group | Metal | EDI Based on Volume (μg/kg/day) | EDI Based on Creatinine (μg/kg/day) | ||
|---|---|---|---|---|---|
| EDIGM | EDIP95 | EDIGM | EDIP95 | ||
| Essential metals 1 | Co | 1.2 | 3.4 | 0.77 | 1.87 |
| Cu | 54 | 120 | 35 | 64 | |
| V | 0.6 | 2.5 | 0.4 | 1.7 | |
| Toxic metals 2 | Cs | 1.1 | 2.6 | 0.68 | 1.69 |
| Ni | 2.9 | 9.3 | 1.8 | 4.5 | |
| Pb | 0.18 | 0.43 | 0.11 | 0.23 | |
| Pt | 0.0005 | 0.0037 | 0.0003 | 0.0017 | |
| Sb | 0.004 | 0.013 | 0.003 | 0.007 | |
| Th | 0.13 | 0.46 | 0.08 | 0.29 | |
| U | 0.011 | 0.032 | 0.007 | 0.024 | |
| Study | Country (Location) | Year | Population/ Subjects | N | Age (Years) | AM | GM | |
|---|---|---|---|---|---|---|---|---|
| Essential Elements | ||||||||
| Cu | ||||||||
| Present study | Spain (Valencia) | 2015 | Women | 119 | 20–45 | 43.67 μg/L 39.60 μg/g creat | 35.36 μg/L 35.47 μg/g creat | |
| [19] | Japan (11 prefectures) | 2000–2005 | Women (n.o.) | 1000 | 20–81 | - | 13.4 μg/L | |
| [11] | Japan | 2007–2008 | Pregnant women | 78 | - | 12.8 μg/g creat | ||
| [16] | Canada (Quebec) | 2009–2011 | Women | 2992 | 6–79 | - | 10.0 μg/L | |
| [17] | Belgium | 2010–2011 | general population | 1022 | >18 | 6.94 μg/L | ||
| Co | ||||||||
| Present study | Spain (Valencia) | 2015 | Women | 119 | 20–45 | 1.04 μg/L 0.95 μg/g creat | 0.84 μg/L 0.85 μg/g creat | |
| [2] | Italy (urban areas) | - | Healthy subjects | 44 | - | 0.0009 μg/L | - | |
| Mn | ||||||||
| Present study | Spain (Valencia) | 2015 | Women | 119 | 20–45 | 0.60 μg/L 0.62 μg/g creat | 0.49 μg/L 0.49 μg/g creat | |
| [77] | Pakistan | 1999–2005 | Women | 166 | 45–75 | 1.55 μg/L | - | |
| [19] | Japan (11 prefectures) | 2000–2005 | Women (n.o.) | 1000 | 20–81 | - | 0.14 μg/L | |
| [73] | NHANES (USA) | 2011–2016 | Women | - | 14–45 | - | 0.14 μg/g creat | |
| [73] | New Mexico (USA) | 2010 | Pregnant women | 448 | 14–45 | - | 0.30 μg/g creat | |
| [18] | Riyadh (Saudi Arabia) | 2011–2013 | Lactating women | 198 | 19–45 | - | 2.42 μg/L | |
| Zn | ||||||||
| Present study | Spain (Valencia) | 2015 | Women | 119 | 20–45 | 417.29 μg/L 388.74 μg/g creat | 347.25 μg/L 348.30 μg/g creat | |
| [2] | Italy (urban areas) | - | Healthy subjects | 44 | - | 0.0012 μg/L | - | |
| [17] | Belgium | 2010–2011 | General population | 1022 | >18 | - | 227 μg/L | |
| [11] | Japan | 2007–2008 | Pregnant women | 78 | - | 393 μg/g creat | ||
| [16] | Canada (Quebec) | 2009–2011 | women | 2992 | 6–79 | - | 250 μg/L | |
| V | ||||||||
| Present study | Spain (Valencia) | 2015 | Women | 119 | 20–45 | 0.35 μg/L 0.34 μg/g creat | 0.20 μg/L 0.21 μg/g creat | |
| [5] | Israel | 2011–2013 | Bedouin Arab mothers | 111 | 18–41 | - | 0.04 μg/L | |
| [74] | China | 2014–2016 | Pregnant women | 1865 | 24–35 | 0.77 μg/L 0.79 μg/g creat | - | |
| [3] | France | 2011 | Pregnant women | 990 | >18 | - | 0.28 μg/L | |
| Non-essential elements | ||||||||
| Al | ||||||||
| Present study | Spain (Valencia) | 2015 | Women | 119 | 20–45 | 15.09 μg/L 16.30 μg/g creat | 12.36 μg/L 12.47 μg/g creat | |
| [78] | Israel | 2013 | 140 | >18 | - | 7.6 μg/L | ||
| Sb | ||||||||
| Present study | Spain (Valencia) | 2015 | Women | 119 | 20–45 | 0.12 μg/L 0.10 μg/g creat | 0.09 μg/L 0.08 μg/g creat | |
| [2] | Italy (urban areas) | - | Healthy subjects | 44 | - | 0.003 μg/L | - | |
| [3] | France | 2011 | Pregnant women | 990 | >18 | - | 0.04 μg/L | |
| [4] | NHANES (USA) | 1999–2016 | Pregnant women | 404 | 15–44 | - | 0.079 μg/L 0.078 μg/g creat | |
| Ba | ||||||||
| Present study | Spain (Valencia) | 2015 | Women | 119 | 20–45 | 2.70 μg/L 2.61 μg/g creat | 1.87 μg/L 1.87 μg/g creat | |
| [5] | Israel | 2011–2013 | Bedouin Arab mothers | 111 | 18–41 | - | 1.29 μg/L | |
| [6] | Puerto Rico | 2011–2017 | Pregnant women | 1285 | 18–40 | - | 2.5 μg/L | |
| [4] | NHANES (USA) | 1999–2016 | Pregnant women | 404 | 15–44 | - | 2.01 μg/L 2.00 μg/g creat | |
| Be | ||||||||
| Present study | Spain (Valencia) | 2015 | Women | 119 | 20–45 | 0.01 μg/L 0.01 μg/g creat | <LoQ | |
| [5] | Israel | 2011–2013 | Bedouin Arab mothers | 111 | 18–41 | - | 0.11 μg/L | |
| Cs | ||||||||
| Present study | Spain (Valencia) | 2015 | Women | 119 | 20–45 | 4.88 μg/L 4.51 μg/g creat | 4.16 μg/L 4.17 μg/g creat | |
| [2] | Italy (urban areas) | - | healthy subjects | 44 | - | 0.0054 μg/L | - | |
| Pb | ||||||||
| Present study | Spain (Valencia) | 2015 | Women | 119 | 20–45 | 0.97 μg/L 0.91 μg/g creat | 0.79 μg/L 0.79 μg/g creat | |
| [7] | China | 2012–2014 | Pregnant women | 800 | - | 6.35 μg/L 13.67 μg/g creat | 3.35 μg/L 7.99 μg/g creat | |
| [8] | China | 2009–2010 | General population | 1647 | 6–60 | - | 2.85 μg/L | |
| [9] | USA | 2003–2010 | Pregnant women | 1565 | 17–39 | - | 0.63 μg/L | |
| [10] | USA | 2003–2004 | Pregnant women | 268 | 15–44 | - | 0.81 μg/L | |
| [11] | Japan | 2007–2008 | Pregnant women | 78 | - | 1.19 μg/g creat | 0.48 μg/g creat | |
| [12] | Australia | 2008–2010 | Pregnant women | 157 | 19–44 | 0.66 μg/L 13.67 μg/g creat | - | |
| [13] | Spain (Catalonia) | 2004–2006 | Pregnant women | 489 | >16 | 5.2 μg/g creat | - | |
| [14] | Nigeria | 2006–2008 | Pregnant women | 214 | 17–49 | 28.5 μg/g creat | - | |
| [15] | USA | 2011–2012 | Women | 1242 | >20 | - | 0.316 μg/L 0.430 μg/g creat | |
| [16] | Canada (Quebec) | 2009–2011 | Adults | 5738 | 6–79 | - | 0.52 μg/L | |
| [17] | Belgium | 2010–2011 | Adults (n.o.) | 1022 | >18 | 0.74 μg/L | 15.4 μg/L | |
| [18] | Riyadh (Saudi Arabia) | 2011–2013 | Lactating women | 204 | 19–45 | - | 5.04 μg/L | |
| Ni | ||||||||
| Present study | Spain (Valencia) | 2015 | Women | 119 | 20–45 | 5.52 μg/L 5.38 μg/g creat | 4.41 μg/L 4.42 μg/g creat | |
| [2] | Italy (urban areas) | - | healthy subjects | 44 | - | 0.047 μg/L | ||
| [19] | Japan (11 prefectures) | 2000–2005 | Women (n.o) | 1000 | 20–81 | - | 2.1 μg/L | |
| [16] | Canada (Quebec) | 2009–2011 | Adults | 2992 | 6–79 | - | 1.30 μg/L | |
| [20] | France | 2006–2007 | Adults | 2000 | 18–74 | - | 1.23 μg/L | |
| [17] | Belgium | 2010–2011 | Adults (n.o) | 1022 | >18 | - | 1.73 μg/L | |
| Pt | ||||||||
| Present study | Spain (Valencia) | 2015 | Women | 119 | 20–45 | 0.02 μg/L 0.02 μg/g creat | 0.01 μg/L 0.01 μg/g creat | |
| Th | ||||||||
| Present study | Spain (Valencia) | 2015 | Women | 119 | 20–45 | 0.17 μg/L 0.19 μg/g creat | 0.12 μg/L 0.12 μg/g creat | |
| [79] | China | 2014–2015 | Pregnant women | 598 | >20 | 0.17 μg/L | ||
| U | ||||||||
| Present study | Spain (Valencia) | 2015 | Women | 119 | 20–45 | 0.03 μg/L 0.03 μg/g creat | 0.02 μg/L 0.02 μg/g creat | |
| [73] | NHANES (USA) | 2011–2016 | Women | - | 14–45 | - | 0.006 μg/g creat | |
| [73] | New Mexico (USA) | 2010 | Pregnant women | 449 | 14–45 | - | 0.016 μg/g creat | |
Publisher’s Note: MDPI stays neutral with regard to jurisdictional claims in published maps and institutional affiliations. |
© 2021 by the authors. Licensee MDPI, Basel, Switzerland. This article is an open access article distributed under the terms and conditions of the Creative Commons Attribution (CC BY) license (https://creativecommons.org/licenses/by/4.0/).
Share and Cite
Sáez, C.; Sánchez, A.; Yusà, V.; Dualde, P.; Fernández, S.F.; López, A.; Corpas-Burgos, F.; Aguirre, M.Á.; Coscollà, C. Health Risk Assessment of Exposure to 15 Essential and Toxic Elements in Spanish Women of Reproductive Age: A Case Study. Int. J. Environ. Res. Public Health 2021, 18, 13012. https://doi.org/10.3390/ijerph182413012
Sáez C, Sánchez A, Yusà V, Dualde P, Fernández SF, López A, Corpas-Burgos F, Aguirre MÁ, Coscollà C. Health Risk Assessment of Exposure to 15 Essential and Toxic Elements in Spanish Women of Reproductive Age: A Case Study. International Journal of Environmental Research and Public Health. 2021; 18(24):13012. https://doi.org/10.3390/ijerph182413012
Chicago/Turabian StyleSáez, Carmen, Alfredo Sánchez, Vicent Yusà, Pablo Dualde, Sandra F. Fernández, Antonio López, Francisca Corpas-Burgos, Miguel Ángel Aguirre, and Clara Coscollà. 2021. "Health Risk Assessment of Exposure to 15 Essential and Toxic Elements in Spanish Women of Reproductive Age: A Case Study" International Journal of Environmental Research and Public Health 18, no. 24: 13012. https://doi.org/10.3390/ijerph182413012