Article

Concept Evolution and Multi-Dimensional Measurement Comparison of Urban Energy Performance from the Perspective of System Correlation: Empirical Analysis of 142 Prefecture Level Cities in China

School of Economics and Management, Taiyuan University of Technology, Taiyuan 030024, China
*
Author to whom correspondence should be addressed.
Int. J. Environ. Res. Public Health 2021, 18(24), 13046; https://doi.org/10.3390/ijerph182413046
Submission received: 14 October 2021 / Revised: 4 December 2021 / Accepted: 6 December 2021 / Published: 10 December 2021
(This article belongs to the Section Environmental Earth Science and Medical Geology)

Abstract

:
In order to clarify the evolution characteristics and direction of urban energy performance concepts, reveal the research dimensions, determine the performance results and differences, and clarify the reference benchmark, this study depicts the main systems involved in the process of urban energy utilization, demonstrates their relevance guided by the system view, and proposes the measurement indicators in the economic, environmental, and well-being dimensions. The measurement model of each dimension is constructed using the corresponding models of Data Envelopment Analysis. Taking 142 prefecture level cities in China as examples, the energy performance in different dimensions is measured and compared. The energy performance levels are close in the economic and environmental dimensions. However, the results of the well-being dimension are different from these first two dimensions, and the performance levels among cities differ more. In the economic, environmental, and well-being dimension, 22, 28 and 16 cities have reached the effective frontier, respectively, and the performance benchmark cities of 15, 15 and 5 provinces are non-provincial capital cities, respectively. Based on the above analysis, the “chain” framework evolution direction of concept and measurement is proposed, and this study provides benchmarks and policy suggestions to improve energy performance.

1. Introduction

As the mainstay of urban development, energy provides great power for urban production and societal activity. With the rapid advancement of industrialization, urban economy has achieved rapid growth [1]. However, along with economic growth, there are problems such as ineffective energy utilization and excessive energy consumption, resulting in insufficient energy supply and a decline in environmental quality [2]. According to the statistics, although the urban area accounts for only 2% of the world’s total area, the energy consumption and the greenhouse gas emissions of cities have accounted for about 75% and 80% of the world’s energy consumption and greenhouse gas emissions, respectively [3]. China’s population weighted average PM2.5 concentration ranked first among the world’s most populous countries, and has increased significantly from 1990 to 2010 [4]. In 2017, less than one third of China’s prefecture level cities met the air quality standards [5]. The pollution is more serious in winter, as there is a black and odorous water body near the city. Traditional and new environmental problems occur frequently [6,7,8].
As a result of urban production and living, and industrial and traffic environmental pollution [9], cities will face greater pressure in ecological construction and sustainable development. The safety, health, life satisfaction, life quality and well-being of urban residents [10] have gradually become the focus of attention [11]. The Global Air State Report of 2019 pointed out that about five million people died of air pollution worldwide and China’s mortality rate ranked among the top 10 countries in the world in 2017 [12]. It can be evidenced that urban energy is closely related to urban economic development, environmental pollution, and well-being levels [13]. Urban energy utilization is reflected in various related subsystems of urban circular operations and developments [14,15]. Furthermore, urban energy utilization has affected the well-being level to a certain extent, and it is imperative to improve urban energy performance. Therefore, studying the concept and measurement results of urban energy performance from the perspective of system correlation is necessary in order to find ways to improve urban energy performance and determine future research directions.
This study was carried out in order to clarify the evolution characteristics and direction of the urban energy performance concept, reveal the research dimensions, determine the performance results and differences, and clarify the reference benchmark. The main contributions of this study are reflected in the following aspects: firstly, guided by the system view, this paper explains the concept evolution of urban energy performance and proposes the main dimensions of urban energy performance based on an in-depth analysis of the association network of the urban energy utilization system and existing research results. Secondly, combined with the basic characteristics of each dimension, this paper constructs the measurement indicator system and measurement model of urban energy performance in different dimensions. Thirdly, through the comparison and analysis of the energy performance measurement results of China’s prefecture level cities in different dimensions, the specific levels and overall differences in energy performance are clarified, and the benchmark cities for improving energy performance in a single dimension and multiple dimensions in China’s provinces are determined in order to provide a reference for cities around the world on how to improve their energy performance. Finally, the “chain” framework evolution direction of the concept and measurement of urban energy performance is proposed. It highlights the intermediate roles of economic output and environmental pollution. Thus, it considers the energy performance of the economic and environmental dimensions on the premise of ultimately improving the well-being level.

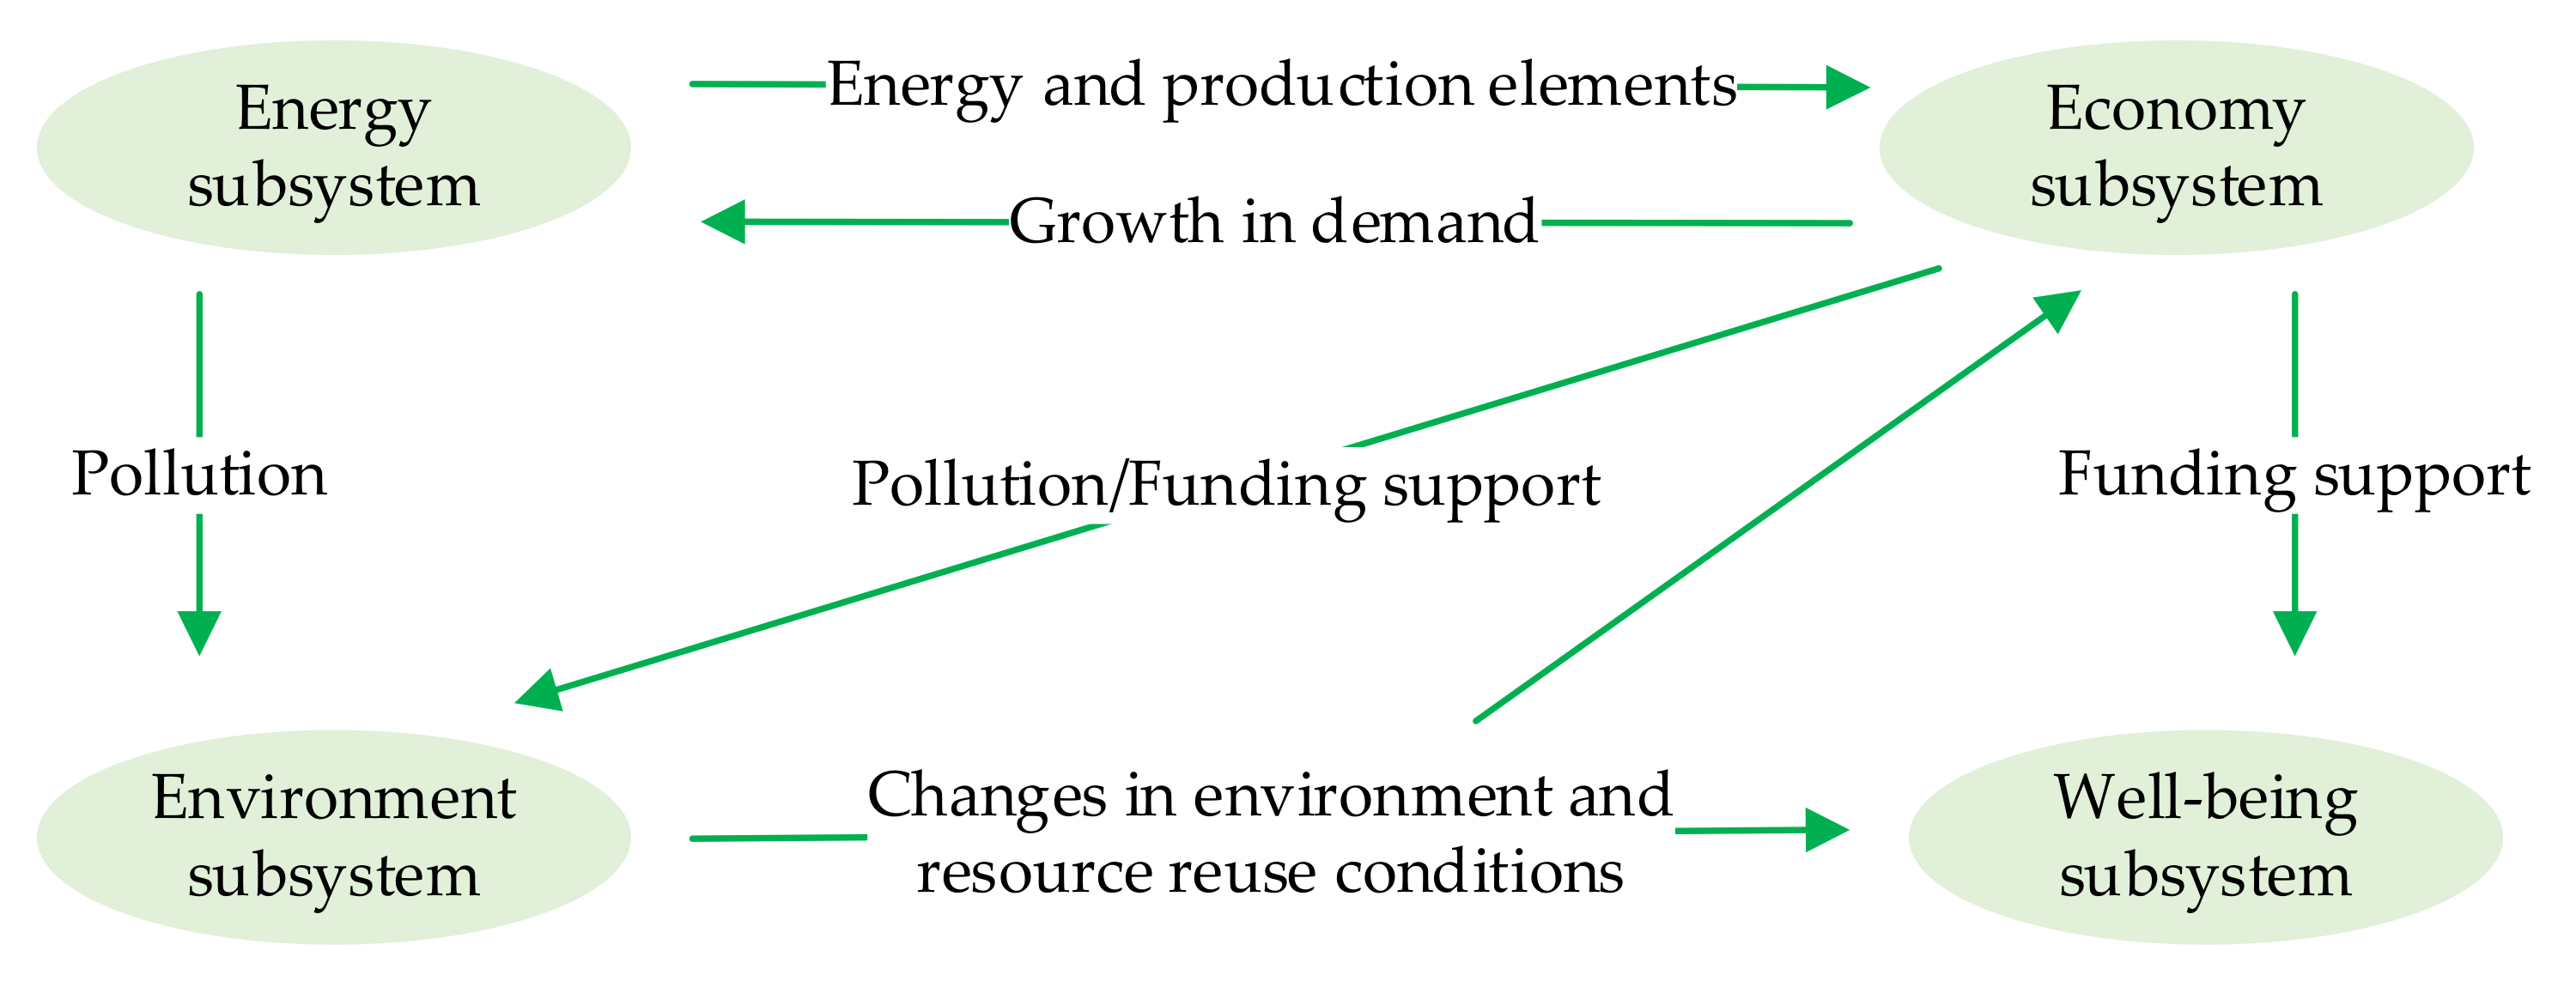
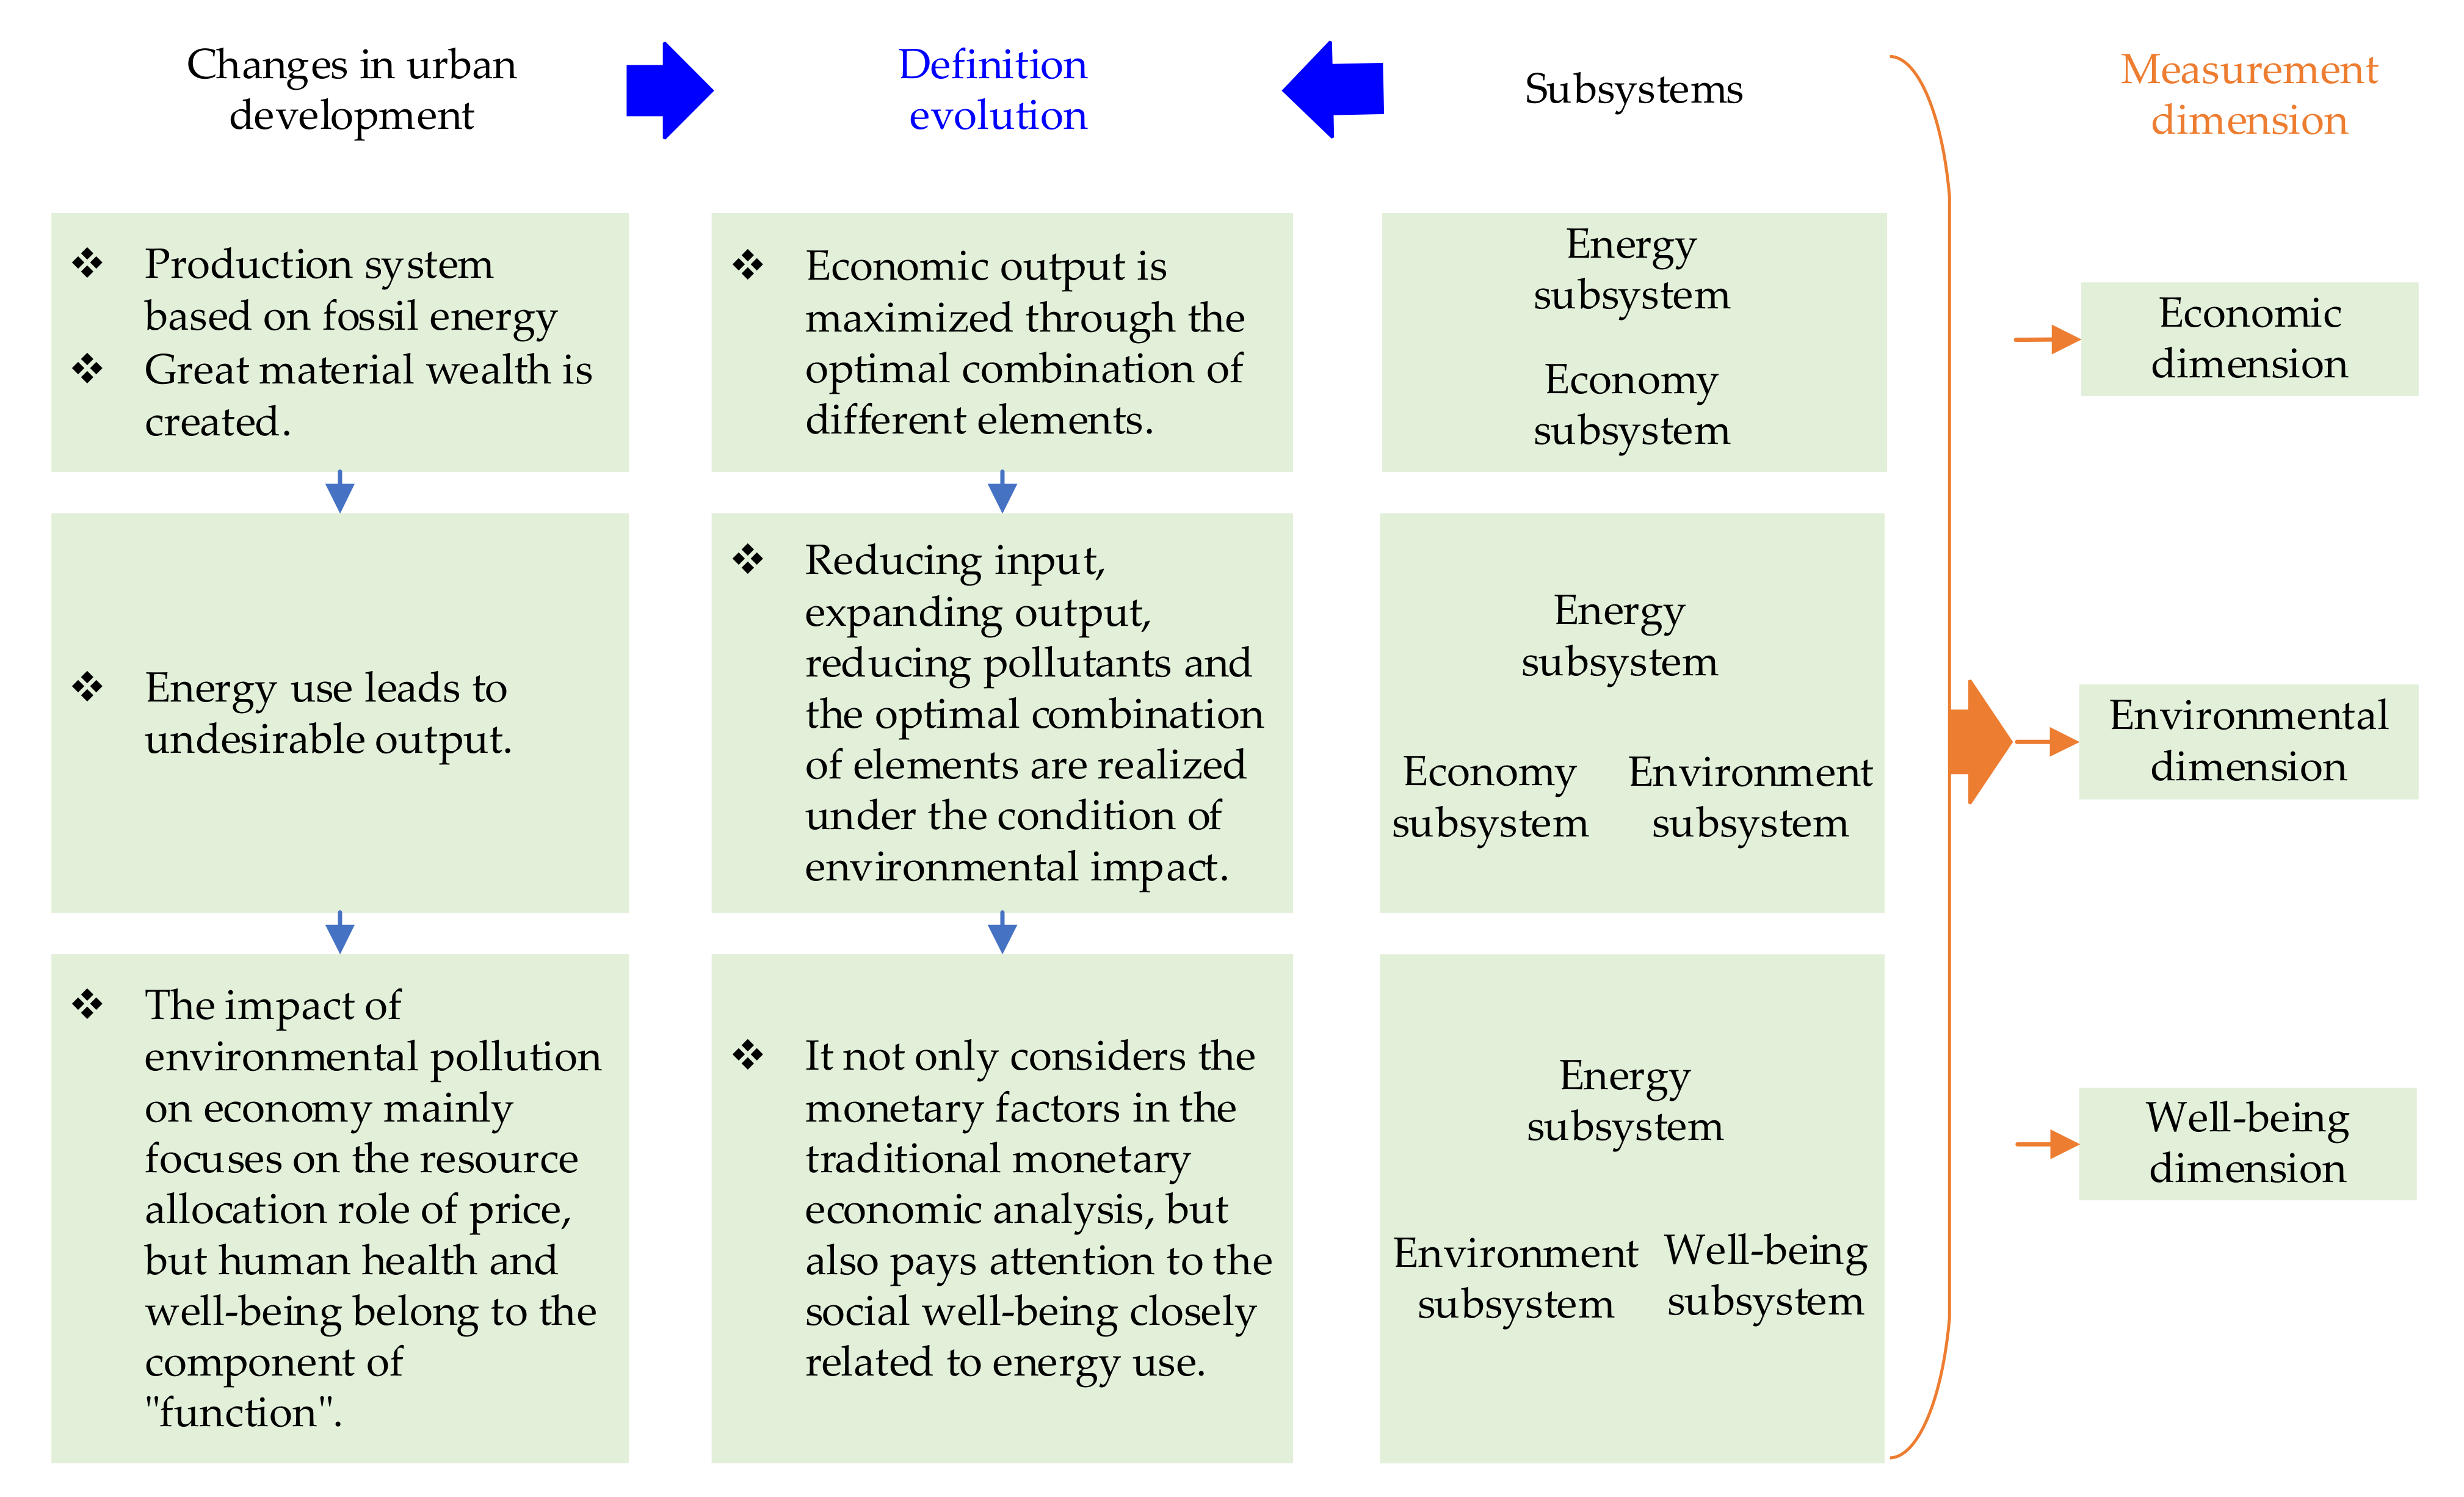
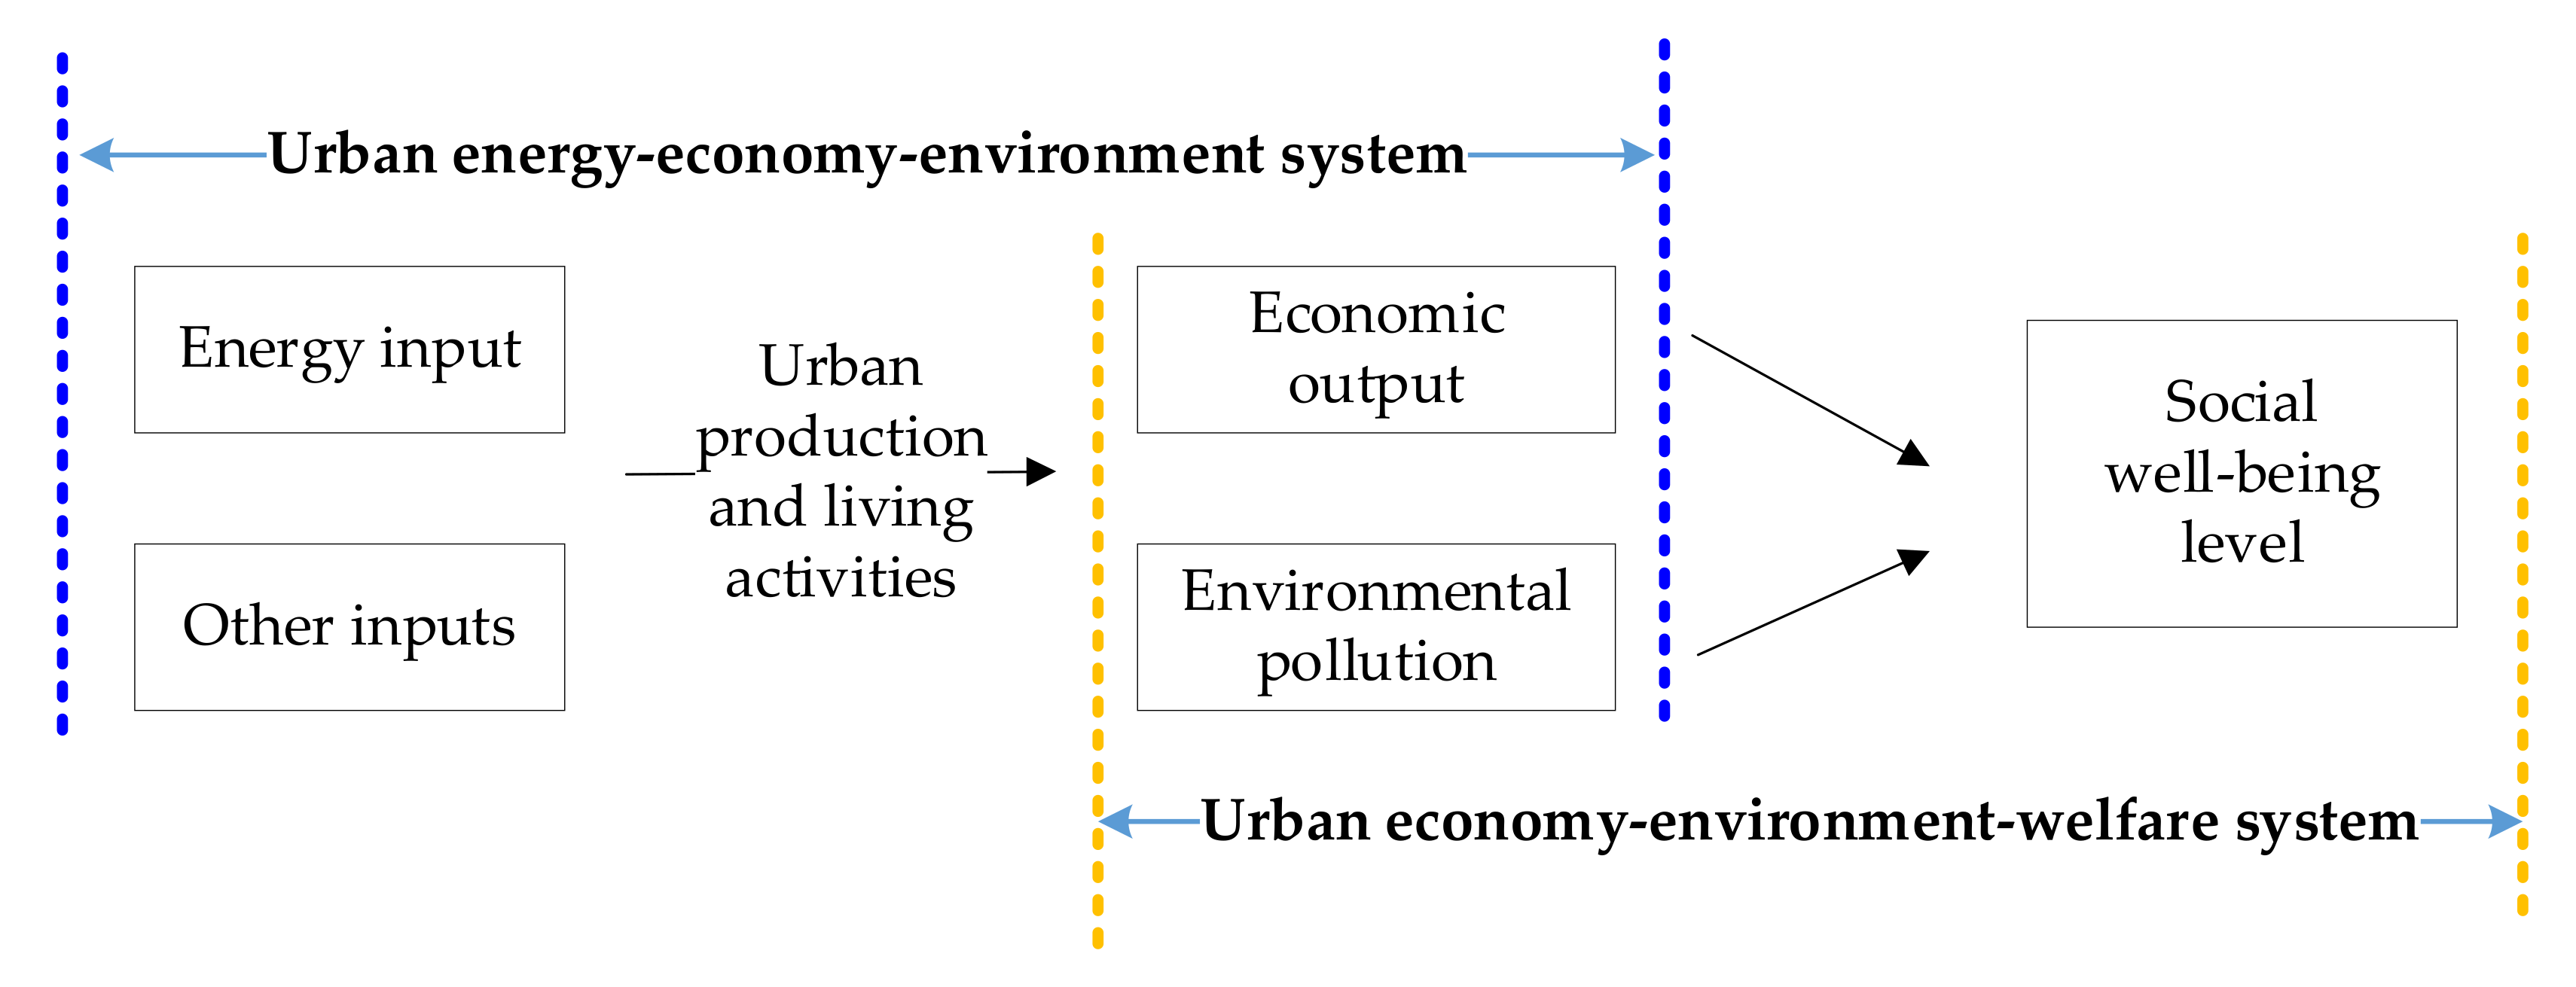
2. Conceptual Evolution of Urban Energy Performance from the Perspective of System Correlation

Since the introduction of the growth limit theory, energy, the economy, and the environment have attracted increasing attention and have gradually developed into a related binary theoretical system. Since the 1980s, the concept of sustainable development has been continuously improved. Furthermore, research focused on the three aforementioned aspects, such that the “energy-economy-environment” framework (i.e., “3E” system research framework) was established [16]. On this basis, scholars developed the “economy-society-ecology” composite system and integrated the social subsystem into the “3E” framework [17], which had something in common with the eco-city theory, which emphasized the reciprocal symbiosis of people, nature and city [18], transformed the focuses from land, transportation and species diversity to economy, law, social equity, lifestyle and public awareness, and extended to the well-being subsystem. Therefore, combined with the above analysis, it is concluded that urban energy utilization would have an impact on multiple urban subsystems, as shown in Figure 1.
The energy subsystem provides important energy and production elements for the economy subsystem and supports its development [19,20,21]. However, when energy use forms economic outputs, the pollution produced has an adverse impact on the environment subsystem [22]. The development of the economy subsystem increases energy demand, but it also provides effective support for environmental governance [23] and the improvement of social well-being levels. Environmental governance and environmental pollution would lead to both positive and negative changes in environment [24] and resource reuse conditions, which would affect the economy subsystem [25] and the well-being subsystem [26].
Following the above system correlation diagram, this paper analyzes the conceptual evolution of urban energy performance based on the current research results of urban energy performance. The concept of energy performance originated from research on the concept of energy efficiency. From the late 1970s, energy efficiency was a topical research issue. Energy efficiency was generally expressed by the ratio of energy service output to energy input [27]. Some scholars believe that energy efficiency is a relative concept, which must be quantified by certain indicators in order to change energy efficiency. Furthermore, the initial concept of energy performance was defined as using less energy to produce the same amount of services or useful outputs [28,29]. Thus, the determination of “output” has become a key element in defining energy performance.
After the industrial revolution, the production system based on fossil energy created great wealth. Energy became an important production element in human production activities and could be used to produce products by combining with capital, labor, and other production elements [29]. Therefore, the measurement of energy performance initially focused on economic outputs. However, due to the change of development environment and the fact that most traditional energy is nonrenewable, the development mode relying on element input is difficult to achieve sustainable growth. Thus, “Schumpeter growth” with structural transformation and technological innovation as the main driving forces was chosen. It could be concluded that energy economic performance is the initial category of the concept of energy performance. The purpose of energy economic performance is mainly to maximize economic output through the optimal combination of different elements such as capital input, labor input, and energy input [30], and it achieves this purpose by means of structural transformation, technological innovation, the optimization of economic development mode, and changes in other elements affecting economic growth. Accordingly, when economists analyzed energy performance, energy input was regarded as one of a variety of inputs [31], and the role of input element substitution in realizing energy performance was considered [32]. Therefore, the relative performance is mainly analyzed according to the distance between the samples and the production frontier. The definition and measurement of energy performance reveal the relationships between the energy subsystem and the economic subsystem.
In the above definitions, production elements such as capital, labor, and energy are considered as constraints when defining urban energy performance. However, the pollutants generated by energy use are ignored, and thus the undesirable output and environmental impact caused by energy use are also ignored [33,34,35]. The inefficiency of production technology leads to the generation of pollutants, and environmental performance is determined by pollutant emission reduction and its cost. Therefore, research on how pollutant emission reduction affected output began, and a model based on directional distance function was proposed [36]. The model effectively fitted the restrictive role of environmental impact in production, and made it possible to study the real effect of environmental impact [37,38]. To date, the research on energy performance has focused on multiple-inputs and multiple-outputs. The environmental production function and environmental directional distance function are integrated into the exploration of environmental performance in the production process, in order to reduce input, expand output, reduce pollutants, and realize the optimal combination of elements under this condition [39]. The definition and measurement of energy performance are extended from the impact on the economic subsystem to the impact on the environmental subsystem.
The traditional well-being economics of utility theory pointed out that consumer surplus could be used to reflect the level of social well-being, thus, the scheme that can increase consumer surplus may become Pareto optimal, which reflects the significance and idea of improving energy performance. Ecological environment is a typical public good with the characteristics of non-exclusivity, externality, non-competitiveness, and unclear property rights. Energy resources also belong to public goods in terms of use [40]. Thus, the consumption of natural capital may be higher than the best social consumption value [41]. Existing studies have focused on the impact of environmental pollution on economy, such as ecological compensation [42], green GDP estimation [43], and other related studies. These studies mainly focus on the resource allocation role of price, but human health and well-being belong to the component of “function”, which is different not only from the concept of commodity, but also from the concept of utility. Therefore, urban energy performance evaluation should not only consider the monetary factors in the traditional well-being economic analysis, but also integrate the well-being level into the research, in order to ensure the urban energy performance indicators have stronger explanatory power. Therefore, the definition and measurement of energy performance are related to the well-being subsystem.
Based on different social backgrounds and theoretical foundations, scholars have proposed the corresponding concept of urban energy performance, but there are also the following research gaps: firstly, although with the increase in research depth, the reasonable energy performance concepts under different social backgrounds and theoretical basis have been put forward, the research dimensions of urban energy performance have not been determined. Secondly, because the research dimension has not been clearly determined, the actual measurement results of urban energy performance under different dimensions are unknown. It is difficult to find a benchmark city and focus to improve urban energy performance. Thirdly, based on the above review, it has been found that there are differences and connections in the concept of urban energy performance under different social backgrounds and theoretical bases. Therefore, it is necessary to further clarify the specific relationships and propose a new conceptual framework of urban energy performance. The solution of these research gaps makes up for the existing research results, thus it is novel. It not only develops effective dimensions and conceptual frameworks for future research on urban energy performance, but also objectively, accurately, and comprehensively reflects the performance results and promotion orientations of different cities and different dimensions, thus, it is of great significance.
Therefore, based on the above analysis, the concept evolution of urban energy performance is summarized, and then the main dimensions of urban energy performance measurement are determined, as shown in Figure 2.

3. Measurement Indicators and Models of Urban Energy Performance in Different Dimensions

The core research questions are to distinguish the conceptual evolution of urban energy performance from the perspective of system correlation and compare urban energy performance from multiple dimensions. Therefore, based on the above review and summary of the concept of urban energy performance, the measurement dimension of urban energy performance mainly includes three aspects: the economic dimension, the environmental dimension, and the well-being dimension. Furthermore, this section will determine the measurement indicators of urban energy performance under different dimensions in combination with literature review results, and then construct the measurement models of urban energy performance in different dimensions based on the corresponding model using the Data Envelopment Analysis method.
The urban energy performance measurement in the economic dimension tends to reflect the maximum economic output achieved under a certain energy input and other inputs. Moreover, the measurement in the existing research is mainly based on the energy input and other inputs required in production, as well as the output value that can be generated. In terms of urban energy performance measurement, the measurement indicators in the economic dimension mainly include energy consumption [44], fixed capital investment [45], labor input [46], and economic output [27]. This is a measurement indicator system based on the basic production function relationship and the total factor analysis framework.
The measurement of urban energy performance in the environmental dimension is also based on the total factor analysis framework, but it aims to achieve the optimal output. That is, it not only maximizes economic output, but also minimizes environmental impact. For the indicators, the input indicators still take energy consumption, fixed capital input and labor input as the input indicators. However, the output indicators include not only gross domestic product, but also carbon dioxide emissions [47], sulfur dioxide emissions [36,48], nitrogen oxides, chemical oxygen demand, solid waste generation [49], etc. Therefore, the measurement of urban energy performance in the environmental dimension not only reflects the expected output of urban energy utilization, but also covers the unexpected output.
The core meaning of the concept of urban energy performance in the well-being dimension is reflected in that urban development aims to improve the well-being level by a certain energy supply [50,51]. Therefore, scholars also choose energy consumption as the input indicator to measure energy performance from its fundamental meaning. However, some scholars believe that in order to improve the well-being level, cities would inevitably produce pollution emissions in the process of energy consumption, which is also the cost that cities need to pay when improving the well-being level [52]. Therefore, some scholars have added environmental pollution indicators (or environmental pressure indicators) to the input indicators, which are mostly expressed by urban “three wastes” (wastewater, waste gas, and solid waste) [52] or carbon emission [53,54]. In addition, in order to better reflect the capital utility invested to maintain ecological balance, Xiao and Zhang included environmental capital indicators, service-oriented capital indicators, and resource-based capital indicators in their research [55]. In terms of selecting output indicators, more scholars choose indicators based on the comprehensive consideration of medical and health level [56], educational level, and economic development level [57] in view of the integrity and availability of objective well-being indicator data [51,58]. Based on the above analysis, the input indicators selected in this study include energy consumption, environmental pollution, and environmental capital investment.
The summary of urban energy performance measurement indicators in different dimensions is shown in Figure 3.
From the above determined measurement indicators, it can be demonstrated that the measurement model of urban energy performance in different dimensions needs to meet different measurement requirements. In the environmental dimension and well-being dimensions particularly, it is necessary that the model can measure multi-output indicators and the unexpected output indicator. As an effective performance measurement method, Data Envelopment Analysis has been continuously improved and developed from many aspects since it was proposed in 1978, and it has formed an important methodology system that can effectively deal with a variety of outputs, a variety of returns to scale, relaxation measurements, super efficiency problems, mixed efficiency, non-discretionary, uncontrollable situations, classified demand, unexpected output, dynamic panel data, multi-stage situation, and other problems [59]. Therefore, this study will construct urban energy performance measurement models in different dimensions based on the Data Envelopment Analysis method and the corresponding measurement indicators.
The measurement of urban energy performance in the economic dimension aims to reflect the effect of urban energy utilization based on the basic production function. The return to scale of urban energy utilization is variable and is not in the most large-scale production state. Therefore, the construction of the urban energy performance measurement model in the economic dimension is based on the variable returns to scale radial Data Envelopment Analysis model [60].
It is supposed that there are n cities in the measurement. Each city has m inputs and q outputs. The ith input of the jth (j = 1, 2, …, n) city is expressed as xij (i = 1, 2, …, m), and the rth output of the jth city is expressed as yrj (r = 1, 2, …, q). The city to be measured is set as the kth city currently. Therefore, the measurement model of urban energy performance in the economic dimension could be set as [61]:
min   θ s . t .   j = 1 n λ j x i j θ x i k                 j = 1 n λ j y r j y r k                 j = 1 n λ j = 1                 λ 0                 i = 1 ,   2 ,   ,   m ;   r = 1 ,   2 ,   ,   q ;   j = 1 ,   2 ,   ,   n
In Equation (1), λ represents the linear combination coefficient of the decision-making unit. θ is the optimal solution of the model and it represents the efficiency value. Its value range is (0, 1]. The smaller θ is, the larger the reduction range is and the lower the efficiency is. When θ = 1, the decision-making unit is located on the optimal frontier. Under the condition of not reducing output, there is no room for the proportional decline of the decision-making unit’s inputs, and the decision-making unit is in a state of technical efficiency. If θ < 1, it is indicated that the decision-making unit is in the state of technical inefficiency. Under the condition of not reducing output, the proportion that each input of the decision-making unit can decrease in equal proportion is (1− θ ).
Based on the above analysis, the measurement of urban energy performance in the environmental dimension needs to reflect the unexpected output. Therefore, the measurement model is constructed based on the directional distance function [62]. In the environmental dimension, the input is set as H, the expected output is set as O, and the unexpected output is set as B, so the corresponding expected output vector is set as g o and the unexpected output vector is g b . The city to be measured is set as the lth city currently, thus the model is expressed as Equation (2):
max   β s . t . H δ + β g h h l                 O δ β g o o l                 B δ + β g b b l                 δ = 1                 δ 0 ,   g h 0 ,   g o 0 ,   g b 0
In Equation (2), − g h , g o , − g b are the direction vectors of input, the expected output, and the unexpected output, respectively, which means that the evaluated city aims to reduce input, increase expected output, and reduce unexpected output. β reflects the analysis results of directional distance function.
The urban energy performance measurement in the well-being dimension aims to reflect the impact of energy use on the well-being level. The above conceptual analysis and indicator determination also reflects the derived input indicators, namely environmental capital investment and environmental pollution. In this scenario, the return to scale of energy utilization in the well-being dimension is also variable. Therefore, the construction of the urban energy performance measurement model in the well-being dimension is still based on the variable returns to scale radial Data Envelopment Analysis model. It is supposed that there are a cities in the measurement. Each city has s inputs and t outputs. The dth input of the cth (c = 1, 2, …, a) city is expressed as udc (d = 1, 2, …, s), and the eth output of the cth city is expressed as vec (e = 1, 2, …, t). The city to be measured is set as the fth city currently. Therefore, the measurement model of urban energy performance in the well-being dimension could be set as [61]:
min   μ s . t .   c = 1 a φ c u d c μ u d f                 c = 1 a φ c v e c v e f                 c = 1 a φ c = 1                 φ 0                 d = 1 ,   2 ,   ,   s ;   e = 1 ,   2 ,   ,   t ;   c = 1 ,   2 ,   ,   a
In Equation (3), μ represents the linear combination coefficient of the decision-making unit. μ is the optimal solution of the model and it represents the efficiency value. Its value range is (0, 1]. The smaller μ is, the larger the reduction range is and the lower the efficiency is. When μ = 1, the decision-making unit is located on the optimal frontier. If μ < 1, it is indicated that the decision-making unit is in the state of technical inefficiency. Under the condition of not reducing output, the proportion that each input of the decision-making unit can decrease in equal proportion is (1 − μ ).
The measurement period of urban energy performance in this study is 2018. The performance differences between different cities in the same dimension are reflected by standard deviation, and the urban energy performance differences between different dimensions are obtained by comparing the measurement results, minimum values, mean values, and standard deviations of cities.

4. Multi-Dimensional Measurement Results and Discussion of Energy Performance of Prefecture Level Cities in China

4.1. The Range of Study Sample and the Variables of Indicators

Since the reform and opening up, China’s urbanization level has been continuously improved, from 17.92% in 1978 to 59.58% in 2018. The improvement in urbanization level has not only increased China’s energy consumption, but has also driven economic and social development and formed an impact on the environment, which fully reflects the correlated role of energy utilization in each subsystem and the positive and negative utilities caused by energy utilization in the process of urban development. Secondly, China’s primary energy consumption reached 24.7% of the global primary energy consumption in 2018 [52]. The emergence of ecological and environmental problems made people recognize the importance of improving energy performance [63], and also demonstrated the urgency of improving urban energy performance in China. Thirdly, China has a vast territory and a large number of cities which demonstrate differences in energy, economy, environment, society, and other aspects. The research on China’s prefecture level cities can fully reflect the multi-dimensional energy performance level of cities under different development situations and determine the energy performance level for different cities in the world, which provides an important reference for formulating energy performance improvement policies. Therefore, this study takes 142 prefecture level cities in China as samples to measure and compare their multi-dimensional energy performance.
In view of the availability of a large sample of urban indicator data and the characteristics of urban energy utilization, the effective variables are selected for urban energy performance measurement indicators in these three dimensions. As the energy consumption of urban development mainly focuses on industrial energy consumption, the energy consumption indicator in this study is reflected by the energy consumption of industrial enterprises above designated size. The labor input is expressed by the total number of employees in urban units and urban private and individual employees. In cities, industrial sulfur dioxide and industrial nitrogen oxides are the main sources of pollution, thus, the environmental pollution is expressed as the sum of the two emissions. However, the life expectancy and the years of education of residents in many cities are difficult to obtain. The measurement of urban education level is characterized by the years of education supply. The calculation method is shown in Equation (4) [64]:
W =   6 × p 1 + 9 × p 2 + 12 × p 3 + 16 × p 4 / p 1 + p 2 + p 3 + p 4
In Equation (4), W represents the educational capacity that the city can provide, that is, the years of education supply. p1, p2, p3, and p4 represent the number of students in ordinary primary schools, ordinary middle schools, secondary vocational education school, junior colleges, and universities, respectively. At present, there is no official data on the total investment in urban pollution control, and the investment in environmental control of each city is closely related to the economic level and the degree of environmental pollution. Therefore, the setting of the total investment in pollution control of each city in this study is mainly based on this principle and the investment in pollution control of each province in China. The medical and health level of a city is expressed according to the medical conditions that the city can provide, that is, the number of practicing (assistant) doctors. All data were collected from China Urban Statistical Yearbook, China Environmental Statistical Yearbook, and various urban statistical yearbooks. Some missing data were supplemented by interpolation methods and trend analysis methods. There is a descriptive statistical analysis on the indicator data of 142 sample cities in Table 1. It can be seen that the 142 prefecture level cities in China have different numerical levels in each indicator, which further confirms that the large sample study of prefecture level cities in China can help more cities to determine the rationality, effectiveness, and reference of energy performance level measured based on the numerical levels of input and output indicators in different dimensions, and reflects the correctness of selecting prefecture level cities in China for empirical research.

4.2. The Measurement Results of Urban Energy Performance in the Economic Dimension

Based on the measurement indicators and models of urban energy performance in the economic dimension, the measurement results of energy performance of prefecture level cities in China in the economic dimension are obtained, as shown in Table 2.
According to the analysis of Table 2, 22 cities are in an effective state, namely Tianjin, Tangshan, Shuozhou, Dalian, Siping, Shanghai, Taizhou (in Jiangsu province), Weihai, Changsha, Zhangjiajie, Guangzhou, Foshan, Dongguan, Zhongshan, Guilin, Haikou, Sanya, Xianyang, Yulin, Jiayuguan, Zhangye, and Turpan. The other cities have room to improve energy performance in the economic dimension. Among the prefecture level cities, Shantou had the lowest energy performance, with a performance value of 0.3843. The average energy performance in the economic dimension is 0.7399, and the overall performance level is relatively high. The standard deviation is 0.1799, and the gap between cities is relatively small.

4.3. The Measurement Results of Urban Energy Performance in the Environmental Dimension

Similarly, the energy performance values of China’s prefecture level cities in the environmental dimension are obtained by using the measurement indicators and models in the third part, as shown in Table 3.
The measurement results of urban energy performance in the environmental dimension show that 28 cities are in an effective state, including Beijing, Tianjin, Tangshan, Cangzhou, Shuozhou, Dalian, Siping, Shanghai, Zhenjiang, Taizhou (in Jiangsu province), Qingdao, Weihai, Suizhou, Changsha, Zhangjiajie, Guangzhou, Foshan, Dongguan, Zhongshan, Guilin, Haikou, Sanya, Xianyang, Yulin, Jiayuguan, Zhangye, Karamay, and Turpan. Therefore, 114 cities need to improve their performance levels. Among these prefecture level cities, Shantou still had the lowest energy performance, and the lowest performance value is 0.3819. The average value of energy performance in the environmental dimension is 0.7596, which is generally at a relatively good performance level. The standard deviation is 0.1832.

4.4. The Measurement Results of Urban Energy Performance in the Well-Being Dimension

After analyzing the sample cities by using the measurement indicators and models of urban energy performance in the well-being dimension set in this study, Table 4 shows the measurement results of energy performance of prefecture level cities in China in the well-being dimension.
In the well-being dimension, 16 sample cities are in an effective state, including Beijing, Changchun, Shanghai, Nanjing, Nanchang, Zhoukou, Wuhan, Suizhou, Changsha, Xiangtan, Guangzhou, Haikou, Sanya, Chengdu, Xi’an, and Lanzhou. Cities that are not in an effective state still have room to improve their performance level. Unlike the first two dimensions, Jincheng had the lowest energy performance value in the well-being dimension. In addition, the average value of energy performance in the well-being dimension is 0.3605, and the overall performance level is low. The standard deviation is 0.3101, and the performance level gap between sample cities is relatively large.

4.5. Results Comparison of Urban Energy Performance in Different Dimensions and Discussion

After the descriptive statistical analysis of the measurement results of urban energy performance in different dimensions, it was found that the average energy performance of prefecture level cities in China in the economic dimension is close to that in the environmental dimension, but there is still a gap between them, with difference of 0.0197. The performance gap between cities in these two dimensions is also relatively similar. The reason is that the energy performance measurement indicator difference between the economic dimension and the environmental dimension is relatively small, and the environmental pollution is further considered in the urban energy performance measurement in the environmental dimension. In addition, through further analysis, it can also be demonstrated that the awareness of energy conservation and environmental protection is improved, and the energy conservation and emission reduction technology is developed with the economic and social development. Therefore, the negative impact of environmental pollution on urban energy performance had also improved to a certain extent in 2018. However, there is a large gap between the measurement results in the economic dimension and the environmental dimension and those in the well-being dimension. The mean value in the well-being dimension is nearly 50% lower than that in the economic dimension. From the well-being dimension, the energy performance of China’s prefecture level cities still has great room for improvement. In addition, the performance gap between cities in the well-being dimension is also significantly higher than that in the economic dimension and the environmental dimension. The increase in energy performance difference in the well-being dimension is related to the urban economic development difference, infrastructure construction, pollution control, social security, and so on. How to further narrow the gap between cities on the premise of improving the overall energy performance level of prefecture level cities in China in the well-being dimension is a key area which is worthy of further study.
On the other hand, for the number of cities that have effective energy performance in different dimensions, there is a small difference between the environmental dimension and the economic dimension, and there is a large gap between the well-being dimension and the first two dimensions. Therefore, from the perspective of China’s overall improvement of energy performance, it is necessary to pay further attention to the well-being dimension in the future. Furthermore, through the comparison of effective energy performance cities in each dimension, it is demonstrated that the cities that reach the performance frontier in the economic dimension also reach the performance frontier in the environmental dimension. Compared with the cities in the economic dimension, there are six cities added into the environmental dimension, namely Beijing, Cangzhou, Zhenjiang, Qingdao, Suizhou, and Karamay. It further shows that the six cities not only improve economic output, but also control the emission of environmental pollutants. Compared with the cities with effective energy performance in the economic dimension and the environmental dimension, the cities with effective energy performance in the well-being dimension differ greatly. It is found that Beijing, Changchun, Nanjing, Zhoukou, Wuhan, Suizhou, Xiangtan, Chengdu, Xi’an, and Lanzhou have also reached the effective frontier compared with the cities with effective energy performance in the economic dimension. Overall, Shanghai, Guangzhou, Changsha, Haikou, and Sanya have reached the effective frontier in terms of energy performance in the three dimensions.
According to the ranking of each city in different dimensions, the performance level of each city could be further analyzed in multiple dimensions and the differences between different dimensions could be further considered. Although Shanghai, Guangzhou, Changsha, Haikou, and Sanya have reached the performance frontier in the three dimensions, the energy performance of Beijing, Tianjin, Dalian, Changchun, Siping, Taizhou (in Jiangsu province), Qingdao, Zhoukou, Wuhan, Xiangtan, Zhangjiajie, Foshan, Dongguan, Zhongshan, Guilin, and Chengdu have also reached a higher performance level compared with other cities in the three dimensions. The ranking of these cities is relatively high in each dimension, and these cities have reached the performance frontier in at least one dimension. Although Tangshan, Cangzhou, Shuozhou, Zhenjiang, Weihai, Xianyang, Yulin, Jiayuguan, Zhangye, Karamay, and Turpan have reached the performance frontier in one of the three dimensions, the performance level of these cities in the well-being dimension is relatively low, which is in great contrast to the performance level in the economic dimension and the environmental dimension. Therefore, these cities need to focus on improving energy performance in the well-being dimension. Correspondingly, the performance level of Nanjing, Nanchang, Suizhou, Xi’an, and Lanzhou in the well-being dimension has reached the effective frontier, while the performance level in the economic dimension or the environmental dimension is relatively low.
To achieve the improvement goals of different cities, it is necessary to further clarify the target cities that can be used for reference. In view of the similarity of geographical location and economic and social development level, this study summarizes the benchmark city of each province, as shown in Table 5.
In the economic dimension, the benchmark cities of Hebei, Shanxi, Liaoning, Jilin, Jiangsu, Anhui, Fujian, Shandong, Henan, Guangxi, Sichuan, Shaanxi, Gansu, Ningxia and Xinjiang, are non-provincial capital cities. In the environmental dimension, the benchmark cities of Hebei, Shanxi, Liaoning, Jilin, Jiangsu, Fujian, Shandong, Henan, Hubei, Guangxi, Sichuan, Shaanxi, Gansu, Ningxia, and Xinjiang are non-provincial capital cities. Compared with the economic dimension, Anhui province is not included, while Hubei province is included. Therefore, in the economic and environmental dimension, 15 performance benchmark cities of the provinces where the sample cities are located are non-provincial capital cities, respectively. However, in the well-being dimension, the benchmark cities in Hebei, Liaoning, Fujian, Henan, and Ningxia are non-provincial capital cities. Considering the multiple dimensions, the benchmark cities of Shanxi, Jilin, Jiangsu, Shandong, Guangxi, Gansu, Xinjiang, and the above five provinces are also non-provincial capital cities. It can be seen that the benchmark cities of most provinces are provincial capital cities in the well-being dimension. The analysis and determination of benchmark cities will provide some reference for improving the energy performance of each province.
Based on the analysis of the energy-economy-environment-welfare system in a city and the review of the concept of urban energy performance from the perspective of system correlation, this paper further proposes the different dimensions of urban energy performance measurement and the measurement indicators in each dimension. From the analysis results of the measurement indicators, it is concluded that the measurement indicators in the environmental dimension include the unexpected output indicator. Therefore, the bad output caused by energy use in the city is comprehensively considered. In addition, the input of environmental pollution control comes from the urban economic output, and the urban environmental pollution will also have an important impact on the urban well-being level. This further reflects the continued relationship between the environmental dimension and the well-being dimension, provides an important direction for the research on the concept and indicators of urban energy performance, and also lays a certain theoretical foundation for the research on urban energy performance. At the same time, based on the analysis of the multi-dimensional measurement results of China’s prefecture level cities, it is concluded that the measurement results of urban energy performance in the economic and environmental dimensions are relatively similar, but there is a large gap between these two dimensions and the well-being dimension, which further verifies the extended relationship between the environmental dimension and the economic dimension reflected in the conceptual analysis and shows the significant impact that environmental pollution control investment and environmental pollution will make on energy performance results [52,65,66]. In order to further reflect the utility of energy in urban production, the adverse utility of environmental pollution and the boosting effect of economy on environmental governance and well-being level improvement in the basic production theory, it gradually evolves into the conceptual framework of urban energy performance shown in Figure 4. It presents a “chain” basic framework assumption. In the measurement of urban energy performance, it will gradually be transformed into the ultimate orientation of improving the well-being level, and the economic output and environmental impact caused by energy use will be contained in the comprehensive correlation system of urban energy use.

5. Conclusions

Based on the conceptual analysis of urban energy performance guided by systematic research and previous literature, this study summarizes the evolution trend of the concept of urban energy performance, and proposes the main dimensions of urban energy performance measurement. On this basis, the measurement indicators of urban energy performance in different dimensions are determined, and the measurement model of each dimension is constructed based on the Data Envelopment Analysis method. In addition, this paper empirically analyses 142 prefecture level cities in China. The conclusions are listed as follows:
Firstly, the development of system theory and the deepening of the derivative effect and ultimate purpose of urban energy utilization make the research on urban energy performance into the related system of energy-economy-environment-welfare, which further highlights the multi-dimensional roles of urban energy consumption. Taking this as a guide, this paper analyzes the concept of urban energy performance, reveals the basic conceptual framework of energy performance characterized by “input-output”, presents the research trend of measuring economic wealth, environmental impact and well-being level as “output”, and puts forward the main dimensions of urban energy performance research, including the economic dimension, the environmental dimension and the well-being dimension.
Secondly, based on the literature review, this paper also puts forward the input indicators and output indicators of urban energy performance measurement in different dimensions. The input indicators in the economic dimension include energy consumption, labor input, and fixed capital input, and the output indicators include economic output. The measurement indicators of urban energy performance in the environmental dimension add environmental pollution on the basis of the output indicators in the economic dimension. The input indicators in the well-being dimension include energy consumption, environmental capital investment, and environmental pollution, while the output indicators include economic output, medical and health level, and educational level. In view of the characteristics of measurement indicators in different dimensions, the measurement models of urban energy performance in different dimensions are constructed based on the corresponding models in the Data Envelopment Analysis method, which not only reduces the result error caused by the unreasonable setting of production function, but also effectively deals with the unexpected output.
Thirdly, the research carried out on 142 prefecture level cities in China fully considers the energy performance levels of cities with different development levels. Through multi sample research, it further improves the effectiveness and rationality of the empirical research and provides an important reference for different cities in the world to improve their energy performance of different dimensions. The empirical results show that the energy performance level of prefecture level cities in China in the economic dimension and the environmental dimension is relatively close, but there are some differences between the urban energy performance level in the well-being dimension and the first two dimensions. In addition, the performance difference between cities in the well-being dimension is also greater than the first two dimensions. In the three dimensions, there are 22, 28 and 16 cities that have reached the effective energy performance, respectively. Shanghai, Guangzhou, Changsha, Haikou, and Sanya have reached the effective frontier in the three dimensions. Among these cities, Beijing, Tianjin, Dalian, Changchun, Siping, Taizhou (in Jiangsu province), Qingdao, Zhoukou, Wuhan, Xiangtan, Zhangjiajie, Foshan, Dongguan, Zhongshan, Guilin, and Chengdu rank relatively high in all dimensions. However, the performance level of Tangshan, Cangzhou, Shuozhou, Zhenjiang, Weihai, Xianyang, Yulin, Jiayuguan, Zhangye, Karamay, and Turpan in the well-being dimension is relatively low, which forms a large contrast with the performance level in the economic dimension and the environmental dimension. The performance level of Nanjing, Nanchang, Suizhou, Xi’an, and Lanzhou in the economic dimension or environmental dimension is relatively poor compared with that in the well-being dimension. Based on the detailed analysis of each dimension, this paper clarifies the benchmark cities in various provinces of China for the purpose of improving their performance. In the economic and the environmental dimension, 15 performance benchmark cities in the provinces where the sample cities are located are non-provincial capital cities, respectively. In the well-being dimension, the benchmark cities in Hebei, Liaoning, Fujian, Henan, and Ningxia are non-provincial capital cities. From the multiple dimensions, the benchmark cities in 12 provinces are non-provincial capital cities. The determination of benchmark cities in each province can provide an effective reference for each region to improve urban energy performance.
The limitations of this study mainly focus on the difficulty of data collection. Based on the scientific analysis of the concept of urban energy performance, this paper puts forward the measurement dimensions of urban energy performance and the measurement indicators under different dimensions. Although the 142 sample cities in China selected in the empirical study have different levels of energy, economy, environment, and well-being and the performance level of global cities in different dimensions could be effectively reflected based on these cities to some extent, there is still a lack of comprehensive analysis on the global cities, which is mainly due to the difficulty of data collection. It is difficult to obtain all the data of various indicators in some cities under the three dimensions. Therefore, future research should focus on the measurement and comparison of multi-dimensional urban energy performance for global cities to comprehensively reveal the global urban energy performance level. Secondly, improving urban energy performance in different dimensions is the most important research direction after scientifically determining the performance level. Therefore, future research should also focus on urban energy performance improvement policies and measures, including the evaluation of policy effectiveness, the quantitative analysis of policy methods, the design of improvement paths, and other aspects.

6. Policy Recommendations

Based on the above conclusions, this study puts forward the following policy recommendations:
Firstly, multi-dimensional urban energy performance measurement is closely related to the energy-economy-environment-welfare system of urban development, and there is a need for continuous observation and analysis. There are a large number of cities in the world. In order to effectively record, measure, and monitor the data and analysis results related to urban energy performance, it is necessary to construct a global urban energy performance database and to further realize global energy performance data management by using advanced computer technology and internet technology.
Secondly, based on the concept deduction and urban subsystem analysis, or the energy performance measurement of different dimensions of China’s prefecture level cities, the urban energy performance in the well-being dimension should be given careful attention in order to be improved in the future. Therefore, on the premise of the rational use of energy to create economic output, cities should also reduce their emission of environmental pollutants, to further reduce the negative impacts on urban environmental governance input and urban residents’ health. Furthermore, cities should ensure the investment and improvement of human development, such as residents’ education.
Thirdly, based on the energy performance measurement results of each dimension, it is concluded that the energy performance of China’s prefecture level cities still has great potential to improve in each dimension, particularly in the well-being dimension. The determination of benchmark cities in this study can help cities in similar areas to determine goals. On the basis of comprehensively considering the similarity of various indicators, it is necessary to seek advanced experience to improve urban energy performance in all dimensions from regional, economic, environmental, social and other aspects more pertinently and effectively.

Author Contributions

Conceptualization, L.W.; methodology, L.W. and G.L.; software, L.W.; validation, L.W. and G.Z.; formal analysis, W.L.; investigation, L.W. and G.Z.; resources, L.W. and W.L.; data curation, L.W.; writing—original draft preparation, L.W.; writing—review and editing, L.W. and G.L.; visualization, W.L. and G.L.; supervision, W.L.; project administration, L.W., W.L. and G.L.; funding acquisition, L.W., W.L. and G.L. All authors have read and agreed to the published version of the manuscript.

Funding

This research was funded by the Humanity and Social Science Youth Foundation Project of Ministry of Education of China (Grant Number 20YJCZH155; Title: Multi-dimensional measurement and promotion policy choice of urban energy performance in China) and the National Natural Science Foundation of China (Grant Number 72004155, 72174137 and 72104172).

Institutional Review Board Statement

Not applicable.

Informed Consent Statement

Not applicable.

Data Availability Statement

The data presented in this study are available from the corresponding author on reasonable request.

Conflicts of Interest

The authors declare no conflict of interest.

References

  1. Zhao, H.; Guo, S.; Zhao, H. Provincial energy efficiency of China quantified by three-stage data envelopment analysis. Energy 2019, 166, 96–107. [Google Scholar] [CrossRef]
  2. Causone, F.; Sangalli, A.; Pagliano, L.; Carlucci, S. Assessing energy performance of smart cities. Build. Serv. Eng. Res. Technol. 2018, 39, 99–116. [Google Scholar] [CrossRef] [Green Version]
  3. Ash, C.; Jasny, B.R.; Roberts, L.; Stone, R.; Sugden, A.M. Reimagining cities. Science 2008, 319, 739. [Google Scholar] [CrossRef] [PubMed] [Green Version]
  4. Brauer, M.; Freedman, G.; Forstad, J.; van Donkelaar, A.; Martin, R.V.; Denteener, F.; van Dingenen, R.; Estep, K.; Amini, H.; Apte, J.S.; et al. Ambient air pollution exposure estimation for the global burden of disease 2013. Environ. Sci. Technol. 2016, 50, 79–88. [Google Scholar] [CrossRef] [PubMed]
  5. Zhu, L.; Hao, Y.; Lu, Z.N.; Wu, H.; Ran, Q. Do economic activities cause air pollution? Evidence from China’s major cities. Sustain. Cities Soc. 2019, 49, 101593. [Google Scholar] [CrossRef]
  6. Bian, J.; Ren, H.; Liu, P.; Zhang, Y. Sustainable urbanization performance evaluation based on “origin” and “modernization” perspectives: A case study of Chongqing, China. Int. J. Environ. Res. Public Health 2018, 15, 1714. [Google Scholar] [CrossRef] [Green Version]
  7. Obrist, D.; Kirk, J.L.; Zhang, L.; Sunderland, E.M.; Jiskra, M.; Selin, N.E. A review of global environmental mercury processes in response to human and natural perturbations: Changes of emissions, climate, and land use. Ambio 2018, 47, 116–140. [Google Scholar] [CrossRef] [PubMed] [Green Version]
  8. Zhang, Y.; Chen, X.; Wu, Y.; Shuai, C.; Shen, L. The environmental Kuznets curve of CO2 emissions in the manufacturing and construction industries: A global empirical analysis. Environ. Impact Assess. Rev. 2019, 79, 106303. [Google Scholar] [CrossRef]
  9. Madlener, R.; Sunak, Y. Impacts of urbanization on urban structures and energy demand: What can we learn for urban energy planning and urbanization management? Sustain. Cities Soc. 2011, 1, 45–53. [Google Scholar] [CrossRef]
  10. Fan, Y.; Fang, C.; Zhang, Q. Coupling coordinated development between social economy and ecological environment in Chinese provincial capital cities-assessment and policy implications. J. Clean. Prod. 2019, 229, 289–298. [Google Scholar] [CrossRef]
  11. He, J.; Gong, S.; Yu, Y.; Yu, L.; Wu, L.; Mao, H.; Song, C.; Zhao, S.; Liu, H.; Li, X.; et al. Air pollution characteristics and their relation to meteorological conditions during 2014–2015 in major Chinese cities. Environ. Pollut. 2017, 223, 484–496. [Google Scholar] [CrossRef] [PubMed]
  12. Bao, R.; Zhang, A. Does lockdown reduce air pollution? Evidence from 44 cities in northern China. Sci. Total Environ. 2020, 731, 139052. [Google Scholar] [CrossRef] [PubMed]
  13. Chen, C.C. Measuring departmental and overall regional performance: Applying the multi-activity DEA model to Taiwan’s cities/counties. Omega 2017, 67, 60–80. [Google Scholar] [CrossRef]
  14. Luca, G.D.; Fabozzi, S.; Massarotti, N.; Vanoli, L. A renewable energy system for a nearly zero greenhouse city: Case study of a small city in southern Italy. Energy 2018, 143, 347–362. [Google Scholar] [CrossRef]
  15. Kan, S.; Chen, B.; Chen, G. Worldwide energy use across global supply chains: Decoupled from economic growth? Appl. Energy 2019, 250, 1235–1245. [Google Scholar] [CrossRef]
  16. Ma, X.; Li, Y.; Zhang, X.; Wang, C.; Li, Y.; Dong, B.; Gu, Y. Research on the ecological efficiency of the Yangtze River Delta region in China from the perspective of sustainable development of the economy-energy-environment (3E) system. Environ. Sci. Pollut. Res. 2018, 25, 29192–29207. [Google Scholar] [CrossRef]
  17. Wu, Y.; Luo, H.; Li, Y.; Wang, Y. Influence mechanism of spatial-temporal differentiation of the coupling and coordinated development of Ecology-Economy-Society System in DONGTING Lake Area. Fresenius Environ. Bull. 2021, 30, 1756–1763. [Google Scholar]
  18. Ozdemir, Z.; Aslan, S.; Kaplan, H. Implementation Issue of “Eco-city” Projects in Turkiye: An Assessment of Problems Encountered. In International Sustainable Buildings Symposium, Proceedings of the 3rd International Sustainable Buildings Symposium, Dubai, United Arab Emirates, 15–17 March 2017; Firat, S., Kinuthia, J., AbuTair, A., Eds.; Springer International Publishing AG: Cham, Switzerland, 2018; pp. 584–614. [Google Scholar] [CrossRef]
  19. Chen, P.Y.; Chen, S.T.; Hsu, C.S.; Chen, C.C. Modeling the global relationships among economic growth, energy consumption and CO2 emissions. Renew. Sustain. Energy Rev. 2016, 65, 420–431. [Google Scholar] [CrossRef]
  20. Gozgor, G.; Chi, K.M.L.; Lu, Z. Energy consumption and economic growth: New evidence from the OECD countries. Energy 2018, 153, 27–34. [Google Scholar] [CrossRef] [Green Version]
  21. Wang, J.; Lin, Y.; Glendinning, A.; Xu, Y. Land-use changes and land policies evolution in China’s urbanization processes. Land Use Policy 2018, 75, 375–387. [Google Scholar] [CrossRef]
  22. Balsalobre-Lorente, D.; Shahbaz, M.; Roubaud, D.; Farhani, S. How economic growth, renewable electricity and natural resources contribute to CO2 emissions? Energy Policy 2018, 113, 356–367. [Google Scholar] [CrossRef] [Green Version]
  23. Xue, B.; Geng, Y.; Müller, K.; Lu, C.; Ren, W. Understanding the causality between carbon dioxide emission, fossil energy consumption and economic growth in developed countries: An empirical study. Sustainability 2014, 6, 1037–1045. [Google Scholar] [CrossRef] [Green Version]
  24. Shafiei, S.; Salim, R.A. Non-renewable and renewable energy consumption and CO2 emissions in OECD countries: A comparative analysis. Energy Policy 2014, 66, 547–556. [Google Scholar] [CrossRef] [Green Version]
  25. Śmiech, S.; Papież, M. Energy consumption and economic growth in the light of meeting the targets of energy policy in the EU: The bootstrap panel Granger causality approach. Energy Policy 2014, 71, 118–129. [Google Scholar] [CrossRef]
  26. Ascione, M.; Bargigli, S.; Campanella, L.; Ulgiati, S. Exploring an Urban System’s Dependence on the Environment as a Source and a Sink: The City of Rome (Italy) Across Space and Time Scales. ChemSusChem 2011, 4, 613–627. [Google Scholar] [CrossRef] [PubMed]
  27. Keirstead, J. Benchmarking urban energy efficiency in the UK. Energy Policy 2013, 63, 575–587. [Google Scholar] [CrossRef]
  28. Patterson, M.G. What is energy efficiency?: Concepts, indicators and methodological issues. Energy Policy 1996, 24, 377–390. [Google Scholar] [CrossRef]
  29. Zhang, X.P.; Cheng, X.M.; Yuan, J.H.; Gao, X.J. Total-factor energy efficiency in developing countries. Energy Policy 2011, 39, 644–650. [Google Scholar] [CrossRef]
  30. Yan, D.; Kong, Y.; Ye, B.; Shi, Y.; Zeng, X. Spatial variation of energy efficiency based on a Super-Slack-Based Measure: Evidence from 104 resource-based cities. J. Clean. Prod. 2019, 240, 117669. [Google Scholar] [CrossRef]
  31. Hu, J.L.; Wang, S.C. Total-factor energy efficiency of regions in China. Energy Policy 2006, 34, 3206–3217. [Google Scholar] [CrossRef]
  32. Wei, C.; Shen, M.H. Energy efficiency and its influencing factors: An Empirical Analysis Based on DEA. J. Manag. World 2007, 8, 66–76. (In Chinese) [Google Scholar]
  33. Wang, K.; Wei, Y.M. China’s regional industrial energy efficiency and carbon emissions abatement costs. Appl. Energy 2014, 130, 617–631. [Google Scholar] [CrossRef]
  34. Zhang, N.; Zhou, P.; Choi, Y. Energy efficiency, CO2 emission performance and technology gaps in fossil fuel electricity generation in Korea: A meta-frontier non-radial directional distance function analysis. Energy Policy 2013, 56, 653–662. [Google Scholar] [CrossRef]
  35. Zhou, P.; Ang, B.W.; Wang, H. Energy and CO2 emission performance in electricity generation: A non-radial directional distance function approach. Eur. J. Oper. Res. 2012, 221, 625–635. [Google Scholar] [CrossRef]
  36. Wang, Q.; Su, B.; Sun, J.; Zhou, P.; Zhou, D. Measurement and Decomposition of energy-savings and emissions reduction performance in Chinese cities. Appl. Energy 2015, 151, 85–92. [Google Scholar] [CrossRef]
  37. Oh, D.H. A metafrontier approach for measuring an environmentally sensitive productivity growth index. Energy Econ. 2010, 32, 146–157. [Google Scholar] [CrossRef]
  38. Sueyoshi, T.; Goto, M. DEA radial measurement for environmental assessment and planning: Desirable procedures to evaluate fossil fuel power plants. Energy Policy 2012, 41, 422–432. [Google Scholar] [CrossRef]
  39. Fare, R.; Grosskopf, S.; Pasurka, C.A., Jr. Environmental production functions and environmental directional distance functions. Energy 2007, 32, 1055–1066. [Google Scholar] [CrossRef]
  40. Feng, H.W.; Ouyang, W.M. Research on the Ecological Protection of Trans-Regional Lake Water Resources from the Perspective of Game Theory. In Advances in Social Science, Education and Humanities Research, Proceedings of the 2016 International Conference on Politics, Economics and Law, Weihai, China, 28–29 May 2016; Chan, A., Ling, Y., Eds.; Atlantis Press: Paris, France, 2016; pp. 118–121. [Google Scholar]
  41. Du, J.; Wu, B.; Wang, L. Aspiration dynamics and the sustainability of resources in the public goods dilemma. Phys. Lett. A 2016, 380, 1432–1436. [Google Scholar] [CrossRef]
  42. Lv, C.; Ling, M.; Wu, Z.; Guo, X.; Cao, Q. Quantitative assessment of ecological compensation for groundwater overexploitation based on emergy theory. Environ. Geochem. Health 2020, 42, 733–744. [Google Scholar] [CrossRef]
  43. Gao, W.; Ding, X.; Chen, R.; Min, W. An empirical study of the role of higher education in building a green economy. Sustainability 2019, 11, 6823. [Google Scholar] [CrossRef] [Green Version]
  44. Hong, J.; Shen, G.Q.; Guo, S.; Xue, F.; Zheng, W. Energy use embodied in China’s construction industry: A multi-regional Input–Output analysis. Renew. Sustain. Energy Rev. 2016, 53, 1303–1312. [Google Scholar] [CrossRef] [Green Version]
  45. Li, B.; Zhang, W.; Yu, J. A study on total factor energy efficiency and its difference in resource-based cities in China with consideration of environmental constraints. J. Nat. Resour. 2016, 31, 377–389. (In Chinese) [Google Scholar]
  46. Ma, X.; Liu, Y.; Wei, X.; Li, Y.; Zheng, M.; Li, Y.; Cheng, C.; Wu, Y.; Liu, Z.; Yu, Y. Measurement and decomposition of energy efficiency of Northeast China based on super efficiency DEA model and Malmquist index. Environ. Sci. Pollut. Res. 2017, 24, 19859–19873. [Google Scholar] [CrossRef] [PubMed]
  47. Wang, Z.; He, W.; Wang, B. Performance and reduction potential of energy and CO2 emissions among the APEC’s members with considering the return to scale. Energy 2017, 138, 552–562. [Google Scholar] [CrossRef]
  48. Hang, Y.; Sun, J.; Wang, Q.; Zhao, Z.; Wang, Y. Measuring energy inefficiency with undesirable outputs and technology heterogeneity in Chinese cities. Econ. Model. 2015, 49, 46–52. [Google Scholar] [CrossRef]
  49. Halkos, G.; Petrou, K.N. Analysing the energy efficiency of EU member states: The potential of energy recovery from waste in the circular economy. Energies 2019, 12, 3718. [Google Scholar] [CrossRef] [Green Version]
  50. Wang, R.; Feng, Y. Research on China’s ecological welfare performance evaluation and improvement path from the perspective of high quality development. Math. Probl. Eng. 2020, 2020, 5476089. [Google Scholar] [CrossRef]
  51. Zhang, S.; Zhu, D.; Shi, Q.; Cheng, M. Which countries are more ecologically efficient in improving human well-being? An application of the index of ecological well-being performance. Resour. Conserv. Recycl. 2018, 129, 112–119. [Google Scholar] [CrossRef]
  52. Bian, J.; Ren, H.; Liu, P. Evaluation of urban ecological well-being performance in China: A case study of 30 provincial capital cities. J. Clean. Prod. 2020, 254, 120109. [Google Scholar] [CrossRef]
  53. Guo, B.; Bu, Y. Performance evaluation and influencing factors of urban ecological welfare in the Yangtze River Economic Belt-a case study of 110 cities in the Yangtze River Economic Belt. Enterp. Econ. 2018, 8, 30–37. (In Chinese) [Google Scholar]
  54. Han, J. Study on evaluation and influencing factors of ecological welfare performance-a case study of Ningbo. Econ. Forum 2017, 10, 49–53. (In Chinese) [Google Scholar]
  55. Xiao, L.; Zhang, X. Spatio-temporal characteristics of coupling coordination between green innovation efficiency and ecological welfare performance under the concept of strong sustainability. J. Nat. Resour. 2019, 34, 94–106. (In Chinese) [Google Scholar] [CrossRef]
  56. Dietz, T.; Rosa, A.E.; York, R. Environmentally efficient well-being: Is there a Kuznets curve? Appl. Geogr. 2012, 32, 21–28. [Google Scholar] [CrossRef]
  57. Fu, W.; Turner, J.C.; Zhao, J.; Du, G. Ecological footprint (EF): An expanded role in calculating resource productivity (RP) using China and the G20 member countries as examples. Ecol. Indic. 2015, 48, 464–471. [Google Scholar] [CrossRef] [Green Version]
  58. Klugman, J.; Rodríguez, F.; Choi, H.J. The HDI 2010: New controversies, old critiques. J. Econ. Inequal. 2011, 9, 249–288. [Google Scholar] [CrossRef]
  59. Mardani, A.; Zavadskas, E.K.; Streimikiene, D.; Jusoh, A.; Khoshnoudi, M. A comprehensive review of data envelopment analysis (DEA) approach in energy efficiency. Renew. Sustain. Energy Rev. 2017, 70, 1298–1322. [Google Scholar] [CrossRef]
  60. Dong, F.; An, X.; Li, C. Performance evaluation of wind power industry chain based on three-stage DEA. J. Renew. Sustain. Energy 2021, 13, 033313. [Google Scholar] [CrossRef]
  61. Banker, R.D.; Charnes, A.; Cooper, W.W. Some models for estimating technical and scale inefficiencies in data envelopment analysis. Manag. Sci. 1984, 30, 1078–1092. [Google Scholar] [CrossRef] [Green Version]
  62. Chung, Y.H.; Färe, R.; Grosskopf, S. Productivity and undesirable outputs: A directional distance function approach. J. Environ. Manag. 1997, 51, 229–240. [Google Scholar] [CrossRef] [Green Version]
  63. Li, Z.; Ouyang, X.; Du, K.; Zhao, Y. Does government transparency contribute to improved eco-efficiency performance? An empirical study of 262 cities in China. Energy Policy 2017, 110, 79–89. [Google Scholar] [CrossRef]
  64. Hu, M.; Sarwar, S.; Li, Z. Spatio-Temporal Differentiation Mode and Threshold Effect of Yangtze River Delta Urban Ecological Well-Being Performance Based on Network DEA. Sustainability 2021, 13, 4550. [Google Scholar] [CrossRef]
  65. Costanza, R.; Daly, L.; Fioramonti, L.; Giovannini, E.; Kubiszewski, I.; Mortensen, L.F.; Pickett, K.E.; Ragnarsdottir, K.V.; De Vogli, R.; Wilkinson, R. Modelling and measuring sustainable wellbeing in connection with the UN Sustainable Development Goals. Ecol. Econ. 2016, 130, 350–355. [Google Scholar] [CrossRef]
  66. O’Neill, D.W. Measuring progress in the degrowth transition to a steady state economy. Ecol. Econ. 2012, 84, 221–231. [Google Scholar] [CrossRef]
Figure 1. Multi-system network relationships of urban energy utilization impacts.
Ijerph 18 13046 g001
Figure 2. Concept evolution and dimension of urban energy performance.
Ijerph 18 13046 g002
Figure 3. The measurement indicators of urban energy performance in different dimensions. Note: the blue, green and yellow arrow lines represent the measurement indicators of economic, environmental, and well-being dimensions, respectively. The solid lines represent the input indicators, and the dotted lines represent the output indicators.
Ijerph 18 13046 g003
Figure 4. The evolution direction of the conceptual framework of urban energy performance.
Ijerph 18 13046 g004
Table 1. The descriptive statistical analysis of indicator data.
IndicatorUnitMinimumMaximumMeanStandard Deviation
Energy consumption10,000 tons of standard coal11.8718,102.332041.732653.59
Labor inputPerson138,105.0015,696,019.001,989,929.002,420,450.00
Fixed capital investmentMillion Yuan119.2018,661.412958.722543.64
Economic outputTen thousand Yuan2,996,200.00326,798,700.0044,685,392.0052,717,490.00
Environmental pollutionTon412.00249,071.0037,880.4839,823.75
Environmental capital investmentTen thousand Yuan440.71190,731.8127,999.9731,410.93
Medical and health levelPerson993.00109,376.0015,814.4215,111.48
Education levelYear7.4611.768.761.11
Table 2. The measurement results of energy performance of prefecture level cities in China in the economic dimension.
CityPerformanceCityPerformanceCityPerformance
Beijing0.9952 Longyan0.8362 Zhuhai0.7241
Tianjin1.0000 Ningde0.6474 Shantou0.3843
Tangshan1.0000 Nanchang0.6634 Foshan1.0000
Handan0.4883 Jingdezhen0.5420 Maoming0.7352
Baoding0.6988 Jiujiang0.6147 Zhaoqing0.4492
Cangzhou0.7934 Ganzhou0.4643 Shanwei0.5271
Taiyuan0.6504 Shangrao0.5841 Dongguan1.0000
Yangquan0.9334 Jinan0.6936 Zhongshan1.0000
Changzhi0.5866 Qingdao0.9620 Jieyang0.8280
Jincheng0.7376 Zaozhuang0.6863 Yunfu0.6764
Shuozhou1.0000 Yantai0.9976 Nanning0.5456
Jinzhong0.5200 Weifang0.7912 Liuzhou0.5520
Xinzhou0.9677 Weihai1.0000 Guilin1.0000
Hohhot0.7383 Rizhao0.8191 Fangchenggang0.8655
Dalian1.0000 Linyi0.4770 Haikou1.0000
Changchun0.7893 Dezhou0.8379 Sanya1.0000
Siping1.0000 Binzhou0.5409 Chongqing0.7198
Harbin0.9292 Zhengzhou0.7933 Chengdu0.8506
Shanghai1.0000 Luoyang0.6096 Zigong0.9024
Nanjing0.7063 Pingdingshan0.5014 Luzhou0.5563
Wuxi0.9395 Anyang0.4886 Deyang0.9686
Xuzhou0.7498 Xinxiang0.5141 Guangyuan0.5952
Suzhou0.9169 Puyang0.5439 Suining0.7210
Nantong0.7495 Sanmenxia0.7258 Neijiang0.9033
Lianyungang0.7166 Nanyang0.6128 Leshan0.7260
Huai’an0.7018 Shangqiu0.5447 Guiyang0.7262
Zhenjiang0.9858 Xinyang0.6210 Liupanshui0.6984
Taizhou (in Jiangsu province)1.0000 Zhoukou0.9780 Bijie0.5826
Suqian0.9322 Wuhan0.8874 Kunming0.4679
Hangzhou0.9355 Huangshi0.4241 Xi’an0.6929
Ningbo0.6082 Shiyan0.5512 Baoji0.6891
Wenzhou0.5971 Yichang0.7037 Xianyang1.0000
Shaoxing0.7270 Xiangyang0.8009 Weinan0.5876
Jinhua0.5588 Jingmen0.5513 Yan’an0.6431
Taizhou (in Zhejiang province)0.7415 Suizhou0.6085 Hanzhong0.4882
Hefei0.6893 Changsha1.0000 Yulin1.0000
Wuhu0.6829 Zhuzhou0.6900 Ankang0.6999
Huainan0.5241 Xiangtan0.9192 Shangluo0.5693
Bozhou0.4784 Shaoyang0.4815 Lanzhou0.5247
Chizhou0.6979 Changde0.6805 Jiayuguan1.0000
Xuancheng0.5629 Zhangjiajie1.0000 Zhangye1.0000
Fuzhou0.6558 Yiyang0.9264 Yinchuan0.5326
Xiamen0.6723 Chenzhou0.6192 Shizuishan0.8587
Putian0.4777 Yongzhou0.5855 Urumqi0.5936
Sanming0.6734 Huaihua0.6570 Karamay0.9855
Quanzhou0.7297 Guangzhou1.0000 Turpan1.0000
Zhangzhou0.8130 Shaoguan0.6634 Hami0.9850
Nanping0.6183
Table 3. The measurement results of energy performance of prefecture level cities in China in the environmental dimension.
CityPerformanceCityPerformanceCityPerformance
Beijing1.0000Longyan0.8313Zhuhai0.7665
Tianjin1.0000Ningde0.6442Shantou0.3819
Tangshan1.0000Nanchang0.6638Foshan1.0000
Handan0.5803Jingdezhen0.5387Maoming0.9919
Baoding0.6992Jiujiang0.6148Zhaoqing0.4242
Cangzhou1.0000Ganzhou0.4655Shanwei0.5842
Taiyuan0.6408Shangrao0.5851Dongguan1.0000
Yangquan0.9216Jinan0.6935Zhongshan1.0000
Changzhi0.5856Qingdao1.0000Jieyang0.8596
Jincheng0.7568Zaozhuang0.7604Yunfu0.6651
Shuozhou1.0000Yantai0.9977Nanning0.5461
Jinzhong0.5303Weifang0.9160Liuzhou0.5519
Xinzhou0.9839Weihai1.0000Guilin1.0000
Hohhot0.7294Rizhao0.8932Fangchenggang0.8428
Dalian1.0000Linyi0.4755Haikou1.0000
Changchun0.7904Dezhou0.8752Sanya1.0000
Siping1.0000Binzhou0.5964Chongqing0.7469
Harbin0.9323Zhengzhou0.7941Chengdu0.8576
Shanghai1.0000Luoyang0.6809Zigong0.9404
Nanjing0.7045Pingdingshan0.5524Luzhou0.5564
Wuxi0.9391Anyang0.5155Deyang0.9687
Xuzhou0.7512Xinxiang0.5187Guangyuan0.5647
Suzhou0.9202Puyang0.7783Suining0.8994
Nantong0.7810Sanmenxia0.7460Neijiang0.8997
Lianyungang0.7150Nanyang0.6271Leshan0.7230
Huai’an0.7022Shangqiu0.5487Guiyang0.7262
Zhenjiang1.0000Xinyang0.6220Liupanshui0.6859
Taizhou (in Jiangsu province)1.0000Zhoukou0.9958Bijie0.5793
Suqian0.9324Wuhan0.9350Kunming0.4666
Hangzhou0.9382Huangshi0.4199Xi’an0.8617
Ningbo0.6511Shiyan0.5939Baoji0.7023
Wenzhou0.6038Yichang0.7023Xianyang1.0000
Shaoxing0.7302Xiangyang0.8117Weinan0.5740
Jinhua0.5460Jingmen0.5789Yan’an0.6469
Taizhou (in Zhejiang province)0.7532Suizhou1.0000Hanzhong0.4886
Hefei0.7062Changsha1.0000Yulin1.0000
Wuhu0.6830Zhuzhou0.6906Ankang0.8596
Huainan0.5013Xiangtan0.9157Shangluo0.5744
Bozhou0.4732Shaoyang0.4829Lanzhou0.5134
Chizhou0.6260Changde0.6812Jiayuguan1.0000
Xuancheng0.5604Zhangjiajie1.0000Zhangye1.0000
Fuzhou0.6572Yiyang0.9264Yinchuan0.5954
Xiamen0.9238Chenzhou0.6199Shizuishan0.8117
Putian0.4820Yongzhou0.5868Urumqi0.5833
Sanming0.6721Huaihua0.6585Karamay1.0000
Quanzhou0.7435Guangzhou1.0000Turpan1.0000
Zhangzhou0.8133Shaoguan0.6360Hami0.9779
Nanping0.6197
Table 4. The measurement results of energy performance of prefecture level cities in China in the well-being dimension.
CityPerformanceCityPerformanceCityPerformance
Beijing1.0000Longyan0.1824Zhuhai0.3899
Tianjin0.3127Ningde0.1538Shantou0.2447
Tangshan0.0380Nanchang1.0000Foshan0.4797
Handan0.0745Jingdezhen0.1022Maoming0.2421
Baoding0.5150Jiujiang0.1174Zhaoqing0.2481
Cangzhou0.1121Ganzhou0.3186Shanwei0.2829
Taiyuan0.4589Shangrao0.1434Dongguan0.5231
Yangquan0.0356Jinan0.5153Zhongshan0.5476
Changzhi0.0311Qingdao0.4436Jieyang0.2679
Jincheng0.0302Zaozhuang0.0783Yunfu0.2765
Shuozhou0.0351Yantai0.1927Nanning0.8244
Jinzhong0.0750Weifang0.1163Liuzhou0.2296
Xinzhou0.0356Weihai0.1619Guilin0.4853
Hohhot0.5614Rizhao0.0760Fangchenggang0.2533
Dalian0.3811Linyi0.1995Haikou1.0000
Changchun1.0000Dezhou0.0988Sanya1.0000
Siping0.5447Binzhou0.0759Chongqing0.7621
Harbin0.6618Zhengzhou0.8720Chengdu1.0000
Shanghai1.0000Luoyang0.1377Zigong0.1842
Nanjing1.0000Pingdingshan0.1082Luzhou0.1853
Wuxi0.1845Anyang0.1180Deyang0.2442
Xuzhou0.2349Xinxiang0.2667Guangyuan0.2609
Suzhou0.2153Puyang0.2461Suining0.1845
Nantong0.3050Sanmenxia0.1007Neijiang0.1711
Lianyungang0.1311Nanyang0.2980Leshan0.1757
Huai’an0.1622Shangqiu0.2901Guiyang0.7076
Zhenjiang0.1515Xinyang0.2032Liupanshui0.1550
Taizhou (in Jiangsu province)0.9732Zhoukou1.0000Bijie0.1602
Suqian0.2514Wuhan1.0000Kunming0.6240
Hangzhou0.8437Huangshi0.1936Xi’an1.0000
Ningbo0.1420Shiyan0.3394Baoji0.1480
Wenzhou0.4891Yichang0.2776Xianyang0.1573
Shaoxing0.2426Xiangyang0.3591Weinan0.1050
Jinhua0.3012Jingmen0.1936Yan’an0.1055
Taizhou (in Zhejiang province)0.2200Suizhou1.0000Hanzhong0.1059
Hefei0.2469Changsha1.0000Yulin0.1016
Wuhu0.1628Zhuzhou0.4248Ankang0.1907
Huainan0.1111Xiangtan1.0000Shangluo0.1641
Bozhou0.1110Shaoyang0.8496Lanzhou1.0000
Chizhou0.1106Changde0.7089Jiayuguan0.1805
Xuancheng0.1089Zhangjiajie0.5134Zhangye0.1644
Fuzhou0.2899Yiyang0.4427Yinchuan0.0336
Xiamen0.8942Chenzhou0.3605Shizuishan0.0346
Putian0.2204Yongzhou0.9741Urumqi0.2557
Sanming0.1677Huaihua0.7908Karamay0.0579
Quanzhou0.1798Guangzhou1.0000Turpan0.1165
Zhangzhou0.2647Shaoguan0.2597Hami0.0674
Nanping0.1764
Table 5. The energy performance benchmark city of each province in each dimension and multiple dimensions.
ProvinceEconomic
Dimension
Environmental
Dimension
Well-Being
Dimension
Multiple Dimensions
BeijingBeijingBeijingBeijingBeijing
TianjinTianjinTianjinTianjinTianjin
HebeiTangshanTangshan/CangzhouBaodingBaoding
ShanxiShuozhouShuozhouTaiyuanShuozhou
Inner MongoliaHohhotHohhotHohhotHohhot
LiaoningDalianDalianDalianDalian
JilinSipingSipingChangchunSiping
HeilongjiangHarbinHarbinHarbinHarbin
ShanghaiShanghaiShanghaiShanghaiShanghai
JiangsuTaizhouTaizhou/ZhenjiangNanjingTaizhou
ZhejiangHangzhouHangzhouHangzhouHangzhou
AnhuiChizhouHefeiHefeiHefei
FujianLongyanXiamenXiamenXiamen
JiangxiNanchangNanchangNanchangNanchang
ShandongWeihaiWeihai/QingdaoJinanQingdao
HenanZhoukouZhoukouZhoukouZhoukou
HubeiWuhanSuizhouWuhan/SuizhouWuhan
HunanChangsha/ZhangjiajieChangsha/ZhangjiajieChangsha/XiangtanChangsha
GuangdongGuangzhou/Foshan/
Dongguan/Zhongshan
Guangzhou/Foshan/
Dongguan/Zhongshan
GuangzhouGuangzhou
GuangxiGuilinGuilinNanningGuilin
HainanHaikou/SanyaHaikou/SanyaHaikou/SanyaHaikou/Sanya
ChongqingChongqingChongqingChongqingChongqing
SichuanDeyangDeyangChengduChengdu
GuizhouGuiyangGuiyangGuiyangGuiyang
ShaanxiXianyang/YulinXianyang/YulinXi’anXi’an
GansuJiayuguan/ZhangyeJiayuguan/ZhangyeLanzhouJiayuguan
NingxiaShizuishanShizuishanShizuishanShizuishan
XinjiangTurpanKaramay/TurpanUrumqiTurpan
Publisher’s Note: MDPI stays neutral with regard to jurisdictional claims in published maps and institutional affiliations.

