Article

Effect of Green Space Environment on Air Pollutants PM2.5, PM10, CO, O3, and Incidence and Mortality of SARS-CoV-2 in Highly Green and Less-Green Countries

by
Sultan Ayoub Meo
1,*,
Faris Jamal Almutairi
1,
Abdulelah Adnan Abukhalaf
1 and
Adnan Mahmood Usmani
2
1
Department of Physiology, College of Medicine, King Saud University, Riyadh 11461, Saudi Arabia
2
Diabetic Unit, College of Medicine, King Saud University, Riyadh 11461, Saudi Arabia
*
Author to whom correspondence should be addressed.
Int. J. Environ. Res. Public Health 2021, 18(24), 13151; https://doi.org/10.3390/ijerph182413151
Submission received: 29 September 2021 / Revised: 27 November 2021 / Accepted: 8 December 2021 / Published: 13 December 2021

Abstract

:
Worldwide, over half of the global population is living in urban areas. The metropolitan areas are highly populated and environmentally non-green regions on the planet. In green space regions, plants, grass, and green vegetation prevent soil erosion, absorb air pollutants, provide fresh and clean air, and minimize the burden of diseases. Presently, the entire world is facing a turmoil situation due to the COVID-19 pandemic. This study investigates the effect of the green space environment on air pollutants particulate matter PM2.5, PM10, carbon monoxide (CO), ozone (O3), incidence and mortality of Severe Acute Respiratory Syndrome Coronavirus (SARS-CoV-2) in environmentally highly green and less-green countries. We randomly selected 17 countries based on the Environmental Performance Index (EPI) data. The 60% of the EPI score is based on seven categories: “biodiversity and habitat, ecosystem, fisheries, climate change, pollution emissions, agriculture, and water resources”. However, 40% of the score is based on four categories: “air quality, sanitation and drinking water, heavy metals, and waste management”. The air pollutants and SARS-CoV-2 cases and deaths were recorded from 25 January 2020, to 11 July 2021. The air pollutants “PM2.5, PM10, CO, and O3” were recorded from the metrological websites, Air Quality Index-AQI, 2021. The COVID-19 daily cases and deaths were obtained from the World Health Organization. The result reveals that air pollutants mean values for PM2.5 110.73 ± 1.09 vs. 31.35 ± 0.29; PM10 80.43 ± 1.11 vs. 17.78 ± 0.15; CO 7.92 ± 0.14 vs. 2.35 ± 0.03 were significantly decreased (p < 0.0001) in environmentally highly green space countries compared to less-green countries. Moreover, SARS-CoV-2 cases 15,713.61 ± 702.42 vs. 3445.59 ± 108.09; and deaths 297.56 ± 11.27 vs. 72.54 ± 2.61 were also significantly decreased in highly green countries compared to less-green countries. The green environment positively impacts human wellbeing. The policymakers must implement policies to keep the living areas, surroundings, towns, and cities clean and green to minimize air pollution and combat the present pandemic of COVID-19.

1. Introduction

Worldwide over half of the population, 4.2 billion (56%) inhabitants, live in urban areas. The rapid growth in population and urbanization resulted in an increasing proportion of the people living in metropolitan cities and caused an imbalance to provide healthy and sustainable living environments [1]. The swift urbanization and industrialization have limited public access to nature and increased exposure to air pollution and allied diseases. Worldwide, urban areas face challenging problems of growing populations, limited resources, and the increasing impact of rapid climate change. Urbanization and industrialization polluted the normal biological ecosystem, affected weather conditions, and caused an imbalance between the pattern of health and disease [2].
Worldwide, the total forest area is about 4.06 billion hectares, it covers 31% of the global land area, but forests are not equally distributed around the globe [3]. Deforestation, forest degradation, and wildfires continue to occur at alarming rates; it significantly decreases global biodiversity. During 2015–2020, the deforestation rate was 10 million hectares per year, considerably minimizing green spaces globally [3].
The green space environment, plants, parks, playgrounds, or vegetation in public and private places can provide natural opportunities to nature and biodiversity. Natural green spaces mitigate environmental hazards, air pollution, extreme weather events, heatwaves, excessive rainfall, or flooding [4]. The green space environment enhances ecological air quality, decreases air and noise pollution, and risks various diseases. It offers natural solutions to minimize environmental pollution, increase urban settings’ quality, promote healthy lifestyles, and improve the health and wellbeing of the residents [5].
The environmental green space is a component of “green infrastructure”. It is an integral part of public health-promoting settings. The green space areas with plants, trees, and gardens have been linked to less environmental pollution, healthy climate, and weather conditions. However, non-green space areas cause desert, sandstorms, ecological pollution, and adverse effects on human health [6]. Worldwide, mainly the urban population is facing a challenging issue of environmental pollution and allied health diseases. Environmental pollution has become a leading cause of transmission and pathogenesis of various bacterial and viral infections, including SARS-CoV-2 cases and deaths [6,7]. Since Dec 2019, worldwide, people have faced a challenging issue of “Severe Acute Respiratory Syndrome (SARS-CoV-2), also known as the COVID-19 pandemic”. It causes global physical, psychological, educational, and economic losses. As per the World Health Organization report, on 26 November 2021, there were 259, 502, 031 cases of COVID-19 and 5,183,003 (1.99%) deaths [8].
The scientific community established some linkage between air pollutants and SARS-CoV-2 cases and deaths [9], but no single study has been published on the impact of natural green space on the epidemiological trends of the COVID-19 pandemic. The present study hypothesized that a green space environment decreases the air pollutants and COVID-19 pandemic. Therefore, the present study investigates the SARS-CoV-2 cases and deaths among people living in ecologically highly green and less-green space countries.

2. Research Methodology

2.1. Selection of Highly Green and Less-Green Space Countries

The present study was conducted in the “Department of Physiology, College of Medicine, King Saud University, Riyadh, Saudi Arabia”. For this study, we randomly selected 17 countries based on the “Environmental Performance Index (EPI)” data of the countries of biological and natural ecosystem sustainability worldwide. Total 32 performance indicators were used across the 11 concerning categories. The EPI ranks the countries on environmental health, green regions, and ecosystem vitality [10].

2.2. EPI Scoring System of Environmentally Green Space and Less-Green Countries

The EPI classified the grading of the individual countries based on the various environmental factors. The environmental health policy and ecosystem vitality objective measure how healthy countries preserve, protect, and enhance natural ecosystems and green areas and protect people from environmental health risk factors. The 60% of the EPI score is based on seven categories: biodiversity (plant- and animal life on the earth) and habitat (natural environment), ecosystem, pollution productions, climate change, fisheries, agriculture, and water resources. However, 40% of the score was based on four categories: air quality, heavy metals, sanitation and drinking water, and waste management. As per “Environmental Performance Index-EPI” 2021 [10], we randomly selected ten environmentally highly green countries: Luxembourg, Finland, Norway, Denmark, Austria, Switzerland, Sweden, Germany, United Kingdom, and France. We also selected 07 environmentally less-green countries; these include Egypt, Thailand, Kuwait, Saudi Arabia, Indonesia, Brazil, and India [10].

2.3. Measurement of “PM2.5, PM10, CO, and O3, and SARS-CoV-2 Cases and Deaths”

After selecting the countries, the data on air pollutants “particulate matter PM2.5, PM10, carbon monoxide (CO), ozone (O3) pollutants, and SARS-CoV-2 cases and deaths” were documented from 25 January 2020 to 11 July 2021. The data was obtained from the first case of SARS-CoV-2 in these countries from 25 January to 11 July 2021. This study period of about one year and six months covers the various changes in the environment, weather conditions, and ups and downs in the epidemiological trends of the COVID-19 pandemic. The environmental pollutants “PM2.5, PM10, CO, and O3” were documented from the appearance of the first case reported in these states. The data on air pollutants, daily “PM2.5, PM10, CO, and O3” levels were recorded from the metrological websites, “Air Quality Index-AQI, 2021” [11], during the same period. However, the “data on COVID-19 daily cases and deaths were recorded from the official website of the World Health Organization (WHO)” for coronavirus [8]. For the confirmation of the data, the third co-investigator re-checked all the data.

2.4. Statistical Analysis and Ethical Statement

The statistical analysis was performed by using the SPSS software version 22.0, Chicago, USA, for Microsoft windows. The “mean values with standard deviation (SD) were calculated using a paired sample t-test”. The Pearson analysis was executed to predict the association of the air pollutant PM2.5, PM10, CO, and O3 on the number of SARS-CoV-2 daily cases and deaths. A p-value less than 0.05 was considered statistically significant. For this study, the “data on the daily new cases and deaths due to COVID-19 pandemic, particulate matter PM2.5, PM10, CO, and O3 allied information were obtained from the publicly available databases; hence ethical approval was not required”.

3. Results

Table 1 shows the environmentally greenspace countries with their EPI score, Luxembourg, Finland, Norway, Denmark, Austria, Switzerland, Sweden, Germany, United Kingdom, and France. Table 1 also shows the environmentally less-green space countries, including Egypt, Thailand, Kuwait, Saudi Arabia, Indonesia, Brazil, and India (Table 1). Table 1 also demonstrates the study period of all these countries, environmental pollutants, PM2.5, PM10, CO, O3, and SARS-CoV-2 daily cases and deaths in environmentally highly green and less-green space countries (Figure 1, Figure 2 and Figure 3).
The air pollutants particulate matter mean values for PM2.5 110.73 ± 1.09 vs. 31.35 ± 0.29; PM10 80.43 ± 1.11 vs. 17.78 ± 0.15; CO 7.92 ± 0.14 vs. 2.35 ± 0.03 were significantly decreased (p = 0.0001) in environmentally green countries compared to less-green countries (Table 1). Moreover, SARS-CoV-2 cases 15,713.61 ± 702.42 vs. 3445.59 ± 108.09; deaths 297.56 ± 11.27 vs. 72.54 ± 2.61 were also significantly decreased in green space countries compared to less-green countries (Table 2). However, no significant difference was noticed between O3 and SARS-CoV-2 daily cases and deaths in environmentally highly green and less-green space countries (Table 2). Environmental pollutants PM2.5, PM10, CO, O3, and SARS-CoV-2 daily cases and daily deaths are presented in (Figure 1 and Figure 2) in environmentally highly green and less-green space countries.
Table 3 demonstrates the Pearson analysis outcomes. The definite dependent variable depends on air pollutants, and it was employed to envisage the pollutant parameters and the number of SARS-CoV-2 cases and deaths. The finding demonstrates that an increase in “PM2.5, PM10, CO, and O3” was allied to a significant rise in the number of SARAS-CoV-2 cases and deaths (p = 0.0001) (Table 3). Figure 4 compares mean daily cases and daily deaths from 25 January 2020, to 11 July 2021. Figure 5 reveals the graphical presentation and comparison of environmental pollutants and SARS-CoV-2 cases and deaths in highly green and less-green space countries.
Since the population is associated with the air pollutant parameters, it might be the reason for an increase in daily cases and daily deaths. Therefore, binary logistic regression analysis was applied to exclude the effect of population size confounder, considering that the average population of each country remained the same throughout the study period, and the adjusted odds ratio was calculated for daily cases and deaths. The analysis showed that after adjusting the confounding factor, the population size of each country, there is 1.0% (OR = 1.0) significantly (p < 0.001) increase in daily cases and 0.99% significantly (p < 0.001) increases in daily deaths because of high pollutants in non-green space countries (Table 4).

4. Discussion

Worldwide, a large percentage of the population dwells in urban areas, along with considerable benefits to health, education, and economies; however, urbanization has brought significant challenges for the social and natural biological systems. The quality of the urban ecosystem mainly depends on the residential setup, population, and availability of green spaces. The green areas are essential for natural biological productivity, environmental eminence and promote human health [12]. The green spaces provide ecological benefits by negating “urban heat, offsetting greenhouse gas emissions, and attenuating stormwater”. The green areas have direct health benefits by giving opportunities to the people for social interaction, physical activities, and psychological restoration [13]. In green space regions, plants, trees, grass, and other green vegetation provide wildlife habitat, prevent soil erosion, absorb and shield air pollutants, and provide fresh and clean air and minimize disease burden. The environmentally green space regions offer the community a happy and healthy living environment [14,15,16].
The swift worldwide urbanization with extreme weather-related conditions intensifies the effect of environmental threats such as air pollution, sandstorms, and heatwaves [17,18]. Environmental pollution has developed a threatening situation, particularly in the urban parts of the planet, where it generates a condition commonly called “background contamination” [19]. The epidemiologic studies have established an association among day-to-day differences in health outcomes, daily incidence and deaths, and variations in ambient particulate matter (PM) levels. Recent literature highlights that fine particulate air pollution has become an increasing problem for human health and risks hospital admission for cardiorespiratory diseases [20,21].
The green space value for human health has gained increasing attention during the present global pandemic of COVID-19. The pandemic has developed a highly hostile and frightening situation worldwide, and it caused considerable health and monetary losses globally [22]. The literature has established a link between PM pollution to the spread of COVID-19. Conticini et al., 2020 [23] performed a study in Italy and found that air pollution is considered an additional co-factor for causative high levels of lethality recorded more in the polluted area. In environmentally contaminated regions, about 12% of infected patients died compared to an average of 6.4% globally.
The scientific literature highlights that ecological pollutants enhance the spread of SARS-CoV-2 [24]. Zheng et al., 2001 [25] demonstrated that exposure to “NO2, PM2.5, and PM10” was related to a rise of about 38%, 32.0%, and 14.0% in SARS-CoV-2 cases, respectively. The results further highlight that atmospheric pollution has a linkage to SARS-COV-2 infection vulnerability to the population.
Zhu et al., 2020 [26] found a positive linkage between “PM2.5, PM10, CO, and O3” with SARS-CoV-2 disease in China. Coccia, 2021 [27] conducted a study in Italy, found that about 75% of individuals infected and 81% of deaths during the first wave of COVID-19 pandemic were in industrial areas with high air pollution. Furthermore, Qaid et al., 2021 [28] reported that PM2.5 has a relationship with the COVID-19 infected cases. Similarly, Bashir et al., 2020 [29] established a relationship and found that “PM10, PM2.5, SO2, NO2, and CO were linked with the COVID-19 epidemic in California”. Consistently, Chakrabarty et al., 2002 [30] identified that PM2.5 pollutants cause people more vulnerable to SARS-CoV-2 infection in the various states of the USA. Congruently, Paital and Agrawal, 2020 [31] also found that air impurities increase the risk of COVID-19 disease.
More recently, Meo and Abukhalaf et al., 2021 [7] steered a study on the impact of “PM2.5, CO, and O3 on the incidence and mortality of SARS-COV-2 infection in California, USA”. The authors identified that PM2.5 and CO were linked with increasing SARS-COV-2 cases and deaths in San Francisco. Another study piloted by Meo and colleagues et al., 2021 [9] reported that “PM2.5, CO, and O3” positively correlate with SARS-CoV-2 daily cases and deaths in London, UK. These studies support the supposition that “air pollutants PM2.5, PM10, and CO are connected with SARS-CoV-2 daily cases and deaths. The present study result reveals that air pollutants significantly decreased in environmentally green countries compared to less-green countries. Moreover, SARS-CoV-2 cases and deaths were significantly low in highly green countries compared to less-green countries. The findings support the hypothesis that plants, trees, and vegetation minimize the air pollutants and decrease the SARS-CoV-2 cases and deaths; results have an important message that nature positively impacts human wellbeing. It is vital to discuss the mechanisms behind the green space and how it can reduce the SARS-CoV-2 cases and deaths.
Roviello and colleagues [32] demonstrated that the pandemic’s severity was lower in southern Italy, with more forest per hectare. The lowest mortality rates were in Molise and Basilicata regions, where the forest was higher. The results further suggest that green forests and shrubland plants could protect the southern population. In another study, Roviello and colleagues [33] reported that the percentage of deaths per population was lower in greener areas such as Sardinia, Calabria, and Basilica versus northern regions with low forest coverage Lombardy and Emilia Romagna.

Possible Mechanism of How SARS-COV-2 Cases and Deaths Are Low in Green Space Regions

The present study findings established some mechanisms for a thoughtful understanding of the impact of green space and its lowering impact on SARS-COV-2 cases and deaths. It is a fact that SARS-CoV-2 can spread with fine, ultrafine air pollutants on which the virus particles lie. The air pollutants get the surface particles and swiftly conveyances them long-distance [34]. The lungs’ exposure to air pollutants causes lung damage due to “oxidative stress, macrophage disfunction, and a disrupted epithelial barrier”. These factors drive increased lung damage [26,27] and increased SARS-C0V2 deaths. The pathophysiology of SARS-CoV-2 is mainly due to “redox-active components of air pollutants, oxidative mechanisms, and ACE2 overexpression underlying air pollution-exacerbated SARS-CoV-2 transmission” [35]. Moreover, air pollutants PM pollutants act as haulers of the virus, impair immunity and cause individuals to be susceptible to pathogens [20]. These pieces of evidence patronage the premise that air pollutants can play a role in spreading the SARS-CoV-2 infection [20,36]. The importance of this study is the use of plants, trees, green space as “scavengers” of particulate matter. In green areas, plants, vegetation performs essential ecological functions by removing various air pollutants [37].
McDonald et al., 2007 [38] reported that an increase in tree cover up to 54% would reduce air pollutants PM concentration by 26% by removing 200 tons of particulate matter per year. Similarly, increasing tree cover from 3.6% to 8% would reduce the pollutants by 2% from the entire environment. The health impact of urban green areas against particulate matter can be relevant because once the air particles flow in a turbulent, they hit a plant, trees, leaves, and adhere through dry deposition [39,40,41], and plant leaves can easily absorb the air pollutants.
According to study findings available in scientific literature, 1 m2 of leaf area can absorb 70 mg and 2.8 g of particulate matter per year [40,42]. It has also been reported that one hectare of trees, with 11% plant planting, removed 9.7 kg of pollution in a year [43] and removed the whole city area around 600 km2, 591 tons. Yang et al., 2005 [44] showed that plants in central Beijing removed about 1241 tons of particulate matter per annum. In another study, Nowak et al., 2013 [45] demonstrated the removal of PM2.5 from the trees in various 10 US cities. The quantity of PM2.5 removed annually from trees varies from 4.7 tons in NY to 64.5 tons in Atlanta. Ozdemir 2019 [46] determined the impact of roadside plants on vehicle-related PM2.5 and heavy metals. The authors identified that roadside PM2.5 levels were significantly reduced by 17%, and maximum removal of heavy metals. This function of absorbing the air pollutants by plants, trees and minimizing air pollution has significant value and community benefits by reducing human diseases and mortality. This is the fact that nature positively impacts human wellbeing.

5. Study Strengths and Limitations

This is the first novel study exploring the impact of the green space environment on air pollutants, “PM2.5, PM10, CO, O3, and SARS-CoV-2 daily cases and deaths”. It also helps to deepen the knowledge of how the plants, trees, and green vegetation minimize the air pollutants and the SARS-CoV-2 cases and deaths and prevent people from the COVID-19 pandemic. A limitation of this study is that SARS-CoV-2 cases and deaths may be altered for other factors such as temperature, humidity, population density, health care system, face mask, social distancing, and other air pollutants.

6. Conclusions

The air pollutants PM2.5, PM10, CO, and SARS-CoV-2 cases and deaths significantly decreased in environmentally highly green countries compared to less-green countries. The plants, grass, vegetation could capture the air pollutants and lower the air pollutants and SARS-CoV-2 cases and deaths. The study verdicts have an important message to policymakers and the public about the health impact of people living in environmentally green regions and its association with air pollutants and SARS-CoV-2 cases and deaths. The policymakers must implement strict policies to keep the living environment, surroundings, towns, and cities clean and green to minimize air pollution and combat against various diseases, including the COVID-19 pandemic.

Author Contributions

S.A.M.: research conceptualization, supervision, manuscript writing, and editing; F.J.A.: data collection, analysis, A.A.A.: data collection, data entry; A.M.U.: data checking and analysis. All authors have read and agreed to the published version of the manuscript.

Funding

King Saud University, Riyadh, Saudi Arabia (RSP-2021/47).

Institutional Review Board Statement

N/A; For this study, the “data on the daily new cases and deaths due to COVID-19 pandemic, particulate matter PM2.5, PM10, CO, and O3 allied information were obtained from the publicly available databases; hence ethical approval was not required”.

Informed Consent Statement

Not applicable.

Data Availability Statement

Data may be provided on reasonable request to the corresponding author.

Acknowledgments

We thank the “Researchers supporting project number (RSP-2021/47), King Saud University, Riyadh, Saudi Arabia”.

Conflicts of Interest

The authors declare no conflict of interest.

References

  1. World Bank: Urban Population (% of the Total Population). Available online: https://data.worldbank.org/indicator/SP.URB.TOTL.IN.ZS (accessed on 10 August 2021).
  2. Meo, S.A.; Abukhalaf, A.A.; Alomar, A.A.; Al-Beeshi, I.Z.; Alhowikan, A.; Shafi, K.M.; Meo, A.S.; Usmani, A.M.; Akram, J. Climate and COVID-19 pandemic: Effect of heat and humidity on the incidence and mortality in world’s top ten hottest and top ten coldest countries. Eur. Rev. Med. Pharmacol. Sci. 2020, 24, 8232–8238. [Google Scholar] [PubMed]
  3. The State of the World Forest. Available online: https://www.fao.org/state-of-forests/en/ (accessed on 20 November 2021).
  4. Taylor, L.; Hochuli, D.F. Defining greenspace: Multiple uses across multiple disciplines. Landsc. Urban Plan. 2017, 157, 25–38. [Google Scholar] [CrossRef] [Green Version]
  5. World Health Organization: Urban Green Spaces—A Brief for Action. Available online: https://www.euro.who.int/en/health-topics (accessed on 10 August 2021).
  6. Meo, S.A.; Almutairi, F.J.; Abukhalaf, A.A.; Alessa, O.M.; Al-Khlaiwi, T.; Meo, A.S. Sandstorm and its effect on particulate matter PM 2.5, carbon monoxide, nitrogen dioxide, ozone pollutants, and SARS-CoV-2 cases and deaths. Sci. Total Environ. 2021, 795, 148764. [Google Scholar] [CrossRef] [PubMed]
  7. Meo, S.A.; Abukhalaf, A.A.; Alomar, A.A.; Alessa, O.M.; Sami, W.; Klonoff, D.C. Effect of environmental pollutants PM-2.5, carbon monoxide, and ozone on the incidence and mortality of SARS-COV-2 infection in ten wildfire-affected counties in California. Sci. Total Environ. 2021, 757, 143948. [Google Scholar] [CrossRef]
  8. World Health Organization. COVID-19 Coronavirus. Available online: https://covid19.who.int/info/ (accessed on 26 November 2021).
  9. Meo, S.A.; Abukhalaf, A.A.; Sami, W.; Hoang, T.D. Effect of environmental pollution PM2.5, carbon monoxide, and ozone on the incidence and mortality due to SARS-CoV-2 infection in London, United Kingdom. J. King Saud Univ.-Sci. 2021, 33, 101373. [Google Scholar] [CrossRef]
  10. Environmental Performance Index (EPI) Data. Available online: https://epi.yale.edu/epi-results/2020/component/epi (accessed on 4 August 2021).
  11. Air Quality Index (AQI). Air Pollution in the World. Available online: https://aqicn.org/city/all/ (accessed on 4 August 2021).
  12. Reynolds, W.D.; Drury, C.F.; Yang, X.M.; Tan, C.S. Optimal soil physical quality is inferred through structural regression and parameter interactions. Geoderma 2008, 146, 466–474. [Google Scholar] [CrossRef]
  13. Lee, A.C.; Jordan, H.C.; Horsley, J. Value of urban green spaces in promoting healthy living and wellbeing: Prospects for planning. Risk Manag. Healthc. Policy 2015, 8, 131–137. [Google Scholar] [CrossRef] [Green Version]
  14. Wolch, J.R.; Byrne, J.; Newell, J.P. Urban green space, public health, and environmental justice: The challenge of making cities just green enough. Landsc. Urban Plan. 2014, 125, 234–244. [Google Scholar] [CrossRef] [Green Version]
  15. Chen, A.; Yao, X.A.; Sun, R.; Chen, L. Effect of urban green patterns on surface urban cool islands and seasonal variations. Urban For. Urban Green. 2014, 13, 646–654. [Google Scholar] [CrossRef]
  16. Ferrini, F.; Fini, A.; Mori, J.; Gori, A. Role of Vegetation as a Mitigating Factor in the Urban Context. Sustainability 2020, 12, 4247. [Google Scholar] [CrossRef]
  17. Rötzer, T.; Rahman, M.A.; Moser-Reischl, A.; Pauleit, S.; Pretzsch, H. Process-based simulation of tree growth and ecosystem services of urban trees under present and future climate conditions. Sci. Total Environ. 2019, 676, 651–664. [Google Scholar] [CrossRef]
  18. Pielke, R.A. Tracking progress on the economic costs of disasters under the indicators of the sustainable development goals. Environ. Hazards 2019, 18, 1–6. [Google Scholar] [CrossRef]
  19. Escobedo, F.J.; Kroeger, T.; Wagner, J.E. Urban forests and pollution mitigation: Analyzing ecosystem services and disservices. Environ. Pollut. 2011, 159, 2078–2087. [Google Scholar] [CrossRef]
  20. Zhou, L.; Tao, Y.; Li, H.; Niu, Y.; Li, L.; Kan, H.; Xie, J.; Chen, R. Acute effects of fine particulate matter constituents on cardiopulmonary function in a panel of COPD patients. Sci. Total Environ. 2021, 770, 144753. [Google Scholar] [CrossRef]
  21. Wu, Y.; Li, H.; Xu, D.; Li, H.; Chen, Z.; Cheng, Y.; Yin, G.; Niu, Y.; Liu, C.; Kan, H.; et al. Associations of fine particulate matter and its constituents with airway inflammation, lung function, and buccal mucosa microbiota in children. Sci. Total Environ. 2021, 773, 145619. [Google Scholar] [CrossRef]
  22. Meo, S.A.; Bukhari, I.A.; Akram, J.; Meo, A.S.; Klonoff, D.C. COVID-19 vaccines: Comparing biological, pharmacological characteristics and adverse effects of Pfizer/BioNTech and Moderna Vaccines. Eur. Rev. Med. Pharmacol. Sci. 2021, 25, 1663–1669. [Google Scholar]
  23. Conticini, E.; Frediani, B.; Caro, D. Can atmospheric pollution be considered a co-factor in an extremely high level of SARS-CoV-2 lethality in Northern Italy? Environ. Pollut. 2020, 262, 114465. [Google Scholar] [CrossRef]
  24. Gautam, S.; Samuel, C.; Gautam, A.S.; Kumar, S. Strong link between coronavirus count and bad air: A case study of India. Environ. Dev. Sustain. 2021, 23, 16632–16645. [Google Scholar] [CrossRef]
  25. Zheng, P.; Chen, Z.; Liu, Y.; Song, H.; Wu, C.H.; Li, B.; Kraemer, M.U.G.; Tian, H.; Yan, X.; Zheng, Y.; et al. Association between coronavirus disease 2019 (COVID-19) and long-term exposure to air pollution: Evidence from the first epidemic wave in China. Environ. Pollut. 2021, 276, 116682. [Google Scholar] [CrossRef]
  26. Zhu, Y.; Xie, J.; Huang, F.; Cao, L. Association between short-term exposure to air pollution and COVID-19 infection: Evidence from China. Sci. Total Environ. 2020, 727, 138704. [Google Scholar] [CrossRef]
  27. Coccia, M. Effects of the spread of COVID-19 on public health of polluted cities: Results of the first wave for explaining the dejà vu in the second wave of COVID-19 pandemic and epidemics of future vital agents. Environ. Sci. Pollut. Res. Int. 2021, 28, 19147–19154. [Google Scholar] [CrossRef] [PubMed]
  28. Qaid, A.; Bashir, M.F.; Remaz, O.D.; Shahzad, K. Long-term statistical assessment of meteorological indicators and COVID-19 outbreak in a hot and arid climate, Bahrain. Environ. Sci. Pollut. Res. Int. 2021, 1–11. [Google Scholar] [CrossRef]
  29. Bashir, M.F.; Ma, B.J.; Bilal, K.B.; Bashir, M.A.; Farooq, T.H.; Iqbal, N.; Bashir, M. Correlation between environmental pollution indicators and COVID-19 pandemic: A brief study in Californian context. Environ. Res. 2020, 187, 109652. [Google Scholar] [CrossRef] [PubMed]
  30. Chakrabarty, R.K.; Beeler, P.; Liu, P.; Goswami, S.; Harvey, R.D.; Pervez, S.; Donkelaar, A.; Martin, R.V. Ambient PM2.5 exposure and rapid spread of COVID-19 in the United States. Sci. Total Environ. 2020, 760, 143391. [Google Scholar] [CrossRef]
  31. Paital, B.; Agrawal, P.K. Air pollution by NO2 and PM2.5 explains COVID-19 infection severity by overexpression of angiotensin-converting enzyme 2 in respiratory cells: A review. Environ. Chem. Lett. 2020, 18, 1–18. [Google Scholar] [CrossRef]
  32. Roviello, V.; Roviello, G.N. Lower COVID-19 mortality in Italian forested areas suggests immunoprotection by Mediterranean plants. Environ. Chem. Lett. 2020, 14, 1–12. [Google Scholar] [CrossRef]
  33. Roviello, V.; Roviello, G.N. Less COVID-19 deaths in southern and insular Italy explained by forest bathing, Mediterranean environment, and antiviral plant volatile organic compounds. Environ. Chem. Lett. 2021, 1–11. [Google Scholar] [CrossRef]
  34. Grousset, F.E.; Ginoux, P.; Bory, A.; Biscaye, P.E. Case study of a Chinese dust plume reaching the French Alps. Geophys. Res. Lett. 2003, 30, 1277. [Google Scholar] [CrossRef]
  35. Lai, A.; Chang, M.L.; O’Donnell, R.P.; Zhou, C.; Sumner, J.A.; Hsiai, T.K. Association of COVID-19 transmission with high levels of ambient pollutants: Initiation and impact of the inflammatory response on cardiopulmonary disease. Sci. Total Environ. 2021, 779, 146464. [Google Scholar] [CrossRef]
  36. Yao, Y.; Pan, J.; Wang, W.; Liu, Z.; Kan, H.; Qiu, Y.; Meng, X.; Wang, W. Association of particulate matter pollution and case fatality rate of COVID-19 in 49 Chinese cities. Sci. Total Environ. 2020, 741, 140396. [Google Scholar] [CrossRef]
  37. Leung, D.Y.; Tsui, J.K.; Chen, F.; Yip, W.K.; Vrijmoed, L.L.; Liu, C.H. Effects of urban vegetation on urban air quality. Landsc. Res. 2011, 36, 173–188. [Google Scholar] [CrossRef]
  38. McDonald, A.G.; Bealey, W.J.; Fowler, D.; Dragosits, U.; Skiba, U.; Smith, R.I.; Donovan, R.G.; Brett, H.E.; Hewitt, C.N.; Nemitz, E. Quantifying the effect of urban tree planting on concentrations and depositions of PM10 in two UK conurbations. Atmos. Environ. 2007, 41, 8455–8467. [Google Scholar] [CrossRef]
  39. Beckett, K.P.; Freer-Smith, P.H.; Taylor, G. Particulate pollution capture by urban trees: Effect of species and windspeed. Glob. Chang. Biol. 2000, 6, 995–1003. [Google Scholar] [CrossRef]
  40. Beckett, K.P.; Freer-Smith, P.; Taylor, G. Effective tree species for local air quality management. J. Arboric. 2000, 26, 12–19. [Google Scholar]
  41. Rai, P.K. Impacts of particulate matter pollution on plants: Implications for environmental biomonitoring. Ecotox. Environ. Saf. 2016, 129, 120–136. [Google Scholar] [CrossRef]
  42. Nowak, D.J.; Crane, D.E.; Stevens, J.C. Air pollution removal by urban trees and shrubs in the United States. Urban For. Urban Green. 2006, 4, 115–123. [Google Scholar] [CrossRef]
  43. Nowak, D.J. Air Pollution Removal by Chicago’s Urban Forest. In Chicago’s Urban Forest Ecosystem: Results of the Chicago Urban Forest Climate Project; United States Department of Agriculture: Radnor, PA, USA, 1994; pp. 63–81. [Google Scholar]
  44. Yang, F.; He, K.; Ye, B.; Chen, X.; Cha, L.; Cadle, S.H.; Chan, T.; Mulawa, P.A. One-year record of organic and elemental carbon in fine particles in downtown Beijing and Shanghai. Atmos. Chem. Phys. 2005, 5, 1449–1457. [Google Scholar] [CrossRef] [Green Version]
  45. Nowak, D.J.; Hirabayashi, S.; Bodine, A.; Hoehn, R. Modeled PM2.5 removals by trees in ten US cities and associated health effects. Environ. Pollut. 2013, 178, 395–402. [Google Scholar]
  46. Ozdemir, H. Mitigation impact of roadside trees on fine particle pollution. Sci. Total Environ. 2019, 659, 1176–1185. [Google Scholar] [CrossRef]
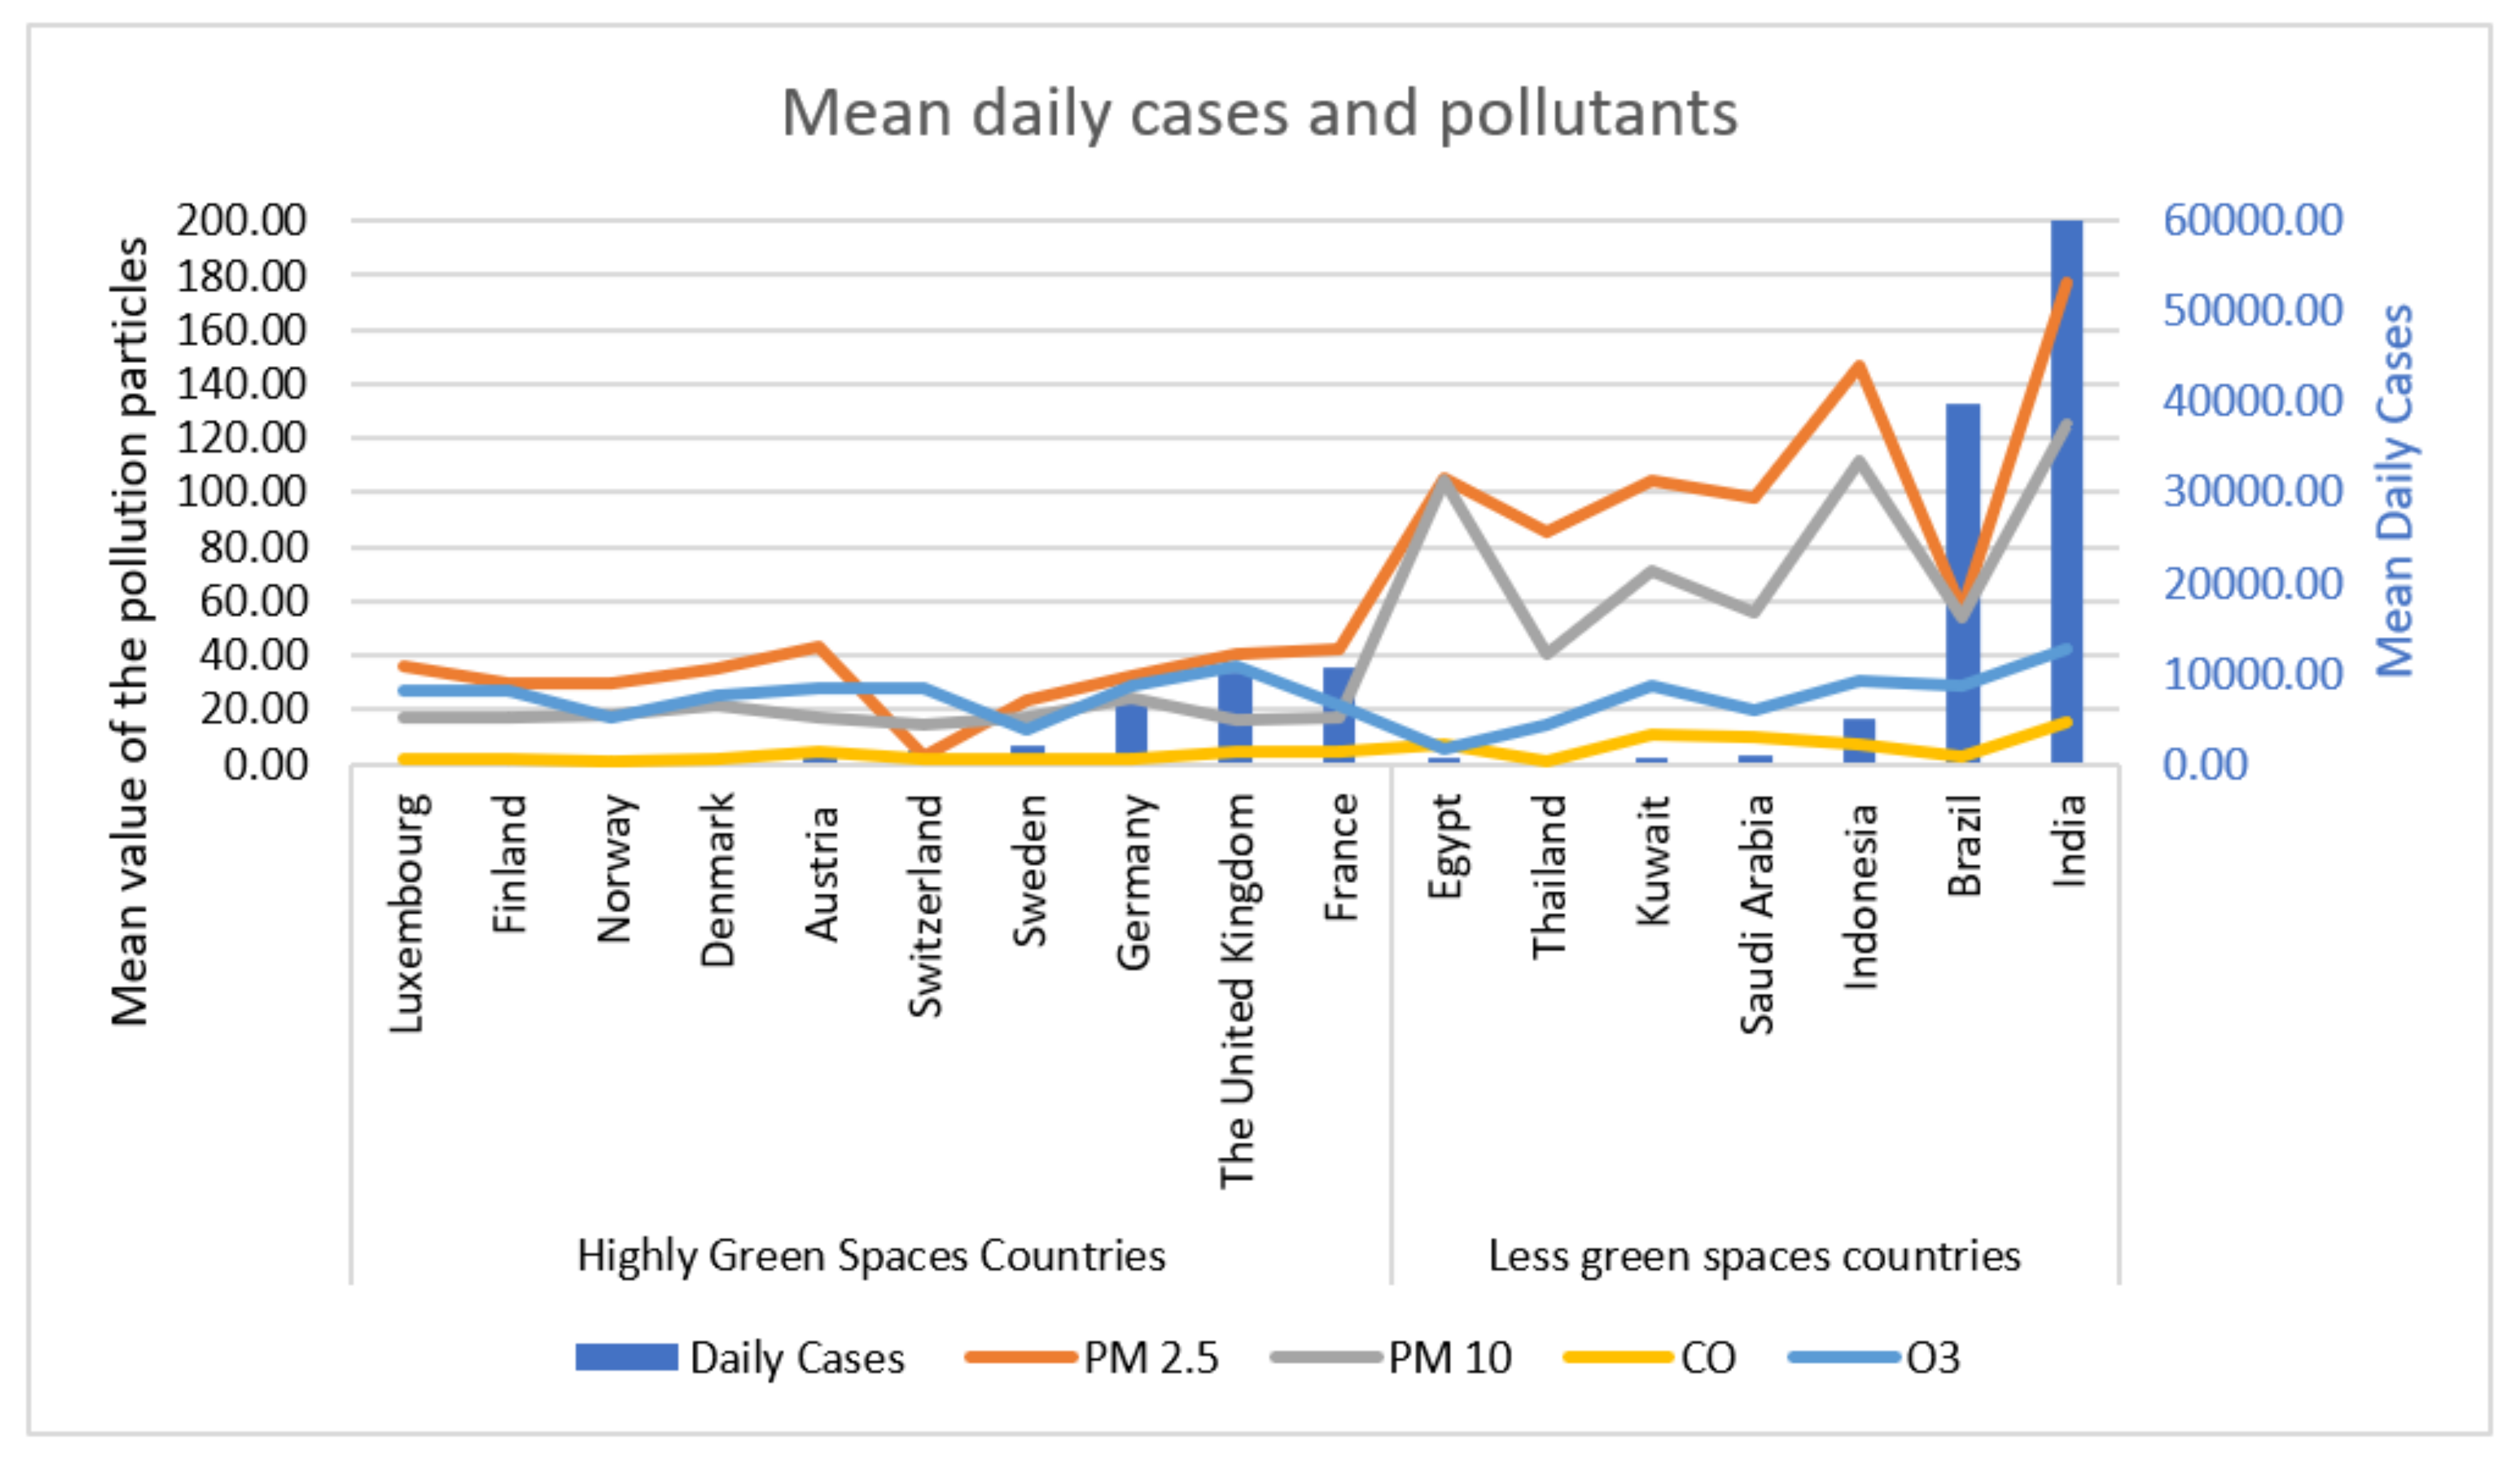
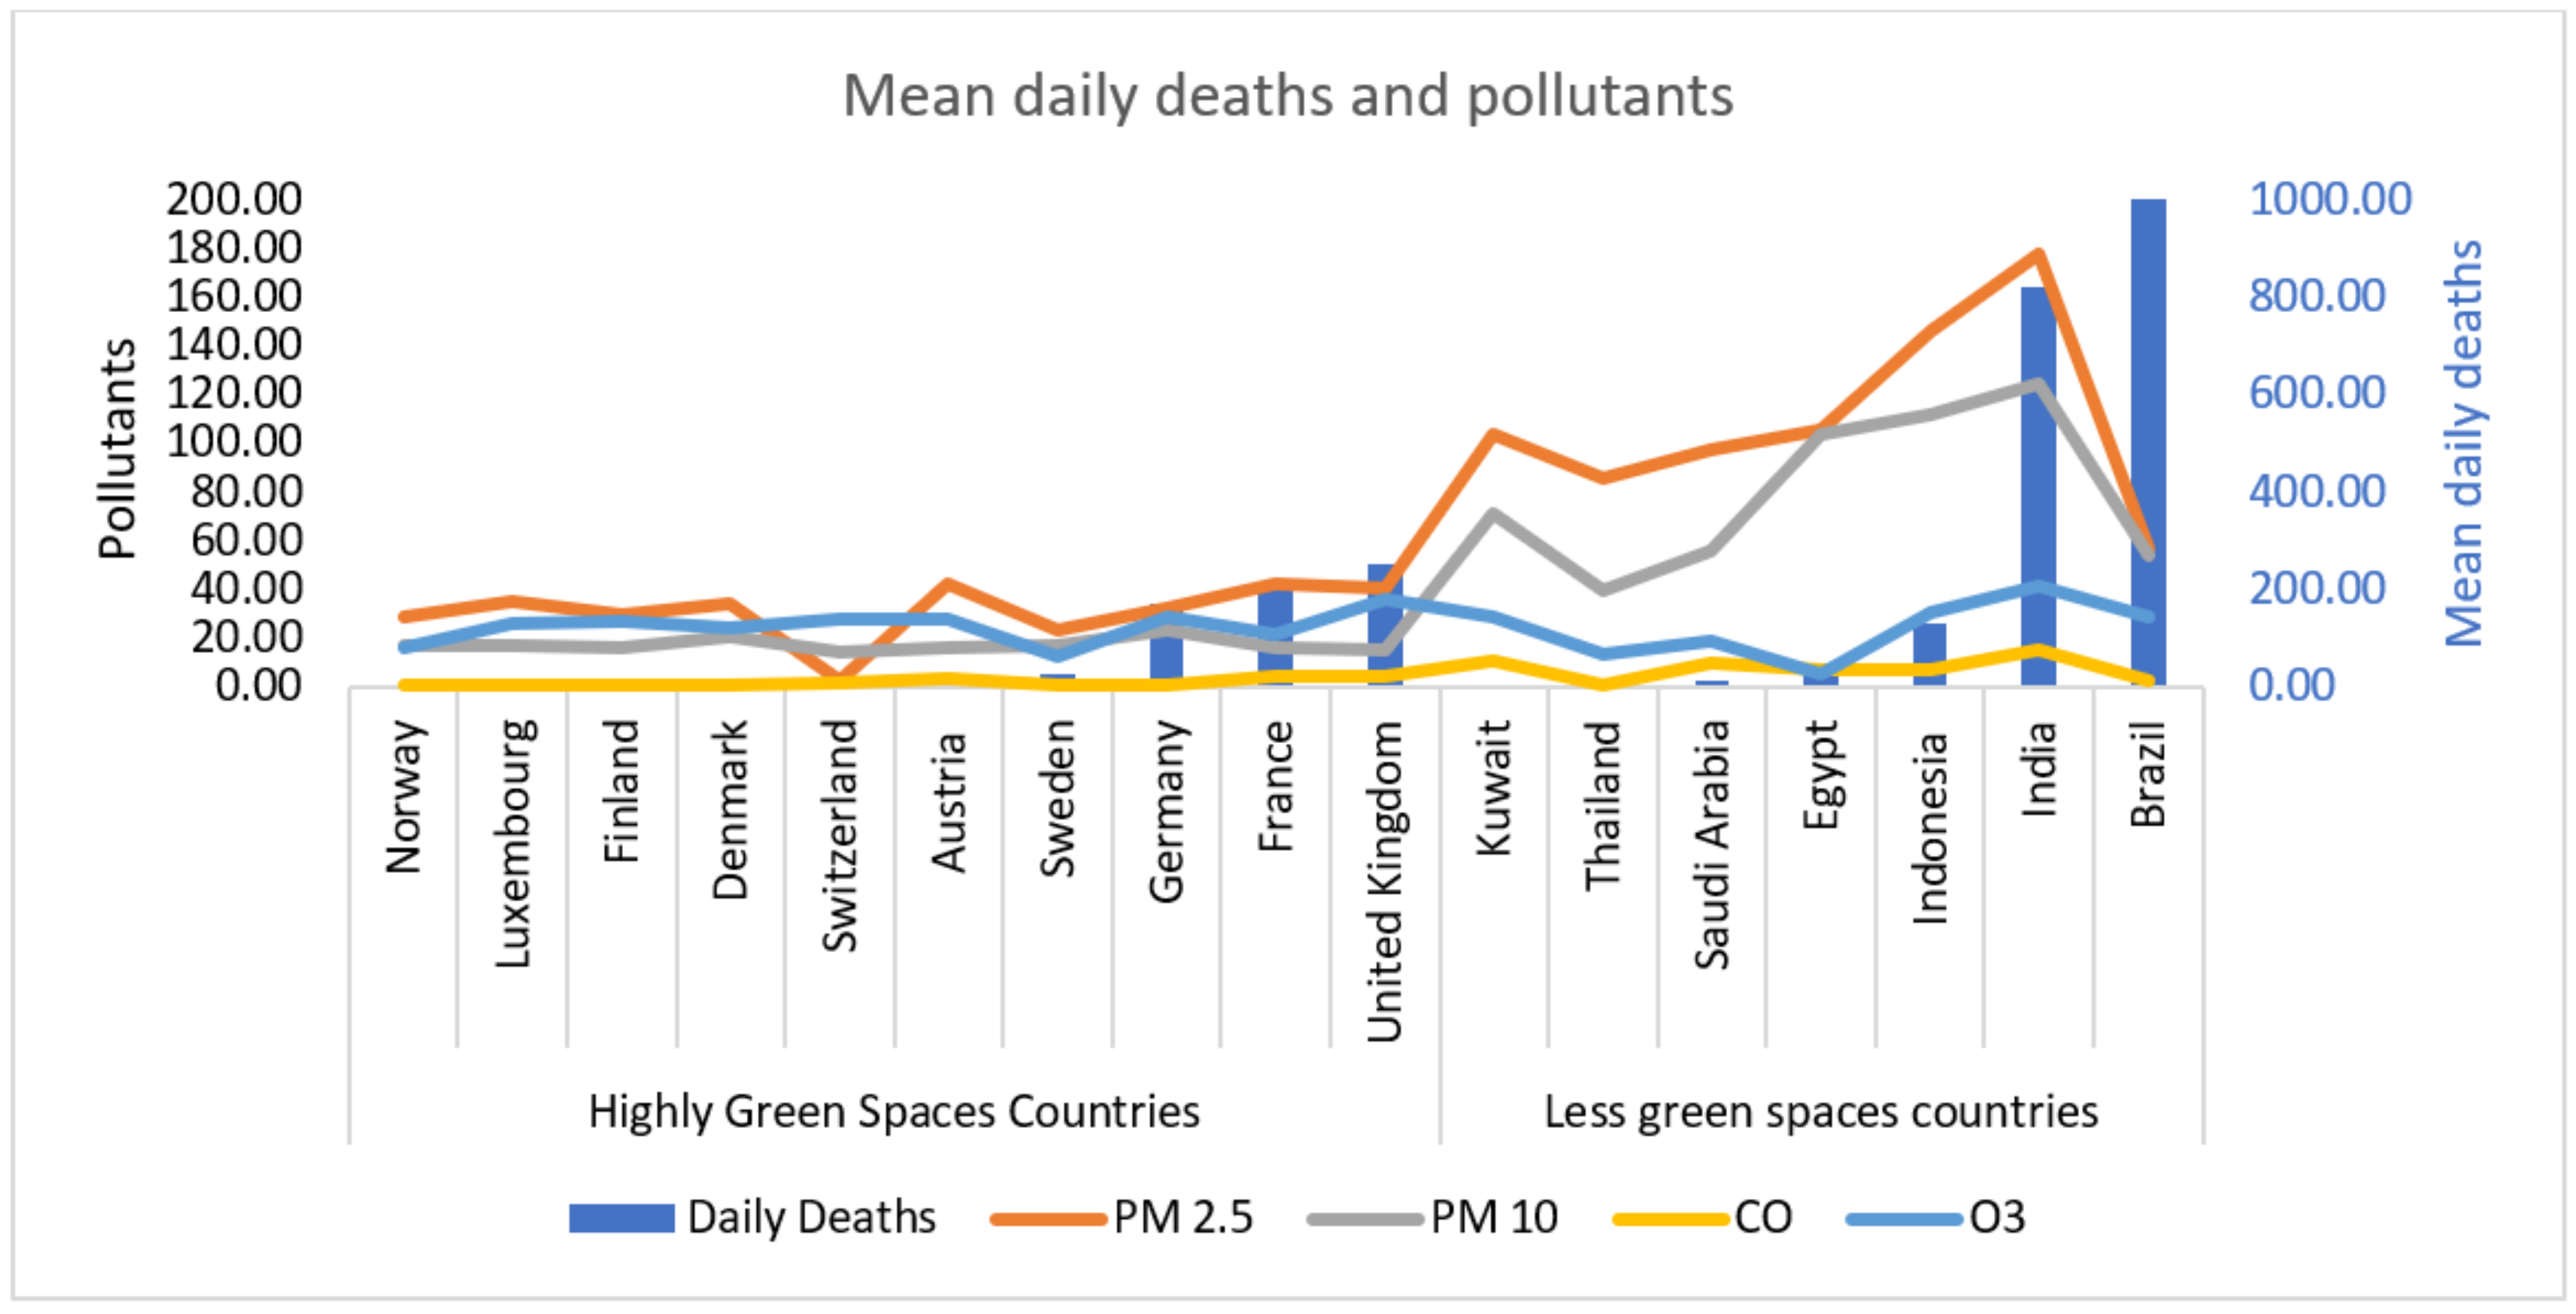
Figure 1. Environmental pollutants PM2.5, PM10, CO, O3, and daily cases due to SARS-CoV-2 in highly green and less-green space countries.
Ijerph 18 13151 g001
Figure 2. Environmental pollutants PM2.5, PM10, CO, O3, and daily deaths due to SARS-CoV-2 in highly green and less-green space countries.
Ijerph 18 13151 g002
Figure 3. SARS-CoV-2 daily cases and deaths in highly green and less-green space countries.
Ijerph 18 13151 g003
Figure 4. Comparison of mean daily cases and daily deaths during the study period.
Ijerph 18 13151 g004
Figure 5. Graphical presentation and comparison of environmental pollutants PM2.5, PM10, CO, O3, and SARS-CoV-2 cases and deaths in highly green and less-green space countries.
Ijerph 18 13151 g005
Table 1. Environmental pollutants, PM2.5, PM10, CO, O3, SARS-CoV-2 daily cases, and deaths in highly green and less-green space countries.
CountriesEPI ScoreData Collection PeriodCases
Mean ± SD
Deaths
Mean ± SD
PM2.5
Mean ± SD
PM10
Mean ± SD
CO
Mean ± SD
O3
Mean ± SD
Highly Green Space Countries (n = 10)
Denmark82.527 February 2020 to 11 July 2021596.04 ± 33.255.07 ± 0.3732.99 ± 0.5121.30 ± 0.511.41 ± 0.4724.90 ± 0.37
Luxembourg82.31 March 2020 to 11 July 2021147.50 ± 9.091.64 ± 0.1135.70 ± 0.6617.21 ± 0.301.42 ± 0.0426.58 ± 0.54
Switzerland81.524 February 2020 to 11 July 20211449.46 ± 88.6920.35 ± 1.382.99 ± 0.0614.26 ± 0.451.89 ± 0.0827.78 ± 0.55
United Kingdom81.324 February 2020 to 11 July 202110,098.98 ± 624.04254.76 ± 16.8840.65 ± 1.3115.97 ± 0.454.41 ± 0.1525.18 ± 0.65
France80.024 January2020 to 11 July 202110,642.99 ± 631.98206.30 ± 12.1242.26 ± 1.3316.65 ± 0.454.41 ± 0.1621.60 ± 0.56
Austria79.626 February 2020 to 11 July 20211289.00 ± 77.5020.79 ± 1.4643.06 ± 1.0916.84 ± 0.464.22 ± 0.1627.97 ± 0.55
Finland78.927 February 2020 to 11 July 2021195.77 ± 9.991.94 ± 0.1729.87 ± 0.5916.61 ± 0.481.30 ± 0.0427.22 ± 0.40
Sweden78.731 January 2020 to 11 July 20212069.32 ± 115.4827.58 ± 1.4723.77 ± 0.6616.99 ± 0.571.52 ± 0.0423.95 ± 0.350
Norway77.726 February 2020 to 11 July 2021264.53 ± 18.551.59 ± 0.1629.39 ± 0.5817.75 ± 0.431.21 ± 0.0616.79 ± 0.32
Germany77.228 January 2020 to 11 July 20217036.09 ± 389.81171.80 ± 11.8532.35 ± 0.4824.01 ± 0.631.59 ± 0.0528.96 ± 0.49
Less-Green Space Countries (n = 07)
Kuwait53.63 February 2020 to 11 July 2021752.62 ± 22.484.22 ± 0.16104.38 ± 1.8271.49 ± 2.4510.92 ± 0.2429.01 ± 0.66
Brazil51.23 February 2020 to 11 July 202139,871.37 ± 1276.991069.79 ± 40.4357.07 ± 1.3854.37 ± 1.663.04 ± 0.1128.75 ± 0.56
Thailand45.43 February 2020 to 11 July 2021676.71 ± 71.725.45 ± 0.6485.68 ± 2.7540.38 ± 0.801.15 ± 0.0713.91 ± 0.38
Saudi Arabia44.03 February 2020 to 11 July 20211006.20 ± 47.6616.02 ± 0.6097.80 ± 1.6355.83 ± 2.559.97 ± 0.3619.53 ± 0.80
Egypt43.33 February 2020 to 11 July 2021569.37 ± 20.4332.96 ± 1.03105.59 ± 1.75104.22 ± 3.077.37 ± 0.225.85 ± 0.14
Indonesia37.83 February 2020 to 11 July 20215072.28 ± 268.98133.45 ± 6.16146.85 ± 3.28111.91 ± 3.597.51 ± 0.2430.69 ± 1.08
India27.63 February 2020 to 11 July 202162,046.71 ± 4133.54821.00 ± 50.88177.74 ± 3.78124.78 ± 3.8715.48 ± 0.7442.08 ± 3.10
Table 2. Comparison between environmental pollutants PM2.5, PM10, CO, O3, and SARS-CoV-2 cases and deaths in highly green and less-green space countries.
Low Green Space Countries (n = 07)Highly Green Space Countries (n = 10)
ParametersMean ± SEMMean ± SEMp-Value
PM 2.5 μm (ppm)110.73 ± 1.0931.35 ± 0.290.0001
PM 10 μm (ppm)80.43 ± 1.1117.78 ± 0.150.0001
CO (ppm)7.92 ± 0.142.35 ± 0.030.0001
O3 (DU)24.26 ± 0.5125.09 ± 0.150.613
SARS-CoV-2 daily cases (n)15,713.61 ± 702.423445.59 ± 108.090.0001
SARS-CoV-2 daily deaths (n)297.56 ± 11.2772.54 ± 2.610.0001
Table 3. Pearson correlation between environmental pollutants, PM2.5, PM10, CO, O3, and SARS-CoV-2 cases and deaths in highly green and less-green space countries.
ParametersLow Green Space Countries (n = 7)Highly Green SPACE Countries (n = 10)
PollutantsDaily CasesDaily DeathsDaily CasesDaily Deaths
PM2.5 μm (ppm)0.256 * (0.0001)0.118 * (0.0001)0.203 * (0.0001)0.137 * (0.0001)
PM10 μm (ppm)0.159 * (0.0001)0.095 * (0.0001)0.108 * (0.0001)0.101 * (0.0001)
CO (ppm)0.174 * (0.0001)0.071 * (0.0001)0.434 * (0.0001)0.345 * (0.0001)
O3 (DU)0.343 * (0.0001)0.288 * (0.0001)0.114 * (0.0001)0.046 * (0.007)
* shows the level of significance.
Table 4. Binary logistic regression analysis for daily cases and daily deaths in low green space countries.
VariablesAdjusted Odds Ratios (OR)95% CIp-Value
Daily cases1.01.00–1.00p < 0.001 ***
Daily Deaths0.990.998–0.99p < 0.001 ***
Population1.01.00–1.00p < 0.001 ***
*** Significance = strongly significant at p < 0.05, CI = Confidence Interval.
Publisher’s Note: MDPI stays neutral with regard to jurisdictional claims in published maps and institutional affiliations.

