
Weight Change Is Associated with Osteoporosis: A Cross Sectional Study Using the Korean Community Health Survey


Abstract
:1. Introduction
2. Materials and Methods
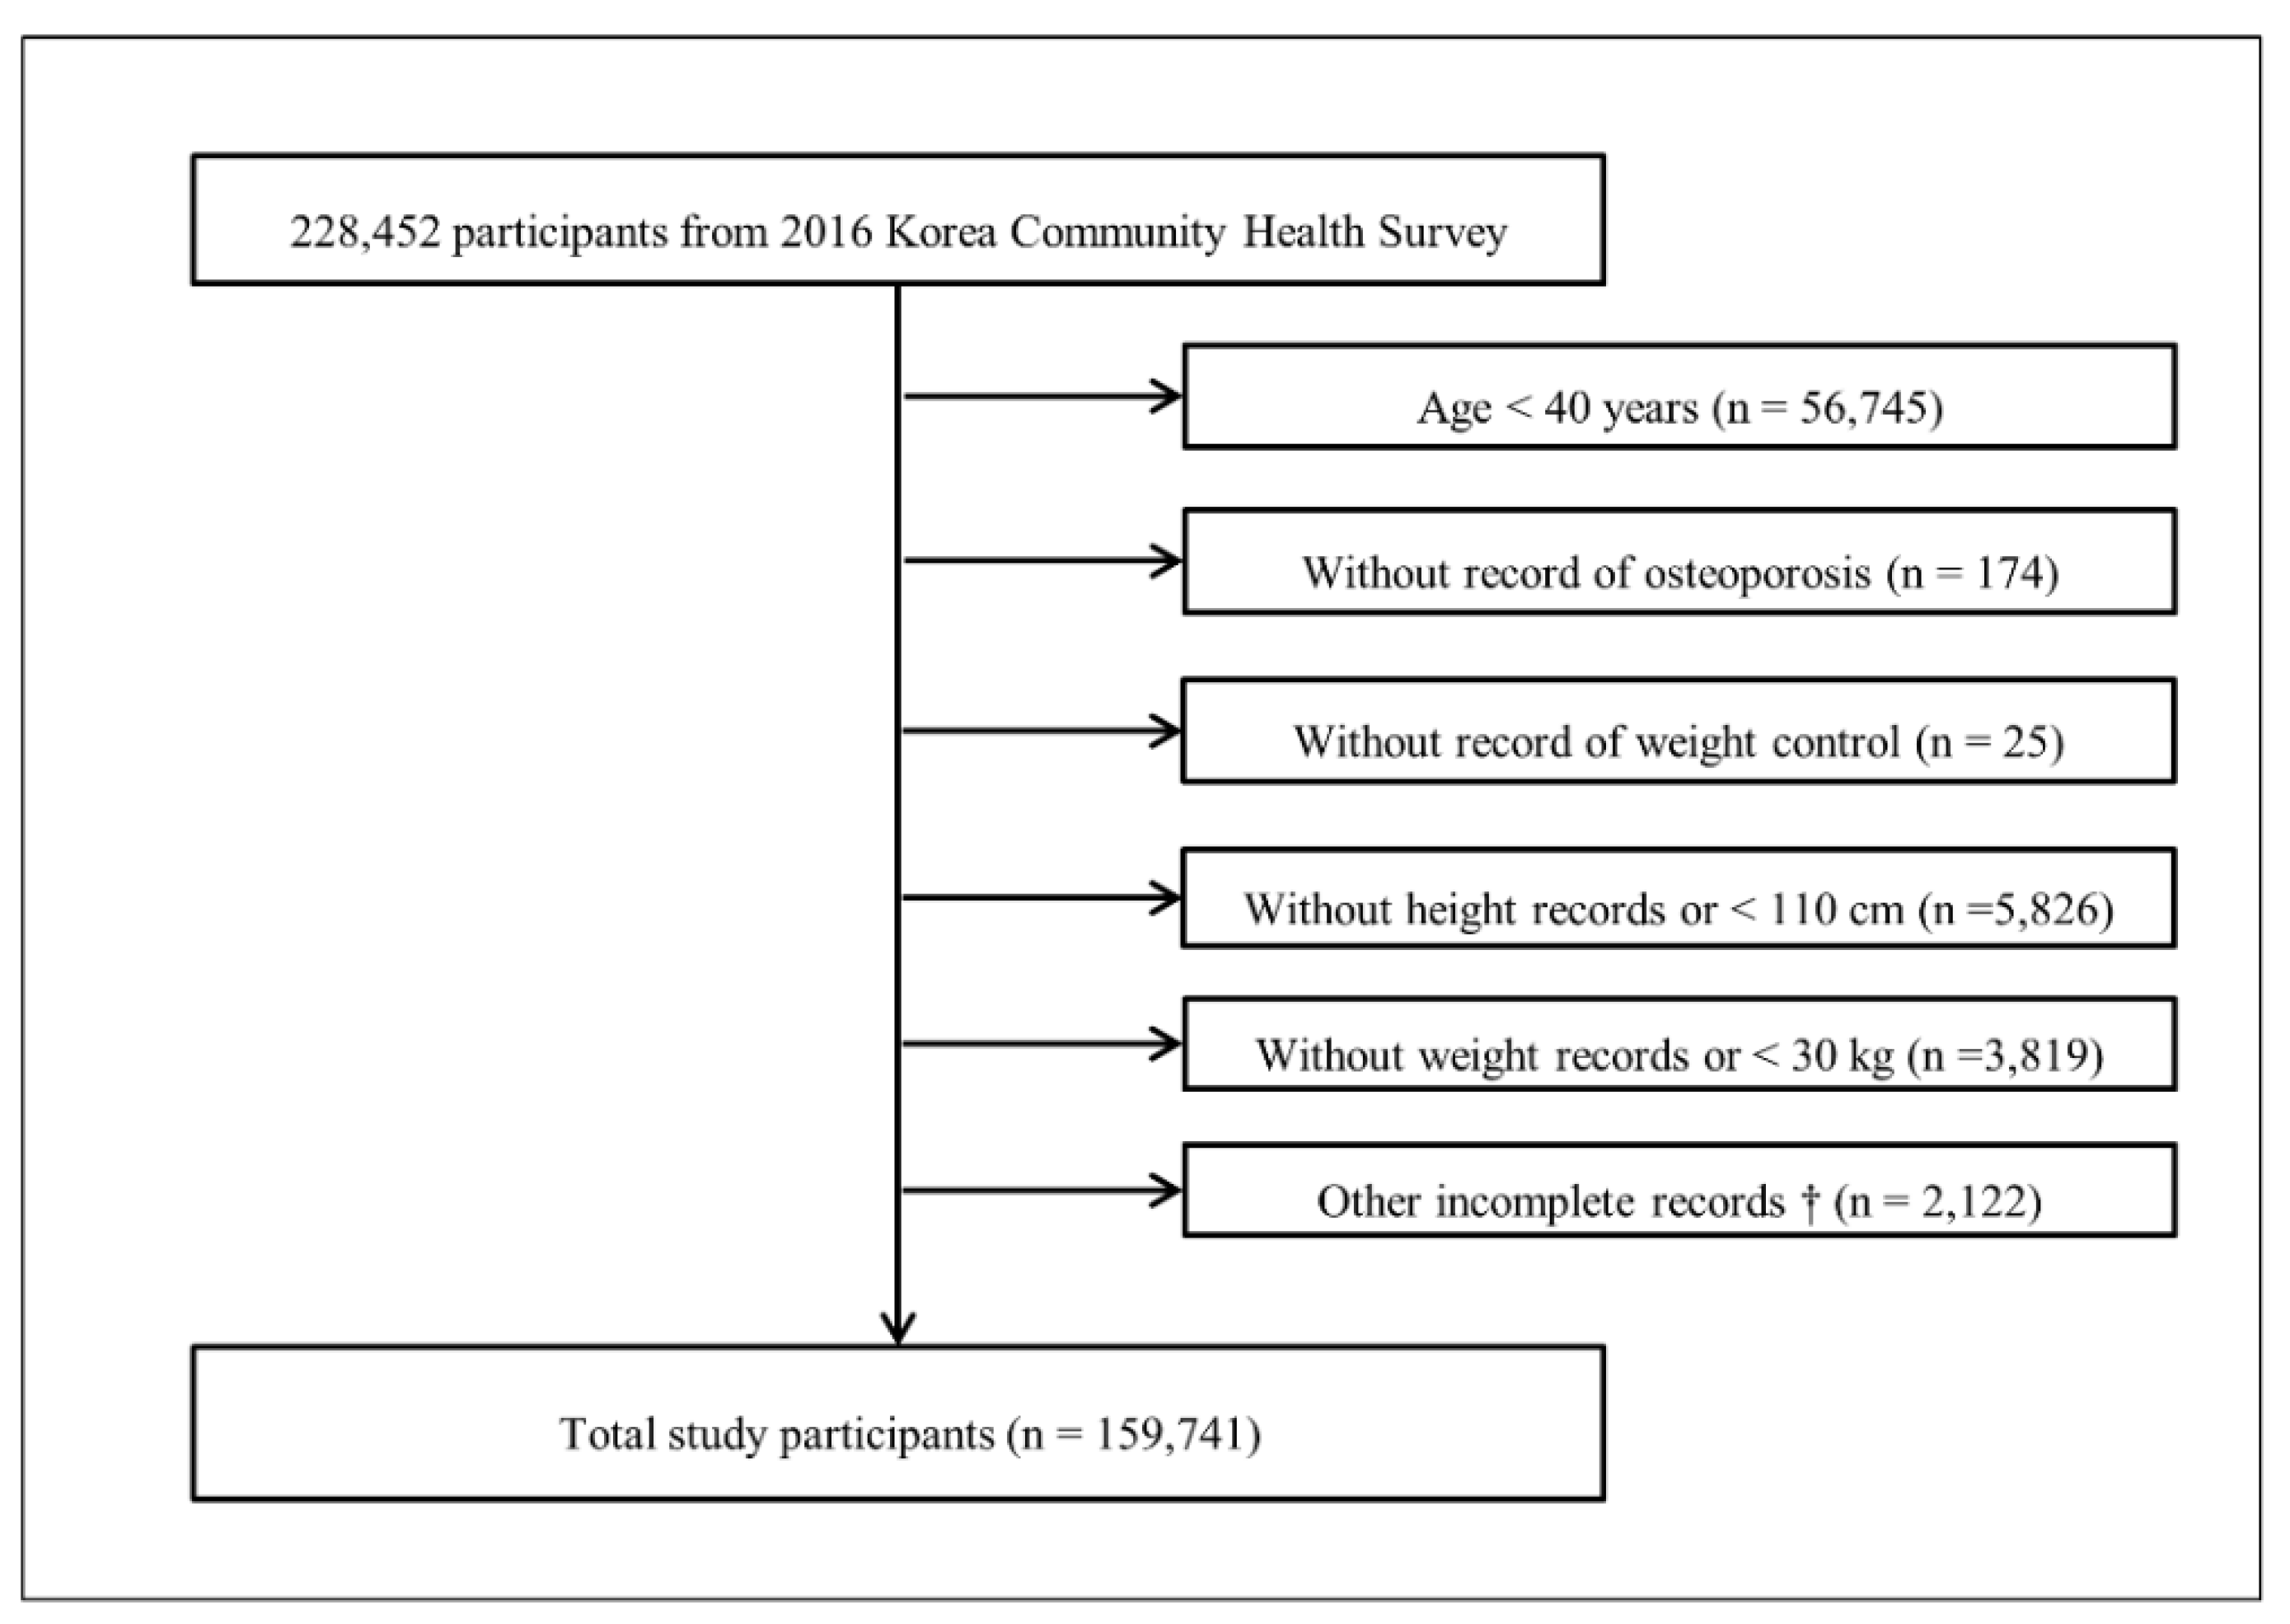
2.1. Study Population and Data Collection
2.2. Definition of Osteoporosis
2.3. Definition of Weight Control
2.4. Covariate
2.5. Statistical Analysis
3. Results
4. Discussion
5. Conclusions
Supplementary Materials
Author Contributions
Funding
Institutional Review Board Statement
Informed Consent Statement
Data Availability Statement
Acknowledgments
Conflicts of Interest
References
- Lorentzon, M.; Cummings, S.R. Osteoporosis: The evolution of a diagnosis. J. Intern. Med. 2015, 277, 650–661. [Google Scholar] [CrossRef] [PubMed]
- Ahn, S.H.; Park, S.M.; Park, S.Y.; Yoo, J.I.; Jung, H.S.; Nho, J.H.; Kim, S.H.; Lee, Y.K.; Ha, Y.C.; Jang, S.; et al. Osteoporosis and Osteoporotic Fracture Fact Sheet in Korea. J. Bone Metab. 2020, 27, 281–290. [Google Scholar] [CrossRef] [PubMed]
- QuickStats: Age-Adjusted Percentage of Adults Aged ≥20 Years Who Tried to Lose Weight During the Past 12 Months,* by Sex—National Health and Nutrition Examination Survey, 2007-2008 to 2015-2016. MMWR Morb. Mortal. Wkly. Rep. 2018, 67, 1166. [CrossRef] [PubMed] [Green Version]
- Santos, I.; Sniehotta, F.F.; Marques, M.M.; Carraça, E.V.; Teixeira, P.J. Prevalence of personal weight control attempts in adults: A systematic review and meta-analysis. Obes. Rev. 2017, 18, 32–50. [Google Scholar] [CrossRef] [PubMed]
- Ensrud, K.E.; Ewing, S.K.; Stone, K.L.; Cauley, J.A.; Bowman, P.J.; Cummings, S.R. Intentional and unintentional weight loss increase bone loss and hip fracture risk in older women. J. Am. Geriatr. Soc. 2003, 51, 1740–1747. [Google Scholar] [CrossRef] [PubMed]
- Ensrud, K.E.; Fullman, R.L.; Barrett-Connor, E.; Cauley, J.A.; Stefanick, M.L.; Fink, H.A.; Lewis, C.E.; Orwoll, E. Voluntary weight reduction in older men increases hip bone loss: The osteoporotic fractures in men study. J. Clin. Endocrinol. Metab. 2005, 90, 1998–2004. [Google Scholar] [CrossRef] [Green Version]
- Soltani, S.; Hunter, G.R.; Kazemi, A.; Shab-Bidar, S. The effects of weight loss approaches on bone mineral density in adults: A systematic review and meta-analysis of randomized controlled trials. Osteoporos. Int. 2016, 27, 2655–2671. [Google Scholar] [CrossRef]
- Zibellini, J.; Seimon, R.V.; Lee, C.M.; Gibson, A.A.; Hsu, M.S.; Shapses, S.A.; Nguyen, T.V.; Sainsbury, A. Does Diet-Induced Weight Loss Lead to Bone Loss in Overweight or Obese Adults? A Systematic Review and Meta-Analysis of Clinical Trials. J. Bone Miner. Res. 2015, 30, 2168–2178. [Google Scholar] [CrossRef]
- Papageorgiou, M.; Kerschan-Schindl, K.; Sathyapalan, T.; Pietschmann, P. Is Weight Loss Harmful for Skeletal Health in Obese Older Adults? Gerontology 2020, 66, 2–14. [Google Scholar] [CrossRef]
- Robinson, L.; Aldridge, V.; Clark, E.M.; Misra, M.; Micali, N. A systematic review and meta-analysis of the association between eating disorders and bone density. Osteoporos. Int. 2016, 27, 1953–1966. [Google Scholar] [CrossRef] [PubMed]
- Lim, M.S.; Park, B.; Kong, I.G.; Sim, S.; Kim, S.Y.; Kim, J.H.; Choi, H.G. Leisure sedentary time is differentially associated with hypertension, diabetes mellitus, and hyperlipidemia depending on occupation. BMC Public Health 2017, 17, 278. [Google Scholar] [CrossRef] [Green Version]
- Kim, S.Y.; Bang, W.; Choi, H.G. Analysis of the prevalence of and factors associated with overactive bladder in adult Korean women. PLoS ONE 2017, 12, e0185592. [Google Scholar] [CrossRef] [PubMed] [Green Version]
- Kim, S.Y.; Kim, M.S.; Sim, S.; Park, B.; Choi, H.G. Association Between Obesity and Falls Among Korean Adults: A Population-Based Cross-Sectional Study. Medicine 2016, 95, e3130. [Google Scholar] [CrossRef] [PubMed]
- Kim, S.Y.; Sim, S.; Choi, H.G. Active and passive smoking impacts on asthma with quantitative and temporal relations: A Korean Community Health Survey. Sci. Rep. 2018, 8, 8614. [Google Scholar] [CrossRef] [PubMed]
- Oh, D.H.; Kim, S.A.; Lee, H.Y.; Seo, J.Y.; Choi, B.Y.; Nam, J.H. Prevalence and correlates of depressive symptoms in korean adults: Results of a 2009 korean community health survey. J. Korean Med. Sci. 2013, 28, 128–135. [Google Scholar] [CrossRef] [Green Version]
- Wright, N.C.; Looker, A.C.; Saag, K.G.; Curtis, J.R.; Delzell, E.S.; Randall, S.; Dawson-Hughes, B. The recent prevalence of osteoporosis and low bone mass in the United States based on bone mineral density at the femoral neck or lumbar spine. J. Bone Miner. Res. 2014, 29, 2520–2526. [Google Scholar] [CrossRef] [PubMed] [Green Version]
- Meyer, H.E.; Søgaard, A.J.; Falch, J.A.; Jørgensen, L.; Emaus, N. Weight change over three decades and the risk of osteoporosis in men: The Norwegian Epidemiological Osteoporosis Studies (NOREPOS). Am. J. Epidemiol. 2008, 168, 454–460. [Google Scholar] [CrossRef] [PubMed]
- Armamento-Villareal, R.; Sadler, C.; Napoli, N.; Shah, K.; Chode, S.; Sinacore, D.R.; Qualls, C.; Villareal, D.T. Weight loss in obese older adults increases serum sclerostin and impairs hip geometry but both are prevented by exercise training. J. Bone Miner. Res. 2012, 27, 1215–1221. [Google Scholar] [CrossRef] [PubMed]
- Shapses, S.A.; Sukumar, D. Bone metabolism in obesity and weight loss. Annu. Rev. Nutr. 2012, 32, 287–309. [Google Scholar] [CrossRef] [PubMed] [Green Version]
- Sharma, S.; Tandon, V.R.; Mahajan, S.; Mahajan, V.; Mahajan, A. Obesity: Friend or foe for osteoporosis. J. Midlife Health 2014, 5, 6–9. [Google Scholar] [CrossRef]
- De Laet, C.; Kanis, J.A.; Odén, A.; Johanson, H.; Johnell, O.; Delmas, P.; Eisman, J.A.; Kroger, H.; Fujiwara, S.; Garnero, P.; et al. Body mass index as a predictor of fracture risk: A meta-analysis. Osteoporos. Int. 2005, 16, 1330–1338. [Google Scholar] [CrossRef]
- Ganson, K.T.; Nagata, J.M.; Lavender, J.M.; Rodgers, R.F.; LCunningham, M.; Murray, S.B.; Hammond, D. Prevalence and correlates of weight gain attempts across five countries. Int. J. Eat. Disord. 2021. [Google Scholar] [CrossRef] [PubMed]
- Tatsumi, Y.; Higashiyama, A.; Kubota, Y.; Sugiyama, D.; Nishida, Y.; Hirata, T.; Kadota, A.; Nishimura, K.; Imano, H.; Miyamatsu, N.; et al. Underweight Young Women Without Later Weight Gain Are at High Risk for Osteopenia After Midlife: The KOBE Study. J. Epidemiol. 2016, 26, 572–578. [Google Scholar] [CrossRef] [PubMed] [Green Version]
- Kammire, D.E.; Walkup, M.P.; Ambrosius, W.T.; Lenchik, L.; Shapses, S.A.; Nicklas, B.J.; Houston, D.K.; Marsh, A.P.; Rejeski, W.J.; Beavers, K.M. Effect of Weight Change Following Intentional Weight Loss on Bone Health in Older Adults with Obesity. Obesity 2019, 27, 1839–1845. [Google Scholar] [CrossRef] [PubMed]
- Kraschnewski, J.L.; Boan, J.; Esposito, J.; Sherwood, N.E.; Lehman, E.B.; Kephart, D.K.; Sciamanna, C.N. Long-term weight loss maintenance in the United States. Int. J. Obes. 2010, 34, 1644–1654. [Google Scholar] [CrossRef] [PubMed] [Green Version]
- Ho-Pham, L.T.; Nguyen, U.D.; Nguyen, T.V. Association between lean mass, fat mass, and bone mineral density: A meta-analysis. J. Clin. Endocrinol Metab. 2014, 99, 30–38. [Google Scholar] [CrossRef] [Green Version]
- Tirosh, A.; de Souza, R.J.; Sacks, F.; Bray, G.A.; Smith, S.R.; LeBoff, M.S. Sex Differences in the Effects of Weight Loss Diets on Bone Mineral Density and Body Composition: POUNDS LOST Trial. J. Clin. Endocrinol. Metab. 2015, 100, 2463–2471. [Google Scholar] [CrossRef] [Green Version]

| Characteristics | Weight Control | p-Value | |||
|---|---|---|---|---|---|
| Total | Weight L&M | Weight Gain | Never Tried | ||
| Number (n, %) | 159.741 (100.0) | 76.061 (47.6) | 8.431 (5.3) | 75.249 (47.1) | |
| Age (n, %) | <0.001 * | ||||
| 40–59 | 84.536 (64.5) | 50.075 (73.1) | 3.999 (60.0) | 30.462 (53.4) | |
| ≥ 60 | 75.205 (35.5) | 25.986 (26.9) | 4.432 (40.0) | 44.787 (46.6) | |
| Sex (n, %) | <0.001 * | ||||
| Males | 73.699 (49.2) | 29.958 (42.7) | 5.053 (65.3) | 38.688 (55.9) | |
| Females | 86.042 (50.8) | 46.103 (57.3) | 3.378 (34.7) | 36.561 (44.1) | |
| Income (n, %) | <0.001 * | ||||
| Lowest | 37.900 (14.5) | 11.793 (10.1) | 2.393 (17.5) | 23.714 (20.1) | |
| Low-middle | 57.329 (32.5) | 26.230 (30.1) | 3.144 (36.0) | 27.955 (35.4) | |
| Upper-middle | 39.493 (30.4) | 22.428 (33.0) | 1.819 (27.7) | 15.246 (27.3) | |
| Highest | 25.019 (22.6) | 15.610 (26.8) | 1.075 (18.7) | 8.334 (17.3) | |
| Region of residence (n, %) | <0.001 * | ||||
| Urban | 71.853 (68.4) | 39.037 (70.9) | 3.424 (64.8) | 29.392 (65.4) | |
| Rural | 87.888 (31.6) | 37.024 (29.1) | 5.007 (35.2) | 45.857 (34.6) | |
| Smoking (n, %) | <0.001 * | ||||
| None | 95.947 (57.7) | 50.275 (63.6) | 3.985 (43.2) | 41.687 (51.4) | |
| Past smoker | 33.502 (21.0) | 14.715 (20.0) | 1.972 (23.8) | 16.815 (22.1) | |
| Current smoker | 30.292 (21.3) | 11.071 (16.4) | 2.474 (32.9) | 16.747 (26.5) | |
| Alcohol (n, %) | <0.001 * | ||||
| None | 57.904 (29.7) | 23.369 (26.3) | 3.255 (32.0) | 31.280 (34.2) | |
| ≤ 1 time a month | 38.118 (25.6) | 21.320 (28.9) | 1.729 (22.4) | 15.069 (21.6) | |
| 2–4 times a month | 28.126 (20.8) | 16.055 (23.3) | 1.325 (19.1) | 10.746 (17.6) | |
| ≥ 2 times a week | 35.593 (23.8) | 15.317 (21.5) | 2.122 (26.4) | 18.154 (26.6) | |
| Education level (n, %) | <0.001 * | ||||
| Low | 70.728 (30.7) | 24.567 (22.9) | 3.975 (32.5) | 42.186 (41.1) | |
| Middle | 51.351 (36.1) | 27.943 (37.8) | 2.736 (38.9) | 20.672 (33.4) | |
| High | 37.662 (33.2) | 23.551 (39.3) | 1.720 (28.6) | 12.391 (25.5) | |
| Obesity (n, %) | <0.001 * | ||||
| Underweight | 6.289 (3.2) | 727 (0.9) | 1.648 (18.1) | 3.914 (4.5) | |
| Normal weight | 66.329 (41.3) | 23.255 (32.5) | 6.015 (73.1) | 37.059 (49.3) | |
| Overweight | 42.684 (27.1) | 22.353 (29.4) | 646 (7.4) | 19.685 (26.4) | |
| Obese | 44.439 (28.3) | 29.726 (36.1) | 122 (1.4) | 14.591 (19.8) | |
| Subjective health status (n, %) | <0.001 * | ||||
| Good | 50.239 (34.6) | 26.832 (37.4) | 2.197 (29.3) | 21.210 (31.3) | |
| Normal | 70.416 (46.5) | 35.550 (47.8) | 3.457 (44.6) | 31.409 (45.0) | |
| Bad | 39.086 (19.0) | 13.679 (14.8) | 2.777 (26.1) | 22.630 (23.7) | |
| Stress (n, %) | <0.001 * | ||||
| No | 40.255 (21.1) | 16.294 (18.8) | 1.816 (18.6) | 22.145 (24.5) | |
| Some | 83.015 (54.5) | 42.430 (57.2) | 4.148 (51.7) | 36.437 (51.1) | |
| Moderate | 31.271 (21.0) | 14.947 (20.8) | 2.066 (25.2) | 14.258 (20.7) | |
| Severe | 5.200 (3.5) | 2.390 (3.2) | 401 (4.6) | 2.409 (3.7) | |
| Physical activity (n, %) | <0.001 * | ||||
| 0 min/week | 90.155 (55.3) | 38.761 (49.3) | 4.581 (54.3) | 46.813 (63.6) | |
| 1–149 min/week | 12.951 (9.6) | 7.368 (10.8) | 0.737 (10.2) | 4.846 (7.9) | |
| ≥ 150 min/week | 56.635 (35.1) | 29.932 (39.9) | 3.113 (35.5) | 23.590 (28.5) | |
| Osteoporosis for entire life (n, %) | <0.001 * | ||||
| No | 142.812 (92.2) | 69.790 (93.5) | 7.186 (89.2) | 65.836 (90.6) | |
| Yes | 16.929 (7.8) | 6.271 (6.5) | 1.245 (10.8) | 9.413 (9.4) | |
| Current osteoporosis (n, %) | <0.001 * | ||||
| No | 150.324 (95.9) | 72.880 (96.9) | 7.684 (93.9) | 69.760 (94.9) | |
| Yes | 9.417 (4.1) | 3.181 (3.1) | 0.747 (6.1) | 5.489 (5.1) | |
| Weight Control | ORs for Osteoporosis for Entire Life | ORs for Current Osteoporosis | ||||||
|---|---|---|---|---|---|---|---|---|
| Crude | p-Value | Adjusted † | p-Value | Crude | p-Value | Adjusted † | p-Value | |
| Total participants (n = 159,741) | ||||||||
| Weight L&M | 0.67 (0.64–0.70) | <0.001 * | 1.20 (1.13–1.27) | <0.001 * | 0.60 (0.56–0.64) | <0.001 * | 1.16 (1.08–1.25) | <0.001 * |
| Weight gain | 1.17 (1.07–1.28) | <0.001 * | 1.83 (1.64–2.05) | <0.001 * | 1.22 (1.08–1.36) | 0.001 * | 1.77 (1.54–2.02) | <0.001 * |
| Never tried | 1 | 1 | 1 | 1 | ||||
| Underweight (n = 6289) | ||||||||
| Weight L&M | 0.49 (0.39–0.60) | <0.001 * | 0.91 (0.71–1.16) | 0.442 | 0.55 (0.42–0.72) | <0.001 * | 1.10 (0.80–1.51) | 0.558 |
| Weight gain | 1.11 (0.95–1.30) | 0.187 | 1.92 (1.59–2.31) | <0.001 * | 1.10 (0.91–1.34) | 0.323 | 1.88 (1.49–2.36) | <0.001 * |
| Never tried | 1 | 1 | 1 | 1 | ||||
| Normal weight (n = 66,329) | ||||||||
| Weight L&M | 0.65 (0.60–0.70) | <0.001 * | 1.12 (1.02–1.22) | 0.020 * | 0.61 (0.55–0.67) | <0.001 * | 1.18 (1.05–1.33) | 0.007 * |
| Weight gain | 0.95 (0.85–1.06) | 0.379 | 1.69 (1.49–1.93) | <0.001 * | 0.99 (0.86–1.14) | 0.866 | 1.67 (1.43–1.96) | <0.001 * |
| Never tried | 1 | 1 | 1 | 1 | ||||
| Overweight (n = 42,684) | ||||||||
| Weight L&M | 0.87 (0.80–0.95) | 0.002 * | 1.36 (1.21–1.53) | <0.001 * | 0.77 (0.68–0.87) | <0.001 * | 1.26 (1.10–1.45) | 0.001 * |
| Weight gain | 0.74 (0.50–1.11) | 0.144 | 1.25 (0.78–1.99) | 0.361 | 0.80 (0.46–1.38) | 0.421 | 1.32 (0.73–2.41) | 0.362 |
| Never tried | 1 | 1 | 1 | 1 | ||||
| Obese (n = 44,439) | ||||||||
| Weight L&M | 0.70 (0.64–0.77) | <0.001 * | 1.23 (1.10–1.38) | <0.001 * | 0.59 (0.52–0.67) | <0.001 * | 1.08 (0.94–1.25) | 0.292 |
| Weight gain | 1.17 (0.63–2.16) | 0.616 | 2.76 (1.33–5.76) | 0.007 * | 1.17 (0.62–2.23) | 0.626 | 2.49 (1.24–5.02) | 0.011 * |
| Never tried | 1 | 1 | 1 | 1 | ||||
| Weight Control | ORs for Osteoporosis for Entire Life | ORs for Current Osteoporosis | ||||||
|---|---|---|---|---|---|---|---|---|
| Crude | p-Value | Adjusted † | p-Value | Crude | p-Value | Adjusted † | p-Value | |
| Age 40–59 years old, males (n = 39,685) | ||||||||
| Weight L&M | 0.86 (0.61–1.22) | 0.395 | 0.86 (0.59–1.26) | 0.445 | 0.90 (0.51–1.60) | 0.720 | 0.96 (0.52–1.77) | 0.900 |
| Weight gain | 2.03 (1.25–3.31) | 0.004 * | 2.00 (1.22–3.28) | 0.006 * | 1.32 (0.61–2.84) | 0.480 | 1.20 (0.54–2.63) | 0.658 |
| Never tried | 1 | 1 | 1 | 1 | ||||
| Age 40–59 years old, females (n = 44,851) | ||||||||
| Weight L&M | 0.91 (0.80–1.03) | 0.135 | 1.09 (0.96–1.24) | 0.189 | 0.86 (0.72–1.03) | 0.096 | 1.06 (0.88–1.28) | 0.531 |
| Weight gain | 2.28 (1.79–2.91) | <0.001 * | 2.04 (1.58–2.64) | <0.001 * | 2.08 (1.44–2.99) | <0.001 * | 1.76 (1.20–2.57) | 0.004 * |
| Never tried | 1 | 1 | 1 | 1 | ||||
| Age ≥ 60 years old, males (n = 34,014) | ||||||||
| Weight L&M | 1.04 (0.86–1.25) | 0.713 | 1.29 (1.07–1.56) | 0.009 * | 0.87 (0.68–1.11) | 0.253 | 1.18 (0.91–1.53) | 0.223 |
| Weight gain | 1.80 (1.36–2.37) | <0.001 * | 1.81 (1.36–2.40) | <0.001 * | 1.89 (1.34–2.67) | <0.001 * | 1.97 (1.38–2.81) | <0.001 * |
| Never tried | 1 | 1 | 1 | 1 | ||||
| Age ≥ 60 years old, females (n = 41,191) | ||||||||
| Weight L&M | 0.80 (0.76–0.85) | <0.001 * | 1.01 (0.95–1.08) | 0.676 | 0.75 (0.70–0.81) | <0.001 * | 0.96 (0.89–1.04) | 0.344 |
| Weight gain | 1.64 (1.44–1.86) | <0.001 * | 1.67 (1.47–1.90) | <0.001 * | 1.71 (1.48–1.97) | <0.001 * | 1.74 (1.50–2.02) | <0.001 * |
| Never tried | 1 | 1 | 1 | 1 | ||||
Publisher’s Note: MDPI stays neutral with regard to jurisdictional claims in published maps and institutional affiliations. |
© 2021 by the authors. Licensee MDPI, Basel, Switzerland. This article is an open access article distributed under the terms and conditions of the Creative Commons Attribution (CC BY) license (https://creativecommons.org/licenses/by/4.0/).
Share and Cite
Choi, H.-G.; Kwon, B.-C.; Yim, S.-H.; Youk, H.; Lee, J.-W. Weight Change Is Associated with Osteoporosis: A Cross Sectional Study Using the Korean Community Health Survey. Int. J. Environ. Res. Public Health 2021, 18, 13368. https://doi.org/10.3390/ijerph182413368
Choi H-G, Kwon B-C, Yim S-H, Youk H, Lee J-W. Weight Change Is Associated with Osteoporosis: A Cross Sectional Study Using the Korean Community Health Survey. International Journal of Environmental Research and Public Health. 2021; 18(24):13368. https://doi.org/10.3390/ijerph182413368
Chicago/Turabian StyleChoi, Hyo-Geun, Bong-Cheol Kwon, Soo-Hwan Yim, Hyun Youk, and Jung-Woo Lee. 2021. "Weight Change Is Associated with Osteoporosis: A Cross Sectional Study Using the Korean Community Health Survey" International Journal of Environmental Research and Public Health 18, no. 24: 13368. https://doi.org/10.3390/ijerph182413368
APA StyleChoi, H.-G., Kwon, B.-C., Yim, S.-H., Youk, H., & Lee, J.-W. (2021). Weight Change Is Associated with Osteoporosis: A Cross Sectional Study Using the Korean Community Health Survey. International Journal of Environmental Research and Public Health, 18(24), 13368. https://doi.org/10.3390/ijerph182413368