Plasma Interleukin-10 and Cholesterol Levels May Inform about Interdependences between Fitness and Fatness in Healthy Individuals
Abstract
1. Introduction
2. Materials and Methods
2.1. Study Design and Participants
2.2. Body Composition, Fat Mass Percentage, Blood Markers and Cardiorespiratory Fitness Assessment
2.3. Classification Criteria
2.4. Data Analytics
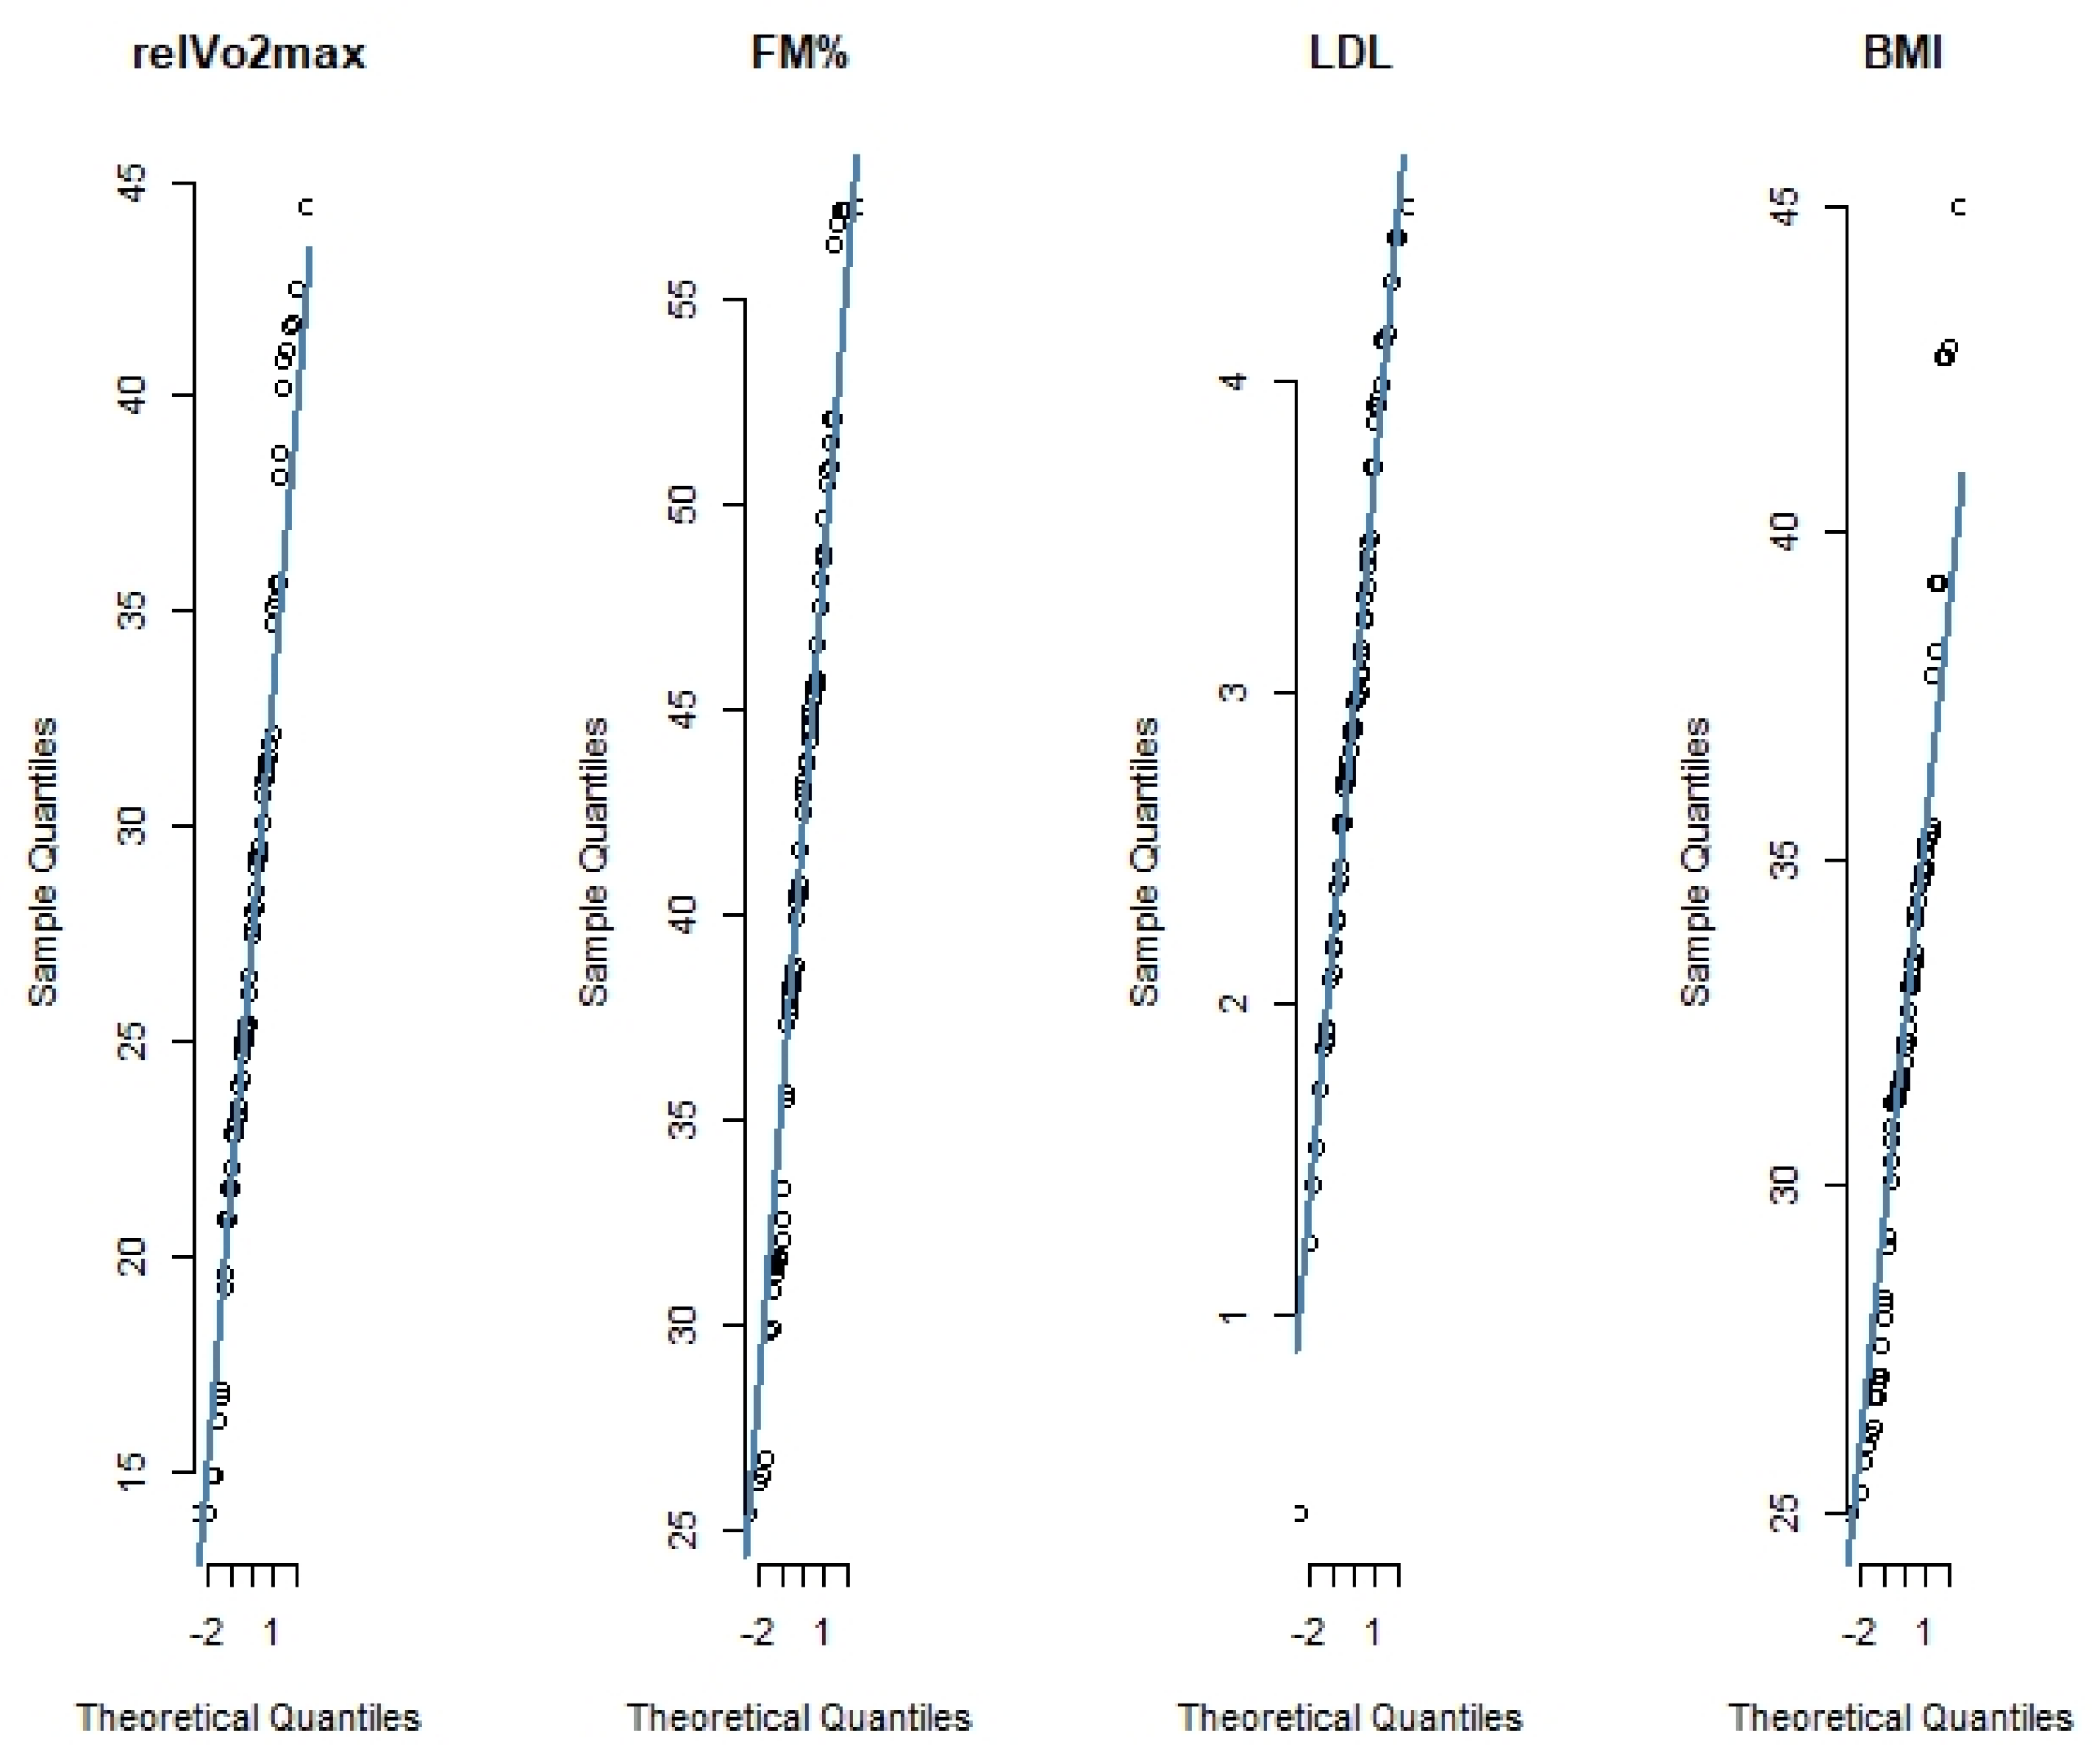
2.4.1. Preprocessing
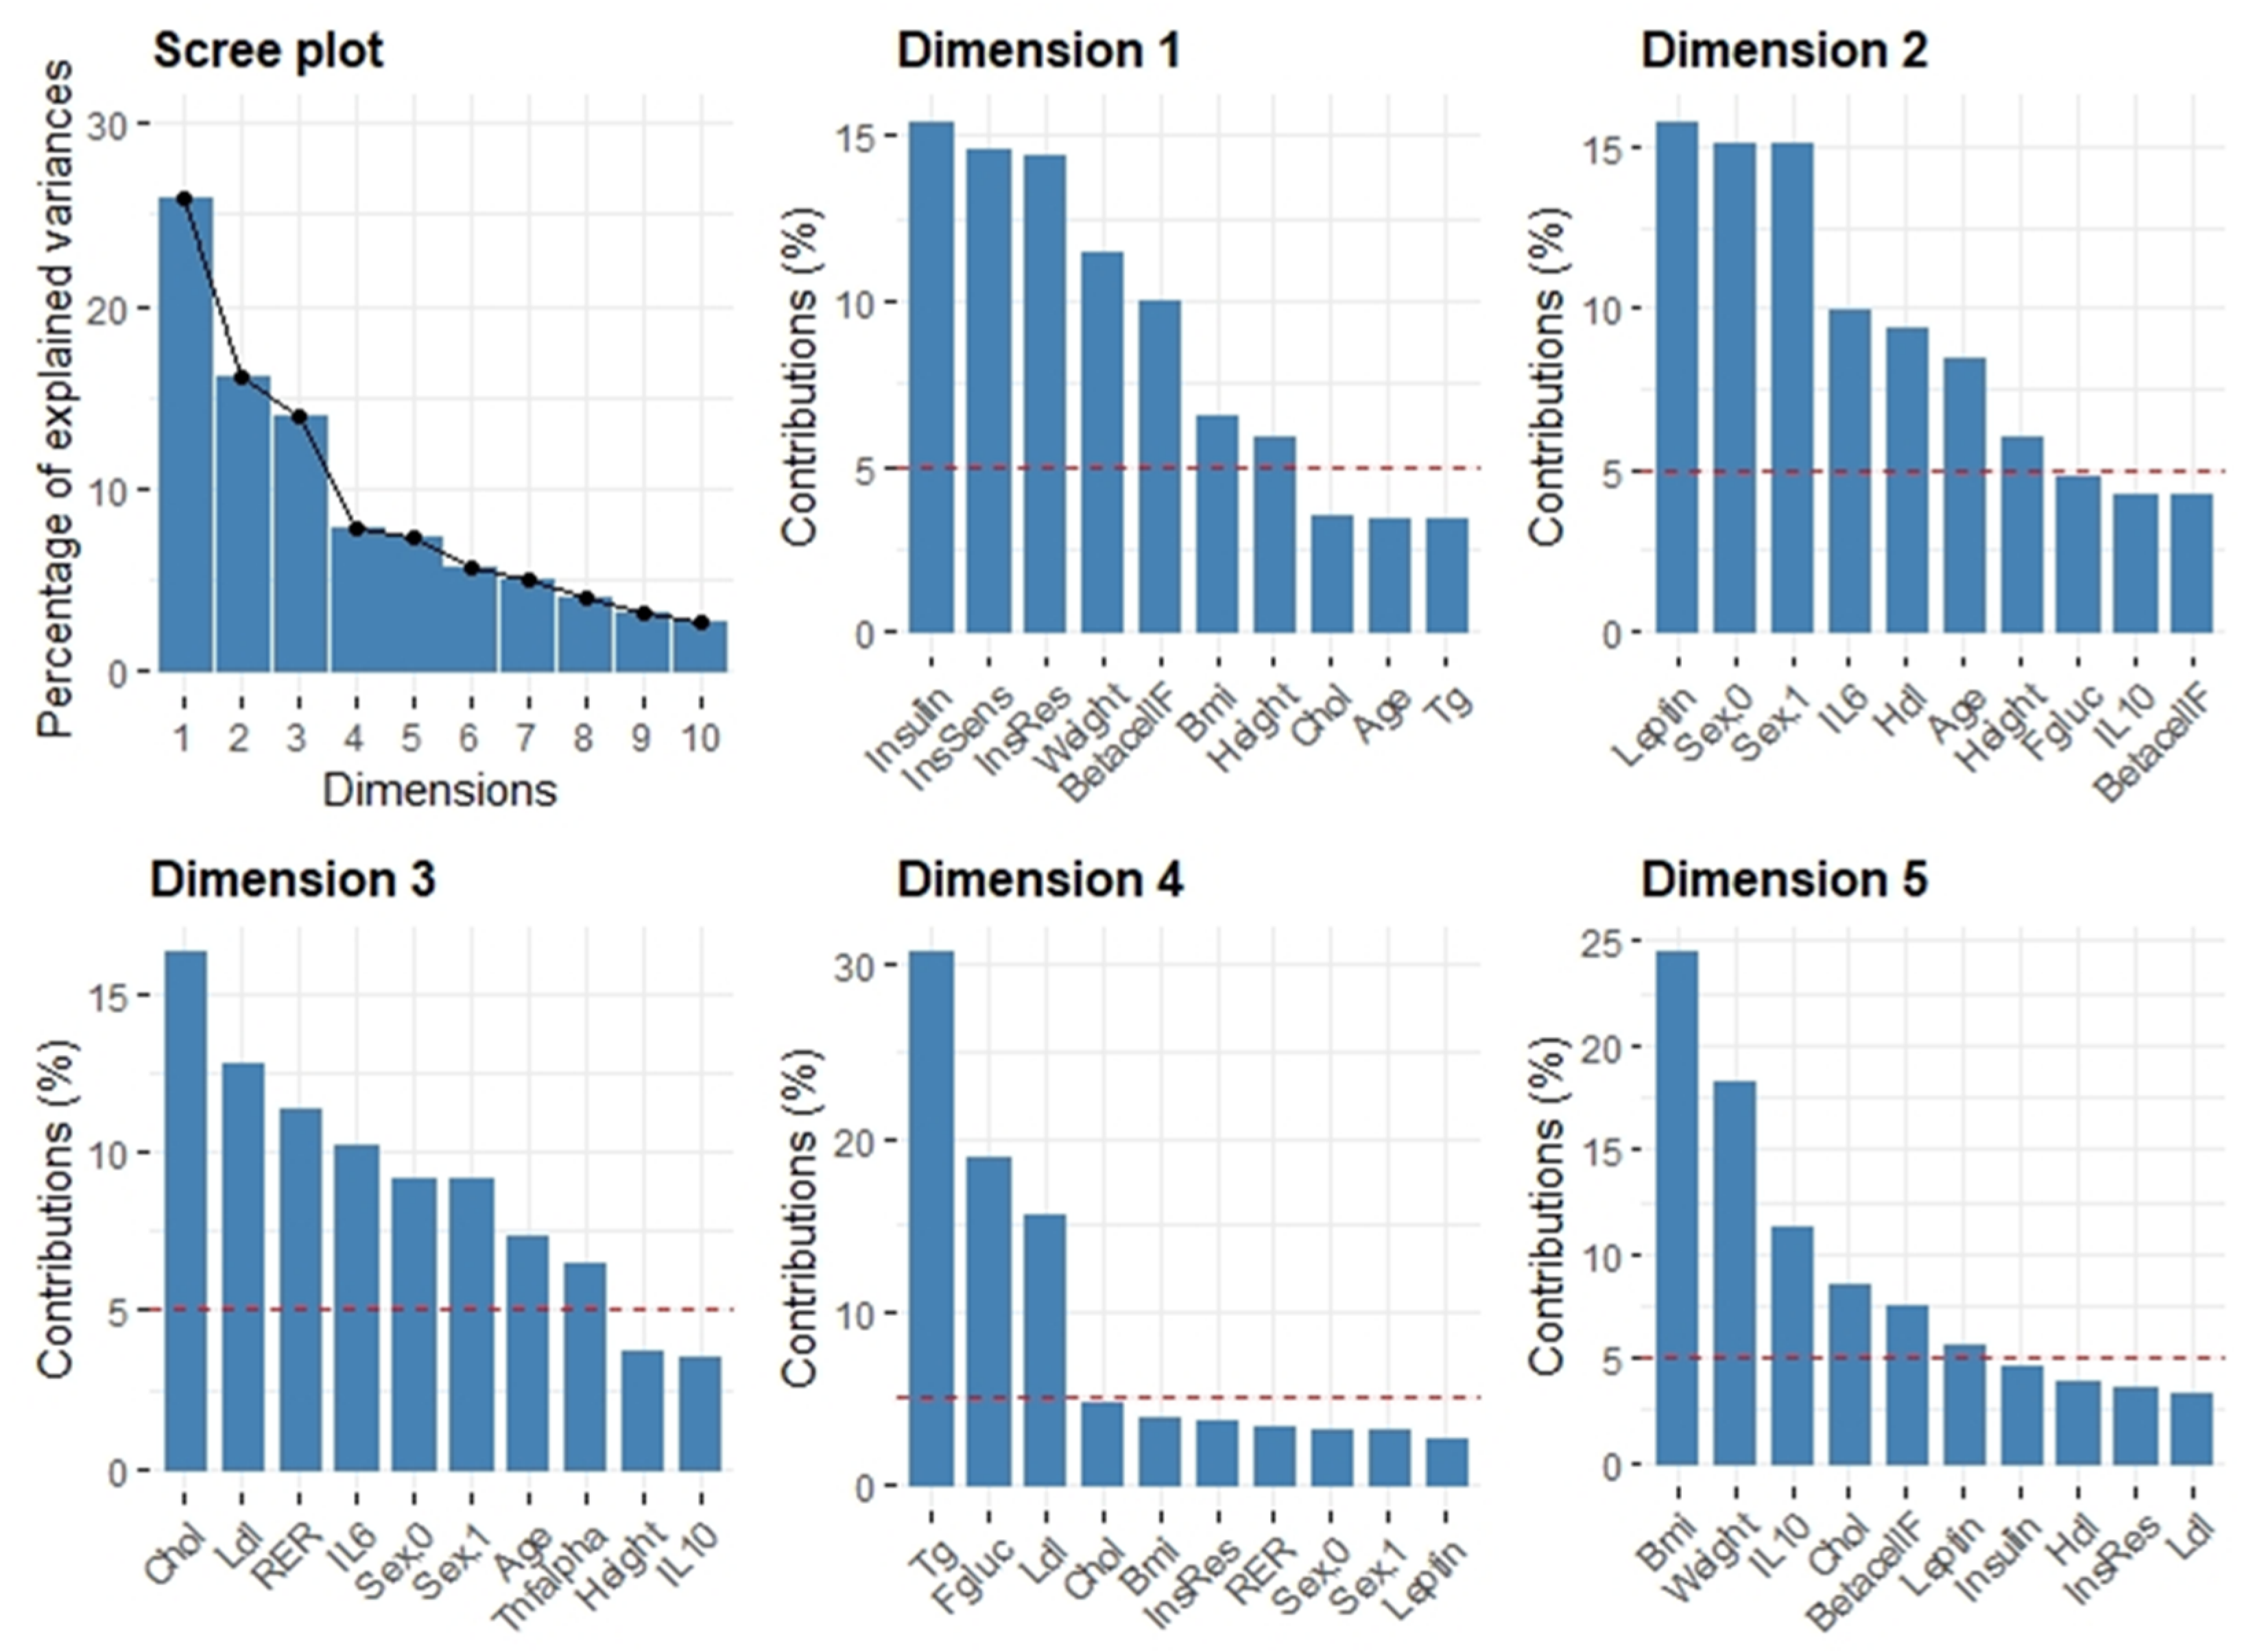
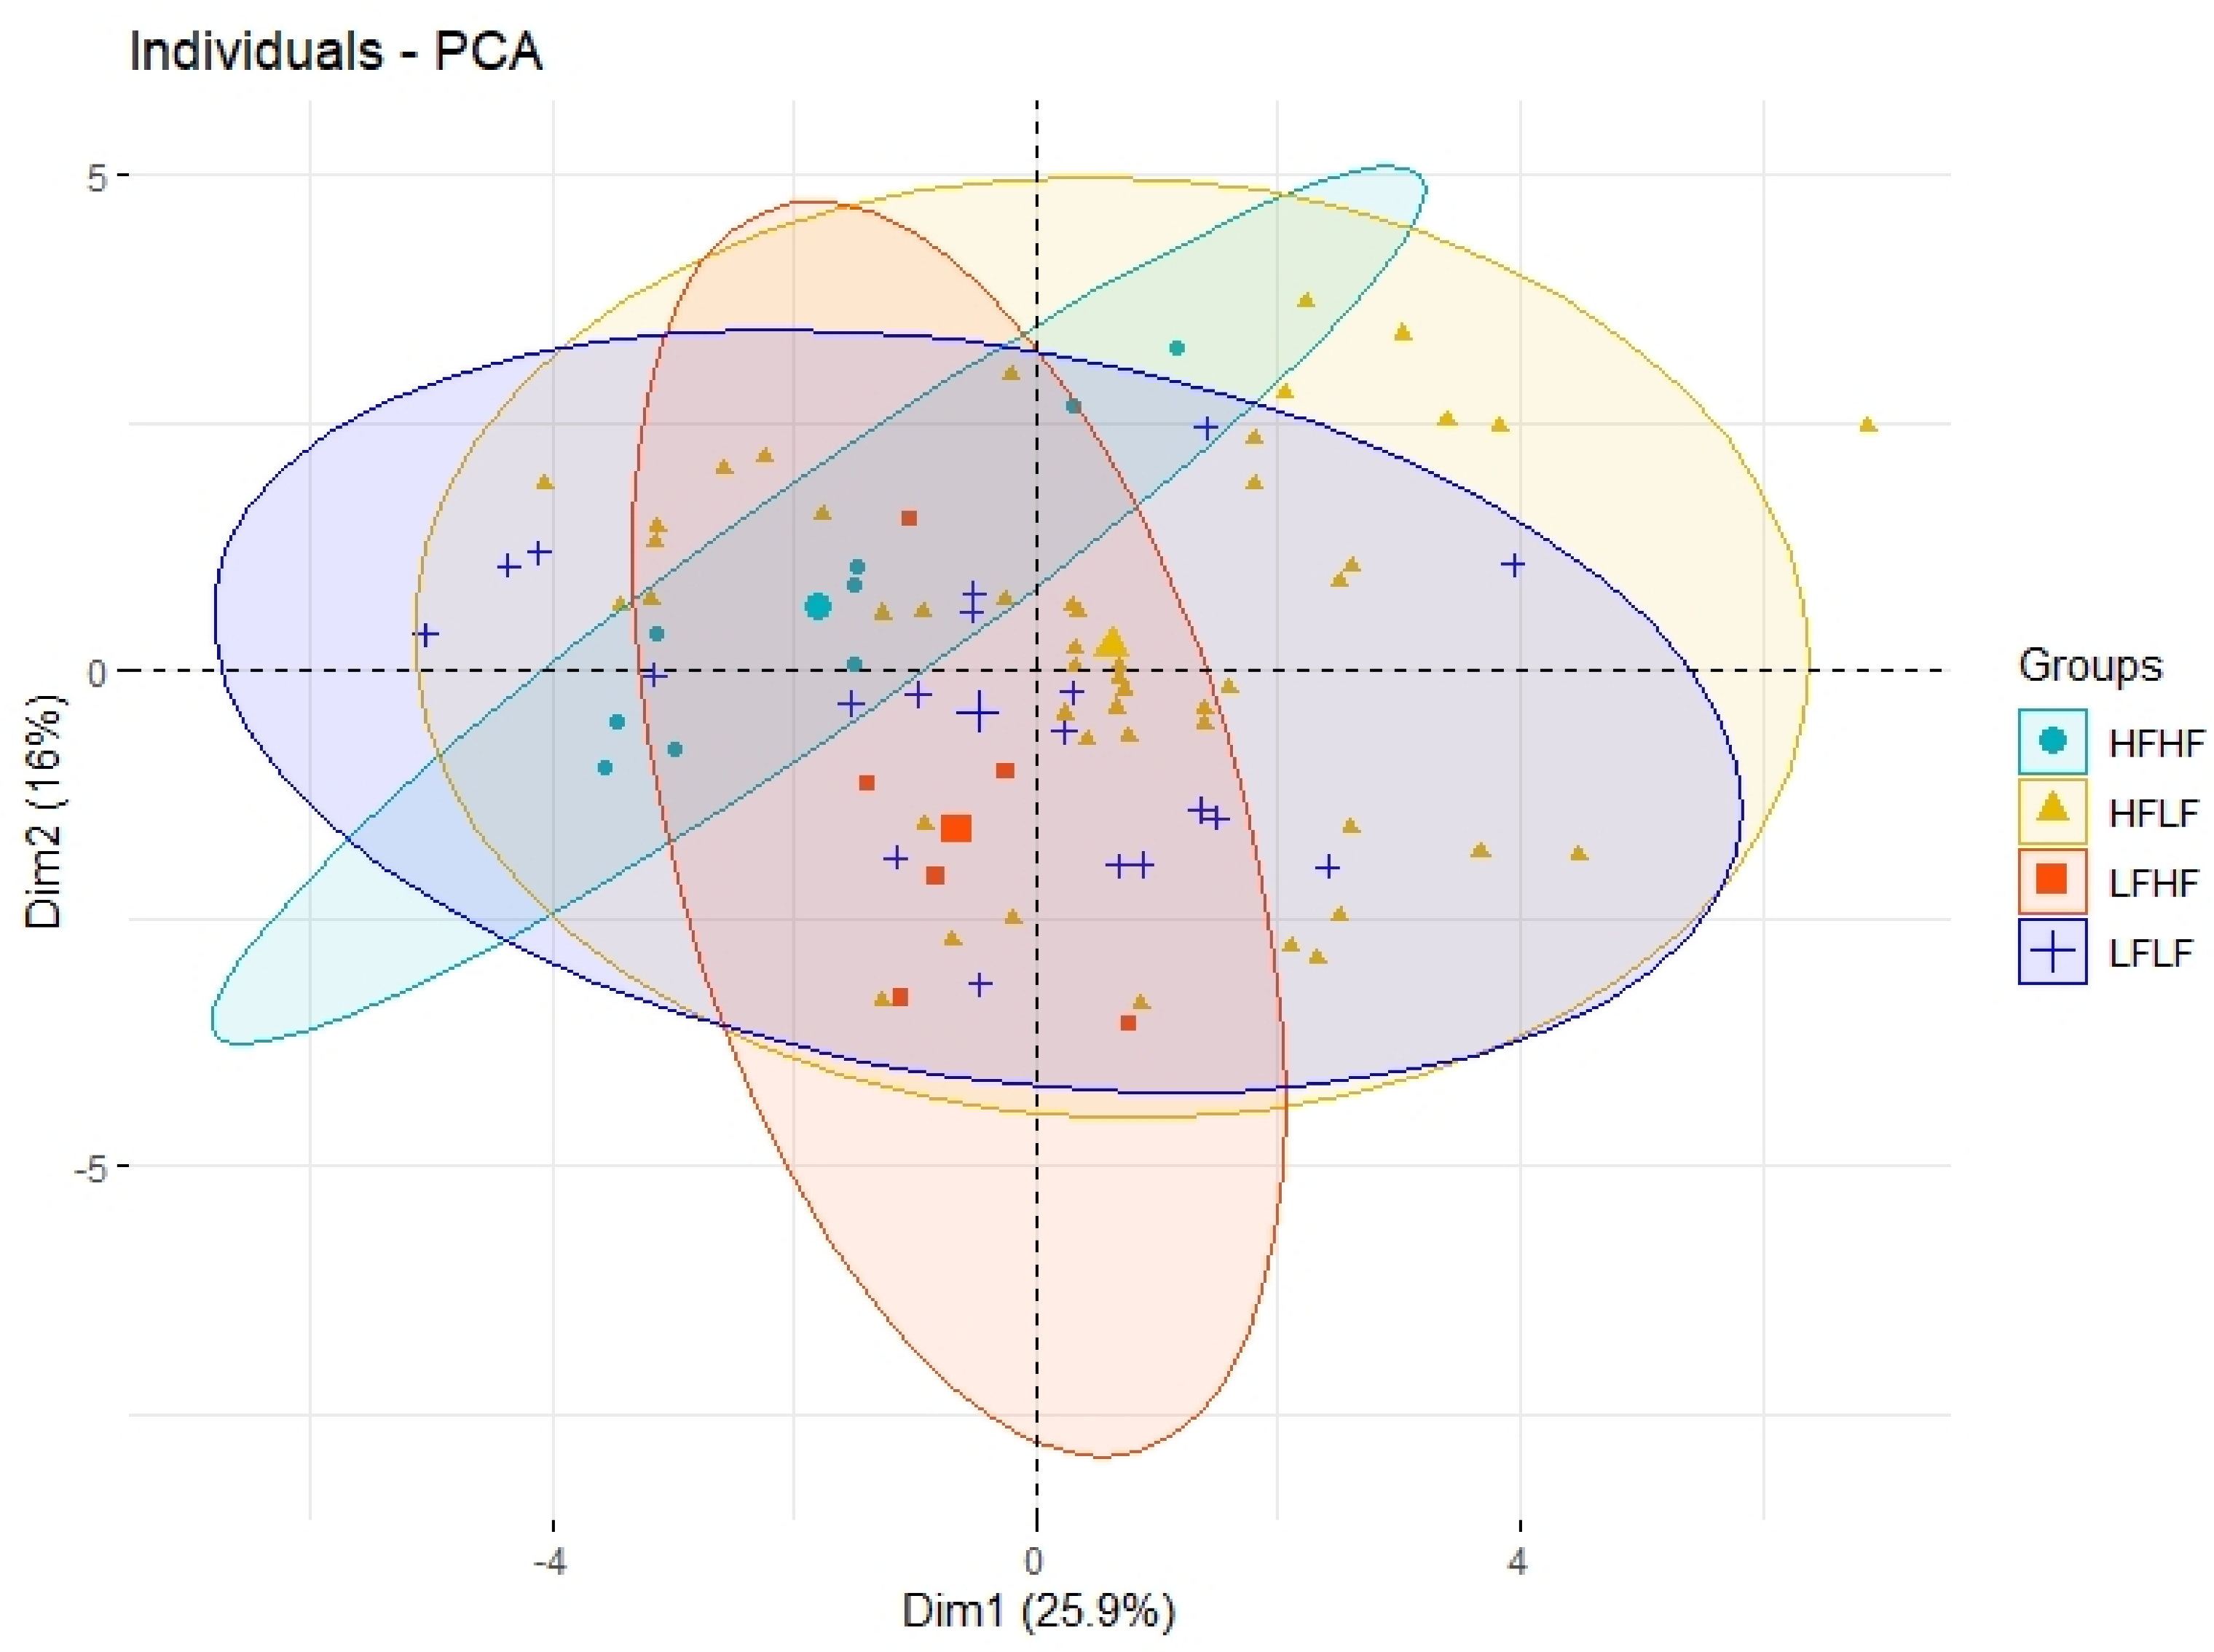
2.4.2. Principal Component Analysis and Feature Selection
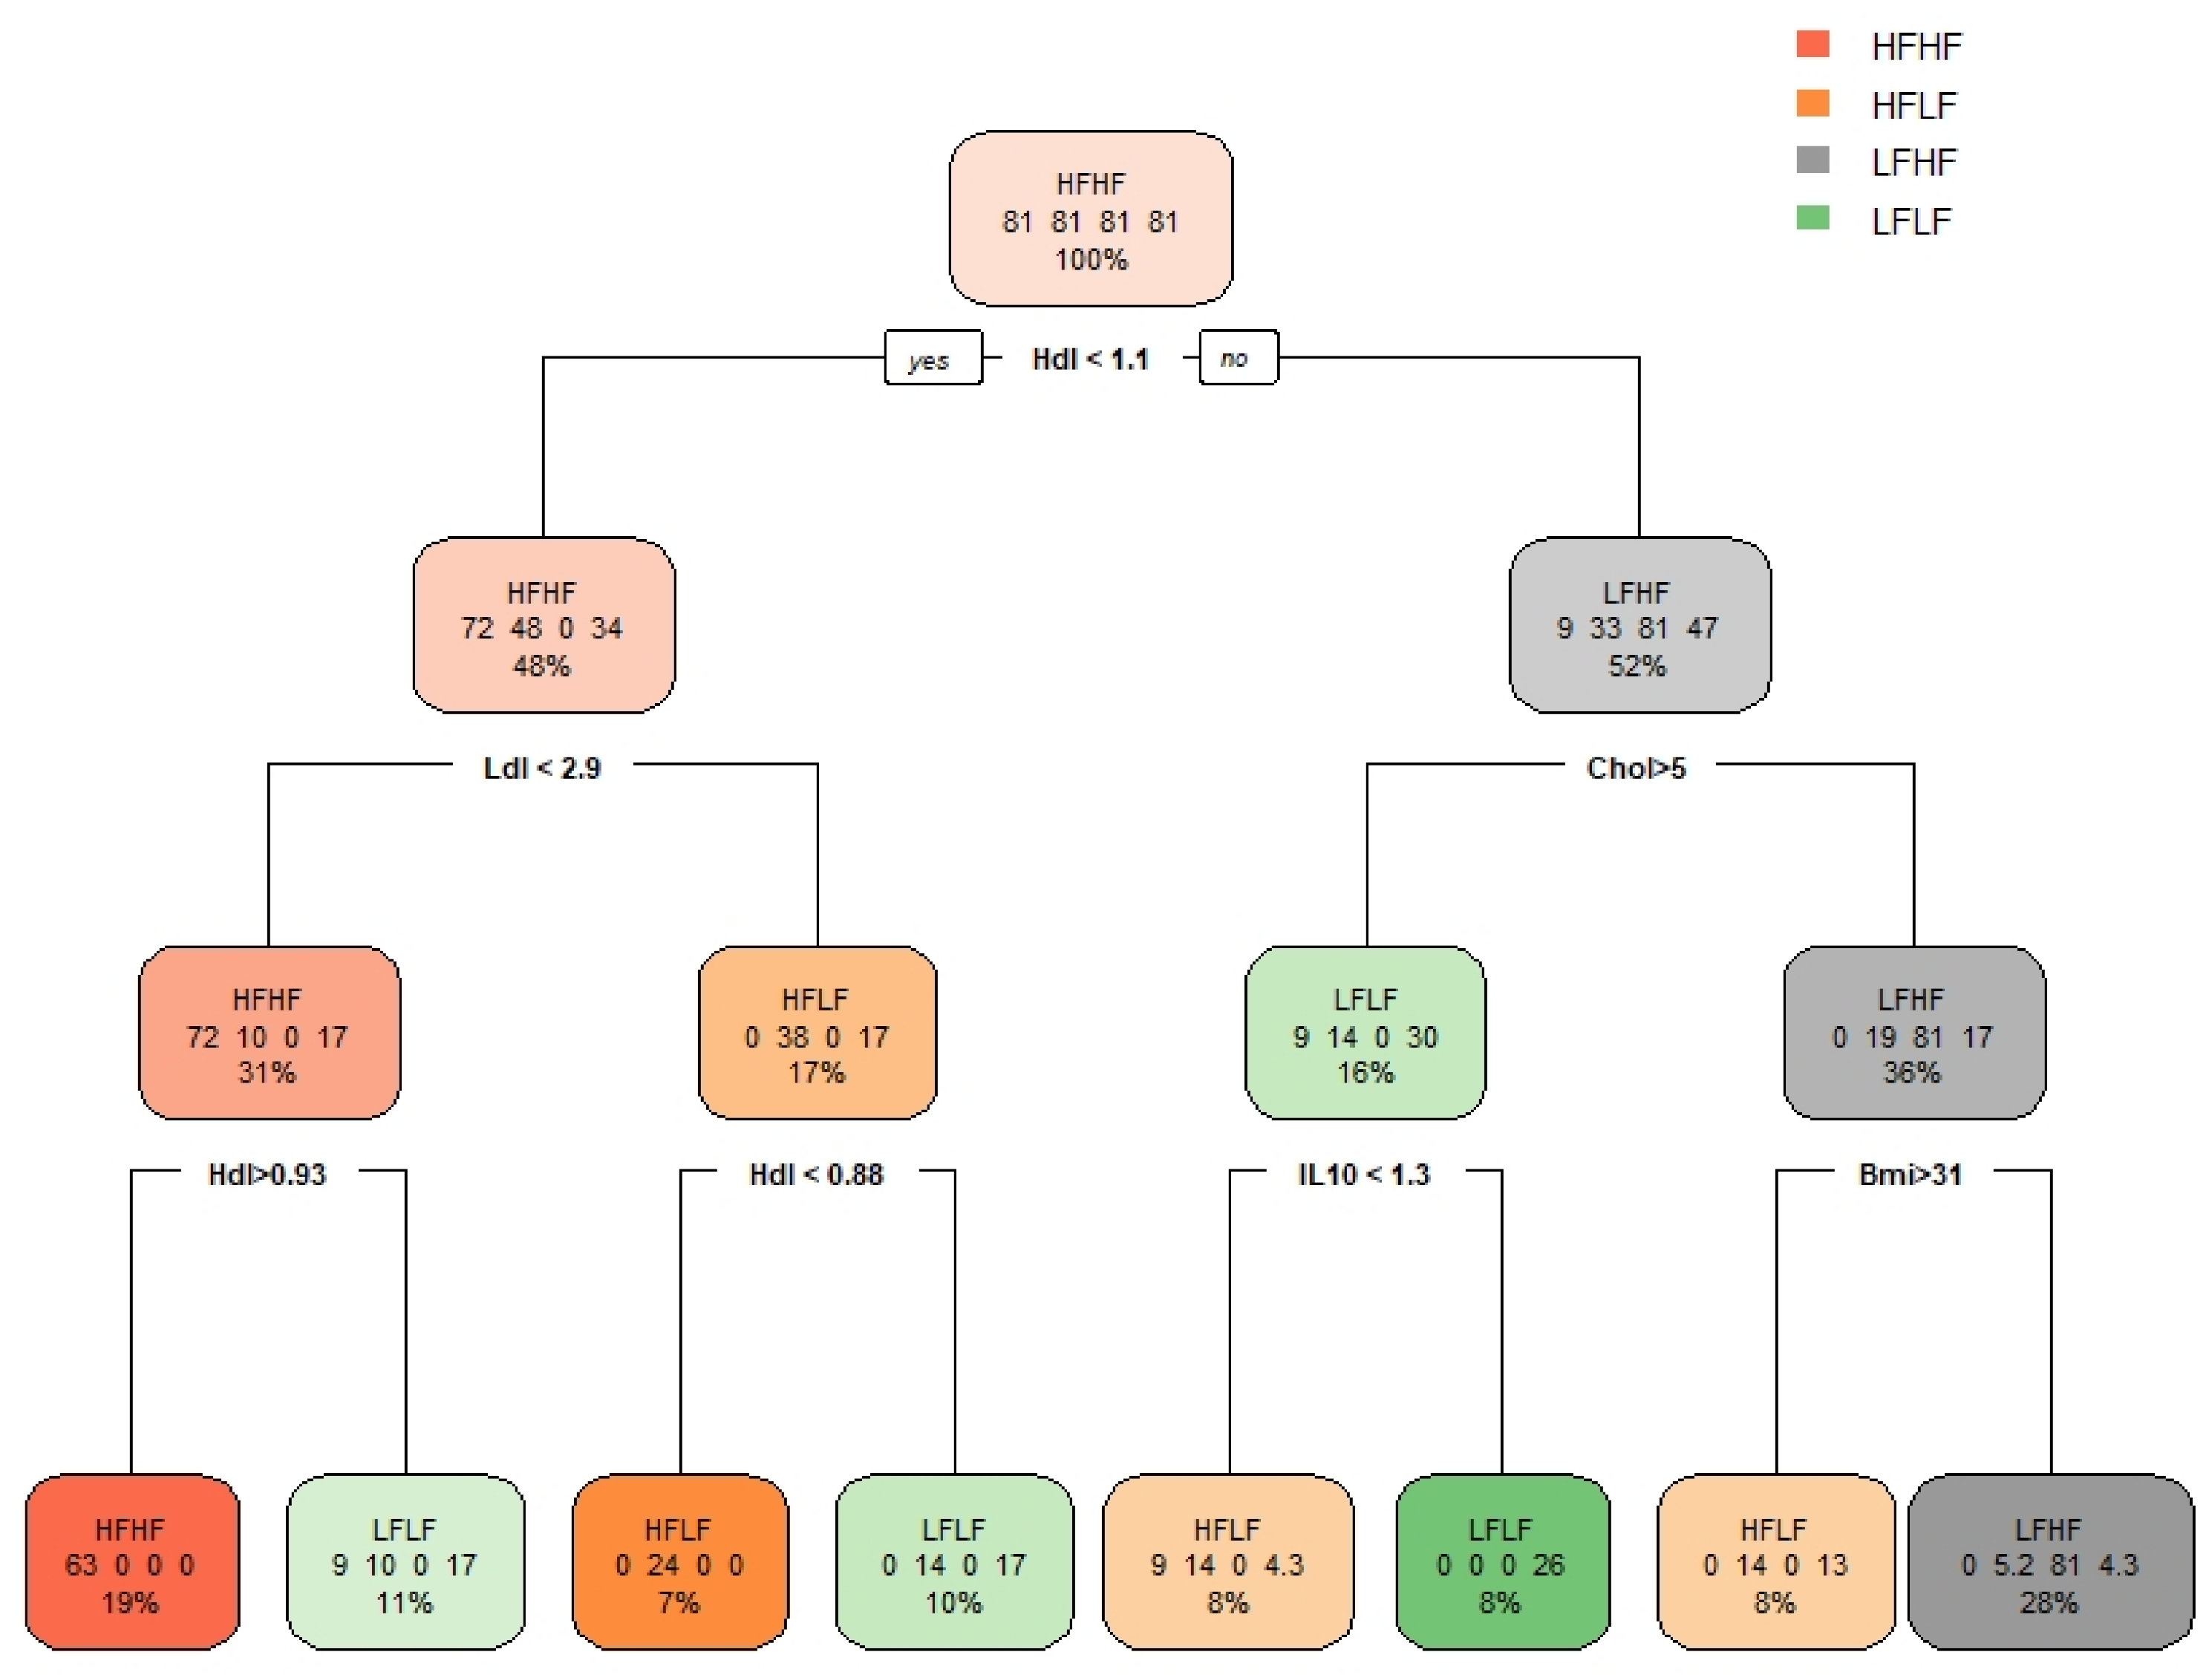
2.4.3. Decision Tree
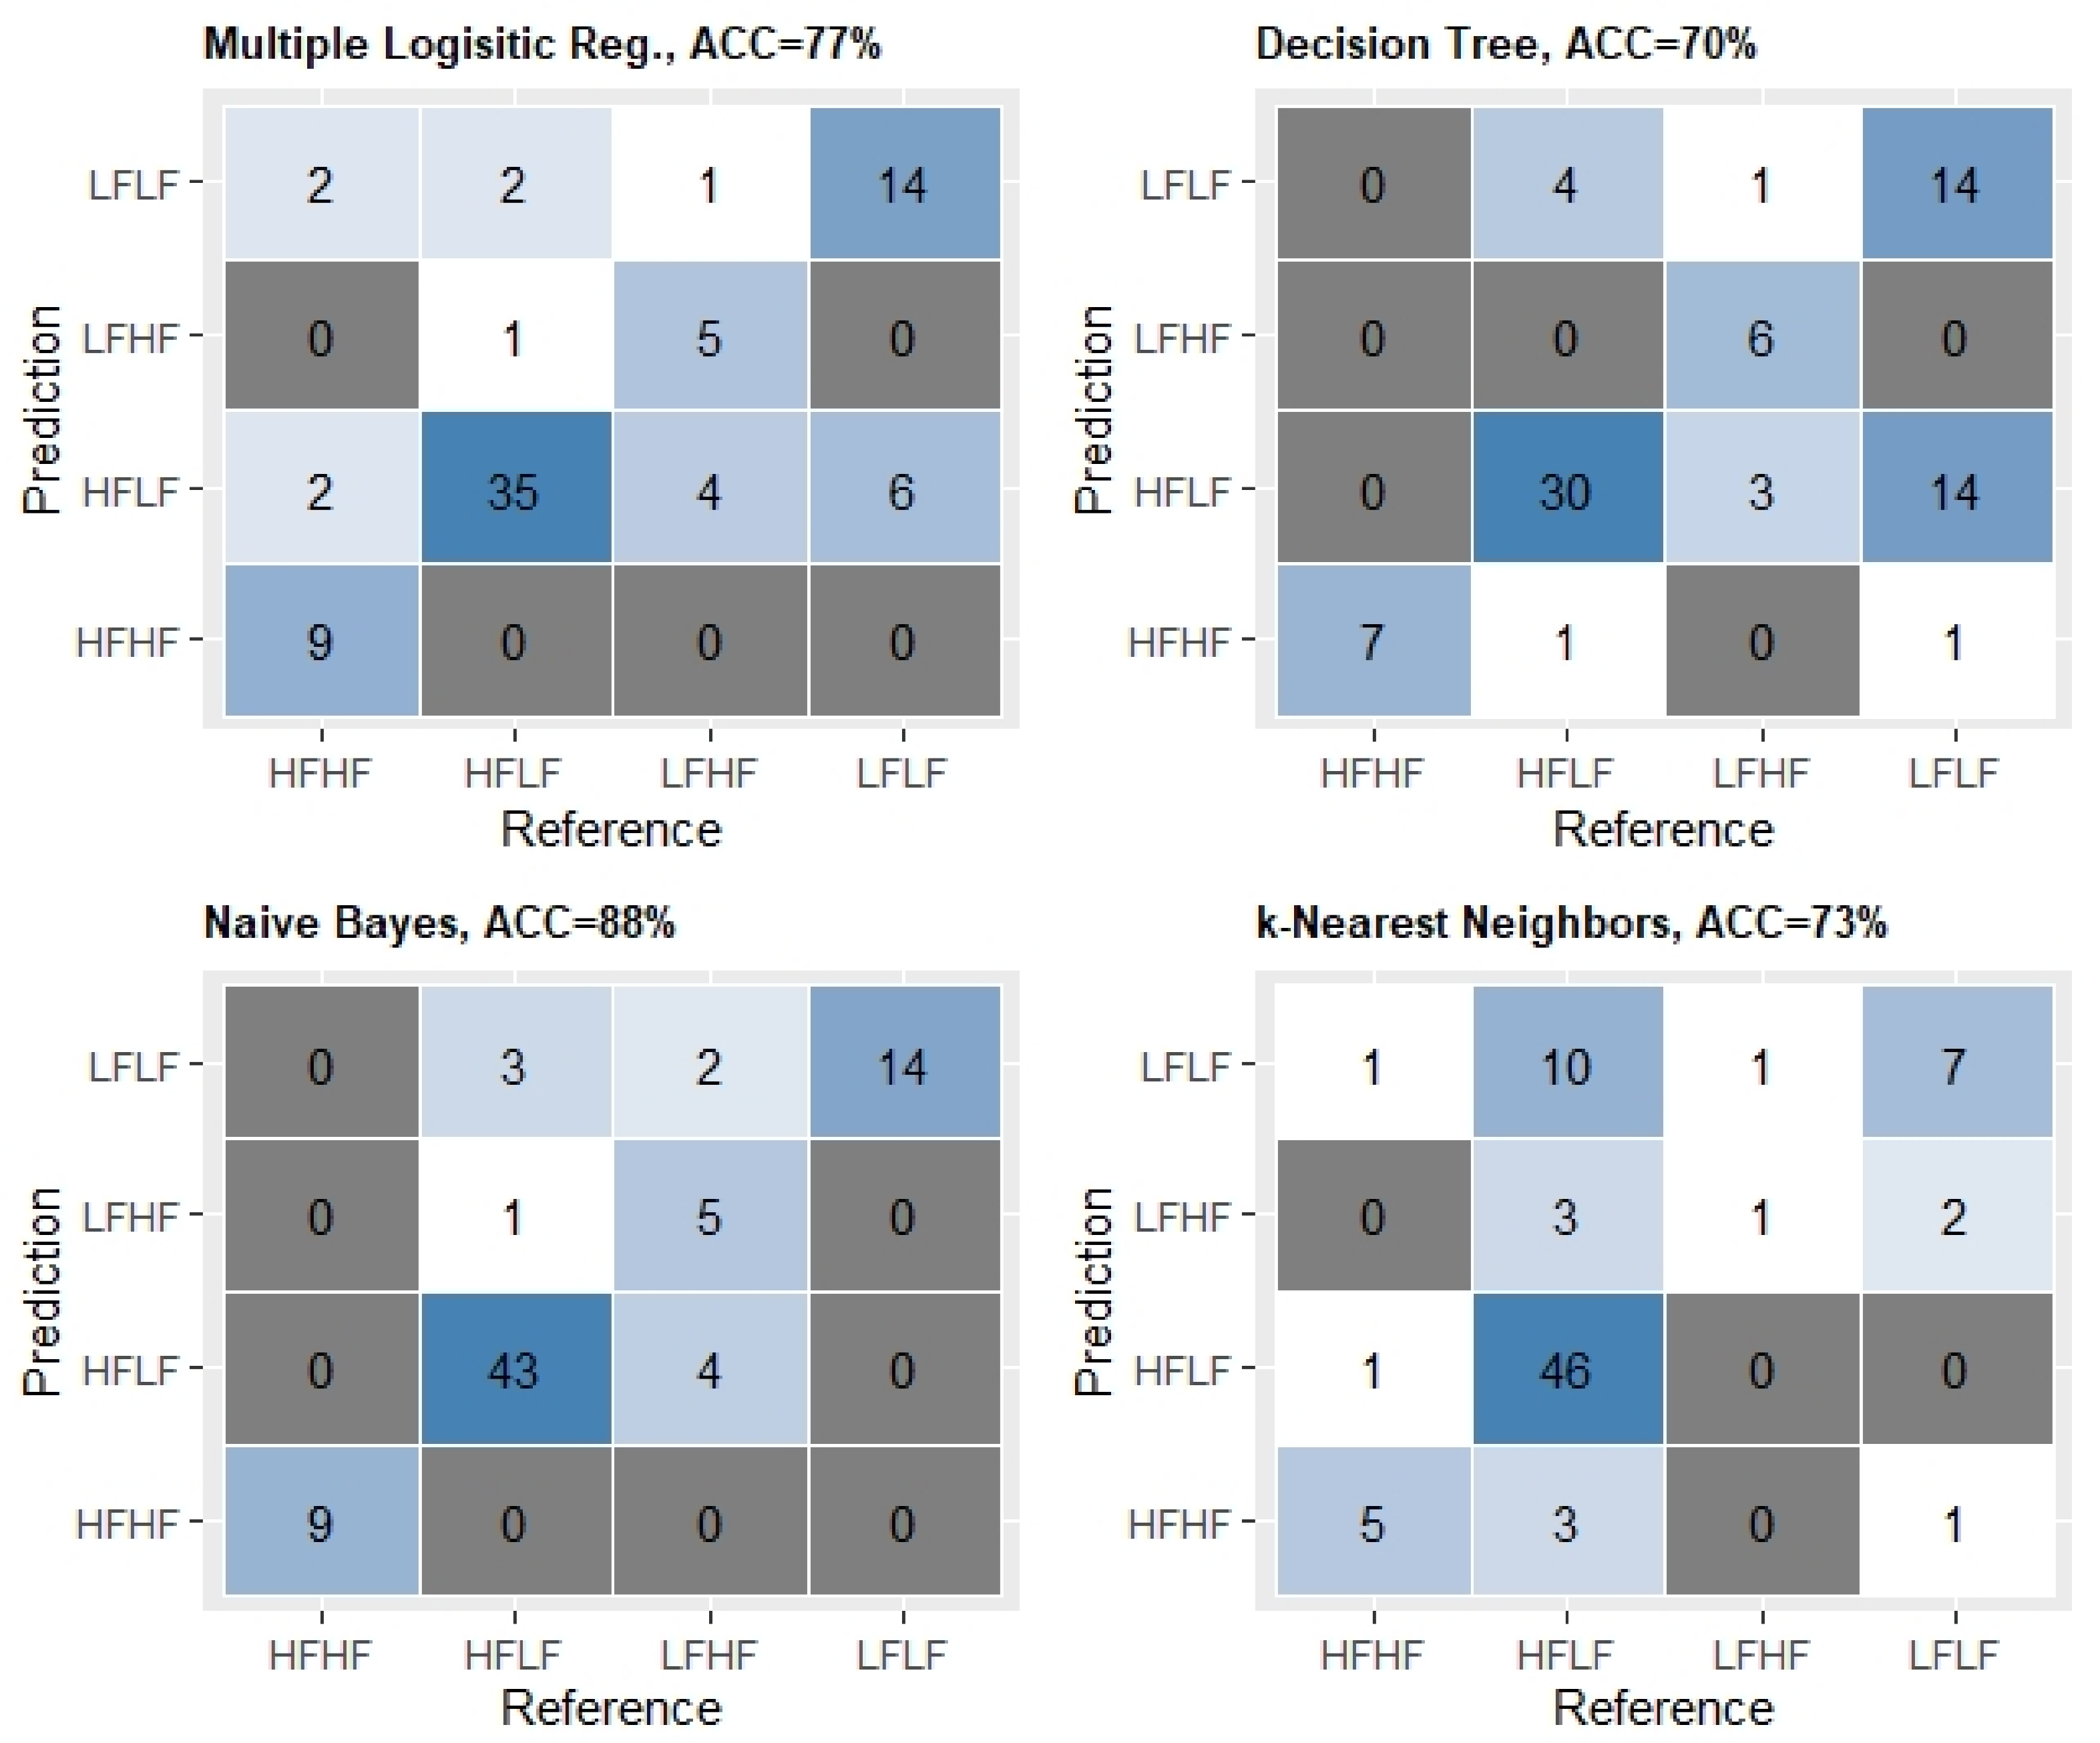
2.4.4. Classification Models
2.4.5. Mediation and Moderation Analysis
2.5. Statistical Analysis
3. Results
3.1. Subgrouping and Difference Analysis
3.2. Principal Component Analysis
3.3. Classification Models
3.4. Mediation and Moderation Analysis
4. Discussion
4.1. Descriptive Statistics in Relation to Fatness and Fitness
4.2. Machine Learning
4.3. Partial Mediation
4.4. Implications
4.5. Limitations
5. Conclusions
Supplementary Materials
Author Contributions
Funding
Institutional Review Board Statement
Informed Consent Statement
Data Availability Statement
Acknowledgments
Conflicts of Interest
References
- Morris, J.N.; Heady, J.A.; Raffle, P.A.B.; Roberts, C.G.; Parks, J.W. Coronary heart-disease and physical activity of work. Lancet 1953, 262, 1111–1120. [Google Scholar] [CrossRef]
- Blair, S.N.; Kohl, H.W.; Paffenbarger, R.S.; Clark, D.G.; Cooper, K.H.; Gibbons, L.W. Physical Fitness and All-Cause Mortality: A Prospective Study of Healthy Men and Women. JAMA J. Am. Med. Assoc. 1989, 262, 2395–2401. [Google Scholar] [CrossRef]
- Ortega, F.B.; Lavie, C.J.; Blair, S.N. Obesity and cardiovascular disease. Circ. Res. 2016, 118, 1752–1770. [Google Scholar] [CrossRef] [PubMed]
- Yerrakalva, D.; Mullis, R.; Mant, J. The associations of “fatness,” “fitness,” and physical activity with all-cause mortality in older adults: A systematic review. Obesity 2015, 23, 1944–1956. [Google Scholar] [CrossRef] [PubMed]
- Frith, E.; Loprinzi, P.D. The protective effects of a novel fitness-fatness index on all-cause mortality among adults with cardiovascular disease. Clin. Cardiol. 2017. [Google Scholar] [CrossRef]
- Lee, J. Influences of Cardiovascular Fitness and Body Fatness on the Risk of Metabolic Syndrome: A Systematic Review and Meta-Analysis. Am. J. Health Promot. 2020. [Google Scholar] [CrossRef] [PubMed]
- Oppewal, A.; Hilgenkamp, T.I.M. Is fatness or fitness key for survival in older adults with intellectual disabilities? J. Appl. Res. Intellect. Disabil. 2020, 33, 1016–1025. [Google Scholar] [CrossRef]
- Ortega, F.B.; Ruiz, J.R.; Labayen, I.; Lavie, C.J.; Blair, S.N. The Fat but Fit paradox: What we know and don’t know about it. Br. J. Sport. Med. 2018, 52. [Google Scholar] [CrossRef]
- Duncan, G.E. The “fit but fat” concept revisited: Population-based estimates using NHANES. Int. J. Behav. Nutr. Phys. Act. 2010, 7, 47. [Google Scholar] [CrossRef]
- Lahoz-García, N.; García-Hermoso, A.; Milla-Tobarra, M.; Díez-Fernández, A.; Soriano-Cano, A.; Martínez-Vizcaíno, V. Cardiorespiratory Fitness as a Mediator of the Influence of Diet on Obesity in Children. Nutrients 2018, 10, 358. [Google Scholar] [CrossRef]
- Edwards, M.K.; Loprinzi, P.D. Physical activity and diet on atherogenic index of plasma among adults in the United States: Mediation considerations by central adiposity. Eur. J. Clin. Nutr. 2018, 72, 826–831. [Google Scholar] [CrossRef]
- Lee, D.C.; Sui, X.; Church, T.S.; Lee, I.M.; Blair, S.N. Associations of cardiorespiratory fitness and obesity with risks of impaired fasting glucose and type 2 diabetes in men. Diabetes Care 2009, 32, 257–262. [Google Scholar] [CrossRef] [PubMed]
- Clarke, S.L.; Reaven, G.M.; Leonard, D.; Barlow, C.E.; Haskell, W.L.; Willis, B.L.; DeFina, L.; Knowles, J.W.; Maron, D.J. Cardiorespiratory Fitness, Body Mass Index, and Markers of Insulin Resistance in Apparently Healthy Women and Men. Am. J. Med. 2020, 133, 825–830.e2. [Google Scholar] [CrossRef]
- Leite, S.A.; Monk, A.M.; Upham, P.A.; Chacra, A.R.; Bergenstal, R.M. Low cardiorespiratory fitness in people at risk for type 2 diabetes: Early marker for insulin resistance. Diabetol. Metab. Syndr. 2009, 1, 8. [Google Scholar] [CrossRef]
- Ferrante, A.W. Obesity-induced inflammation: A metabolic dialogue in the language of inflammation. J. Intern. Med. 2007, 262, 408–414. [Google Scholar] [CrossRef] [PubMed]
- Coelho, A.J. Systemic Inflammation in the Morbidly Obese Patient. In Gastric Bypass; Springer: Berlin/Heidelberg, Germany, 2020; pp. 125–132. [Google Scholar]
- Ropelle, E.R.; Flores, M.B.; Cintra, D.E.; Rocha, G.Z.; Pauli, J.R.; Morari, J.; De Souza, C.T.; Moraes, J.C.; Prada, P.O.; Guadagnini, D.; et al. Leptin Sensitivity through IKKb and ER Stress Inhibition. PLoS Biol. 2010, 8, 1000465. [Google Scholar] [CrossRef]
- Batista, M.L.; Rosa, J.C.; Lopes, R.D.; Lira, F.S.; Martins, E.; Yamashita, A.S.; Brum, P.C.; Lancha, A.H.; Lopes, A.C.; Seelaender, M. Exercise training changes IL-10/TNF-α ratio in the skeletal muscle of post-MI rats. Cytokine 2010, 49, 102–108. [Google Scholar] [CrossRef] [PubMed]
- Nieman, D.C.; Henson, D.A.; Davis, J.M.; Dumke, C.L.; Utter, A.C.; Murphy, E.A.; Pearce, S.; Gojanovich, G.; McAnulty, S.R.; McAnulty, L.S. Blood Leukocyte mRNA Expression for IL-10, IL-1Ra, and IL-8, but Not IL-6, Increases after Exercise. J. Interf. Cytokine Res. 2006, 26, 668–674. [Google Scholar] [CrossRef]
- Dorneles, G.P.; Haddad, D.O.; Fagundes, V.O.; Vargas, B.K.; Kloecker, A.; Romão, P.R.T.; Peres, A. High intensity interval exercise decreases IL-8 and enhances the immunomodulatory cytokine interleukin-10 in lean and overweight-obese individuals. Cytokine 2016, 77, 1–9. [Google Scholar] [CrossRef]
- Sartor, F.; de Morree, H.M.; Matschke, V.; Marcora, S.M.; Milousis, A.; Thom, J.M.; Kubis, H.P. High-intensity exercise and carbohydrate-reduced energy-restricted diet in obese individuals. Eur. J. Appl. Physiol. 2010. [Google Scholar] [CrossRef] [PubMed]
- Barry, J.C.; Simtchouk, S.; Durrer, C.; Jung, M.E.; Mui, A.L.; Little, J.P. Short-term exercise training reduces anti-inflammatory action of interleukin-10 in adults with obesity. Cytokine 2018, 111, 460–469. [Google Scholar] [CrossRef]
- Esposito, K.; Pontillo, A.; Giugliano, F.; Giugliano, G.; Marfella, R.; Nicoletti, G.; Giugliano, D. Association of Low Interleukin-10 Levels with the Metabolic Syndrome in Obese Women. J. Clin. Endocrinol. Metab. 2003, 88, 1055–1058. [Google Scholar] [CrossRef] [PubMed]
- Jankord, R.; Jemiolo, B. Influence of physical activity on serum IL-6 and IL-10 levels in healthy older men. Med. Sci. Sports Exerc. 2004, 36, 960–964. [Google Scholar] [CrossRef] [PubMed]
- Nunes, R.B.; Tonetto, M.; Machado, N.; Chazan, M.; Heck, T.G.; Veiga, A.B.G.; Dall’Ago, P. Physical exercise improves plasmatic levels of IL-10, left ventricular end-diastolic pressure, and muscle lipid peroxidation in chronic heart failure rats. J. Appl. Physiol. 2008, 104, 1641–1647. [Google Scholar] [CrossRef]
- Goldhammer, E.; Tanchilevitch, A.; Maor, I.; Beniamini, Y.; Rosenschein, U.; Sagiv, M. Exercise training modulates cytokines activity in coronary heart disease patients. Int. J. Cardiol. 2005, 100, 93–99. [Google Scholar] [CrossRef]
- Kolliputi, N.; Goyal, R.; Panguluri, S.K.; Mishra, P.K.; Kesherwani, V.; Chavali, V.; Hackfort, B.T.; Tyagi, S.C. Exercise ameliorates high fat diet induced cardiac dysfunction by increasing interleukin 10. Front. Physiol. 2015, 6, 124. [Google Scholar] [CrossRef]
- Gallagher, D.; Heymsfield, S.B.; Heo, M.; Jebb, S.A.; Murgatroyd, P.R.; Sakamoto, Y. Healthy percentage body fat ranges: An approach for developing guidelines based on body mass index. Am. J. Clin. Nutr. 2000, 72, 694–701. [Google Scholar] [CrossRef] [PubMed]
- Pescatello, L.S. ACSM’s Guidelines for Exercise Testing and Prescription, 9th ed.; Wolters Kluwer/Lippincott Williams & Wilkins: Philadelphia, PA, USA, 2014. [Google Scholar]
- Zhang, Z.; Castelló, A. Principal components analysis in clinical studies. Ann. Transl. Med. 2017, 5, 12. [Google Scholar] [CrossRef]
- Granitto, P.M.; Furlanello, C.; Biasioli, F.; Gasperi, F. Recursive feature elimination with random forest for PTR-MS analysis of agroindustrial products. Chemom. Intell. Lab. Syst. 2006, 83, 83–90. [Google Scholar] [CrossRef]
- Kursa, M.B.; Rudnicki, W.R. Feature selection with the boruta package. J. Stat. Softw. 2010, 36, 1–13. [Google Scholar] [CrossRef]
- Baron, R.M.; Kenny, D.A. The Moderator-Mediator Variable Distinction in Social Psychological Research: Conceptual, Strategic, and Statistical Considerations; Psychological Association, Inc.: Washington, DC, USA, 1986; Volume 51. [Google Scholar]
- Thompson, P.D.; Arena, R.; Riebe, D.; Pescatello, L.S. ACSM’s new preparticipation health screening recommendations from ACSM’s guidelines for exercise testing and prescription, ninth edition. Curr. Sports Med. Rep. 2013, 12, 215–217. [Google Scholar] [CrossRef]
- Wallace, T.M.; Levy, J.C.; Matthews, D.R. Use and abuse of HOMA modeling. Diabetes Care 2004, 27, 1487–1495. [Google Scholar] [CrossRef]
- Kuhn, M. Building predictive models in R using the caret package. J. Stat. Softw. 2008, 28, 1–26. [Google Scholar] [CrossRef]
- Kuhn, M. The Caret Package. Available online: http://topepo.github.io/caret/index.html (accessed on 20 March 2020).
- Chambers, J.M.; Cleveland, W.S.; Kleiner, B.; Tukey, P.A. Graphical Methods for Data Analysis; CRC Press: Boca Raton, FL, USA, 2018; ISBN 9781351080750. [Google Scholar]
- Husson, F.; Le, S.; Pagès, J. Exploratory Multivariate Analysis by Example Using R.; Chapman and Hall: New York, NY, USA; CRC: Boca Raton, FL, USA, 2017. [Google Scholar]
- Boehmke, B.; Greenwell, B. Hands-On Machine Learning with R.; Chapman and Hall: New York, NY, USA; CRC: Boca Raton, FL, USA, 2019. [Google Scholar]
- Tingley, D.; Yamamoto, T.; Hirose, K.; Keele, L.; Imai, K. Mediation: R Package for Causal Mediation Analysis. J. Stat. Softw. 2014, 59, 1–38. [Google Scholar] [CrossRef]
- Heinzen, E.; Sinnwell, J.; Atkinson, E.; Gunderson, T.; Dougherty, G.; Votruba, P.; Lennon, R.; Hanson, A.; Goergen, K.; Lundt, E.; et al. An Arsenal of “R” Functions for Large-Scale Statistical Summaries. Available online: https://cran.r-project.org/web/packages/arsenal/arsenal.pdf (accessed on 20 March 2020).
- Solomon, T.P.J.; Malin, S.K.; Karstoft, K.; Knudsen, S.H.; Haus, J.M.; Laye, M.J.; Kirwan, J.P. Association Between Cardiorespiratory Fitness and the Determinants of Glycemic Control Across the Entire Glucose Tolerance Continuum. Diabetes Care 2015. [Google Scholar] [CrossRef]
- Gregory, J.M.; Muldowney, J.A.; Engelhardt, B.G.; Tyree, R.; Marks-Shulman, P.; Silver, H.J.; Donahue, E.P.; Edgerton, D.S.; Winnick, J.J. Aerobic exercise training improves hepatic and muscle insulin sensitivity, but reduces splanchnic glucose uptake in obese humans with type 2 diabetes. Nutr. Diabetes 2019. [Google Scholar] [CrossRef] [PubMed]
- Jung, S.H.; Park, H.S.; Kim, K.S.; Choi, W.H.; Ahn, C.W.; Kim, B.T.; Kim, S.M.; Lee, S.Y.; Ahn, S.M.; Kim, Y.K.; et al. Effect of weight loss on some serum cytokines in human obesity: Increase in IL-10 after weight loss. J. Nutr. Biochem. 2008, 19, 371–375. [Google Scholar] [CrossRef]
- Vasankari, T.J.; Kujala, U.M.; Vasankari, T.M.; Ahotupa, M. Reduced oxidized LDL levels after a 10-month exercise program. Med. Sci. Sports Exerc. 1998, 30, 1496–1501. [Google Scholar] [CrossRef] [PubMed]
- Serrano-Sá Nchez, J.A.; Delgado-Guerra, S.; Olmedillas, H.; Guadalupe-Grau, A.; Arteaga-Ortiz, R.; Sanchis-Moysi, J.; Dorado, C.; Calbet, J.A.L. Adiposity and Age Explain Most of the Association between Physical Activity and Fitness in Physically Active Men. PLoS ONE 2010. [Google Scholar] [CrossRef]
- Díez-Fernández, A.; Sánchez-López, M.; Gulías-González, R.; Notario-Pacheco, B.; García-Prieto, J.C.; Arias-Palencia, N.; Martínez-Vizcaíno, V. BMi as a mediator of the relationship between muscular fitness and cardiometabolic risk in children: A mediation analysis. PLoS ONE 2015, 10. [Google Scholar] [CrossRef] [PubMed]
- Kwon, S.; Trudy, L.B.; Janz, K. Associations of cardiorespiratory fitness and fatness with cardiovascular risk factors among adolescents: The NHANES 1999-2002. J. Phys. Act. Health 2010, 7, 746–753. [Google Scholar] [CrossRef] [PubMed]
- Tiainen, S.; Kiviniemi, A.; Hautala, A.; Huikuri, H.; Ukkola, O.; Tokola, K.; Tulppo, M.; Vasankari, T. Effects of a Two-Year Home-Based Exercise Training Program on Oxidized LDL and HDL Lipids in Coronary Artery Disease Patients with and without Type-2 Diabetes. Antioxidants 2018, 7, 144. [Google Scholar] [CrossRef] [PubMed]
- Luquet, S.; Lopez-Soriano, J.; Holst, D.; Fredenrich, A.; Melki, J.; Rassoulzadegan, M.; Grimaldi, P.A. Peroxisome proliferator-activated receptor δ controls muscle development and oxydative capability. FASEB J. 2003, 17, 2299–2301. [Google Scholar] [CrossRef] [PubMed]
- Spangenburg, E.E.; Brown, D.A.; Johnson, M.S.; Moore, R.L. Alterations in peroxisome proliferator-activated receptor mRNA expression in skeletal muscle after acute and repeated bouts of exercise. Mol. Cell. Biochem. 2009, 332, 225–231. [Google Scholar] [CrossRef][Green Version]
- Wei, C.; Penumetcha, M.; Santanam, N.; Liu, Y.G.; Garelnabi, M.; Parthasarathy, S. Exercise might favor reverse cholesterol transport and lipoprotein clearance: Potential mechanism for its anti-atherosclerotic effects. Biochim. Biophys. Acta Gen. Subj. 2005, 1723, 124–127. [Google Scholar] [CrossRef]
- Butcher, L.R.; Thomas, A.; Backx, K.; Roberts, A.; Webb, R.; Morris, K. Low-intensity exercise exerts beneficial effects on plasma lipids via pparγ. Med. Sci. Sports Exerc. 2008, 40, 1263–1270. [Google Scholar] [CrossRef] [PubMed]
- Lucero, D.; Islam, P.; Freeman, L.A.; Jin, X.; Pryor, M.; Tang, J.; Kruth, H.S.; Remaley, A.T. Interleukin 10 promotes macrophage uptake of HDL and LDL by stimulating fluid-phase endocytosis. Biochim. Biophys. Acta Mol. Cell Biol. Lipids 2020, 1865, 158537. [Google Scholar] [CrossRef]

| Age | Males | Females |
|---|---|---|
| Young | if AGE < 40 years AND if Sex = 1 AND FatMass% ≥ 26 then Higher-Fatness | Elseif Sex = 0 AND FatMass% ≥ 39 then Higher-Fatness |
| Middle-Age | if 59 ≥ AGE ≥ 40 AND if Sex = 1 AND FatMass% ≥ 29 then Higher-Fatness | Elseif Sex = 0 AND FatMass% ≥ 41 then Higher-Fatness |
| Older | if AGE ≥ 60 AND if Sex = 1 AND FatMass% ≥ 31 then Higher-Fatness | Elseif Sex = 0 AND FatMass% ≥ 43 then Higher-Fatness |
| Young/Middle/Older | Else Lower-Fatness | Else Lower-Fatness |
| Young | If AGE < 29 AND if Sex = 1 AND if relVO2max > 45.7 then Higher-Fitness | Elseif Sex = 0 AND if relVO2max > 39.5 then Higher-Fitness |
| Middle-Age | If 39 ≥ AGE > = 30 AND if Sex = 1 AND if relVO2max > 44.4 then Higher-Fitness | Elseif Sex = 0 AND if relVO2max > 36.7 then Higher-Fitness |
| If 49 ≥ AGE ≥ 40 AND if Sex = 1 AND if relVO2max > 42.4 then Higher-Fitness | Elseif Sex = 0 AND if OrelVO2max > 35.1 then Higher-Fitness | |
| Older | If AGE > 50 AND if Sex = 1 AND if relVO2max > 38.3 then Higher-Fitness | Elseif Sex = 0 AND if OrelVO2max > 31.4 then Higher-Fitness |
| Young/Middle/Older | Else Lower-Fitness | Else Lower-Fitness |
| Frequency Ratio | Percent Unique | Zero Variance | Near Zero Variance | |
|---|---|---|---|---|
| Sex | 7.100000 | 2.469136 | FALSE | FALSE |
| Age | 1.555556 | 23.456790 | FALSE | FALSE |
| Height | 1.142857 | 28.395062 | FALSE | FALSE |
| Weight | 1.000000 | 77.777778 | FALSE | FALSE |
| BMI | 1.500000 | 75.308642 | FALSE | FALSE |
| Chol | 1.000000 | 72.839506 | FALSE | FALSE |
| HDL | 1.000000 | 62.962963 | FALSE | FALSE |
| LDL | 1.333333 | 69.135802 | FALSE | FALSE |
| TG | 5.250000 | 49.382716 | FALSE | FALSE |
| Fgluc | 1.500000 | 62.962963 | FALSE | FALSE |
| Leptin | 1.000000 | 76.543210 | FALSE | FALSE |
| Insulin | 1.000000 | 77.777778 | FALSE | FALSE |
| BetacellF | 1.000000 | 77.777778 | FALSE | FALSE |
| InsSens | 1.000000 | 80.246914 | FALSE | FALSE |
| InsRes | 1.000000 | 43.209877 | FALSE | FALSE |
| TNFalpha | 1.333333 | 66.666667 | FALSE | FALSE |
| IL-6 | 1.333333 | 71.604938 | FALSE | FALSE |
| IL-10 | 1.000000 | 50.617284 | FALSE | FALSE |
| RER | 1.200000 | 34.567901 | FALSE | FALSE |
| HFHF (N = 9) | HFLF (N = 47) | LFHF (N = 6) | LFLF (N = 19) | Total (N = 81) | ANOVA p Value | t-Test Follow-Up HFHF vs. HFLF p Value | t-Test Follow-Up HFHF vs. LFHF p Value | t-Test Follow-Up HFHF vs. LFLF p Value | t-Test Follow-Up HFLF vs. LFHF p Value | t-Test Follow-up HFLF vs. LFLF p Value | t-Test Follow-Up LFHF vs. LFLF p Value | |
|---|---|---|---|---|---|---|---|---|---|---|---|---|
| Relative VO2max (mL/kg/min) | <0.001 | <0.001 | 0.013 | <0.001 | <0.001 | 0.346 | <0.001 | |||||
| Mean(SD) | 34.349 (4.237) | 25.492 (6.432) | 40.123 (2.992) | 26.968 (3.272) | 27.906 (6.932) | |||||||
| Range | 29.560–42.530 | 14.050–41.700 | 35.680–44.400 | 19.300–31.500 | 14.050–44.400 | |||||||
| Fat Mass % | <0.001 | 0.108 | 0.003 | 0.003 | <0.001 | <0.001 | 0.065 | |||||
| Mean(SD) | 41.951 (5.686) | 45.842 (6.686) | 31.395 (4.828) | 35.548 (4.510) | 41.925 (7.871) | |||||||
| Range | 32.100–47.500 | 29.800–57.240 | 25.400–37.750 | 26.180–40.500 | 25.400–57.240 | |||||||
| Age, yrs | 0.063 | |||||||||||
| Mean (SD) | 42.444 (7.764) | 34.787 (13.454) | 24.500 (8.666) | 33.526 (12.624) | 34.580 (12.866) | |||||||
| Range | 33.000–50.000 | 19.000–57.000 | 19.000–42.000 | 20.000–49.000 | 19.000–57.000 | |||||||
| BMI | 0.003 | 0.063 | 0.099 | 0.687 | 0.009 | 0.005 | 0.454 | |||||
| Mean (SD) | 31.174 (1.572) | 33.728 (3.949) | 29.165 (2.828) | 30.577 (4.217) | 32.367 (4.061) | |||||||
| Range | 27.580–33.080 | 26.970–44.990 | 25.000–31.440 | 25.300–39.230 | 25.000–44.990 | |||||||
| Height, m | 0.894 | |||||||||||
| Mean (SD) | 1.671 (0.114) | 1.662 (0.092) | 1.657 (0.047) | 1.681 (0.099) | 1.667 (0.093) | |||||||
| Range | 1.570–1.950 | 1.500–1.950 | 1.580–1.710 | 1.540–1.950 | 1.500–1.950 | |||||||
| Weight, kg | 0.138 | |||||||||||
| Mean (SD) | 87.458 (13.453) | 93.392 (14.219) | 80.335 (10.806) | 87.141 (18.855) | 90.299 (15.427) | |||||||
| Range | 67.990–119.050 | 63.400–125.690 | 62.500–91.630 | 61.750–125.690 | 61.750–125.690 | |||||||
| Cholesterol, mmol/L | 0.006 | 0.003 | 0.995 | 0.055 | 0.013 | 0.447 | 0.113 | |||||
| Mean (SD) | 3.839 (0.623) | 4.756 (0.830) | 3.837 (0.753) | 4.573 (1.003) | 4.543 (0.904) | |||||||
| Range | 3.210–5.020 | 2.590–6.260 | 2.830–4.970 | 3.170–6.320 | 2.590–6.320 | |||||||
| HDL, mmol/L | 0.008 | 0.900 | 0.025 | 0.056 | 0.057 | 0.004 | 0.873 | |||||
| Mean (SD) | 1.023 (0.205) | 1.040 (0.395) | 1.368 (0.327) | 1.407 (0.554) | 1.149 (0.445) | |||||||
| Range | 0.610–1.420 | 0.370–2.490 | 1.110–1.790 | 0.700–2.590 | 0.370–2.590 | |||||||
| LDL, mmol/L | <0.001 | 0.002 | 0.367 | 0.388 | <0.001 | 0.037 | 0.186 | |||||
| N-Miss | 0 | 1 | 0 | 0 | 1 | |||||||
| Mean (SD) | 2.456 (0.509) | 3.221 (0.667) | 2.165 (0.699) | 2.769 (1.006) | 2.949 (0.816) | |||||||
| Range | 1.860–3.240 | 1.910–4.460 | 1.230–2.890 | 0.360–4.560 | 0.360–4.560 | |||||||
| Fglucose, mmol/L | 0.237 | |||||||||||
| N-Miss | 0 | 0 | 0 | 1 | 1 | |||||||
| Mean (SD) | 5.416 (0.652) | 5.078 (0.802) | 4.665 (0.565) | 5.030 (0.351) | 5.074 (0.700) | |||||||
| Range | 4.710–6.360 | 3.850–9.050 | 3.800–5.300 | 4.190–5.460 | 3.800–9.050 | |||||||
| Leptin, ng /mL | 0.118 | |||||||||||
| N-Miss | 0 | 0 | 1 | 0 | 1 | |||||||
| Mean (SD) | 16.966 (10.307) | 29.711 (15.740) | 22.058 (18.130) | 29.883 (16.539) | 27.840 (15.895) | |||||||
| Range | 1.380–26.760 | 2.690–59.970 | 3.070–48.840 | 5.470–57.640 | 1.380–59.970 | |||||||
| Insulin, pmol/L | 0.040 | 0.012 | 0.023 | 0.039 | 0.630 | 0.184 | 0.722 | |||||
| N-Miss | 0 | 0 | 1 | 0 | 1 | |||||||
| Mean (SD) | 5.667 (2.978) | 11.053 (6.038) | 9.722 (2.363) | 9.021 (4.129) | 9.881 (5.415) | |||||||
| Range | 1.730–9.640 | 1.210–28.090 | 7.350–12.400 | 2.410–17.470 | 1.210–28.090 | |||||||
| TNFalpha, pg/mL | 0.992 | |||||||||||
| Mean (SD) | 1.411 (1.669) | 1.476 (2.253) | 1.188 (1.952) | 1.432 (2.046) | 1.437 (2.093) | |||||||
| Range | 0.280–4.920 | 0.240–10.900 | 0.270–5.170 | 0.240–7.070 | 0.240–10.900 | |||||||
| IL-6, pg/mL | 0.045 | 0.087 | 0.418 | 0.183 | 0.028 | 0.394 | 0.061 | |||||
| Mean (SD) | 1.609 (0.525) | 1.118 (0.811) | 1.933 (0.983) | 1.294 (0.589) | 1.274 (0.777) | |||||||
| Range | 0.800–2.200 | 0.000–3.120 | 0.380–3.040 | 0.190–2.250 | 0.000–3.120 | |||||||
| IL-10, pg/mL | 0.138 | |||||||||||
| N-Miss | 0 | 0 | 1 | 0 | 1 | |||||||
| Mean (SD) | 0.864 (0.224) | 0.841 (0.332) | 1.130 (0.848) | 1.108 (0.662) | 0.925 (0.470) | |||||||
| Range | 0.430–1.190 | 0.030–1.700 | 0.030–2.370 | 0.040–2.250 | 0.030–2.370 |
| Estimate | 95% CI Lower | 95% CI Upper | p-Value | |
|---|---|---|---|---|
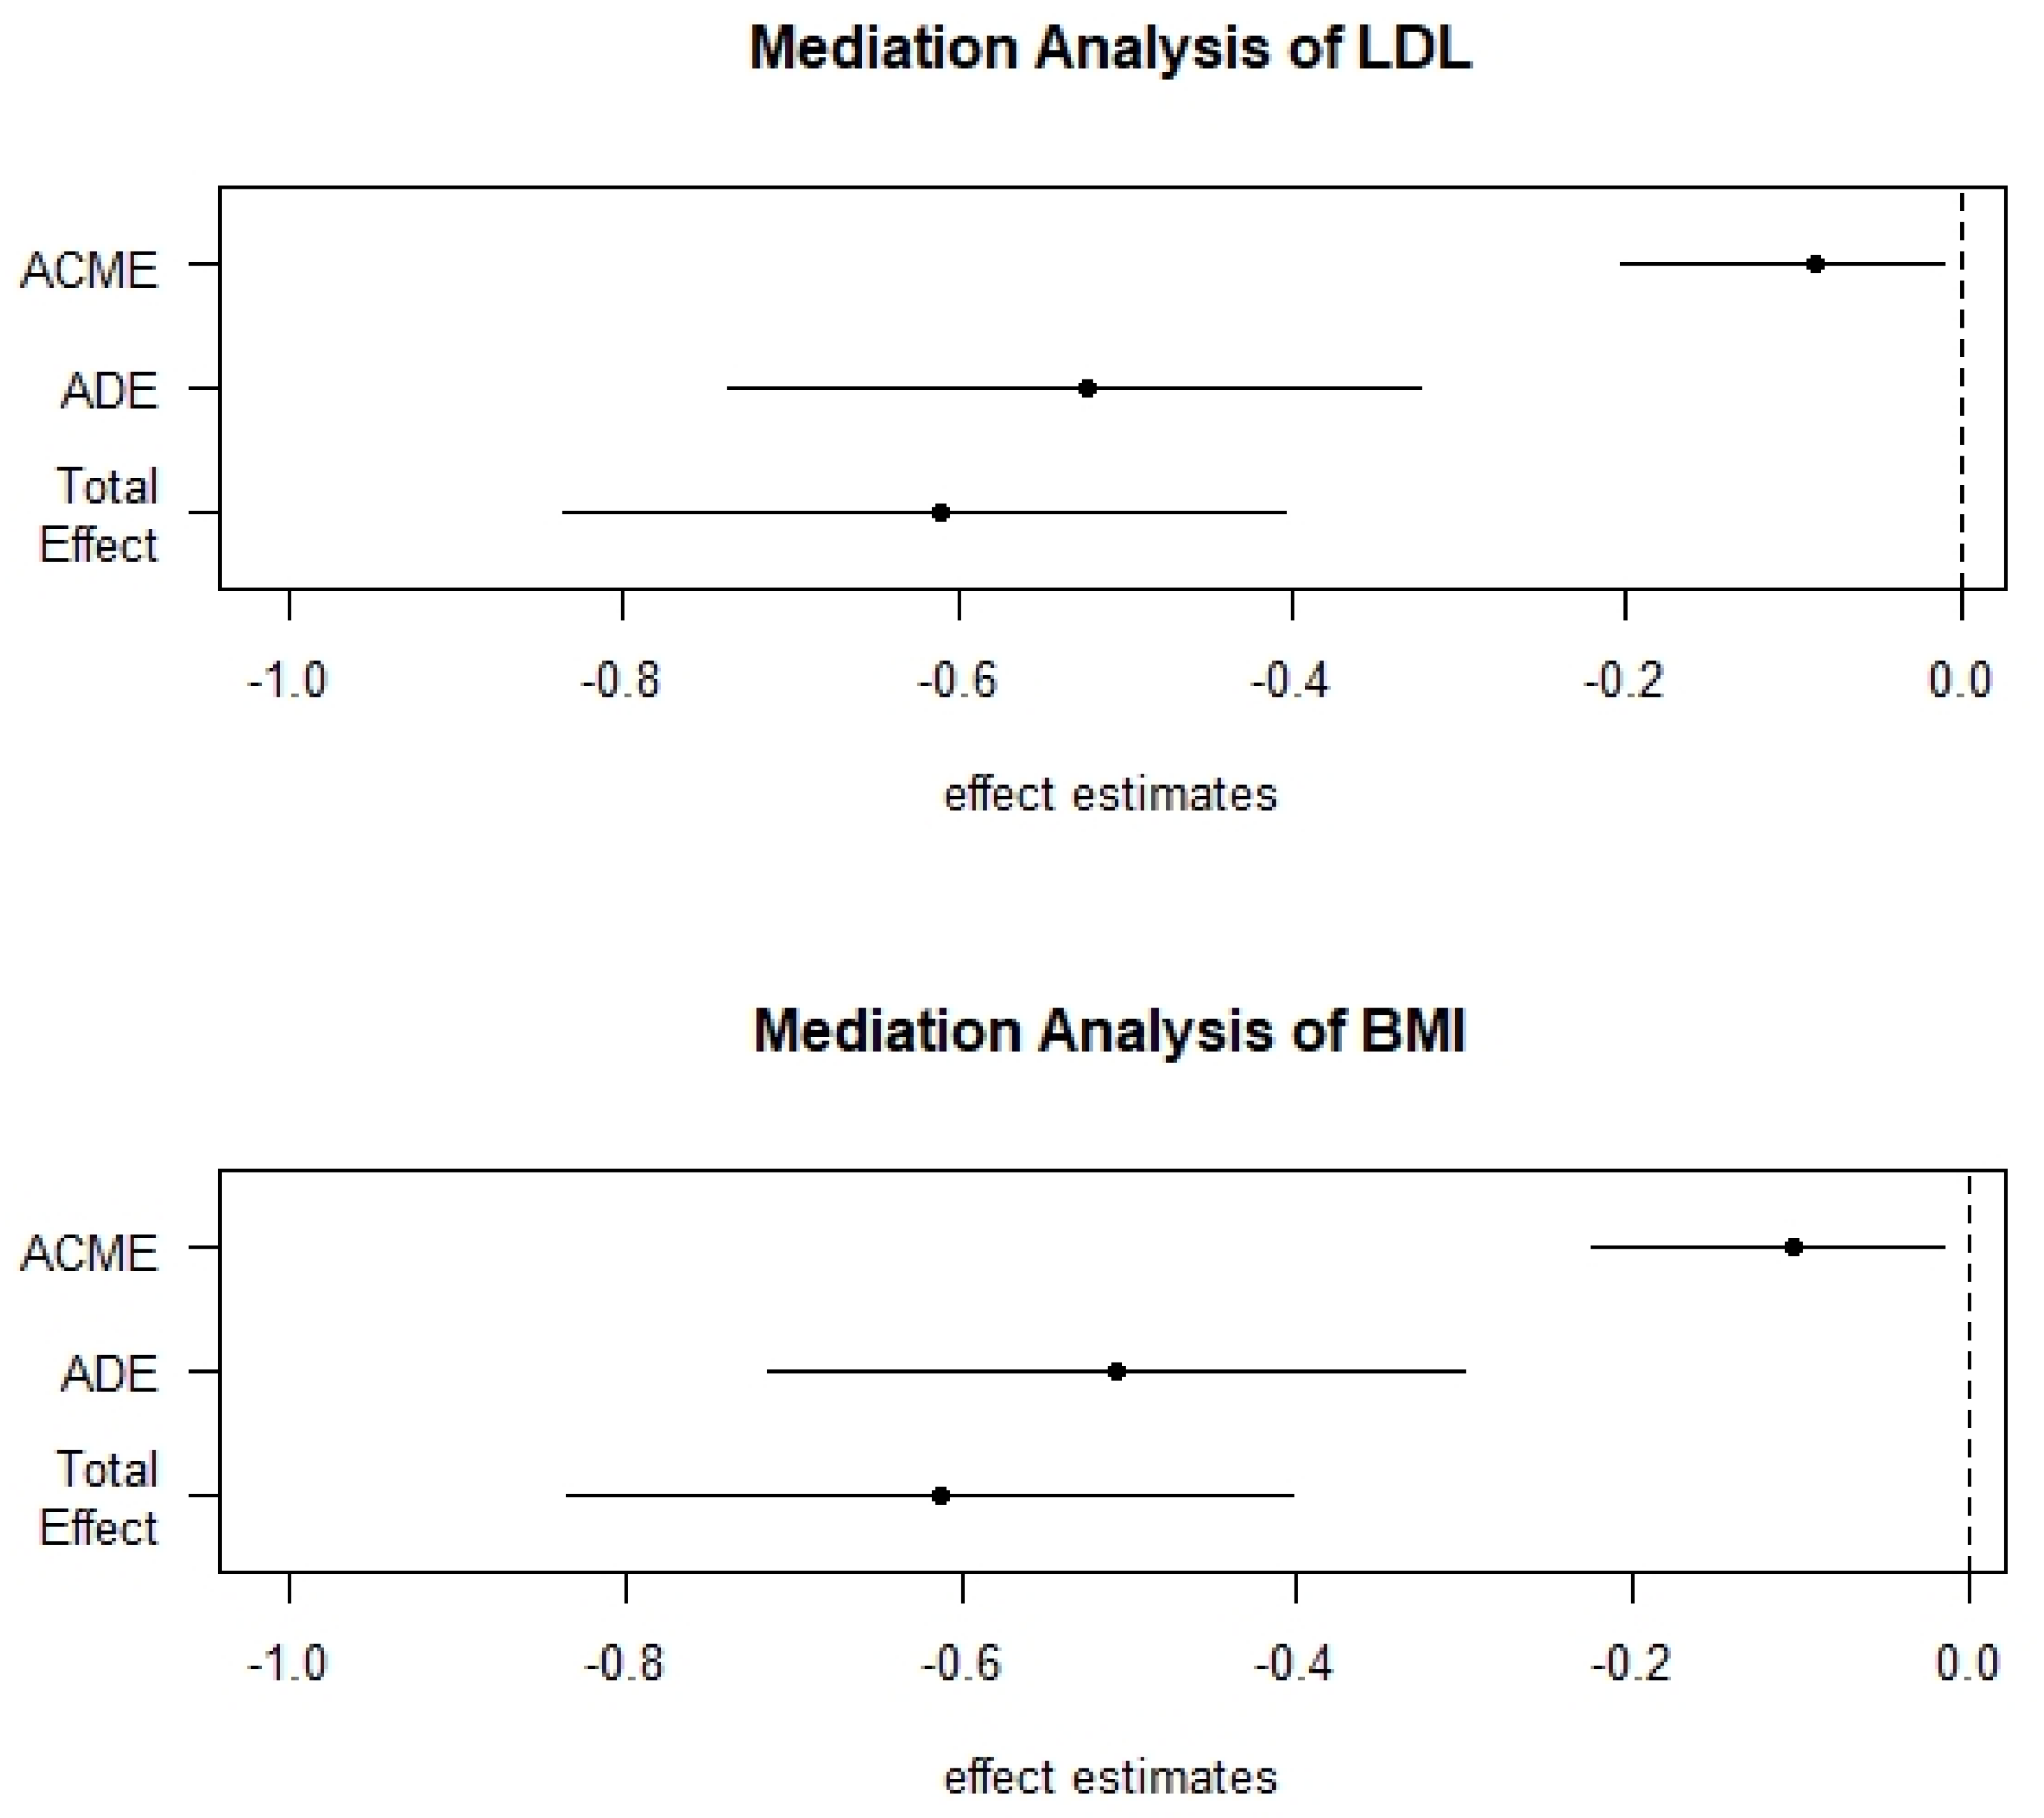
| ACME (LDL) | −0.0843 | −0.1813 | −0.01 | 0.024 * |
| ADE (LDL) | −0.5221 | −0.7414 | −0.30 | <0.001 *** |
| Total Effect LDL) | −0.6063 | −0.8271 | −0.40 | <0.001 *** |
| Prop. Mediated (LDL) | 0.1308 | 0.0164 | 0.31 | 0.024 * |
| ACME (BMI) | −0.1078 | −0.2205 | −0.02 | 0.012 * |
| ADE (BMI) | −0.4996 | −0.7034 | −0.30 | <0.001 *** |
| Total Effect (BMI) | −0.6075 | −0.8211 | −0.40 | <0.001 *** |
| Prop. Mediated (BMI) | 0.1728 | 0.0397 | 0.36 | 0.012 * |
Publisher’s Note: MDPI stays neutral with regard to jurisdictional claims in published maps and institutional affiliations. |
© 2021 by the authors. Licensee MDPI, Basel, Switzerland. This article is an open access article distributed under the terms and conditions of the Creative Commons Attribution (CC BY) license (http://creativecommons.org/licenses/by/4.0/).
Share and Cite
Sartor, F.; Moore, J.P.; Kubis, H.-P. Plasma Interleukin-10 and Cholesterol Levels May Inform about Interdependences between Fitness and Fatness in Healthy Individuals. Int. J. Environ. Res. Public Health 2021, 18, 1800. https://doi.org/10.3390/ijerph18041800
Sartor F, Moore JP, Kubis H-P. Plasma Interleukin-10 and Cholesterol Levels May Inform about Interdependences between Fitness and Fatness in Healthy Individuals. International Journal of Environmental Research and Public Health. 2021; 18(4):1800. https://doi.org/10.3390/ijerph18041800
Chicago/Turabian StyleSartor, Francesco, Jonathan P. Moore, and Hans-Peter Kubis. 2021. "Plasma Interleukin-10 and Cholesterol Levels May Inform about Interdependences between Fitness and Fatness in Healthy Individuals" International Journal of Environmental Research and Public Health 18, no. 4: 1800. https://doi.org/10.3390/ijerph18041800
APA StyleSartor, F., Moore, J. P., & Kubis, H.-P. (2021). Plasma Interleukin-10 and Cholesterol Levels May Inform about Interdependences between Fitness and Fatness in Healthy Individuals. International Journal of Environmental Research and Public Health, 18(4), 1800. https://doi.org/10.3390/ijerph18041800


