Article

Pollution Distribution of Potentially Toxic Elements in a Karstic River Affected by Manganese Mining in Changyang, Western Hubei, Central China

Institute of Geological Survey, China University of Geosciences, Wuhan 430074, China
*
Author to whom correspondence should be addressed.
Int. J. Environ. Res. Public Health 2021, 18(4), 1870; https://doi.org/10.3390/ijerph18041870
Submission received: 5 February 2021 / Revised: 8 February 2021 / Accepted: 8 February 2021 / Published: 15 February 2021

Abstract

:
This study investigated the distribution, pollution level and potential ecological risk of potentially toxic elements (PTEs) from manganese mining in a karstic Danshui River, in Changyang, Western Hubei, Central China. River water and sediments were collected for seven PTEs measurement (As, Cd, Cr, Cu, Mn, Pb and Zn), as well as pH and Eh of the river water were measured. Results showed that the major pollutant was Mn, the river water environment was mainly acidic and oxidizing (288 < Eh, pH < 6.3), and the pollution distribution of Mn in the study area was dominated by the combination of natural processes and anthropogenic activities. In the river water, according to the contamination factor (CF) and pollution load index (IPL) results, Mn was considered the main pollutant. There was low As and Pb pollution downstream as well as Cu pollution upstream. Upstream and downstream areas were the main polluted river sections of the river water samples collected. In river sediments, based on the results of the geo-accumulation index (Igeo) and potential ecological risk index (IPER), it was determined that there was only considerable Mn pollution. The IPER of the PTEs from the river sediments was at acceptable levels, only Mn upstream performed at a moderate ecological risk level. According to Pearson correlation and principal component analysis, Mn originated from manganese mining activities, Cd, Cr and Zn were of natural origin, and Cu may have come from both mining and natural origin, whereas Pb and As were mainly related to the daily activities. Consequently, elemental speciation, mining activities and the distribution of water conservancy facilities were the main impacts of PET pollution distribution in this river.

1. Introduction

Potentially toxic elements (PTEs) are persistent pollutants with potential hazards [1,2,3]. They cannot be biodegraded and easily accumulate in water bodies, sediments and biosphere, which can be harmful to human health and the ecosystem [4,5,6,7]. However, they rarely accumulate to harmful levels within natural conditions [8,9]. PET pollution caused by anthropogenic activities, especially mining activities, are widely distributed in many countries all over the world [10]. The water environment (especially the important physical and chemical parameters: pH and Eh) is easily changed by mining activities, and then affects the migration and transformation of pollution elements in the water environment [11]. Numerous studies indicated that mining was a major source of PTEs [12,13] and rivers in the mining areas were the main medium to transport the pollutants. It has become increasingly important to distinguish between the geogenic and anthropogenic sources of these PTEs and to understand that the background values change depending on the area and the scale of the area investigated [14]. However, there were still few studies focused on the pollution levels of different sections of the river in mining areas [15,16,17]. Therefore, studies focused on the pollution levels along the rivers in mining areas are discussed below, which are of great significance to prevent the environmental pollution of rivers.
The Changyang Gucheng Manganese Mine is one of the eight major manganese mines in China, with an estimated reserve of about 37 million tons of manganese. It is located at the midstream of the Danshui River and it has been running by separation floating and electrolytic processes for more than 20 years [18,19]. According to the field investigations, its acid sewage and slag were discharged directly into the Danshui River in the early years and caused considerable pollution to the river water and sediments. Although the local manganese mine owners built tailings ponds above the Cretaceous aquiclude to store the acid sewage and slag, the acid sewage and slag can still leak during transportation. In addition, the manganese mine is still running today, which may continue to produce pollution. PTEs in the river slag and sediments from the manganese mining activities could also be released into the water again when the water environmental conditions change [20,21]. These PTEs pose a significant threat to the local water security, but there are limited studies on the pollution of these manganese mining activities.
As, Cd, Cr, Cu, Mn, Pb and Zn are typical PTE pollutants in manganese mining areas [22,23,24,25]. To assess the potential impacts of manganese mining on river water and sediments, the concentration of these seven toxic heavy metal elements in both river water samples and sediments from the Danshui River was collected and analyzed. In this paper, (1) the concentration values were compared to the Chinese surface water environmental quality standards III (GB3838-2002) [26] and the average concentration of PTEs in water samples and sediments from the uninfluenced areas upstream of the Danshui River; (2) statistical analysis tools such as Pearson Correlation and Principal Component Analysis (PCA) were used to identify the relationships between the PTEs and possible common sources of pollution; (3) different pollution and risk indices were calculated to evaluate the level of contamination and the possible ecological risks in different sections of the river.

2. Materials and Methods

2.1. Study Area

The study area is located in the middle section of the Danshui River in Changyang County, southwest Hubei (Figure 1). This section is located in a karstic area. From the perspective of the geological background, the strata exposed in the study area are Cambrian and Ordovician carbonate strata consisting of mainly dolomite and limestone. The river sediments of the river were mainly silt, sand and carbonate gravel that mainly came from the local rock strata. From the perspective of the water system structure, the Danshui River is the primary tributary of the north bank in the lower Qingjiang River and branches from northwest to southeast. There is a large curve in the lower reach of the Danshui River and many water conservancy facilities are distributed along the river. The Gucheng manganese mine and its tailings pond are located on the left bank and the right bank, respectively, of the middle reach in Danshui. According to the hydraulic characteristics, the emission of pollutants and the distribution of the water conservancy facilities along the river can be divided into four sections (Figure 1): ① Control section: the section of the river not polluted by human activities [19]. ② The upstream of the study area: the main pollution discharge area of the manganese mining activities and there is a dam underneath (Chengzikou~Zengjiaju). ③ The midstream of study area: Zengjiaju~Pengjiakou. ④ The downstream of the study area: the acid sewage from upstream is discharged in the upper part of this section after being utilized by the hydropower station and there is a wasteyard in the lower part of this section (Pengjiakou~Panjiatang). In order to implement the protection plan of the Yangtze river from 2019, the local government adopted powerful measures to control the local pollution problems, which included improving the treatment process of the acid sewage and slag from manganese mining activities and building manganese tailings ponds and dams. However, due to the considerable pollution problems remaining from the earlier mining activities, it was necessary to assess the pollution status of PTEs in the river water and sediments.

2.2. Sample Collection and Chemical Analysis

Based on the Technical Code for Surface Water and Sewage Monitoring (HJ/T 91-2002) and the Code for Geochemical Reconnaissance (DZ/T 0011-2005) [27,28], 16 sampling cross-sections positioned along the Danshui River were identified (Control section: K1~K5, Upstream: K6~K9, Midstream: K10~K12, Downstream: K13~K16). A total of 32 samples (16 river water (RW) and 16 river sediments (RD)) were collected during October 2019. River water samples were collected at a depth of up to 30 cm and stored in 500 mL polyethylene bottles after filtering with a microfiltration membrane (pore size 0.45 μm) and acidified using 3 mg·L−1 of concentrated nitric acid [HNO3 (mass fraction: 98%)] in the field. The sample bottles were washed three times with the water sample to be collected prior to sampling. River sediments samples of about 1~2 kg were collected from 0~10 cm by a hand auger made of 304 stainless steel (YKD-20, Changsha Yonglekang Company, Changsha, China) and stored in clean zip lock polyethylene bags. The hand auger was cleaned three times with deionized water before each new sample was collected to avoid cross-contamination. Both river water and sediments samples were kept below 4 °C until further analysis.
All samples were measured within 14 days after sampling. The total concentrations of As, Cd, Cr, Cu, Mn, Pb and Zn were analyzed using inductively coupled plasma-optical emission spectrometry (ICP-OES, ICAP7600, ThermoFisher, Wuhan, China). The detection limit for each metal was 0.1 μg·L−1. In the experiment, the sample and blank control (i.e., adding HNO3 and ultra-pure water in the same proportion as the measured sample) were measured 6 times and the average value of the last three measurements was taken as the analysis result. After the sample was analyzed, the standard sample was measured again to ensure that the analysis error of data was controlled within 3%. After the sediment samples were air-dried, grounded, and sieved through 200 mesh screens, approximately a 0.1 g sediment sample was digested by HF–HNO3–HClO4 in a Teflon container and to a final liquid volume of 100 mL. Afterward, As, Cd, Cr, Cu, Mn, Pb and Zn in the sediment samples were quantitatively determined by mass spectrometry (ME-MS61, Agilent 7900, Guangzhou, China), and the detection limits of As, Cd, Cr, Cu, Mn, Pb and Zn were 0.002, 0.0002, 0.01, 0.002, 0.05, 0.005 and 0.02 mg·kg−1, respectively. The blank sample, parallel sample and national sediment standard sample GSD-12(GBW07312) were used for the quality control of the samples. The metal content of the blank samples was required to be less than 0.1 μg/L, the standard deviation between parallel samples less than 5%, and the error between the test value and the actual value of the standard sample less than 5% in order to pass quality control measures. The pH and Eh of the river water samples were measured in the field using a portable pH meter (Orion 8102BNUWP, Thermo Scientific, Waltham, MA, America) and acidity meter (PHJ-4A, Shanghai Leici Company, Shanghai, China), respectively. All physical parameters in river water samples were measured in triplicate and averaged.

2.3. Assessment of Pollution in River Water

2.3.1. Contamination Factor (CF)

The contamination factor (CF) is an index for pollution status and is a widely used quantitative index to assess pollution levels in a given environmental compartment [29], which is calculated as:
CF = C s C BG
where Cs is the concentration of PTEs in a water sample (mg·L−1); CBG is the background values of elements and was based on the river water concentration of PTEs in the control section (CBG of As = 0.005, Cd = 0.002, Cr = 0.002, Cu = 0.01, Mn = 0.006, Pb = 0.008, Zn = 0.005 mg·L−1). Four levels were defined: low contamination (CF < 1); moderate contamination (1≤ CF < 3); severe contamination (3 ≤ CF < 6) and extreme contamination (CF ≥ 6) [29].

2.3.2. Pollution Load Index (IPL)

In order to further evaluate the comprehensive status of the PTEs in a particular site or area in the river surface water samples. The pollution load index (IPL) was used based on the contamination factor (CF) [30], which followed the equation:
I PL = CF 1 × CF 2 × × CF n
where n represents the number of PTEs. The grading criteria of the pollution load index are classified as: non-contaminated (0 ≤ IPL < 1); baseline (IPL = 1); progressive contamination (IPL > 1) [31].

2.4. Assessment of Pollution in River Sediments

2.4.1. Geo-Accumulation Index (Igeo)

Geo-accumulation index (Igeo) is a widely used method to evaluate pollution of PTEs in sediments [32,33]. Its formula is:
I geo = log 2 ( Y i A · B i )
where Yi is the concentration of potentially toxic element in the sediment (mg·kg−1), and Bi is the geochemical background concentration of the PTEs in the river sediment (the Bi of As = 19, Cd = 1, Cr = 82, Cu = 39, Mn = 487, Pb = 15, Zn = 85 mg·kg−1); A is the calibration factor and generally with 1.5; Igeo has seven grades (Table 1), interpreting as: Igeo ≤ 0—uncontaminated; 0 < Igeo ≤ 1—uncontaminated to moderately contaminated; 1 < Igeo ≤ 2—moderately contaminated; 2 < Igeo ≤ 3—moderately to heavily contaminated; 3 < Igeo ≤ 4—heavily contaminated; 4 < Igeo ≤ 5—heavily to extremely contaminated; Igeo ≥ 5—extremely contaminated [32,33,34].

2.4.2. Potential Ecological Risk Index (IPER)

To assess the potential ecological risk of PTEs in river sediments, the Hakanson’s potential ecological risk (IPER) is used, which indicates the toxicology of PTEs [35,36,37]. The equation is:
E r i = T r i C s i C n i
RI = i = 1 7 E r i
where RI is the sum of potential ecological risks of all PTEs; E r i is the potential ecological risk index of an individual potentially toxic element; T r i is the biological toxicity factor of a given PET (the T r i of As = 10, Cd = 30, Cr = 2, Cu = Pb = 5, Mn = Zn = 1) [38,39]; C s i is the actual concentration of PTEs in river sediments (mg·kg−1); C n i is the background concentration of PTEs in river sediments, which is consistent with Bi. However, the classification of potential ecological risk index is based on 8 pollutants (As, Cd, Cr, Cu, Hg, Pb, PCB (Polychlorinated Biphenyl), Zn). The amount and type of PTEs may affect the assessment standards; thus, the grading criteria of ecological risk are improved (Table 1) [40,41].

3. Results and Discussion

3.1. Concentration Distribution of PTEs

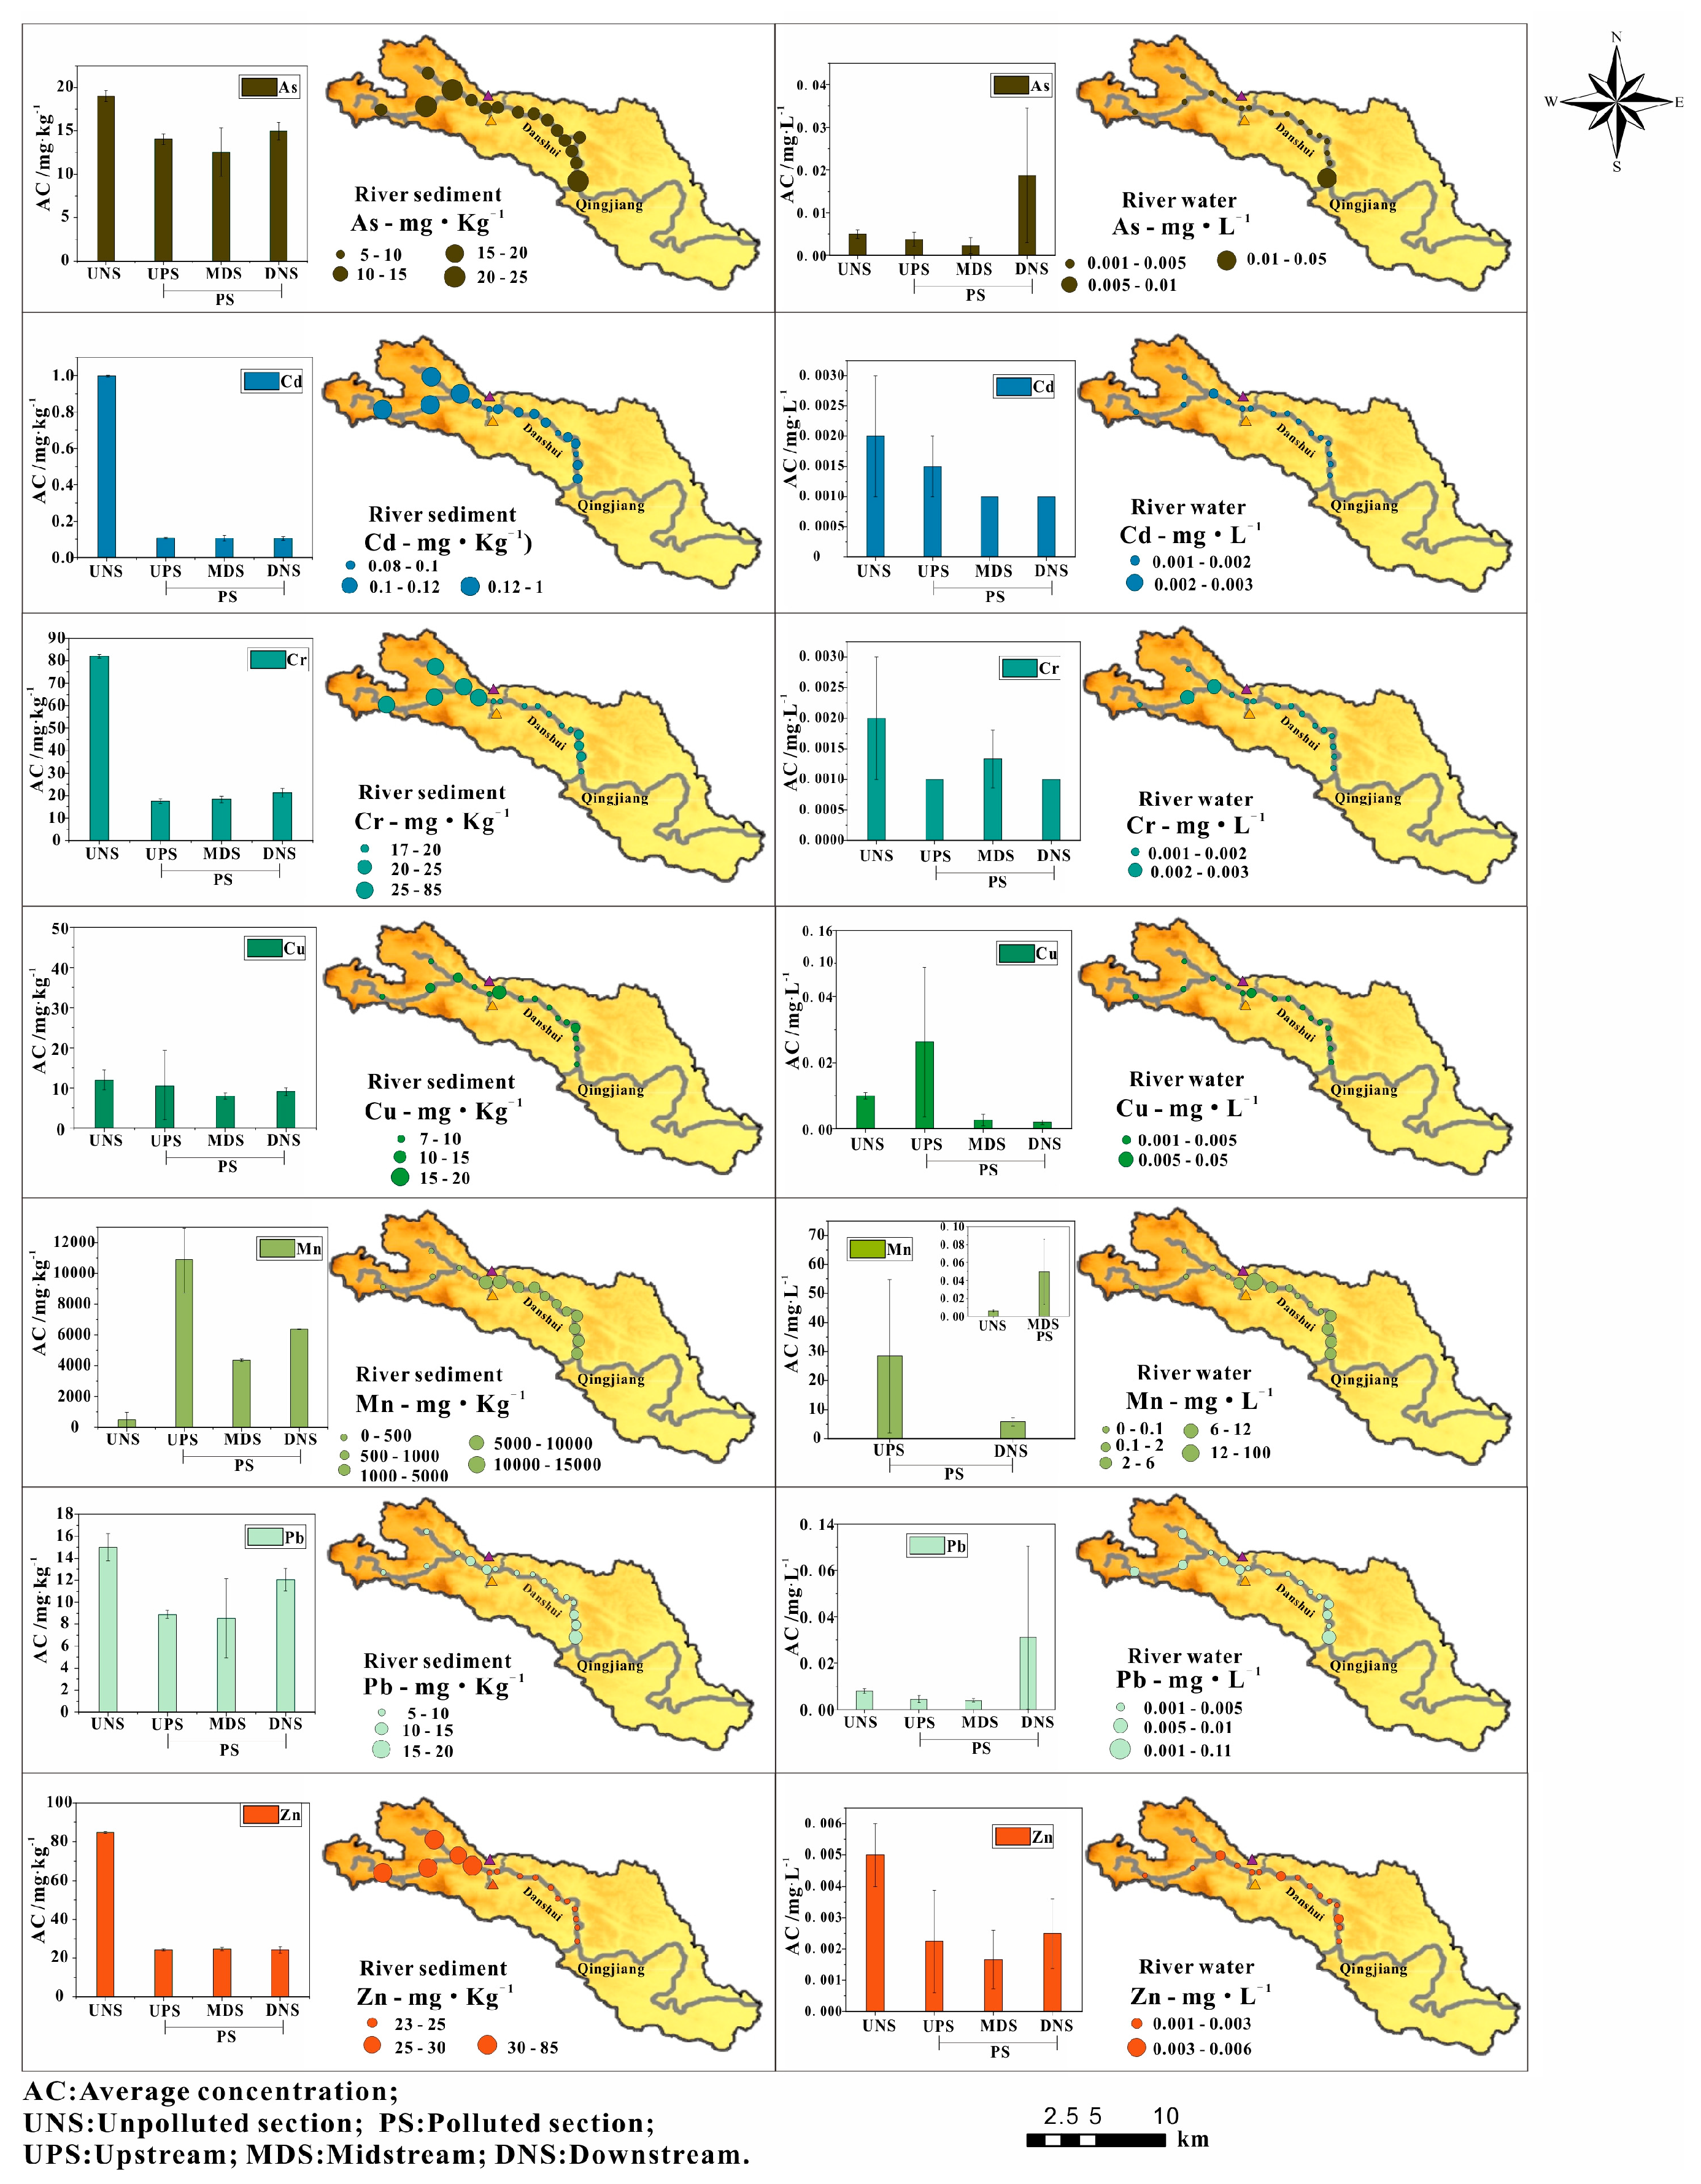
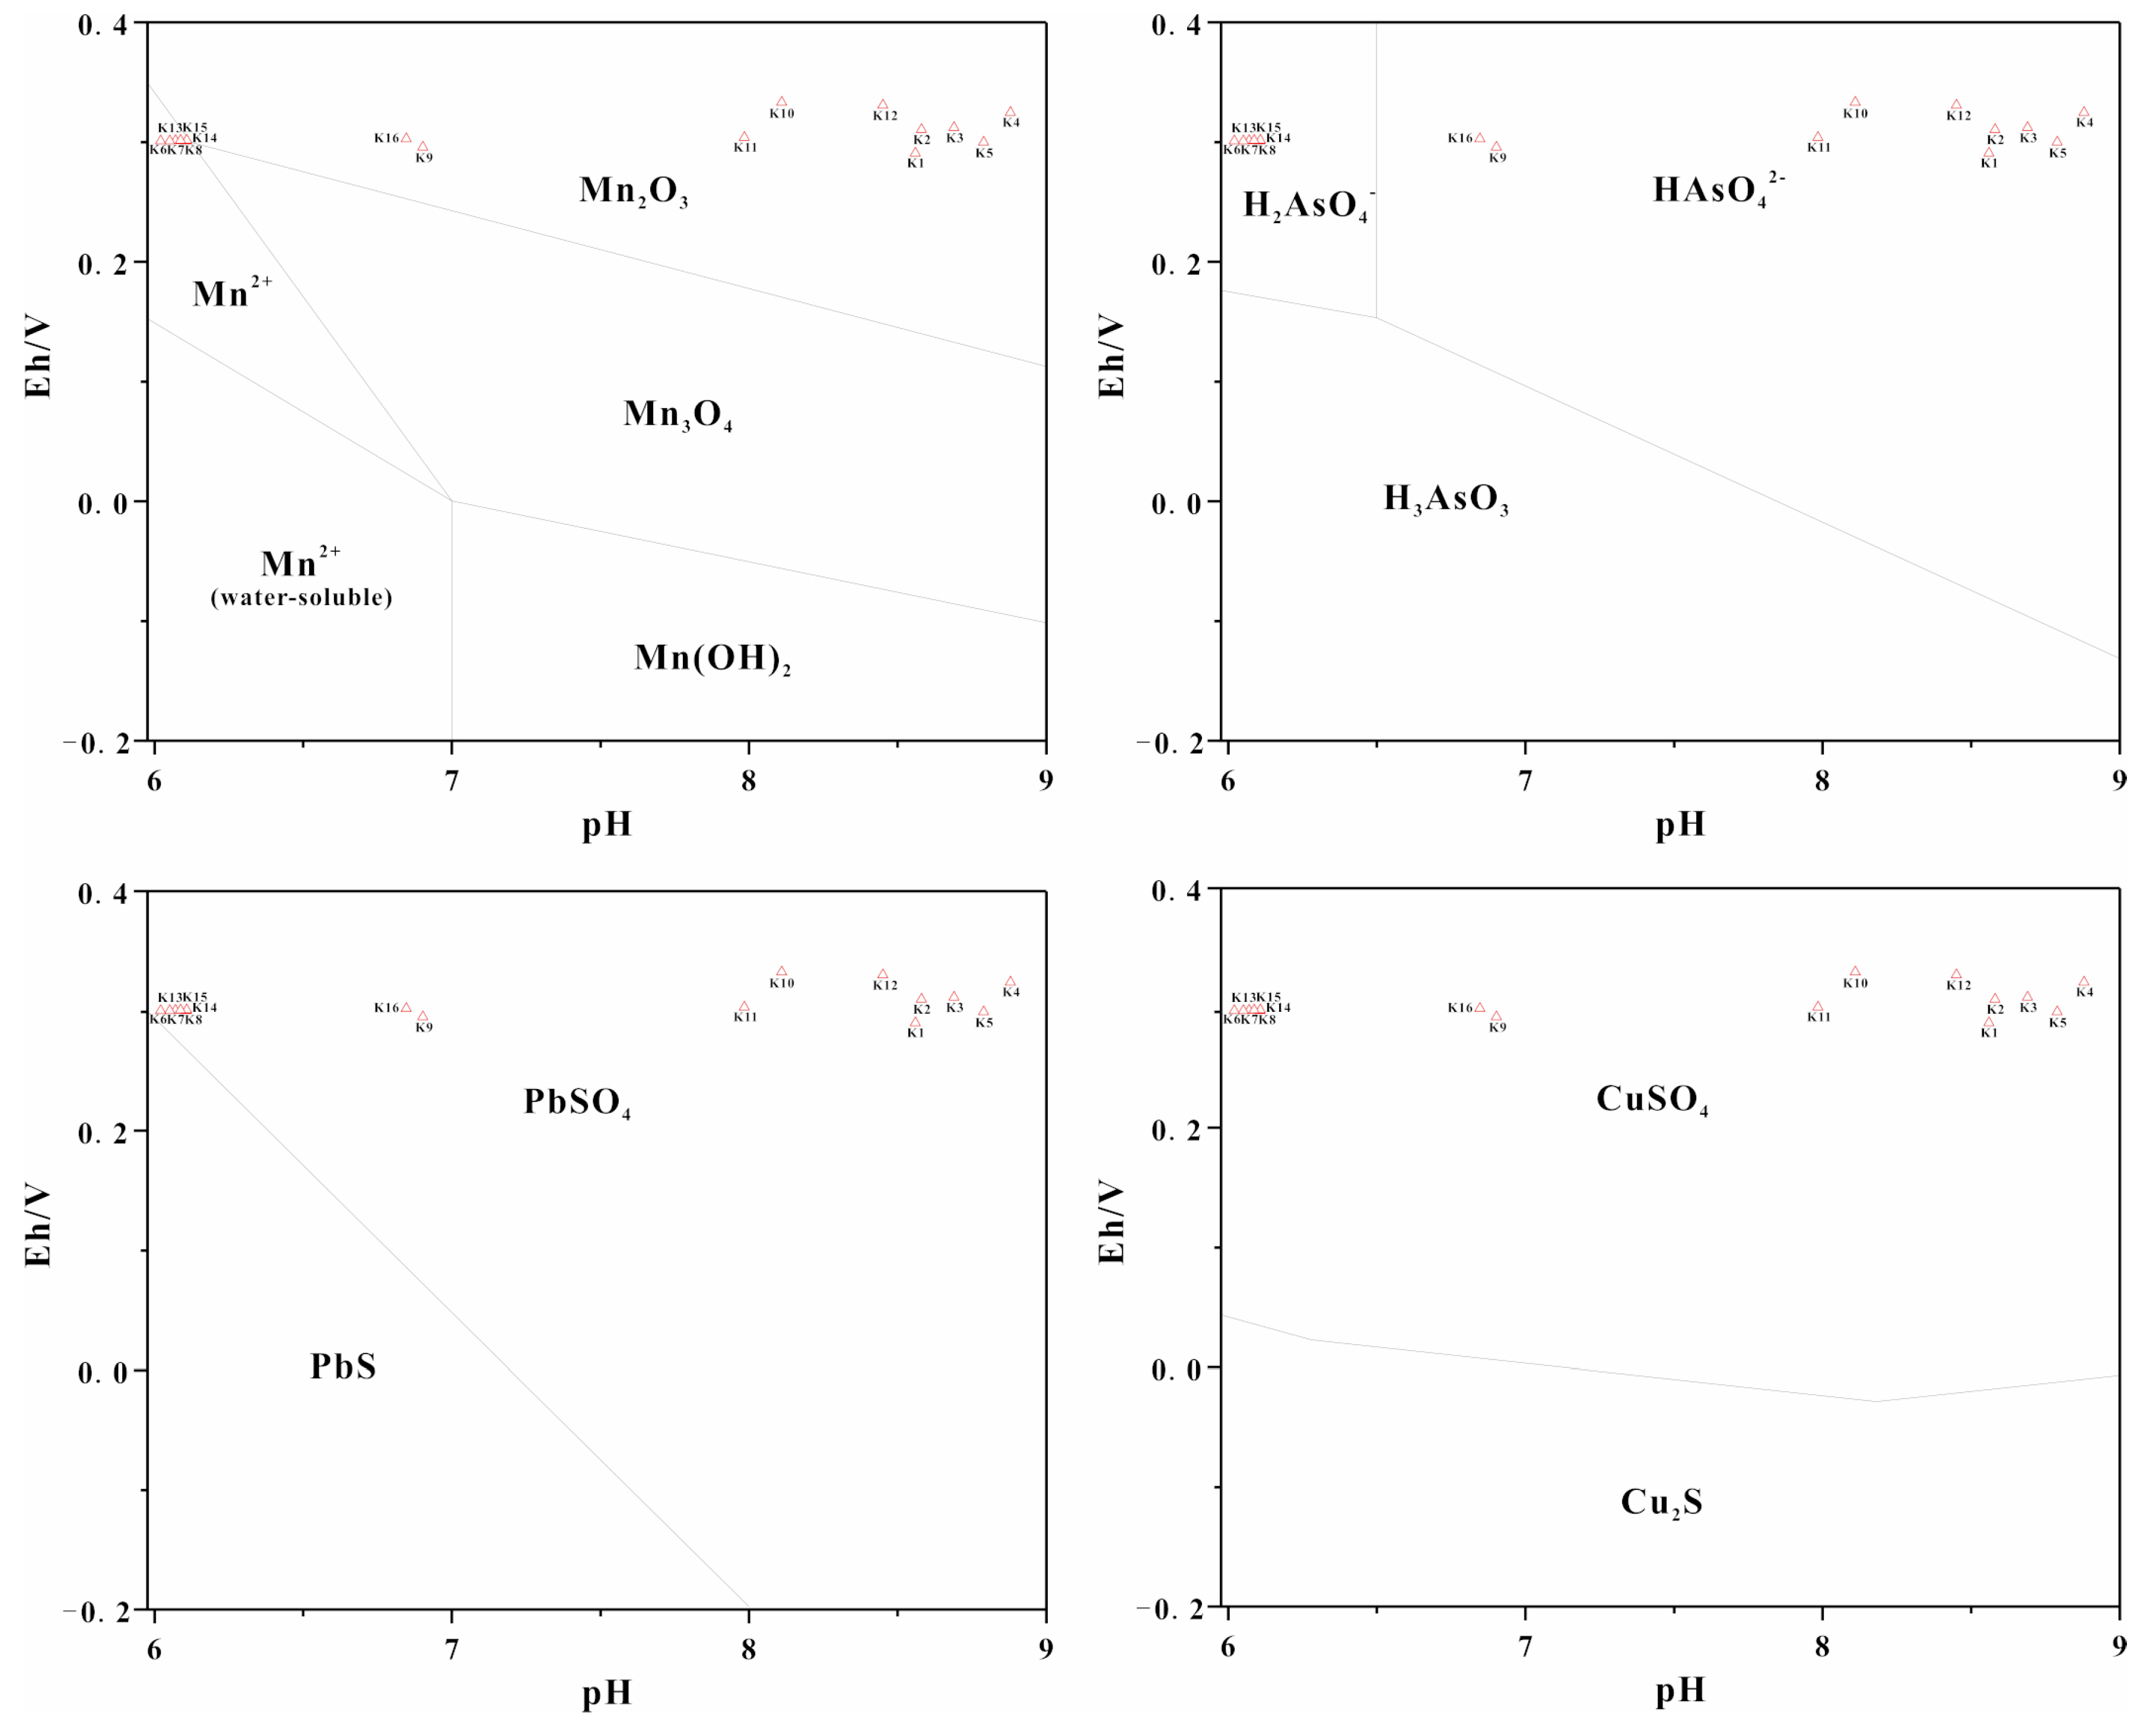
The coefficient of variation (CV) and concentration of PTEs in river water and sediments along the Danshui River are showed in Table 2 and Figure 2. The CV can intuitively show the spatial distribution characteristics of PTEs. The high variability (100% < CV) suggests that a significantly uneven spatial distribution, the medium variability (10% ≤ CV ≤ 100%) show a relatively homogeneous spatial distribution, and the low variability (CV < 10%) indicate a relatively even spatial distribution [42,43,44]. After the analysis, it was found that the concentration of Mn was 0.03~92.8 mg·L−1 and 3010~14150 mg·kg−1 in river water samples and sediments, respectively. The CV for the river water samples and sediments were 103 ± 2% and 206 ± 12%, respectively. These results indicate that the distribution of Mn in the water and sediments of the Danshui River was uneven [42,43,44]. The difference in the Mn of the river water and sediments was obvious, and was concentrated upstream and downstream relative to the mining operation with the average concentrations of 28.4 mg·L−1 and 5.9 mg·L−1 in waters. These values were 284 and 59 times higher than the GBIII levels, and 4733 and 983 times higher than the CBG levels. The average concentration of Mn in the water of the midstream was lower than the GBIII, but it was 8.3 times higher than the CBG. Mn in the sediments from upstream to downstream were 10,915 mg·kg−1, 4367 mg·kg−1 and 6380 mg·kg−1, which were 22 times, 9 times and 13 times higher than the Bi, respectively. According to literature research and field investigations, the over-standard phenomenon and spatial distribution of Mn in the study area were dominated by the combination of natural processes and anthropogenic activities. The Mn in the electrolytic manganese residue mainly existed in the form of oxides and the water environment at the sampling cross-sections with high Mn concentration in the study area (K6–K8 in upstream, K13–K15 in downstream) was mainly acidic and oxidizing conditions (295 < Eh, pH < 6.3, Table 3, Figure 3). Mn in river water existed in the valence state of Mn2+ and easily migrated in this environment, but the water environment at the other cross-sections with relatively low Mn concentration in river water (K1–K5 in the control section, K9 in lower upstream, K10–K12 in midstream, K16 in lower downstream) was mainly at moderately alkaline and oxidizing conditions (288 < Eh, 6.9 < pH, Table 3, Figure 3) where Mn existed in the form of Mn2O3, which is relatively stable [45,46,47]. In addition, based on the field investigation, PET pollutants were released mainly from upstream sources. Although a dam that sits between upstream and midstream ideally blocks the pollutants, the acid sewage from upstream was discharged to a downstream location after being utilized by the hydropower station. Thus, it is possible that the Mn from the river water samples and sediments mainly originated from the manganese mining activities. The excessive degree of Mn in the upstream and downstream of the study area was relatively high, while the midstream was lower affected and the control section formed a good contrast.
The concentrations of Pb and As in the river water were 0.002~0.1 mg·L−1 and 0.001~0.07 mg·L−1, and their CV were 35 ± 2% and 36 ± 3%, respectively. Similarly, the concentrations of Pb and As in the river sediments were 7.6~18.1 mg·kg−1 and 11.8~19.6 mg·kg−1, respectively, and their CV were 37 ± 2% and 35 ± 2%, respectively. It suggested that the distributions of Pb and As in river water and sediments were relatively uneven [42,43,44]. The concentration of Pb in the river water at the K16 location downstream (0.1 mg·L−1) was higher than the GBIII and CBG levels. As distributed similarly to Pb, but it did not exceed the GBIII in the river. This metal was also high at the K16 sampling location with a concentration of 0.07 mg·L−1, which was 14 times higher than the CBG. In addition, Pb and As in the sediments were both high at the K16 sampling location with 18.1 mg·Kg−1 and 19.6 mg·Kg−1, which was 1.2 times and 1.03 times higher than the Bi. These results suggest that As and Pb in the river water and sediments at K16 was highly affected by human activities. In addition, the water environment at the sampling cross-sections with high As and Pb concentrations in the study area (K6 in downstream) was mainly at alkaline and oxidizing conditions (288 < Eh, 8 < pH, Table 3, Figure 3). As and Pb in the river water existed in the valence state of As(V) (H2AsO4 and HAsO42−) and PbSO4 and were stable in the river water in this environment [45,46,47]. As and Pb concentrations in the other cross-sections in the river water were relatively uniform and irregular and their speciation had little influence on their spatial distribution. According to the field investigations, the K16 sampling location was near a wasteyard and it was inferred that the high concentrations of As and Pb in the river water and sediments at K16 were related to this facility. As and Pb at other sites along the river were all lower than the GBIII levels and their distributions were relatively uniform and irregular, thus they could be a result of natural origins [43].
Cu in the river water were 0.001~0.1 mg·L−1 and lower than the GBIII levels. Cu in the river sediments were 7.3 to 19.3 mg·Kg−1 and also lower than the Bi. However, the CV of Cu in river water and sediments was 36 ± 3% and 55 ± 4%, respectively, which were uneven [42,43,44]. The average concentration of Cu in the water at the K7 sampling location which was upstream was higher than the CBG levels, which was 0.1 mg·L−1. Although Cu in sediments at K7 with 19.1 mg·Kg−1 was lower than the Bi, it was higher than other sites. However, the other sampling cross-sections did not exceed the standard, and the K7 was located in the main pollution discharge area of manganese mining activities. In addition, the Cu mainly exists in the form of oxides in the karst strata, and Cu existed in the state of CuSO4 in the river water of the study area and always easily migrated in acid and oxidizing environment (295 < Eh, pH < 6.3 Table 3, Figure 3) [12,46,47]. Therefore, Cu in river water and surface sediments at K7 may be related to manganese mining activities. However, Cu in river water and sediments at the other cross-sections were relatively uniform and irregular, so it was determined that Cu at the other cross-sections also originated from nature [43].
Cd, Cr and Zn in the river water were 0.001~0.002 mg·L−1, 0.001~0.002 mg·L−1 and 0.001~0.005 mg·L−1, respectively, which were all lower than the GBIII levels. Their CV were 9 ± 1%, 10 ± 1% and 13 ± 1%, respectively. While, Cd, Cr, and Zn in the river sediments were 0.08~0.12 mg·kg−1, 17~23 mg·kg−1 and 23~25 mg·kg−1, respectively, and all were lower than the Bi. Their CV were 11 ± 1%, 13 ± 2%, and 15 ± 2%, respectively. These results indicated that Cd, Cr and Zn in the river water samples and sediments all were distributed uniformly and irregularly. In addition, since the water environment in the study area is mainly dominated by acidic and oxidizing conditions (Table 3) and the rock strata in the study area are dominated by carbonate, these conditions will actually accelerate the dissolution of carbonate and promote the release of PTEs [47,48], which is the main reason why the water environment in the study area is rich in Cd, Cr and Zn. Therefore, it infers that Cd, Cr and Zn were mainly from the natural environment [44].

3.2. Identification of Sources of PTEs

The manganese mining and wasteyard are the main reasons for the serious PET pollution of river water and sediments in the research area. To further prove these observations, correlation matrix and multivariate statistical analyses were carried out. The Pearson’s correlation matrix and principal component analysis of PTEs in the water and sediments in the study area are shown in Table 4 and Table 5 and Figure 4.
In river water, the correlations among Cd, Cr and Zn were both significant (0.99 ≤ r ≤ 1, p < 0.01), indicating that these metals might originate from common sources [49]. Likewise, As and Pb showed significantly positive correlations (r = 0.99, p < 0.01) and weaker correlation with the elements of the first group (0.56 ≤ r ≤ 0.69, p < 0.05). At 0.05 significance level, the correlation coefficients of Cu with As, Cd, Cr, Pb, and Zn were 0.59, 0.64, 0.67, 0.61 and 0.69, respectively, and similar correlations also existed between Cu and Mn. These trends suggest that the Cu had many potential sources. In addition, three principal components (PCs) were obtained that explain 78.79% of the variation in the river water. PC1 was dominated by Cd, Cr, and Zn, accounting for 46.30% of the total variance. Cd was widely scattered in the lithosphere in the Karst area, and these three PTEs were at relatively low concentrations and low CV values. This trend indicates these elements mainly originated from nature [49]. Cu had a lower factor loading (0.57) than those of the other PTEs in PC1, whereas it had a higher factor loading of 0.75 in PC2. Similarly, As and Pb had relatively lower factor loadings of 0.47 and 0.48 in PC1, but they also had higher factor loadings in PC3. These showed that the three PTEs all had many sources [50]. PC2 explained 16.78% of the total variance and was dominated by Mn (0.98) and Cu (0.75). Generally, Mn is a common element in the lithosphere with a relatively high abundance and its concentration is not easily affected by artificial factors [9,50]. Despite being a common element in the lithosphere, the concentration and CV value of Mn is abnormally high in the study area, suggesting it mainly originated from the mining of manganese. Cu had a high concentration in K7 and a high CV value in the study area, but its concentrations were homogeneous in other sampling cross-sections. Cu was also always considered to be associated with Mn [22]. Therefore, Cu originated from both nature and manganese mining [51]. PC3 explained 15.71% of the total variance and was characterized with higher factor loadings of As (0.79) and Pb (0.83). These two PTEs both had a higher concentration in K16 and homogeneous concentration in other sampling cross-sections and they were typical Anthropogenic pollutants, suggesting they originated from both nature and the wasteyard [48,51].
In the case of river sediments, similar results were obtained. Cd, Cr and Zn showed strong positive correlation factors (0.98 ≤ r ≤ 0.99, p < 0.01), reinforcing the idea of a similar origin [51,52]. As and Pb showed similar significant positive correlations (r = 0.99, p < 0.01) and weaker correlation with the elements of Cd, Cr and Zn (0.63 ≤ r ≤ 0.67, p < 0.05). Cu also had some correlations with As, Cd, Cr, Pb, Zn and Mn (0.58 ≤ r ≤ 0.68, p < 0.05), indicating it had various sources in line with the river water. Similarly, three PCs were also obtained, explaining 83.23% of the variation in the river sediments. PC1 accounted for 48.89% of the variance and exhibited the higher loadings of Cd (0.97), Cr (0.99), Zn (0.95), as well as a moderate loading of As (0.48), Cu (0.53), Pb (0.50). PC2 and PC3 explained 17.67% and 16.67% of the total variance, respectively, and were dominated by Mn (0.945), Cu (0.71) and As (0.71), Pb (0.79). The results of the principal component analysis in the river sediments were consistent with those in the water samples in the study area, indicating that the sources of the river sediments were consistent with each other.
In order to validate the above analysis, the Pearson correlation coefficients between PET contents in the river water samples and sediments for those sampling cross-sections were showed in Figure 5. All of the sampling cross-sections exhibited a high relationship (r ≥ 0.99) between the PET concentration in both environmental compartments, indicating that they had common sources [12]. These are consistent with the above analysis, which further validates the accuracy of source analysis of PTEs in the river water and sediments.

3.3. Pollution Assessment of PTEs

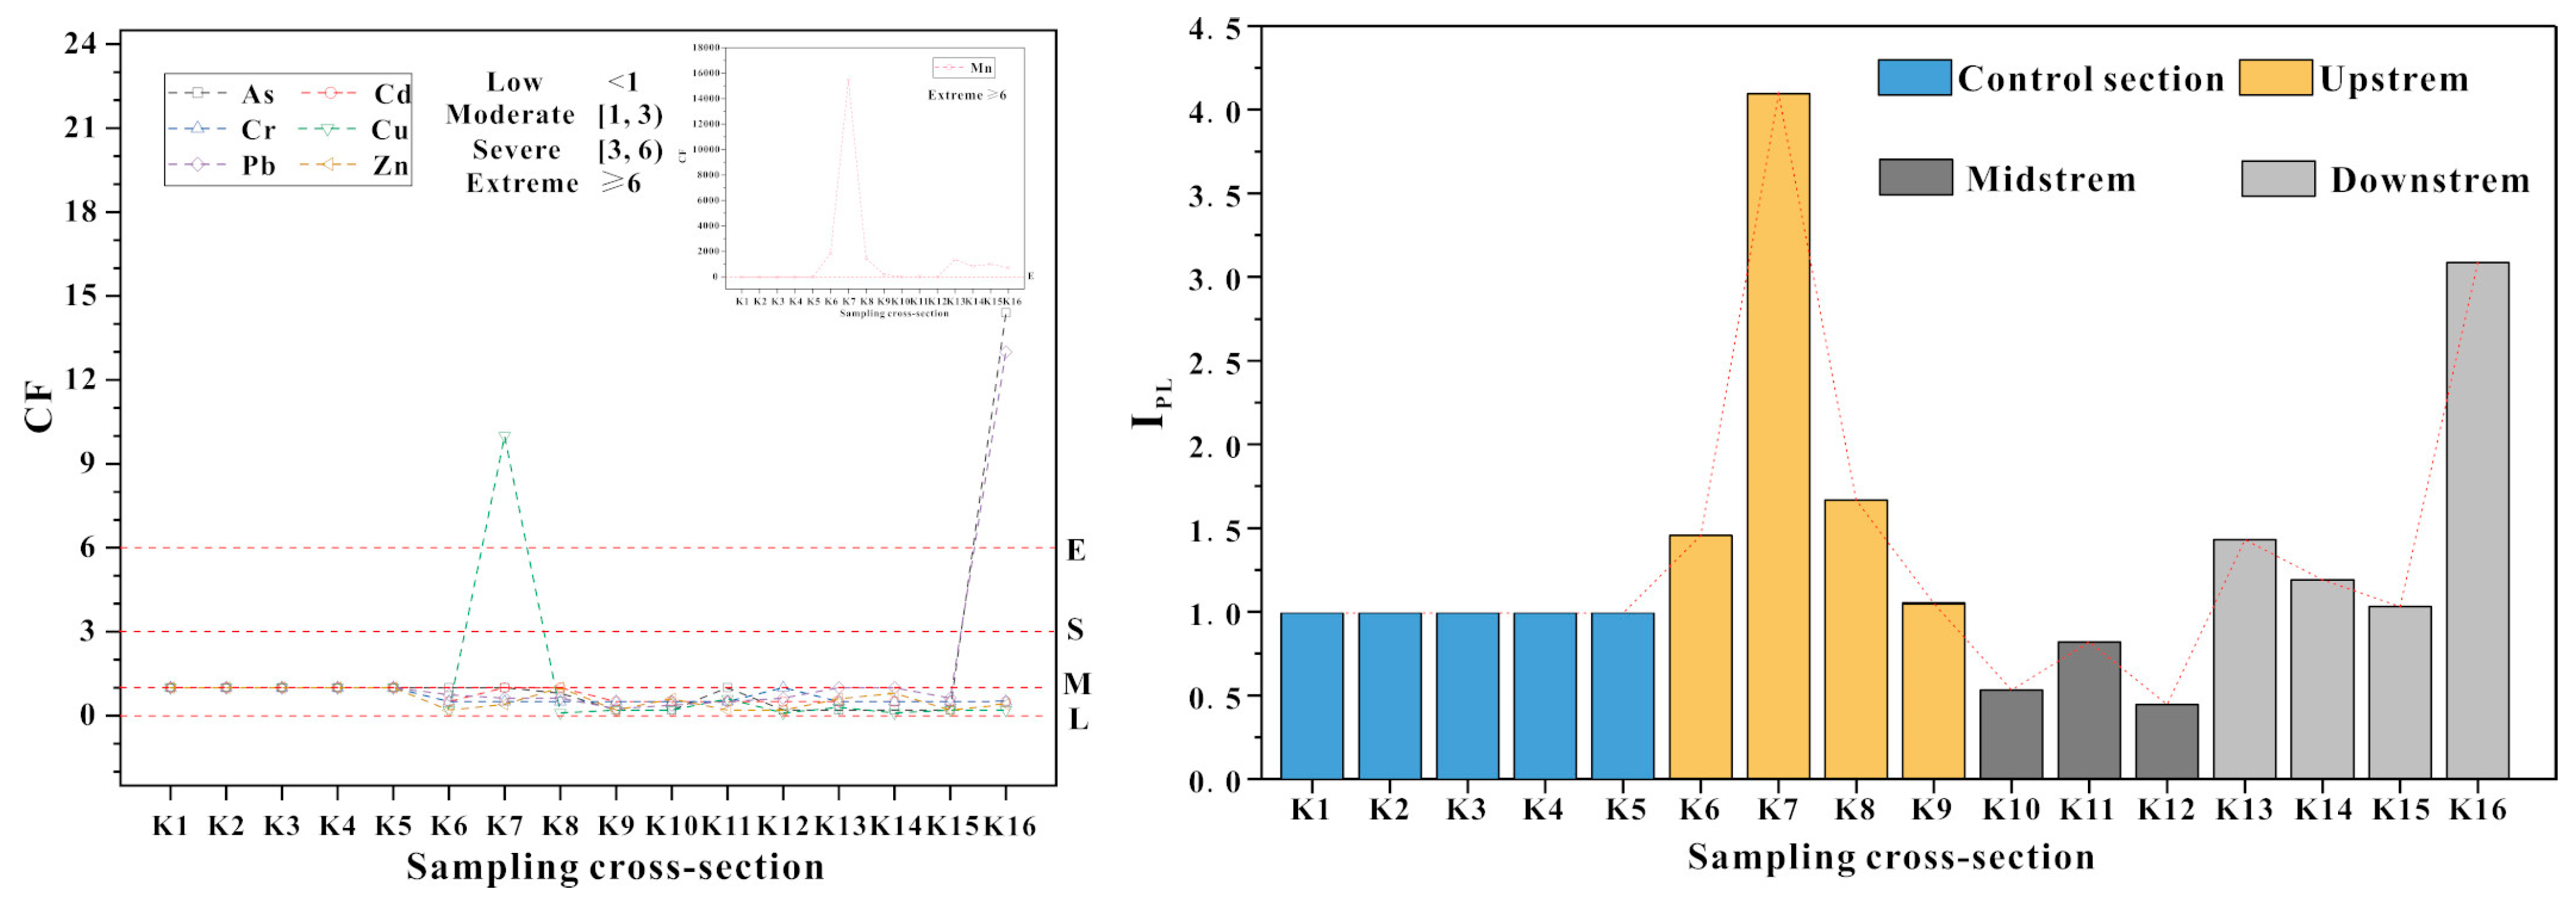
According to the contamination factor (CF) for the PTEs (As, Cd, Cr, Cu, Mn, Pb and Zn) in river water (Figure 6), Cu represented an extreme level at K7 in upstream, and As and Pb represented extreme level at K16 in downstream. Cu, As and Pb were low at other sites, while Mn showed extreme contamination at all the sites in the river. All sampling sections in the control area were at the critical contamination (CF = 1), which belonged to the low moderate contamination and they had a good contrast with the downstream.
Additionally, to further reflect the integrated influence of the PTEs in the river water of the study area, the IPL of these seven PTEs are discussed (Figure 6). Results indicated that upstream and downstream were the main polluted sections of the Danshui River, which represented progressive contamination (IPL > 1). Especially at K7 of upstream and K16 of downstream, it showed high IPL values with 4 and 3. All sampling sites from midstream presented a level of non-pollution (IPL < 1). The same as the CF, all sampling sections in the control section were also at the critical contamination (IPL = 1), which belonged to the baseline pollution level, and they also had a good contrast with the downstream.
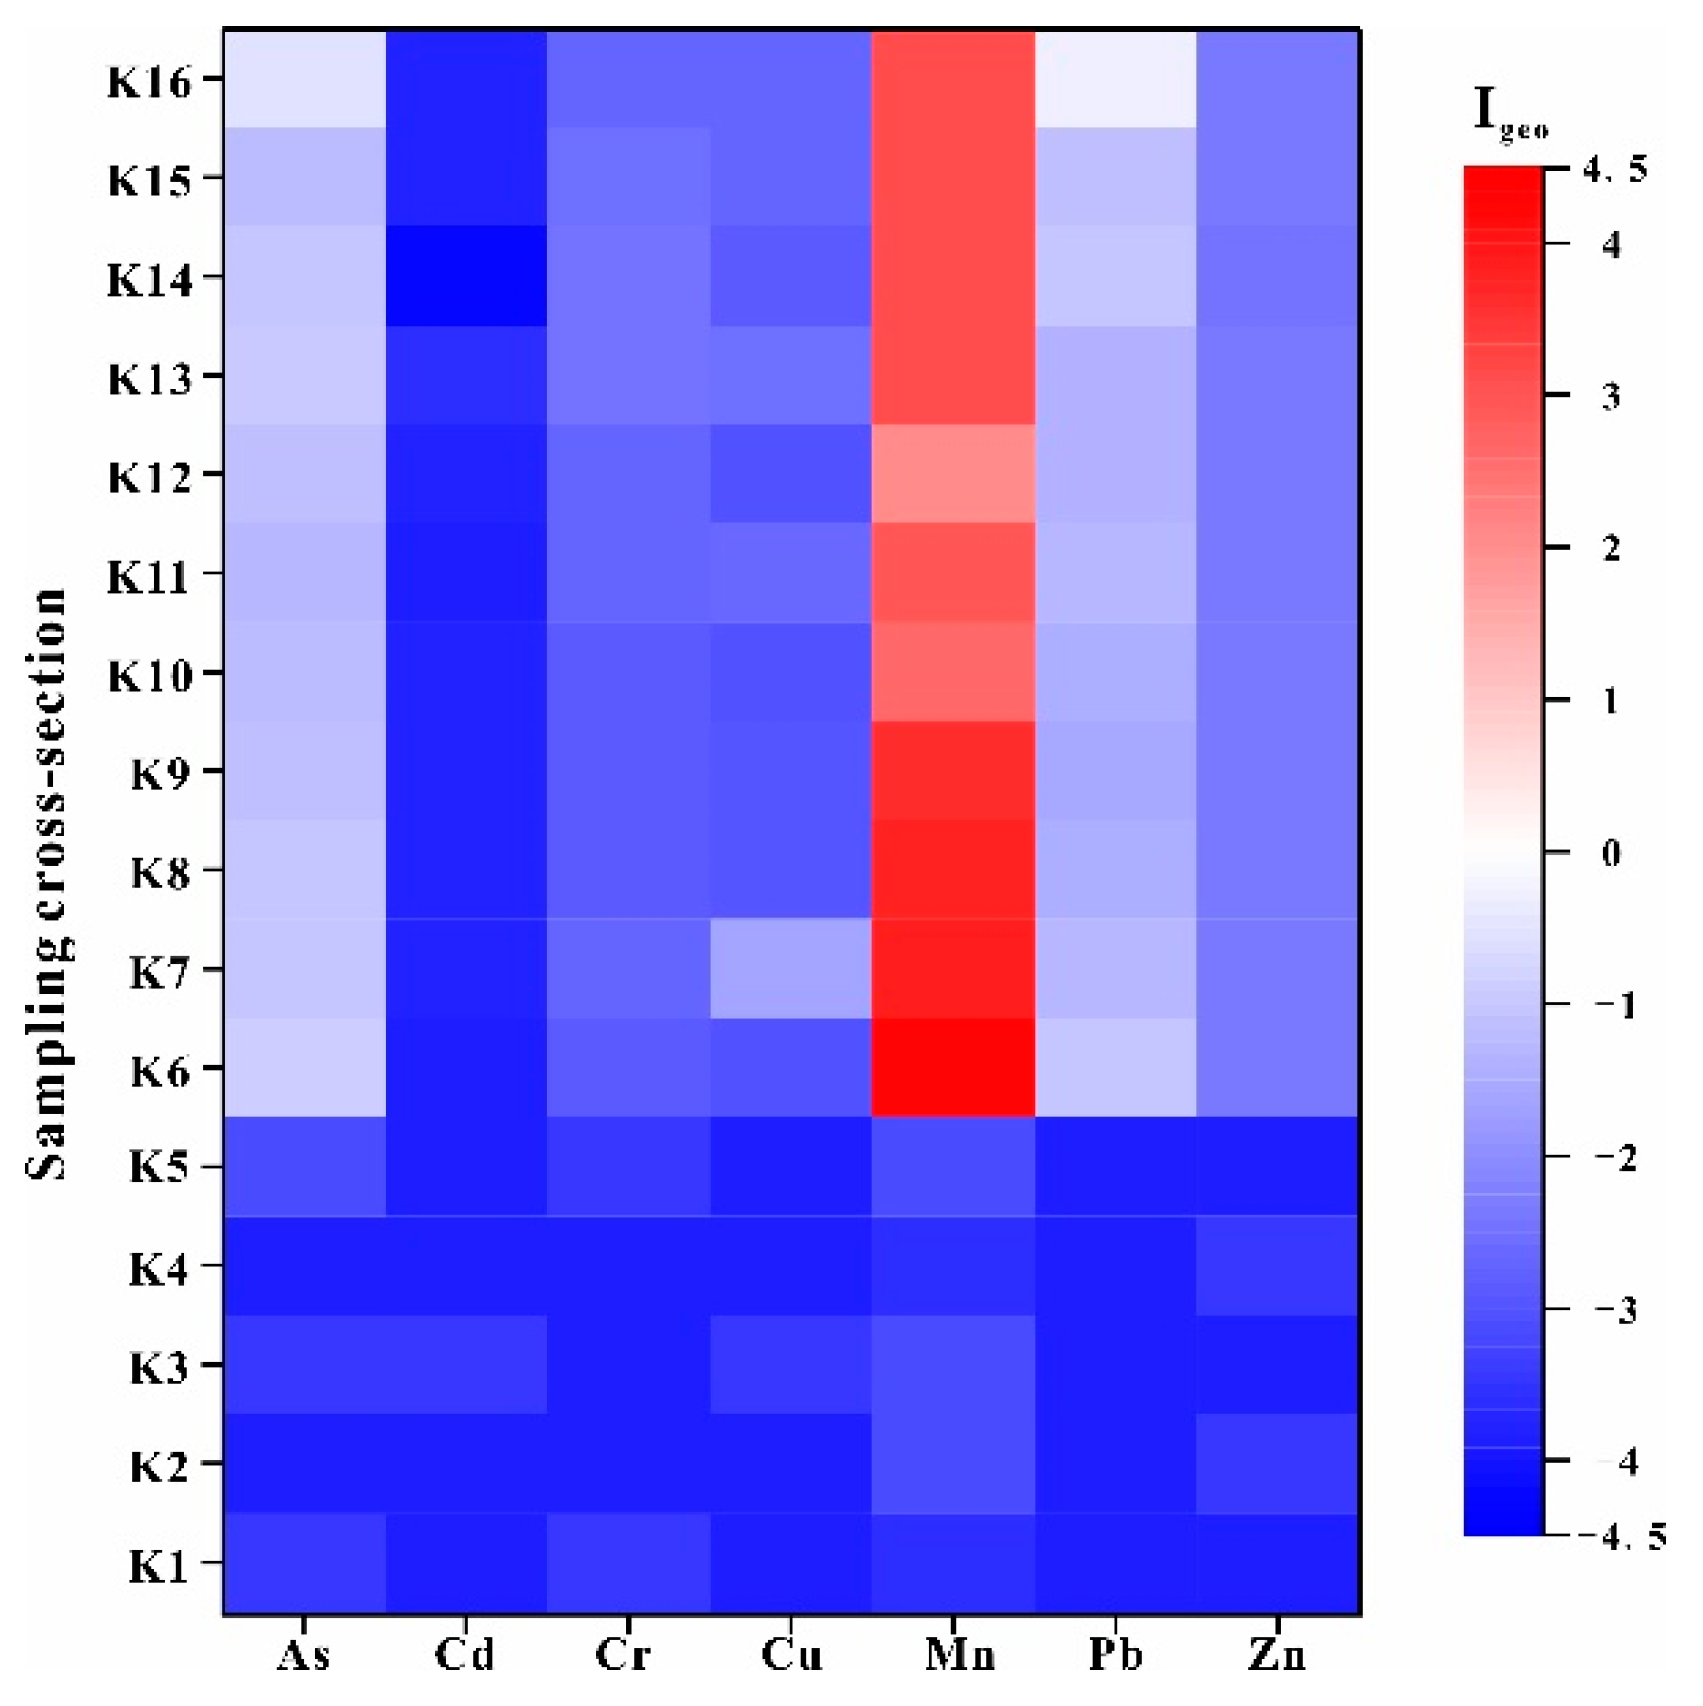
According to the Geo-accumulation Index (Igeo) for the river sediments (Figure 7), only the Mn in the river sediments represented contamination (2 ≤ Igeo < 5), and the upstream and downstream are the main contaminated sections, which are heavily contaminated (3 ≤ Igeo < 4) and heavily to extremely contaminated (3 ≤ Igeo < 5), respectively. However, Mn in the river sediments in the midstream represented a moderate to heavy contamination (2 ≤ Igeo < 3), which suggested lower contamination. This was mainly due to the block by the dam at down part of upstream. Meanwhile, at other sites, there was lower contamination (Igeo < 0).
In order to determine the comprehensive influence from all PTEs, the IPER was applied to evaluate the ecological risk from PTEs in river sediments (Table 6). Similar to the results of Igeo, Mn upstream and downstream showed a level of moderate ecological risk and Mn was mainly related to the high concentration caused by manganese mining activities. The average ecological risk factors for the other PTEs were generally at low levels, which means the ecological risk in river sediments at acceptable levels.
According to these various indices (CF, IPL, Igeo and IPER), the main polluted sections by PTEs were upstream and downstream. PET pollutants were released from upstream and the sewage from upstream is discharged in the upper part of downstream after being utilized for hydropower. Ideally, these pollutants could be blocked by the dam at the lower part upstream. Mn was the main polluted PET. As and Pb in river water were at a relatively low pollution level downstream, and Cu was low upstream. The pollution levels of PTEs from river sediments were lower than in river water due to the PET pollutants are discharged mainly in the form of sewage, and the PET pollutants in river water are likely to precipitate into river sediments when the water environment changes. Therefore, the emission of sewage is the main pollution source of the study area and water conservancy facilities were the key impacts to the pollution distribution of PTEs. Therefore, the control of sewage emission should be strengthened and the water conservancy facilities should be utilized later on for additional pollution control. These are of great significance to the continued pollution control of the river in the mining areas.

4. Conclusions

In the study, the source, pollution distribution and potential ecological risk of PTEs (As, Cd, Cr, Cu, Mn, Pb and Zn) in the river water samples and sediments of the Gucheng manganese mining area were analyzed. This study provides a valuable reference for other mining areas that have similar river water and sediments pollution levels and can assist with the control and remediation of PET pollution. The conclusions based on this study are as follows:
(1)
PET pollution from manganese mining in the Danshui River was analyzed and it was determined that the main pollutant was Mn, which exhibited concentrations higher than the GBIII and CBG levels. The river water environment was mainly acidic and oxidizing and only the spatial distribution of Mn was greatly affected by the water environment. The pollution distribution of Mn was dominated by natural processes and anthropogenic activities. Upstream and downstream of the river were the main polluted areas, while midstream was lower. The water environment in the study area had a significant influence on the state of Mn as well as its pollution distribution. In addition, the concentration of As and Pb in the river water and sediments were high at K16, and Cu was high at K7. All of these locations were located upstream and downstream of the river.
(2)
Manganese mining activities were the main source of pollution. A wasteyard located along the river was also identified as a source of pollution. According to Pearson’s correlation and PCA, it showed that three groups of PTEs, Cd, Cr and Zn, mainly originated from nature and Pb and As were mainly related to the wasteyard. Mn mainly originated from manganese mining activities, and Cu was from both manganese mining activities and the wasteyard.
(3)
According to the CF and IPL, As and Pb were low in river water from downstream, and Cu in river water was higher upstream. Mn was considered as the main pollutant of the river water in the whole river. Upstream and downstream were the main polluted sections of river water. Based on the results of Igeo and IPER, river sediments were heavily polluted by Mn and the other PTEs were at normal levels in this area. The IPER of PTEs in the river sediments were mostly at a low-risk level, only Mn in the upstream showed a moderate ecological risk, downstream showed low ecological risk and higher risk than midstream. Therefore, Mn was the main pollutant in the upstream and downstream polluted sections of the river.
(4)
According to the pollution distribution of PTEs, element speciation, the discharge of pollutants and water conservancy facilities were the key impacts observed and should be considered for the pollution treatment and environmental protection in this study area.

Author Contributions

Conceptualization, Z.L.; Methodology, Z.L.; Software, W.C., S.L. and Y.K.; Validation, H.Z.; Formal Analysis, Z.L. and H.Z.; Investigation, Z.L., Q.C. and Q.F.; Resources, H.Z.; Data Curation, H.Z., Z.L., Z.Y. and L.C.; Writing—Original Draft Preparation, Z.L. and Y.K.; Writing—Review and Editing, H.Z. and Z.L.; Visualization, Z.L. All authors have read and agreed to the published version of the manuscript.

Funding

This work was supported by funds of China Geological Survey (DD20190824).

Institutional Review Board Statement

Not applicable.

Informed Consent Statement

Not applicable.

Data Availability Statement

All relevant data sets in this study are described in the manuscript.

Conflicts of Interest

The authors declare that they have no conflict of interest.

References

  1. Azhari, A.E.; Rhoujjati, A.; Hachimi, M.L.E.; Ambrosi, J.P. Pollution and ecological risk assessment of heavy metals in the soil-plant system and the sediment-water column around a former Pb/Zn-mining area in NE Morocco. Ecotoxicol. Environ. Saf. 2017, 144, 464–474. [Google Scholar] [CrossRef] [PubMed]
  2. Liu, Q.Q.; Sheng, Y.Q.; Jiang, M. Heavy metal pollution in a reforested mangrove ecosystem (Can Gio Biosphere Reserve, Southern Vietnam): Effects of natural and anthropogenic stressors over a thirty-year history. Chemosphere 2020, 245, 125596. [Google Scholar] [CrossRef]
  3. Pourret, O.; Hursthouse, A. It’s Time to Replace the Term “Heavy Metals” with “Potentially Toxic Elements” When Reporting Environmental Research. Int. J. Environ. Res. Public Health 2019, 16, 4446. [Google Scholar] [CrossRef] [PubMed] [Green Version]
  4. Xiao, R.; Guo, D.; Ali, A. Accumulation, ecological-health risks assessment, and source apportionment of heavy metals in paddy soils: A case study in Hanzhong, Shaanxi, China. Environ. Pollut. 2019, 248, 349–357. [Google Scholar] [CrossRef]
  5. Wu, W.; Wu, P.; Yang, F. Assessment of heavy metal pollution and human health risks in urban soils around an electronics manufacturing facility. Sci. Total Environ. 2018, 630, 53–61. [Google Scholar] [CrossRef] [PubMed]
  6. Rajkumar, H.; Naik, P.K.; Rishi, M.S. A new indexing approach for evaluating heavy metal contamination in groundwater. Chemosphere 2020, 245, 125598. [Google Scholar] [CrossRef]
  7. Adimalla, N.; Li, P.Y.; Qian, H. Evaluation of groundwater contamination for fluoride and nitrate in semi-arid region of Nirmal Province, South India: A special emphasis on human health risk assessment (HHRA). Hum. Ecol. Risk Assess. 2019, 25, 1107–1124. [Google Scholar] [CrossRef]
  8. Chibuike, G.U.; Obiora, S.C. Heavy metal polluted soils: Effect on plants and bioremediation methods. Appl. Environ. Soil Sci. 2014, 25, 243–254. [Google Scholar] [CrossRef] [Green Version]
  9. Sun, Z.H.; Xie, X.D.; Wang, P. Heavy metal pollution caused by small-scale metal ore mining activities: A case study from a polymetallic mine in South China. Sci. Total Environ. 2018, 639, 217–227. [Google Scholar] [CrossRef]
  10. Lin, Y.; Ma, J.; Zhang, Z. Linkage between human population and trace elements in soils of the Pearl River Delta: Implications for source identification and risk assessment. Sci. Total Environ. 2018, 610–611, 944–950. [Google Scholar] [CrossRef]
  11. Kumar, A.R.; Riyazuddin, P. Seasonal variation of redox species and redox potentials in shallow groundwater: A comparison of measured and calculated redox potentials. J. Hydrol. 2012, 444, 187–198. [Google Scholar] [CrossRef]
  12. Mcgrath, S.P.; Lane, P.W. An explanation for the apparent losses of metals in a long-term field experiment with sewage sludge. Environ. Pollut. 1989, 60, 235–256. [Google Scholar] [CrossRef]
  13. Paraguassú, L.; Leite, M.G.P.; Moreira, F.W.A.; Mendonça, F.P.C.; Eskinazi-Sant’Anna, E.M. Impacts of mining in artificial lake of Iron Quadrangle-MG: Past marks and changes of the present. Environ. Earth Sci. 2019, 167, 1–10. [Google Scholar] [CrossRef]
  14. Barbieri, M.; Sappa, G.; Nigro, A. Soil pollution: Anthropogenic versus geogenic contributions over large areas of the Lazio region. J. Geochem. Explor. 2018, 195, 78–86. [Google Scholar] [CrossRef]
  15. Li, R.; Tang, X.Q.; Guo, W.J. Spatiotemporal distribution dynamics of heavy metals in water, sediment, and zoobenthos in mainstream sections of the middle and lower Changjiang River. Sci. Total Environ. 2020, 714, 136779. [Google Scholar] [CrossRef]
  16. Zeng, Y.S.; Bi, C.J.; Jia, J.P. Impact of intensive land use on heavy metal concentrations and ecological risks in an urbanized river network of Shanghai. Ecol. Indic. 2020, 16, 106501. [Google Scholar] [CrossRef]
  17. Sun, X.S.; Fan, D.J.; Liu, M. Source identification, geochemical normalization and influence factors of heavy metals in Yangtze River Estuary sediment. Environ. Pollut. 2018, 241, 938–949. [Google Scholar] [CrossRef] [PubMed]
  18. Liu, Z.; Zhou, H.; Chen, L. Spatial distribution characteristics and pollution assessment of heavy metals in river surface sediments in a manganese mining area, Western Hubei. Saf. Environ. Eng. 2020, 27, 110–117. [Google Scholar]
  19. Liu, Z.; Zhou, H.; Cao, W.J. Seasonal Distribution Characteristics and Health Risk Assessment of Heavy Metals in Surface Water of Qingjiang River. Environ. Sci. 2021, 42, 175–183. [Google Scholar]
  20. Kimleang, K.; Asumi, S.; Shingo, T. Long-term acid generation and heavy metal leaching from the tailings of Shimokawa mine, Hokkaido, Japan: Column study under natural condition. J. Geochem. Explor. 2019, 201, 1–12. [Google Scholar]
  21. Bi, B.; Liu, X.H.; Guo, X.C. Occurrence and risk assessment of heavy metals in water, sediment, and fish from Dongting Lake, China. Environ. Sci. Pollut. Res. 2018, 34, 34076–34090. [Google Scholar] [CrossRef] [PubMed]
  22. Luo, X.; Ren, B.Z.; Hursthouse, A.S. Soil from an Abandoned Manganese Mining Area (Hunan, China): Significance of Health Risk from Potentially Toxic Element Pollution and Its Spatial Context. Int. J. Environ. Res. Public Health 2020, 18, 6554. [Google Scholar] [CrossRef]
  23. Jiang, F.; Ren, B.Z.; Hursthouse, A.S. Trace Metal Pollution in Topsoil Surrounding the Xiangtan Manganese Mine Area (South-Central China): Source Identification, Spatial Distribution and Assessment of Potential Ecological Risks. Int. J. Environ. Res. Public Health 2018, 15, 2412. [Google Scholar] [CrossRef] [PubMed] [Green Version]
  24. Acosta, J.A.; Gabarrón, M.; Faz, A. Influence of population density on the concentration and speciation of metals in the soil and street dust from urban areas. Chemosphere 2015, 134, 328–337. [Google Scholar] [CrossRef]
  25. Mico, C.; Recatalá, L.; Peris, M. Assessing heavy metal sources in agricultural soils of an European Mediterranean area by multivariate analysis. Chemosphere 2006, 65, 863–872. [Google Scholar] [CrossRef] [PubMed]
  26. Chinese State Environmental Protection Administration. Environmental Quality Standards for Surface Water (GB3838-2002); Chinese State Environmental Protection Administration: Beijing, China, 2002.
  27. Chinese State Environmental Protection Administration. Technical Specifications Requirements for Monitoring of Surface Water and Waste Water (HJ/T 91-2002); Chinese State Environmental Protection Administration: Beijing, China, 2002.
  28. Chinese Ministry of Land and Resources. Specification of Geochemical Reconnaissance Survey (1:50000) (DZ/T0011-2015); Chinese Ministry of Land and Resources: Beijing, China, 2015. [Google Scholar]
  29. Shen, F.; Mao, L.; Sun, R. Contamination evaluation and source identification of heavy metals in the sediments from the Lishui River Watershed, Southern China. Int. J. Environ. Res. Public Health 2019, 16, 336. [Google Scholar] [CrossRef] [Green Version]
  30. Usman, Q.A.; Muhammad, S.; Ali, W. Spatial distribution and provenance of heavy metal contamination in the sediments of the Indus River and its tributaries, North Pakistan: Evaluation of pollution and potential risks. Environ. Technol. Innov. 2020, 28, 101184. [Google Scholar] [CrossRef]
  31. Liu, X.; Li, D.; Song, G. Assessment of heavy metal levels in surface sediments of estuaries and adjacent coastal areas in China. Front. Earth Sci. 2017, 11, 85–94. [Google Scholar] [CrossRef]
  32. Jorfi, S.; Maleki, R.; Jaafarzadeh, N. Pollution load index for heavy metals in Mian-Ab plain soil, Khuzestan, Iran. Data Brief. 2017, 15, 584–590. [Google Scholar] [CrossRef]
  33. Hasan, A.B.; Kabir, S.A.; Reza, H.M.S. Enrichment factor and geo-accumulation index of trace metals in sediments of the ship breaking area of Sitakund Upazilla (Bhatiary–Kumira), Chittagong, Bangladesh. J. Geochem. Explor. 2013, 125, 130–137. [Google Scholar]
  34. Usese, A.; Chukwu, O.L.; Rahamn, M.M. Enrichment, contamination and geo-accumulation factors for assessing arsenic contamination in sediment of a Tropical Open Lagoon, Southwest Nigeria. Environ. Technol. Innov. 2017, 8, 126–131. [Google Scholar] [CrossRef]
  35. Han, X.F.; Lu, X.W.; Qinggeletu; Wu, Y.F. Health risks and contamination levels of heavy metals in dusts from parks and squares of an industrial city in semi-arid area of China. Int. J. Environ. Res. Public Health 2017, 8, 886. [Google Scholar] [CrossRef] [Green Version]
  36. Maanan, M.; Saddik, M.; Maanan, M.; Chaibi, M.; Assobhei, O.; Zourarah, B. Environmental and ecological risk assessment of heavy metals in sediments of Nador lagoon, Morocco. Ecol. Indic. 2015, 48, 616–626. [Google Scholar] [CrossRef]
  37. Wang, Y.; Yang, L.; Kong, L.; Liu, E.; Wang, L.; Zhu, J. Spatial distribution, ecological risk assessment and source identification for heavy metals in surface sediments from Dongping lake, Shandong, East China. Catena 2015, 125, 200–205. [Google Scholar] [CrossRef]
  38. Buchanan, R.L.; Gorris, L.G.M.; Hayman, M. A review of Listeria monocytogenes: An update on outbreaks, virulence, dose-response, ecology, and risk assessments. Food Control 2015, 75, 1–13. [Google Scholar] [CrossRef]
  39. Semenzin, E.; Critto, A.; Rutgers, M. Integration of bioavailability, ecology and ecotoxicology by three lines of evidence into ecological risk indexes for contaminated soil assessment. Sci. Total Environ. 2008, 389, 71–86. [Google Scholar] [CrossRef] [PubMed]
  40. Ullah, R.; Muhammad, S.; Jadoon, I.A.K. Potentially harmful elements contamination in water and sediment: Evaluation for risk assessment and provenance in the northern Sulaiman fold belt, Baluchistan, Pakistan. Microchem. J. 2019, 147, 1155–1162. [Google Scholar] [CrossRef]
  41. Chen, Y.X.; Jiang, X.S.; Wang, Y. Spatial characteristics of heavy metal pollution and the potential ecological risk of a typical mining area: A case study in China. Process Saf. Environ. Prot. 2018, 113, 204–219. [Google Scholar] [CrossRef]
  42. Zhao, K.; Liu, X.; Xu, J.; Selim, H.M. Heavy metal contaminations in a soil-rice system: Identification of spatial dependence in relation to soil properties of paddy fields. J. Hazard. Mater. 2010, 181, 778–787. [Google Scholar]
  43. Li, X.; Yang, H.; Zhang, C.; Zeng, G.; Liu, Y.; Xu, W.; Wu, Y.; Lan, S. Spatial distribution and transport characteristics of heavy metals around an antimony mine area in central China. Chemosphere 2017, 170, 17–24. [Google Scholar] [CrossRef] [PubMed]
  44. Wu, W.H.; Qu, S.Y.; Nel, W. The impact of natural weathering and mining on heavy metal accumulation in the karst areas of the Pearl River Basin, China. Sci. Total Environ. 2020, 734, 139480. [Google Scholar] [CrossRef]
  45. Sappa, G.; Barbieri, M.; Andrei, M.; Ferranti, F. Assessment of arsenic mobility in a shallow aquifer from Bevera Valley Basin (Northern Italy). Arab. J. Geosci. 2019, 12, 678. [Google Scholar] [CrossRef]
  46. Barbieri, M.; Sappa, G.; Vitale, S.; Parisse, B.; Battistel, M. Soil control of trace metals concetrations in landfill: A case study of the largest landfill in Europe, Malagrotta, Rome. J. Geochem. Explor. 2014, 143, 146–154. [Google Scholar] [CrossRef]
  47. Barbieri, M.; Nigro, A.; Sappa, G. Soil contamination evaluation by Enrichment Factor (EF) and Geoaccumulation Index (Igeo). Senses Sci. 2015, 2, 94–97. [Google Scholar]
  48. Husson, O. Redox potential (Eh) and pH as drivers of soil/plant/microorganism systems: A transdisciplinary overview pointing to integrative. Plant Soil 2013, 362, 389–417. [Google Scholar] [CrossRef] [Green Version]
  49. Xu, X.; Zhao, Y.; Zhao, X.; Wang, Y.; Deng, W. Sources of heavy metal pollution in agricultural soils of a rapidly industrializing area in the Yangtze Delta of China. Ecotoxicol. Environ. Saf. 2014, 108, 161–167. [Google Scholar] [CrossRef]
  50. Delplace, G.; Schreck, E.; Pokrovsky, O.S. Accumulation of heavy metals in phytoliths from reeds growing on mining environments in Southern Europe. Sci. Total Environ. 2020, 712, 135595. [Google Scholar] [CrossRef]
  51. Petrovic, J.V.; Alagic, S.C.; Milic, S.M. Chemometric characterization of heavy metals in soils and shoots of the two pioneer species sampled near the polluted water bodies in the close vicinity of the copper mining and metallurgical complex in Bor (Serbia): Phytoextraction and biomonitoring contexts. Chemosphere 2021, 262, 127808. [Google Scholar]
  52. Qu, S.Y.; Wu, W.H.; Nel, W.; Ji, J.F. The behavior of metals/metalloids during natural weathering: A systematic study of the mono-lithological watersheds in the upper Pearl River Basin, China. Sci. Total Environ. 2020, 708, 134572. [Google Scholar] [CrossRef] [PubMed]
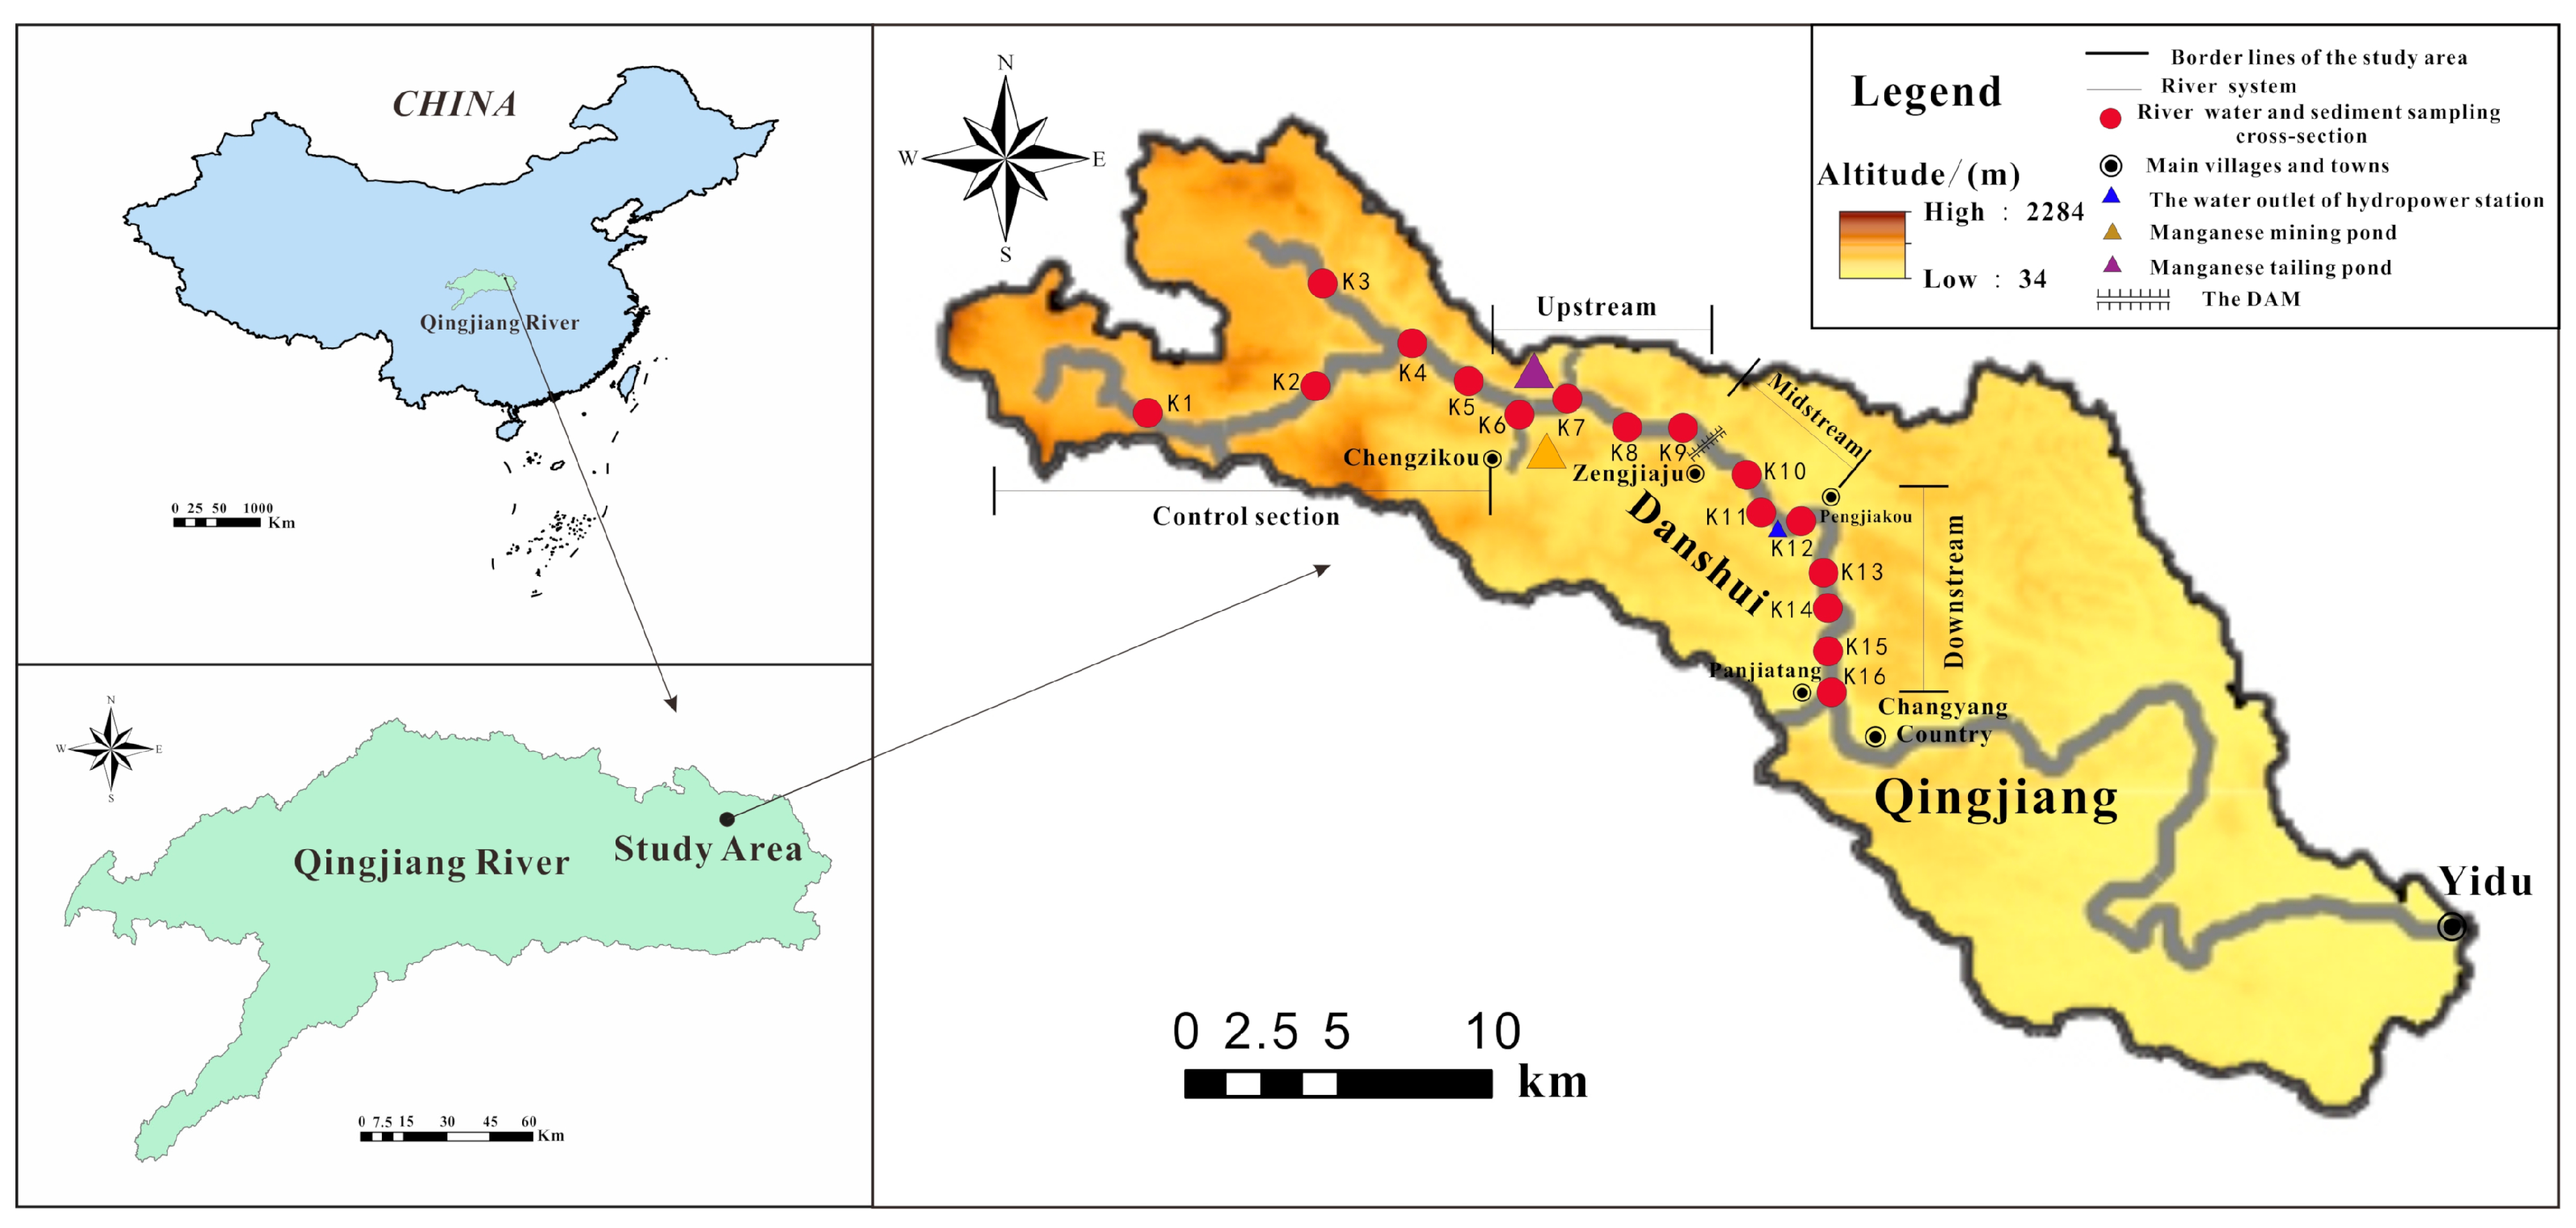
Figure 1. Location of the study area and sampling sites water samples and sediments of Danshui River.
Ijerph 18 01870 g001
Figure 2. Distribution of PTEs in river water and sediments along the Danshui River in manganese mining area.
Ijerph 18 01870 g002
Figure 3. The stability fields of authigenic minerals as function of pH-Eh at 25 °C (modified from references [45,46,47,48]).
Ijerph 18 01870 g003
Figure 4. Factor analysis of PTEs in the river waters (a) and sediments (b).
Ijerph 18 01870 g004
Figure 5. Pearson correlation coefficient of PTEs concentration in river waters vs. in sediments.
Ijerph 18 01870 g005
Figure 6. PTE pollution factors (contamination factor (CF) and IPL) in the river waters and sediments.
Ijerph 18 01870 g006
Figure 7. The Igeo distribution of PTEs from river sediments.
Ijerph 18 01870 g007
Table 1. The classification criteria for potential ecological risk index.
Classification E r i RI
1<16Low Risk<60Low Risk
2(16,32]Moderate Risk(60,120]Moderate Risk
3(32,64]Considerable Risk(120,240]Considerable Risk
4(64,128]High Risk(240,480]High Risk
5>128Very High Risk>480Very High Risk
Table 2. Coefficient of variation and standard deviation (CV ± SD%) of potentially toxic elements (PTEs) in Danshui River.
Sampling SizeElementAsCdCrCuMnPbZn
48CV in river sediments (Mean ± SD%)35 ± 211 ± 113 ± 255 ± 4206 ± 1237 ± 215 ± 2
48CV in river water (Mean ± SD%)36 ± 39 ± 110 ± 136 ± 3103 ± 235 ± 213 ± 1
SD: standard deviation.
Table 3. pH and Eh of PTEs in river water.
Sampling Cross-SectionSampling SizepH (Mean ± SD)Eh/mV (Mean ± SD)
K138.56 ± 0.1290.6 ± 2.1
K238.58 ± 0.2310.5 ± 2.2
K338.69 ± 0.2312.2 ± 2.6
K438.88 ± 0.1324.5 ± 2.3
K538.79 ± 0.2299.8 ± 2.5
K636.01 ± 0.1300.8 ± 1.9
K736.08 ± 0.2300.4 ± 1.8
K836.18 ± 0.2300.8 ± 1.5
K936.98 ± 0.2301.9 ± 2.1
K1038.11 ± 0.1335.6 ± 2.2
K1137.98 ± 0.2301.9 ± 1.2
K1238.45 ± 0.2330.8 ± 1.4
K1336.14 ± 0.1300.9 ± 1.6
K1436.26 ± 0.2302.2 ± 1.9
K1536.26 ± 0.1301.9 ± 1.1
K1636.78 ± 0.1310.5 ± 2.0
SD: standard deviation.
Table 4. Correlation matrix of PTEs in water and sediment of the river sections in manganese mining areas.
Element in WaterAsCdCrCuMnPbZn
As10.65 *0.69 *0.59 *0.160.99 **0.69 *
Cd 10.98 **0.64 *0.260.69 *0.99 **
Cr 10.67 *0.300.66 *0.99 **
Cu 10.66 *0.61 *0.69 *
Mn 10.260.33
Pb 10.56 *
Zn 1
Element in SedimentAsCdCrCuMnPbZn
As10.63 *0.67 **0.58 *0.150.99 **0.67 *
Cd 10.98 **0.62 *0.240.66 *0.99 **
Cr 10.66 *0.310.66 *0.99 **
Cu 10.63 *0.62 *0.68 *
Mn 10.210.34
Pb 10.56 *
Zn 1
** and * indicate that the correlation is significant at the 0.01 and 0.05 level, respectively.
Table 5. Principal component analysis of PTEs in water and sediment of Danshui. (The bold numbers in the table indicate they have higher factor scores).
Element in WaterPC1PC2PC3Element in SedimentPC1PC2PC3
As0.470.010.79As0.480.130.71
Cd0.94−0.16−0.13Cd0.97−0.02−0.13
Cr0.99−0.02−0.08Cr0.99−0.01−0.08
Cu0.570.750.04Cu0.530.710.04
Mn−0.040.980.06Mn0.100.950.02
Pb0.48−0.090.83Pb0.50−0.040.79
Zn0.980.040.06Zn0.950.020.02
eigenvalues3.131.121.11eigenvalues3.161.271.11
variance/% 46.3016.7815.71variance/% 48.8917.6716.67
cumulative variance/% 46.3063.0878.79cumulative variance/% 48.8966.5683.23
Table 6. Potential ecological risk posed by individual PTE (Ei) and multiple PTEs (RI) in the river sediments.
River SectionSampling SizeEi (Mean ± SD)RI (Mean ± SD)
AsCdCrCuMnPbZn
Upstream127.4 ± 0.43.2 ± 0.10.4 ± 0.01.3 ± 0.622.4 ± 4.13.0 ± 0.40.3 ± 0.038.1 ± 4.8
Midstream96.6 ± 0.33.2 ± 0.10.4 ± 0.01.0 ± 0.19.0 ± 2.22.8 ± 0.10.3 ± 0.023.4 ± 1.9
Downstream127.9 ± 1.53.2 ± 0.40.5 ± 0.01.2 ± 0.113.1 ± 0.24.0 ± 1.20.3 ± 0.030.1 ± 2.7
SD: standard deviation.
Publisher’s Note: MDPI stays neutral with regard to jurisdictional claims in published maps and institutional affiliations.