
Responses of Runoff and Soil Loss to Rainfall Regimes and Soil Conservation Measures on Cultivated Slopes in a Hilly Region of Northern China

Abstract
:1. Introduction
2. Materials and Methods
2.1. Study Site
2.2. Description of the Selected Runoff Plots

| No. | Gradient (%) | Length (m) | Width (m) | Area (m2) | Aspect | Type | Crop | Measure |
|---|---|---|---|---|---|---|---|---|
| 1 | 29.6 | 10 | 5 | 50 | Sunny | Cultivated | Corn | - |
| 2 | 25.7 | 10 | 5 | 50 | Northwestern | Cultivated | Corn | Contour tillage |
| 3 | 6.1 | 10 | 5 | 50 | Sunny | Cultivated | Corn | Terrace (4-m wide) |
| 4 | 6.1 | 10 | 5 | 50 | Sunny | Cultivated | Corn | Contour tillage |
| 5 | 11.0 | 10 | 5 | 50 | Sunny | Cultivated | Corn | Contour tillage |
2.3. Data Collection
2.4. Data Treatment and Statistical Analysis
3. Results
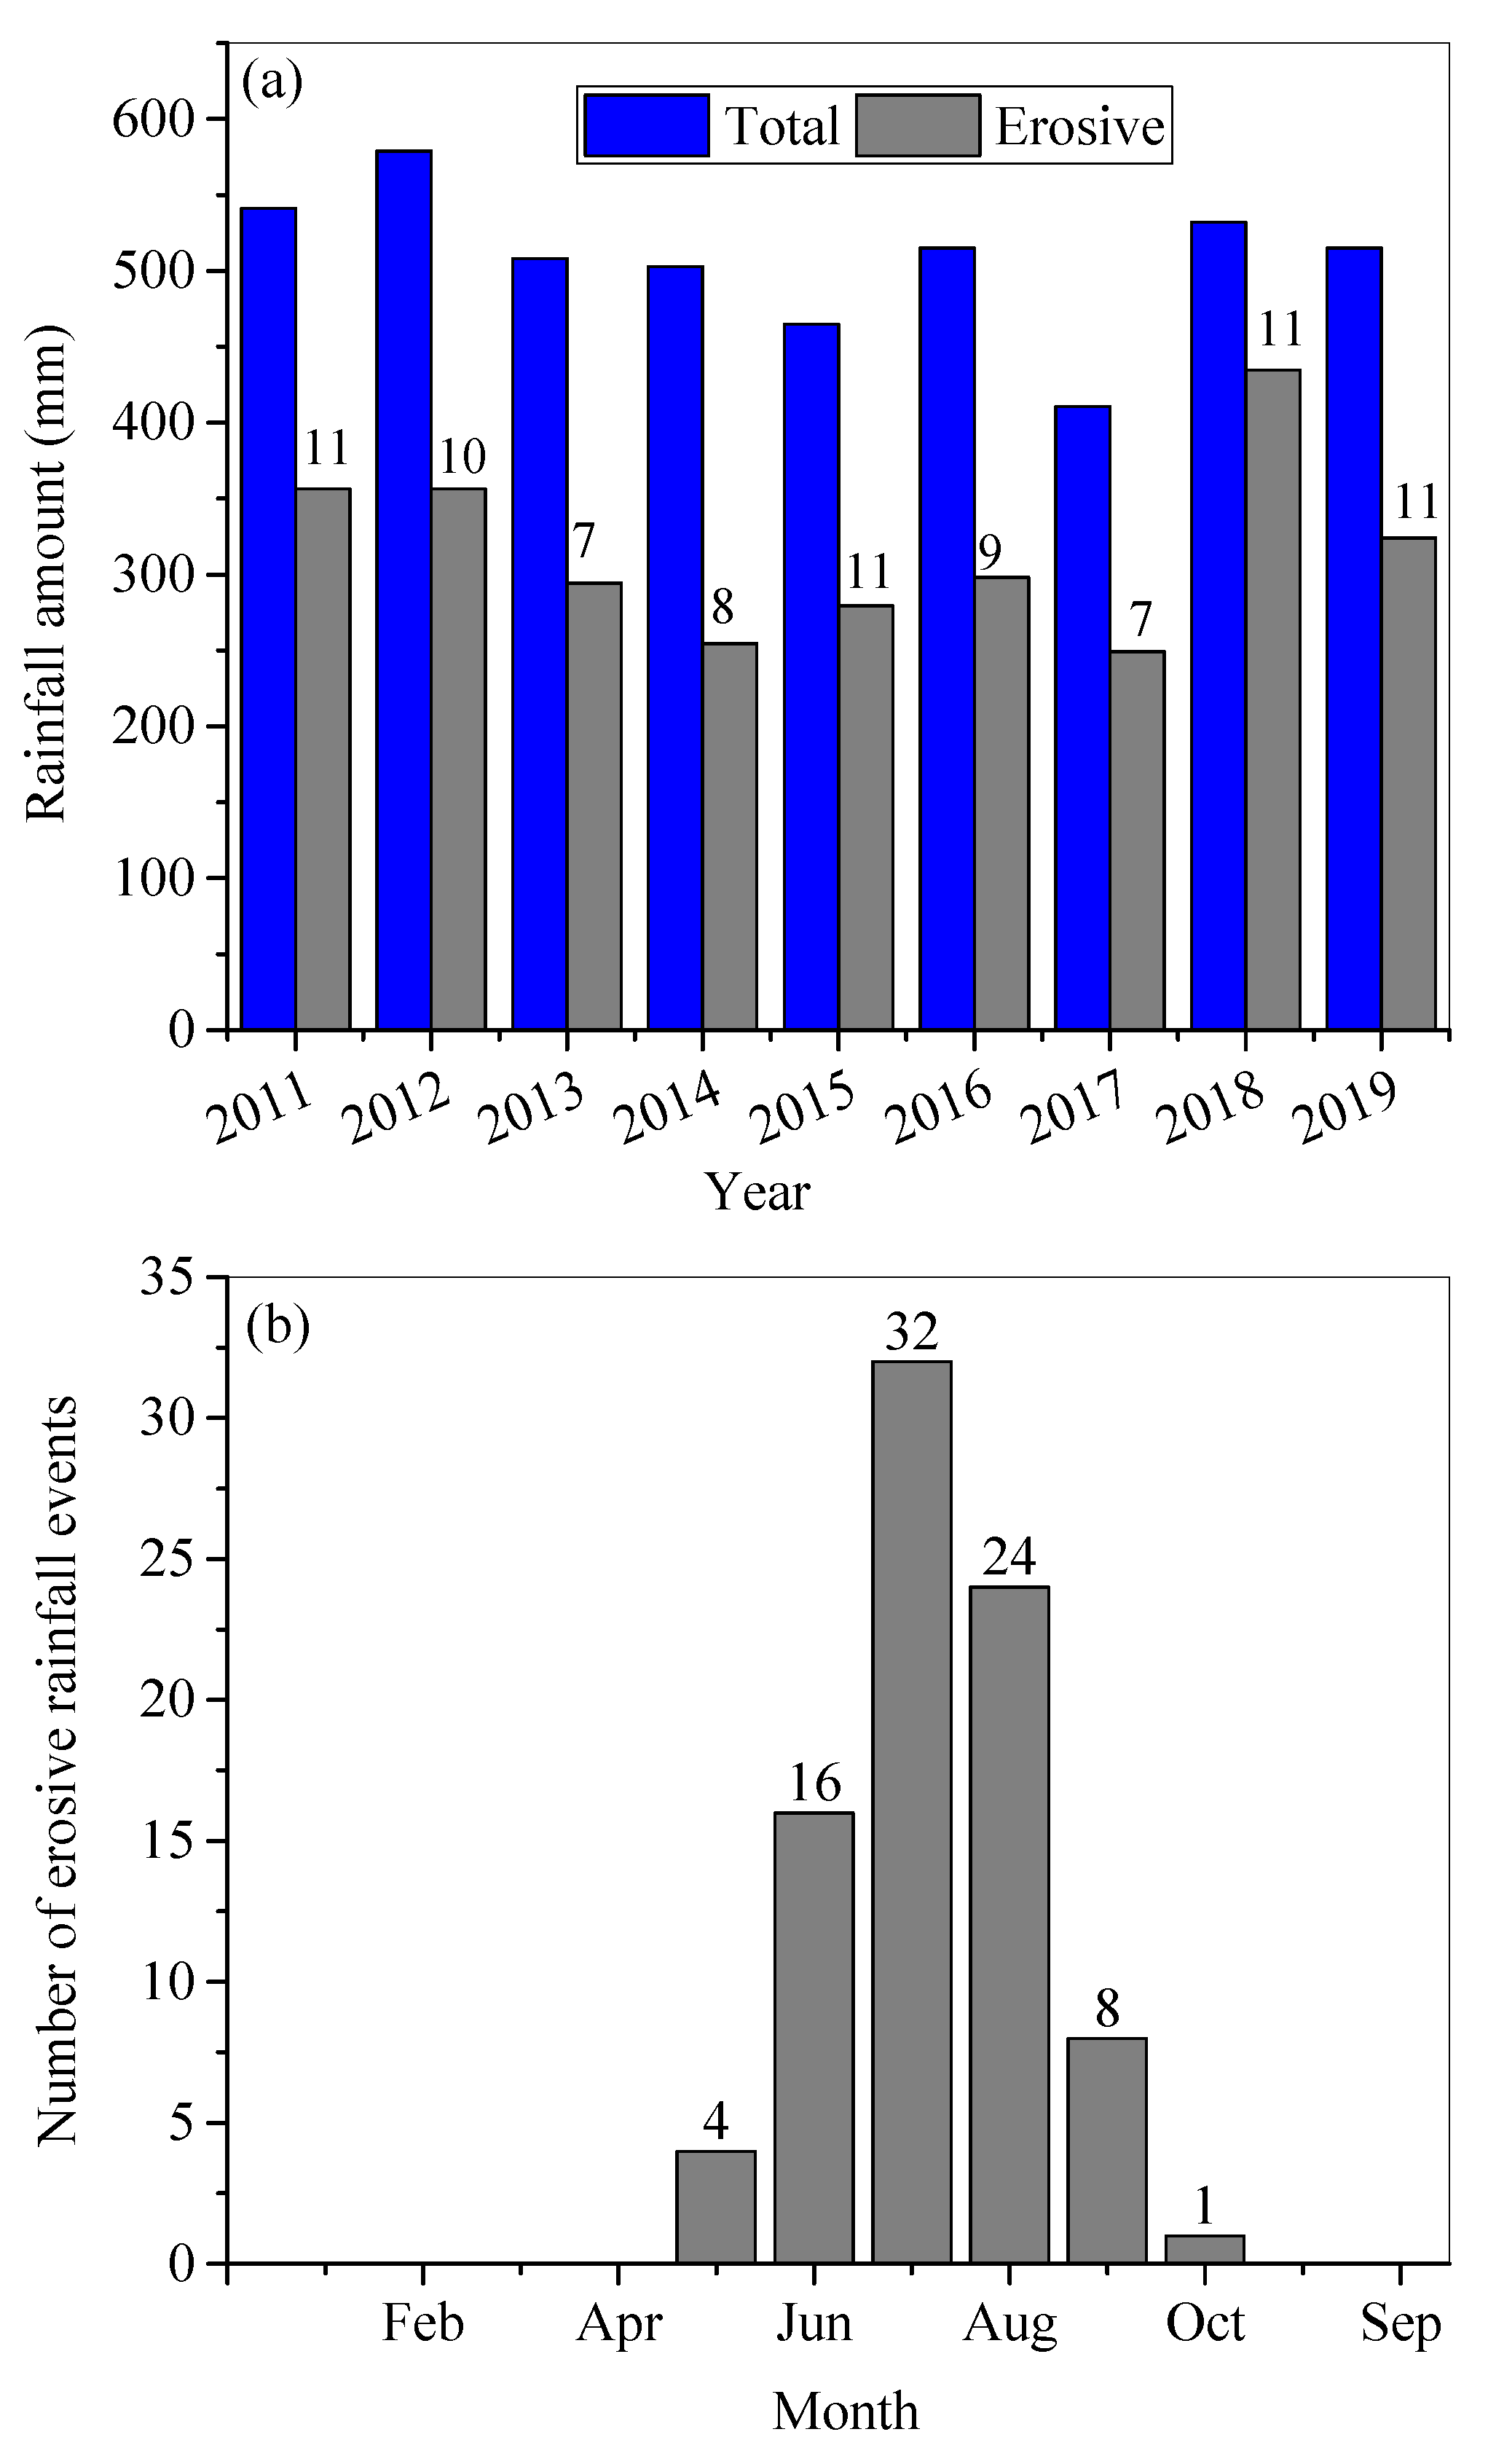
3.1. Rainfall Characteristics
3.2. Surface Runoff
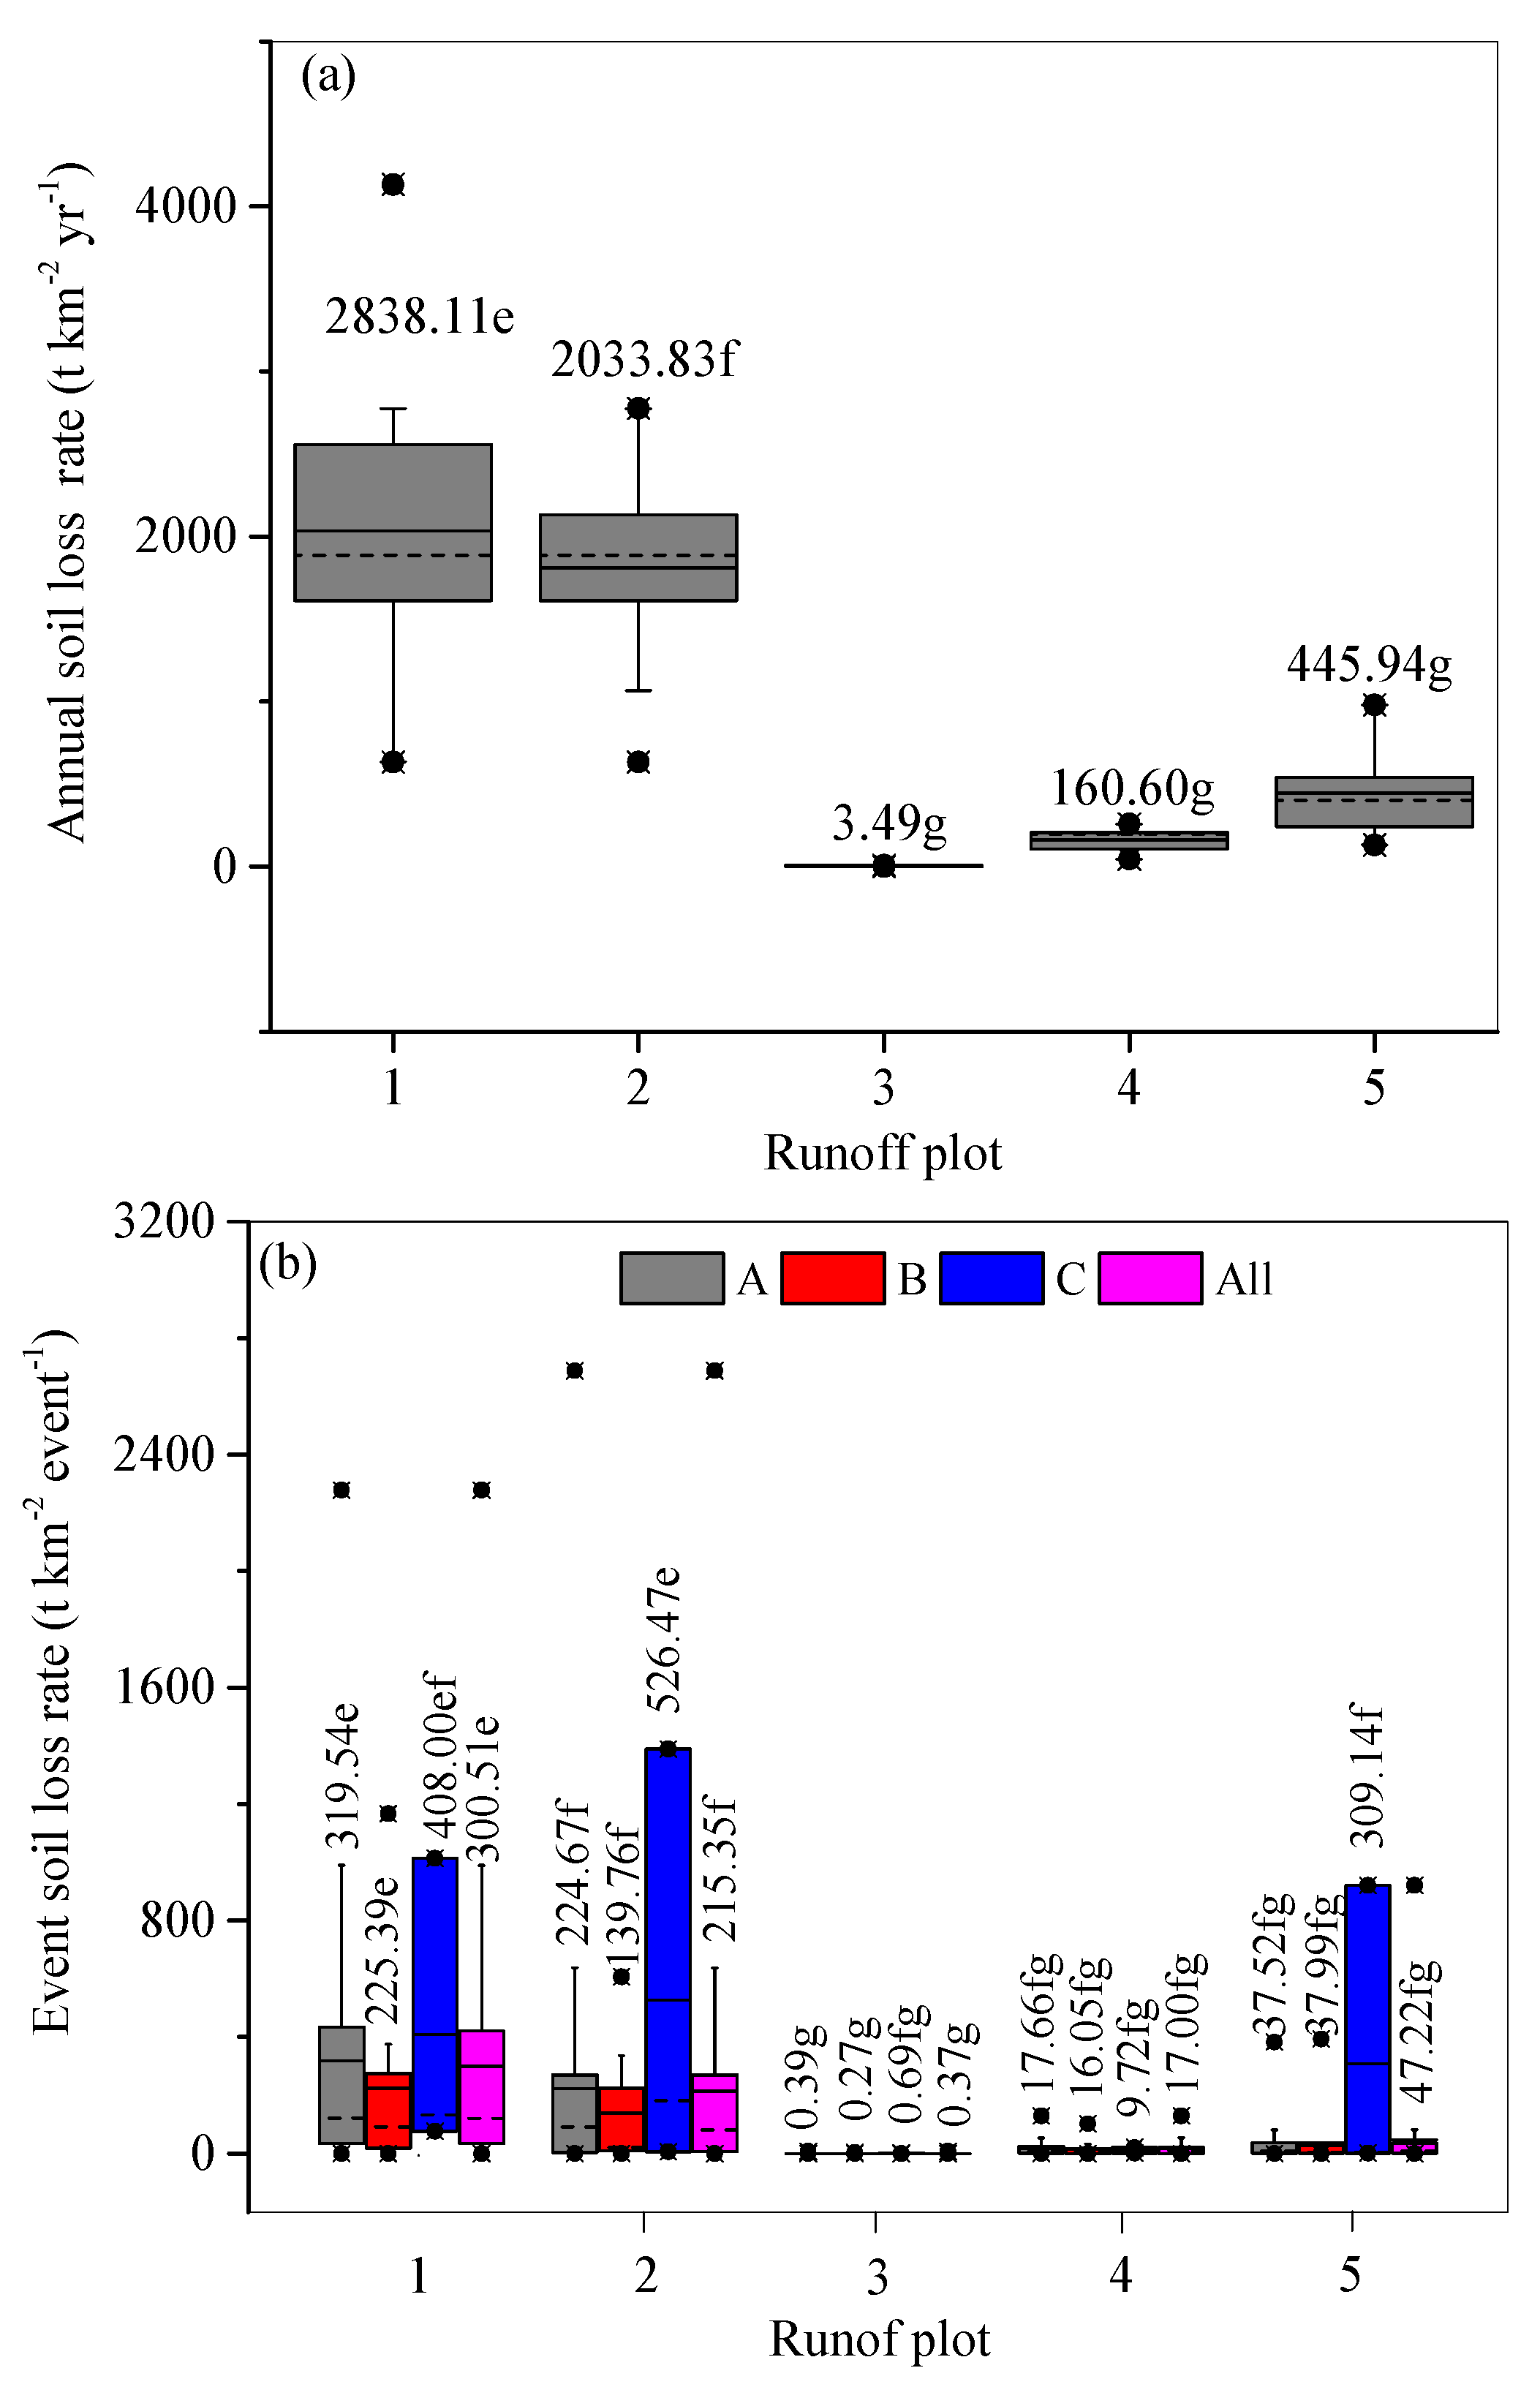
3.3. Soil Loss
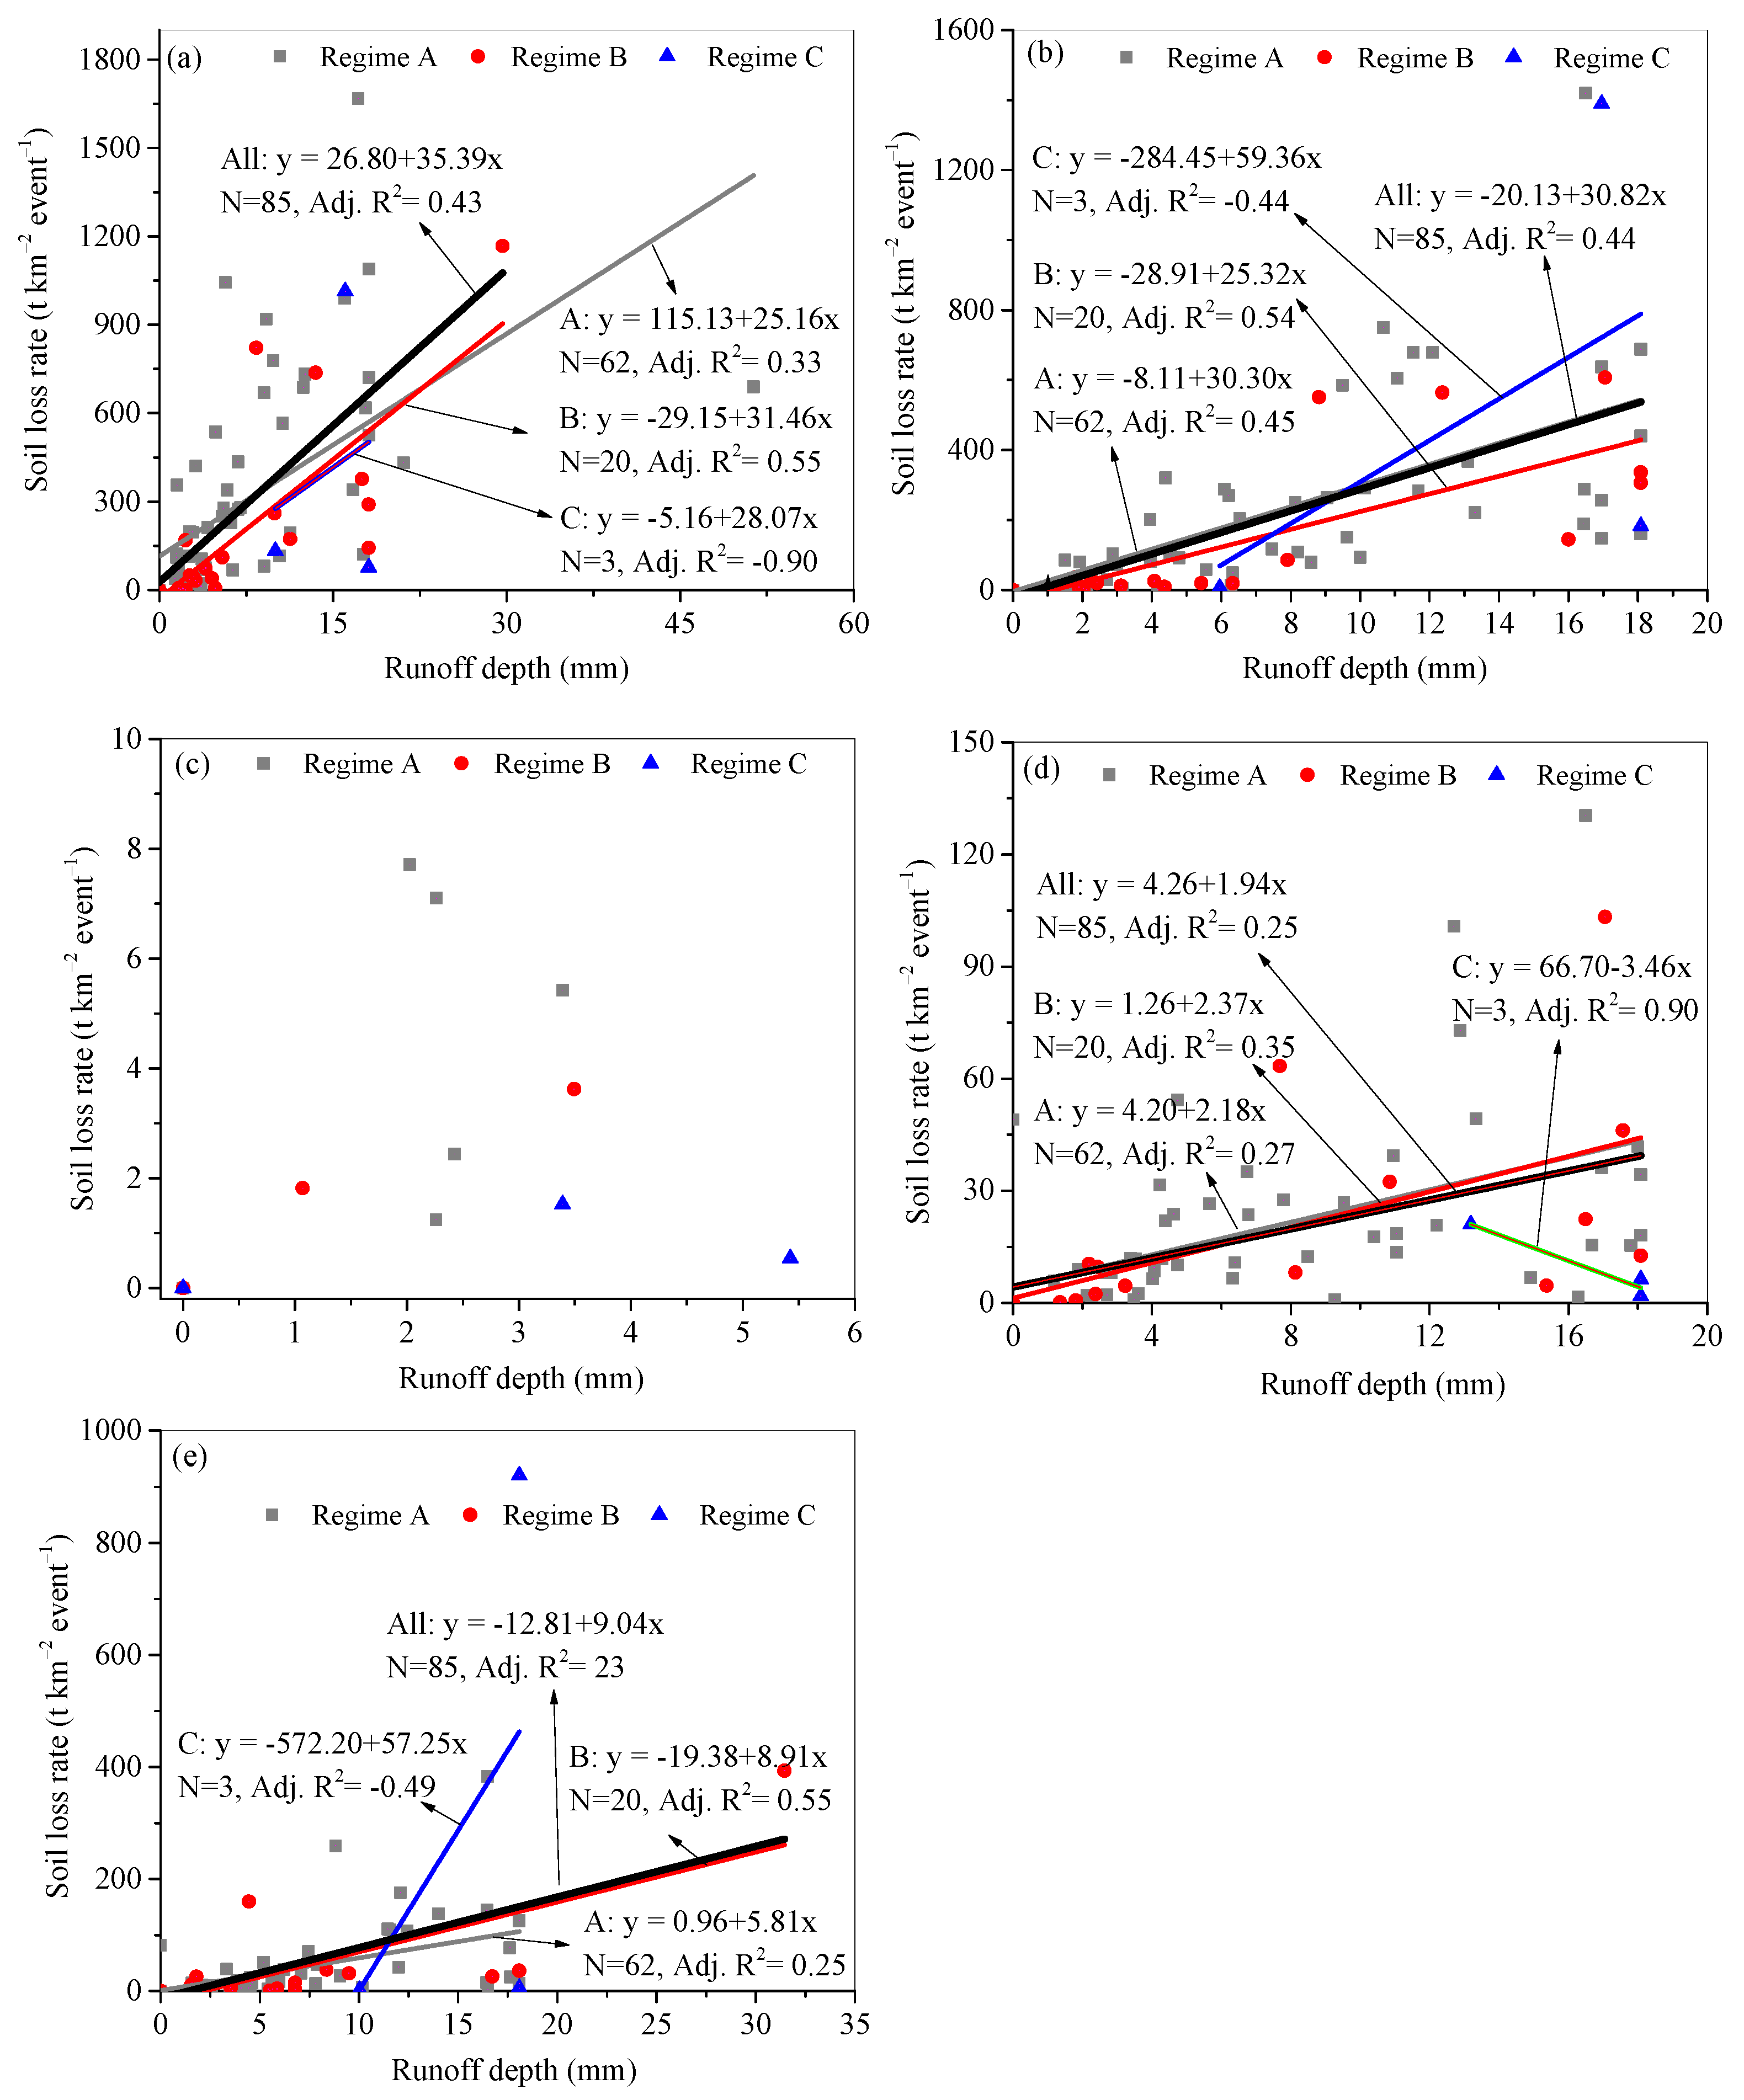
3.4. Runoff–Soil Loss Relationship
4. Discussion
4.1. Effect of Antecedent Soil Moisture and Soil Crust
4.2. Effect of Rainfall Regimes
4.3. Effect of Slope Gradient
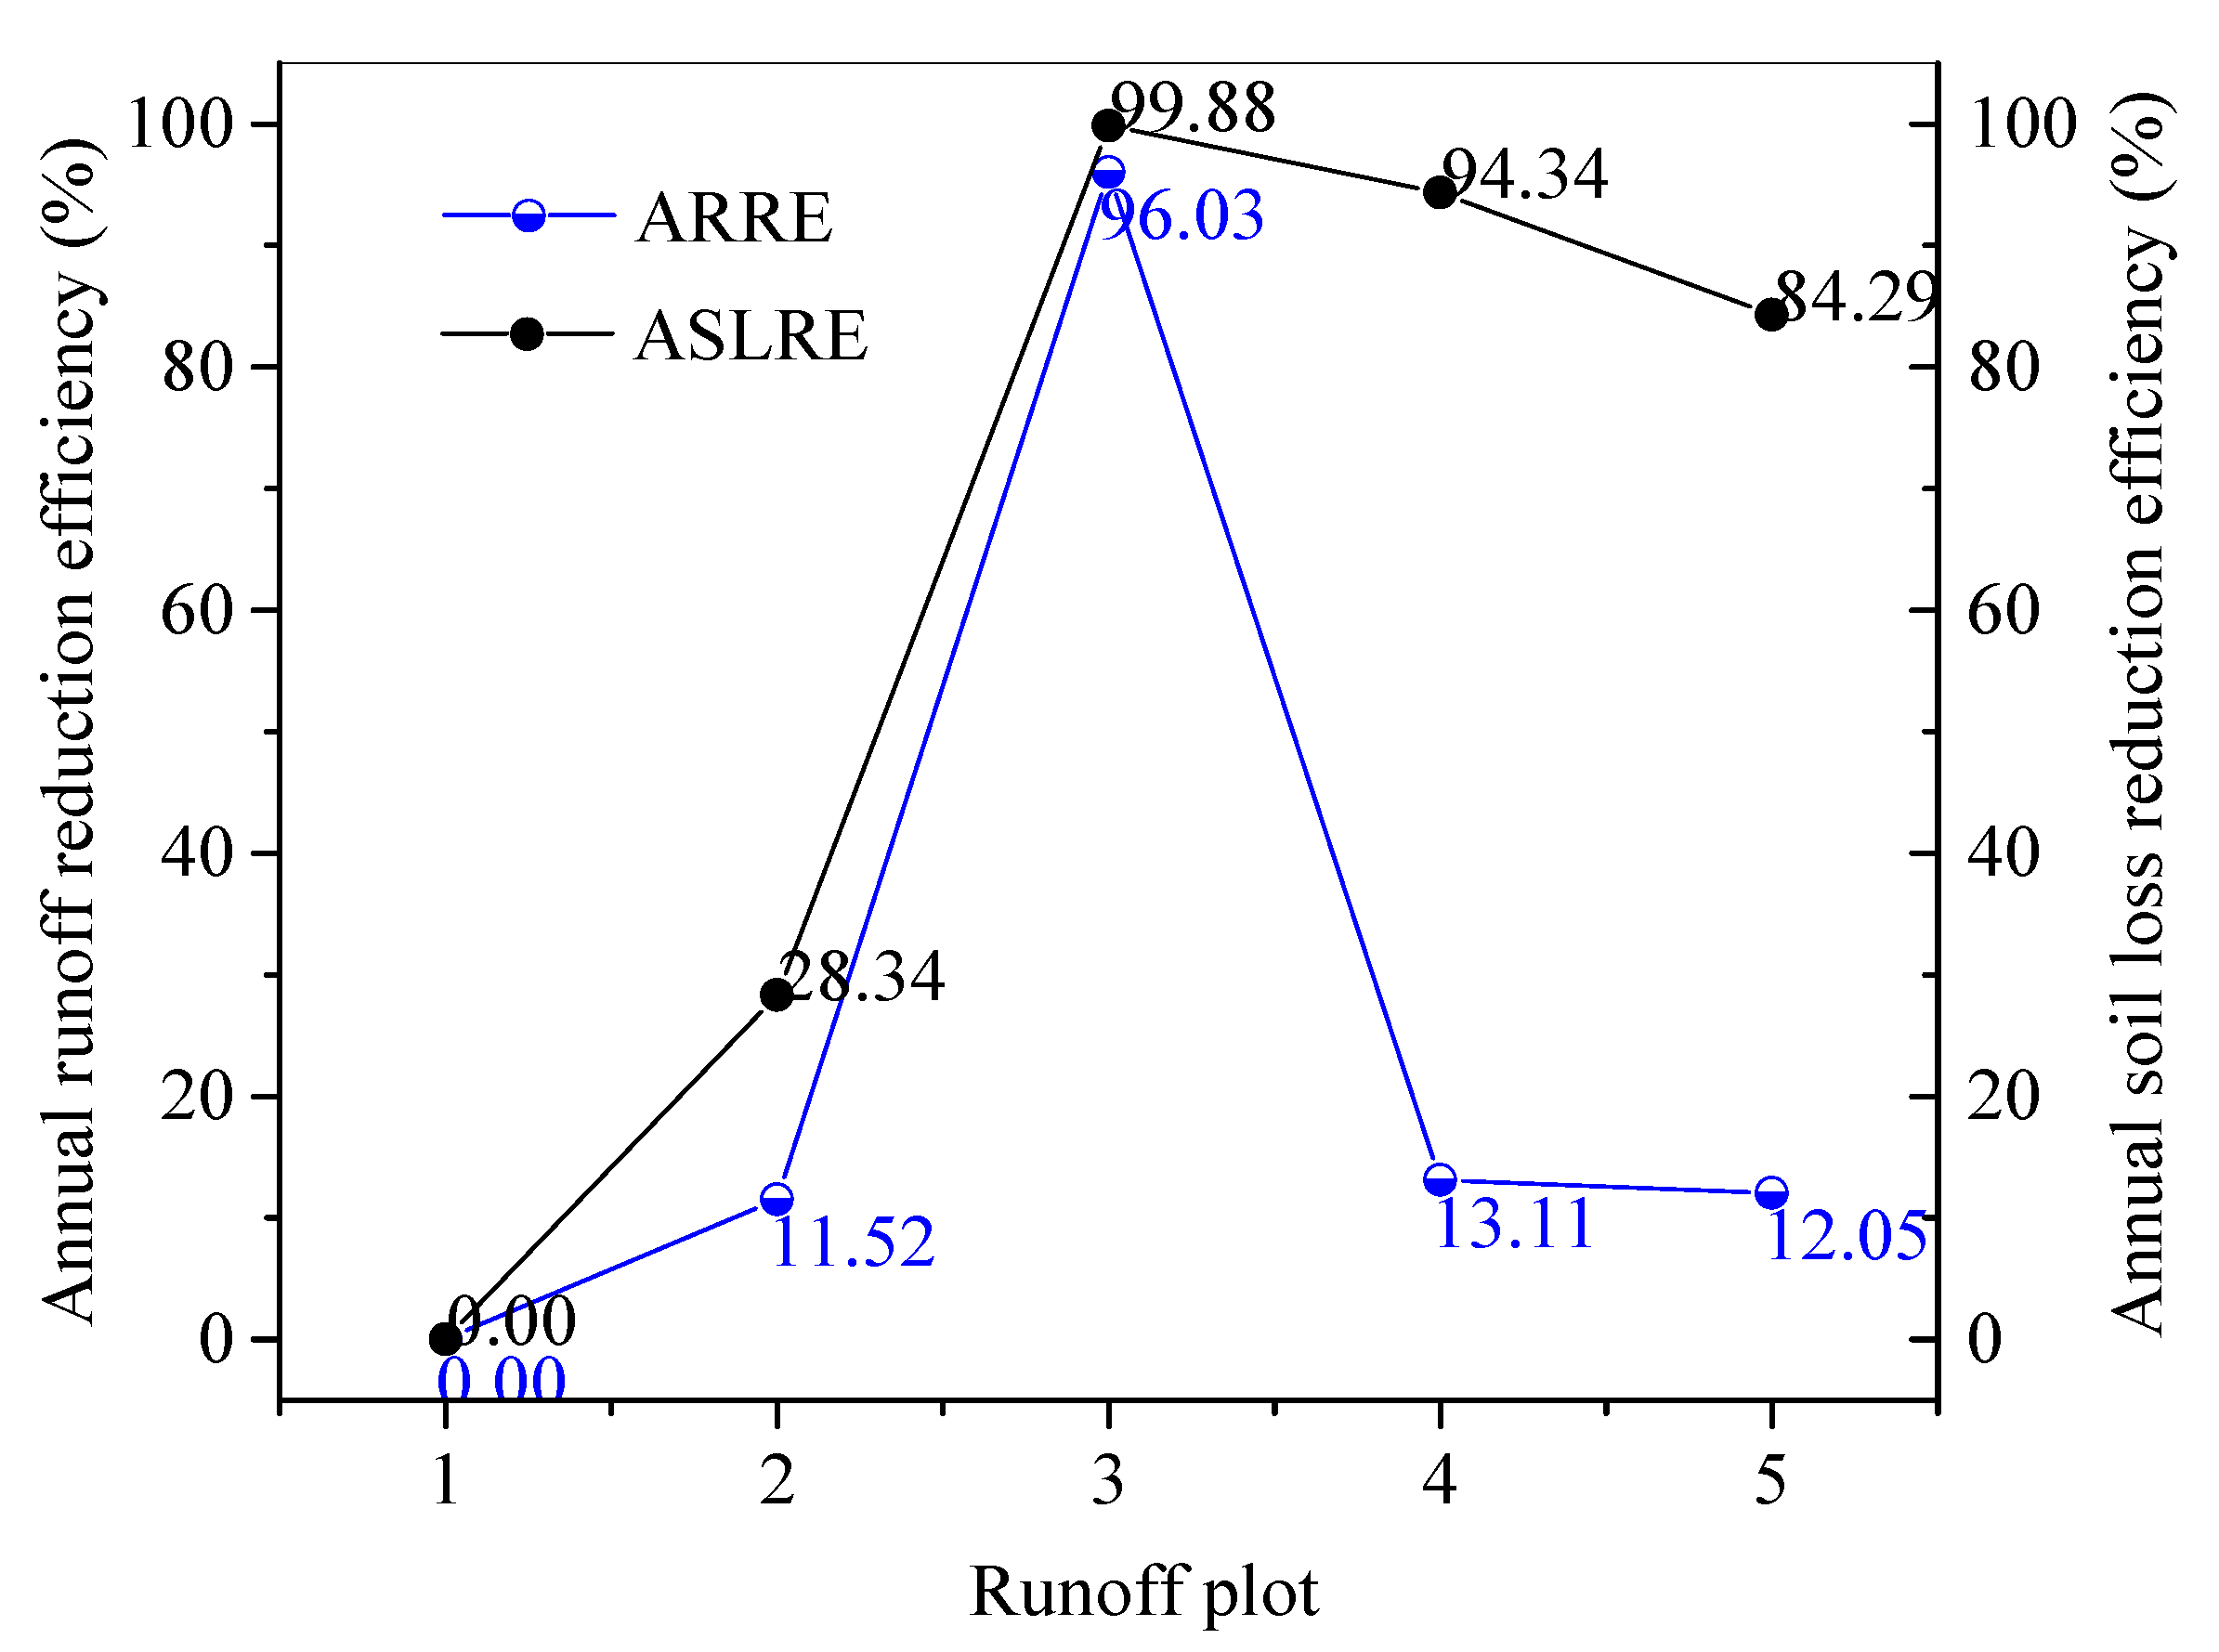
4.4. Effect of Soil Conservation Measures
5. Conclusions
Funding
Institutional Review Board Statement
Informed Consent Statement
Data Availability Statement
Acknowledgments
Conflicts of Interest
References
- Damnati, B.; Ibrahimi, S.; Radakovitch, Q. Quantifying erosion using 137Cs and 210Pb in cultivated soils in three Mediterranean watershed: Synthesis study from El Hachef, Raouz and Nakhla (North West Morocco). J. Afr. Earth Sci. 2013, 79, 50–57. [Google Scholar] [CrossRef]
- Wuepper, D.; Borrelli, P.; Finger, R. Countries and the global rate of soil erosion. Nat. Sustain. 2020, 3, 51–55. [Google Scholar] [CrossRef]
- Borrelli, P.; R4obinson, D.A.; Fleischer, L.R.; Lugato, E.; Ballabio, C.; Alewell, C.; Meusburger, K.; Modugno, S.; Schutt, B.; Ferro, V.; et al. An assessment of the global impact of 21st century land use change on soil erosion. Nat. Commun. 2017, 8, 1–13. [Google Scholar] [CrossRef] [PubMed] [Green Version]
- Alatorre, L.C.; Beguería, S.; Lana-Renault, N.; Navas, A.; García-Ruiz, J.M. Soil erosion and sediment delivery in a mountain catchment under scenarios of land use change using a spatially distributed numerical model. Hydrol. Earth Sys. Sci. Dis. 2012, 16, 1321–1334. [Google Scholar] [CrossRef] [Green Version]
- Didoné, E.J.; Minella, J.P.G.; Evrard, O. Measuring and modelling soil erosion and sediment yields in a large cultivated catchment under no-till of Southern Brazil. Soil Tillage Res. 2017, 174, 24–33. [Google Scholar] [CrossRef]
- Aneseyee, A.B.; Elias, E.; Soromessa, T.; Feyisa, G.L. Land use/land cover change effect on soil erosion and sediment delivery in the Winike watershed, Omo Gibe Basin, Ethiopia. Sci. Total Environ. 2020, 728, 138776. [Google Scholar] [CrossRef] [PubMed]
- Jia, L.Z.; Zhao, W.W.; Zhai, R.J.; An, Y.M.; Pereira, P. Quantifying the effects of contour tillage in controlling water erosion in China: A meta-analysis. Catena 2020, 195, 104829. [Google Scholar] [CrossRef]
- Bai, L.C.; Wang, N.; Jiao, J.Y.; Chen, Y.X.; Tang, B.Z.; Wang, H.L.; Chen, Y.L.; Yan, X.Q.; Wang, Z.J. Soil erosion and sediment interception by check dams in a watershed for an extreme rainstorm on the Loess Plateau, China. Int. J. Sediment Res. 2020, 35, 408–416. [Google Scholar] [CrossRef]
- Ge, F.L.; Zhang, J.H.; Su, Z.G.; Nie, X.J. Response of changes in soil nutrients to soil erosion on a purple soil of cultivated sloping land. Acta Ecol. Sin. 2007, 27, 459–464. [Google Scholar] [CrossRef]
- He, Y.Y.; Wang, X.Y.; Duan, S.H. Characteristics of runoff and sediment during individual rainfall in upper area of Miyun Reservoir. Transac. Chin. Soc. Agric. Eng. 2015, 31, 134–141. [Google Scholar]
- Han, L.F.; Gao, B.; Lu, J.; Zhou, Y.; Xu, D.Y.; Gao, L.; Sun, K. Pollution characteristics and source identification of trace metals in riparian soils of Miyun Reservoir, China. Ecotox. Environ. Saf. 2017, 144, 321–329. [Google Scholar] [CrossRef] [PubMed]
- Qiu, J.L.; Shen, Z.Y.; Hou, X.S.; Xie, H.; Leng, G.Y. Evaluating the performance of conservation practices under climate change scenarios in the Miyun Reservoir Watershed, China. Ecol. Eng. 2020, 143, 105700. [Google Scholar] [CrossRef]
- Qiu, J.L.; Shen, Z.Y.; Huang, M.Y.; Zhang, X.S. Exploring effective best management practices in the Miyun reservoir watershed, China. Ecol. Eng. 2018, 123, 30–42. [Google Scholar] [CrossRef]
- Li, H.Y.; Di, Y.M.; Li, D.Q.; Liang, J.; Guo, X.Y. Spatial and temporal variations of water quality in a wetland-reclaimed water-supplied purification urban river: Case study in Chaobai River of Beijing. Res. Environ. Sci. 2007, 30, 1542–1552. [Google Scholar]
- Wang, P.J.; Rene, E.R.; Yan, Y.L.; Ma, W.F.; Xiang, Y.Y. Spatiotemporal evolvement and factors influencing natural and synthetic EDCs and the microbial community at different groundwater depths in the Chaobai watershed: A long-term field study on a river receiving reclaimed water. J. Environ. Manag. 2019, 246, 647–657. [Google Scholar] [CrossRef] [PubMed]
- Wang, S.F.; Wang, X.K.; Ouyang, Z.Y. Effects of land use, climate, topography and soil properties on regional soilorganic carbon and total nitrogen in the Upstream Watershed of Miyun Reservoir, North China. J. Environ. Sci. 2012, 24, 387–395. [Google Scholar] [CrossRef]
- Xu, E.Q.; Zhang, H.Q. Relationship between land use and nutrients in surface runoff in upper catchment of Miyun Reservoir, China. J. Appl. Ecol. 2018, 29, 2869–2878. [Google Scholar]
- Wei, J.; Zheng, X.G.; Wang, C.L.; Zhang, G.X.; Liu, J.T. Soil arsenic content and environmental quality assessment in the upstream basin of Guanting Reservoir and Miyun Reservoir. Environ. Chem. 2019, 38, 71–77. [Google Scholar]
- Wang, X.Y.; Hu, Q.J.; Zhu, F.Y.; He, W. Loss of nutrients in runoff and soil in the watershed of Miyun Reservoir-as a example of Shixia experimental area. J. Cap. Norm. Univ. 2001, 22, 79–85. [Google Scholar]
- Li, Z.J. Impacts of different allocation plans as soil and water conservation measures on annual runoff in the Chaohe River basin. Bull. Soil Water Conserv. 2010, 30, 108–112. [Google Scholar]
- He, J.J.; Cai, Q.G.; Wang, X.Q. Research on paradigm of soil erosion comprehensive control about Shixia small watershed in the upstream of Miyun Reservoir. J. Nat. Resour. 2009, 24, 585–593. [Google Scholar]
- Feng, J.J.; Shi, M.C.; Jiang, Q.E. Influence of land use/cover change on soil erosion in Chaobai River basin. Sci. Soil Water Conserv. 2019, 17, 121–132. [Google Scholar]
- Yan, T.Z.; Bai, J.W.; Arsenio, T.; Shen, Z.Y. Future climate change impacts on streamflow and nitrogen exports based on CMIP5 projection in the Miyun Reservoir Basin, China. Ecohydrol. Hydrobiol. 2019, 19, 266–278. [Google Scholar] [CrossRef]
- Cai, X.G. Benefits from soil and water conservation measures on reducing runoff and sediments in Shixia small watershed. Res. Sci. 2001, 2, 79–85. [Google Scholar]
- Gao, Y. Study on the effect of different soil conservation measures on soil erosion in Shixia catchment. Eng. Technol. Res. 2018, 29, 255–256. [Google Scholar]
- Pang, S.J.; Wang, X.Y.; Melching, C.S.; Feger, K.H. Development and testing of a modified SWAT model based on slope condition and precipitation intensity. J. Hydrol. 2020, 588, 125098. [Google Scholar] [CrossRef]
- Xu, J.J.; Zhang, J.J.; Li, M.Y.; Wang, F.Z. Effect of rain peak morphology on runoff and sediment yield in Miyun water source reserve in China. Water 2019, 11, 2429. [Google Scholar] [CrossRef] [Green Version]
- Meißl, G.; Zieher, T.; Geitner, C. Runoffresponse to rainfall events considering initial soil moisture–Analysis of 9-year records in a small Alpine catchment (Brixenbach valley, Tyrol, Austria. J. Hydrol. Reg. Stud. 2020, 30, 100711. [Google Scholar] [CrossRef]
- Vandervaere, J.P.; Peugeot, C.; Angulo Jaramillo, R.; Vauclin, M.; Lebel, T. Estimating hydraulic conductivity of crusted soils by using disc infiltrometers and micro-tensiometers. J. Hydrol. 1997, 188, 203–223. [Google Scholar] [CrossRef]
- Esteves, M.; Lapetite, J.M. A multi-scale approach of runoff generation in a Sahelian gully catchment: A case study in Niger. Catena 2003, 50, 255–271. [Google Scholar] [CrossRef]
- Hardie, M.; Almajmaie, A. Measuring and estimating the hydrological properties of a soil crust. J. Hydrol. 2019, 574, 12–22. [Google Scholar] [CrossRef]
- McIntyre, D.S. Permeability measurements of soil crusts by raindrop impact. Soil Sci. 1958, 85, 185–189. [Google Scholar] [CrossRef]
- Qinna, M.I.A.; Awwad, A.M.A. Infiltration rate measurements in arid soils with surface crust. Irrig. Sci. 1998, 18, 83–89. [Google Scholar] [CrossRef]
- Peugeot, C.; Esteves, M.; Rajot, J.L.; Vandervaere, J.P.; Galle, S. Runoff generation processes: Results and analysis of field data collected at the central supersite of the Hapex-Sahel experiment. J. Hydrol. 1997, 188, 179–202. [Google Scholar] [CrossRef]
- Le Bissonnais, Y.; Renaux, B.; Delouche, H. Interactions between soil properties and moisture content in crust formation, runoff and interrill erosion from tilled loess soils. Catena 1995, 25, 33–46. [Google Scholar] [CrossRef]
- Fang, H.Y.; Cai, Q.G.; Chen, H.; Li, Q.Y. Effect of rainfall regime and slope on runoff in a gullied loess region on the Loess Plateau in China. Environ. Manag. 2008, 42, 402–411. [Google Scholar] [CrossRef]
- Fang, H.Y.; Sun, L.Y.; Tang, Z.H. Effects of rainfall and slope on runoff, soil erosion and rill development: An experimental study using two loess soils. Hydrol. Process. 2015, 29, 2649–2658. [Google Scholar] [CrossRef]
- Wei, W.; Chen, L.D.; Fu, B.J.; Huang, Z.L.; Wu, D.P.; Gui, L.D. The effect of land uses and rainfall regimes on runoff and soil erosion in the semi-arid loess hilly area, China. J. Hydrol. 2007, 335, 247–258. [Google Scholar] [CrossRef]
- Chen, H.; Zhang, X.P.; Alba, M.; Yan, R.; Ren, Q.F.; Ren, Z.Y.; Yang, Y.H.; Zhao, W.H.; Lin, P.F.; Liu, B.Y.; et al. Effects of vegetation and rainfall types on surface runoff and soil erosion on steep slopes on the Loess Plateau, China. Catena 2018, 170, 141–149. [Google Scholar] [CrossRef]
- He, P.; Zhang, G.S.; Bian, R.Y. A study of runoff yield in mid-area of Haihe basin. Hydr. Sci. Technol. 2001, 22, 45–50. [Google Scholar]
- Hu, Y.X.; Fister, W.; He, Y.; Kuhn, N.J. Assessment of crusting effects on interrill erosion by laser scanning. PeerJ 2019, 8, e8487. [Google Scholar] [CrossRef]
- Guo, J.Z. Discussion on the issue of the relations of slope gradient and runoff amount and sediment production. Yel. Riv. 1958, 3, 47–49. [Google Scholar]
- Fox, D.M.; Bryan, R.B.; Price, A.G. The influence of slope angle on final infiltration rate for interrill conditions. Geoderma 1997, 80, 181–194. [Google Scholar] [CrossRef]
- Zhao, L.S.; Hou, R.; Wu, F.Q.; Dai, Q.H. Effect of slope gradient on soil and water conservation benefit of tillage practices in agriculture lands. J. Soil Water Conserv. 2017, 31, 69–78. [Google Scholar]
- Hessel, R.; Messing, I.; Liding, C.; Ritsema, C.; Stolte, J. Soil erosion simulations of land use scenarios for a small Loess Plateau catchment. Catena 2003, 54, 289–302. [Google Scholar] [CrossRef]
- Zhao, L.; Liang, X.; Wu, F. Soil surface roughness change and its effect on runoff and erosion on the Loess Plateau of China. J. Arid Land 2014, 6, 400–409. [Google Scholar] [CrossRef] [Green Version]
- Wu, Q.J.; Wang, L.H.; Wu, F.Q. Effects of structural and depositional crusts on soil erosion on the Loess Plateau of China. Arid Land Res. Manag. 2016, 30, 432–444. [Google Scholar] [CrossRef]
- Chen, D.; Wei, W.; Chen, L.D. Effects of terracing practices on water erosion control in China: A meta-analysis. Earth Sci. Rev. 2017, 173, 109–121. [Google Scholar] [CrossRef]
- Xin, Y.; Liu, G.; Xie, Y.; Gao, Y.; Liu, B.Y.; Shen, B. Effects of soil conservation practices on soil losses from slope farmland in northeastern China using runoff plot data. Catena 2019, 174, 417–424. [Google Scholar] [CrossRef]
- Zhao, J.L.; Yang, Z.Q.; Gover, G. Soil and water conservation measures reduce soil and water losses in China but not down to background levels: Evidence from erosion plot data. Geoderma 2019, 337, 729–741. [Google Scholar] [CrossRef]
- Chen, J.; Xiao, H.B.; Li, Z.W.; Liu, C.; Tang, C.J. How effective are soil and water conservation measures (SWCMs) in reducing soil and water losses in the red soil hilly region of China? A meta-analysis of field plot data. Sci. Total Environ. 2020, 735, 139517. [Google Scholar] [CrossRef] [PubMed]
- Fernandes, A.C.S.A.; Gontijo, L.M. Terracing field slopes can concurrently mitigate soil erosion and promote sustainable pest management. J. Environ. Manag. 2020, 269, 110801. [Google Scholar] [CrossRef] [PubMed]
- Li, X.B.; Ma, Z.Z.; Yao, X.Y.; Jing, K.; Zhu, H.Y. Current status and comprehensive control strategies of soil erosion for rocky mountain areas in the Northern China. Sci. Soil Water Conserv. 2008, 6, 9–15. [Google Scholar]


| Eigenvalue | SOM (%) | Texture (Chinese Classification System) | ||||
|---|---|---|---|---|---|---|
| >0.05 | 0.05–0.01 | 0.01–0.005 | 0.005–0.001 | <0.001 | ||
| Mean | 1.57 | 60.9 | 15.00 | 3.22 | 6.00 | 14.88 |
| St.D | 0.69 | 12.58 | 4.36 | 1.53 | 1.00 | 2.55 |
| Variables | Cluster | Error | F | Sig. | ||
|---|---|---|---|---|---|---|
| Mean Square | df | Mean Square | df | |||
| RD | 4,980,828.25 | 2 | 23,349.50 | 82 | 213.32 | 0.00 |
| P | 9573.87 | 2 | 434.34 | 82 | 22.04 | 0.00 |
| Im | 854.79 | 2 | 121.57 | 82 | 7.03 | 0.00 |
| I30 | 270.12 | 2 | 222.84 | 82 | 1.21 | 0.30 |
| I60 | 59.44 | 2 | 162.97 | 82 | 0.37 | 0.70 |
| Rainfall Regime | Eigenvalue | Mean | Range (Min–Max) | Standard Deviation | Variation of Coefficient | Number |
|---|---|---|---|---|---|---|
| A | P (mm) | 26.01 | 4.80–105.20 | 16.52 | 0.64 | 62 |
| RD (min) | 176.03 | 20.00–498.00 | 138.04 | 0.78 | ||
| Im (mm min−1) | 14.18 | 2.07–69.6 | 12.68 | 0.89 | ||
| I30 (mm min−1) | 29.70 | 6.00–75.80 | 15.85 | 0.53 | ||
| I60 (mm min−1) | 21.17 | 3.60–69.60 | 12.76 | 0.60 | ||
| B | P (mm) | 47.32 | 10.60–123.60 | 31.21 | 0.66 | 20 |
| RD (min) | 705.30 | 500.00–1060.00 | 188.27 | 0.27 | ||
| Im (mm min−1) | 4.20 | 1.03–11.36 | 2.84 | 0.68 | ||
| I30 (mm min−1) | 23.90 | 6.40–37.40 | 10.29 | 0.43 | ||
| I60 (mm min−1) | 18.74 | 4.50–57.20 | 12.44 | 0.66 | ||
| C | P (mm) | 96.37 | 82.50–108.10 | 12.93 | 0.13 | 3 |
| RD (min) | 1711.67 | 1580.00–1940.00 | 198.52 | 0.12 | ||
| Im (mm min−1) | 3.30 | 3.07–3.74 | 0.34 | 0.10 | ||
| I30 (mm min−1) | 31.6 | 15.20–56.00 | 21.54 | 0.68 | ||
| I60 (mm min−1) | 23.77 | 14.40–42.00 | 15.79 | 0.66 | ||
| Total | P (mm) | 33.51 | 4.80–123.60 | 25.53 | 0.76 | 85 |
| RD (min) | 354.76 | 20.00–1940.00 | 376.01 | 1.06 | ||
| Im (mm min−1) | 11.45 | 1.03–69.60 | 14.98 | 1.31 | ||
| I30 (mm min−1) | 28.40 | 6.00–75.80 | 14.95 | 0.53 | ||
| I60 (mm min−1) | 20.69 | 3.60–69.60 | 12.67 | 0.61 |
| Runoff Plot | Eigenvalue | RD | P | Im | I30 | I60 | ASMC |
|---|---|---|---|---|---|---|---|
| 1 | H | 0.224 * | 0.607 ** | 0.098 | 0.528 ** | 0.487 ** | −0.050 |
| SLR | −0.019 | 0.304 ** | 0.280 ** | 0.448 ** | 0.416 ** | 0.011 | |
| 2 | H | 0.235 * | 0.518 ** | 0.180 | 0.586 ** | 0.486 ** | −0.060 |
| SLR | 0.132 | 0.349 ** | 0.186 | 0.404 ** | 0.381 ** | −0.096 | |
| 3 | H | 0.402 ** | 0.521 ** | 0.024 | 0.286 ** | 0.284 ** | 0.002 |
| SLR | −0.004 | 0.282 ** | 0.127 | 0.245 * | 0.320 ** | 0.049 | |
| 4 | H | 0.316 ** | 0.581 ** | 0.061 | 0.514 ** | 0.441 ** | 0.003 |
| SLR | −0.100 | 0.219 * | 0.181 | 0.281 ** | 0.287 ** | 0.112 | |
| 5 | H | 0.220 * | 0.521 ** | 0.182 | 0.542 ** | 0.491 ** | 0.006 |
| SLR | 0.315 ** | 0.426 ** | 0.070 | 0.321 ** | 0.345 ** | 0.134 |
Publisher’s Note: MDPI stays neutral with regard to jurisdictional claims in published maps and institutional affiliations. |
© 2021 by the author. Licensee MDPI, Basel, Switzerland. This article is an open access article distributed under the terms and conditions of the Creative Commons Attribution (CC BY) license (http://creativecommons.org/licenses/by/4.0/).
Share and Cite
Fang, H. Responses of Runoff and Soil Loss to Rainfall Regimes and Soil Conservation Measures on Cultivated Slopes in a Hilly Region of Northern China. Int. J. Environ. Res. Public Health 2021, 18, 2102. https://doi.org/10.3390/ijerph18042102
Fang H. Responses of Runoff and Soil Loss to Rainfall Regimes and Soil Conservation Measures on Cultivated Slopes in a Hilly Region of Northern China. International Journal of Environmental Research and Public Health. 2021; 18(4):2102. https://doi.org/10.3390/ijerph18042102
Chicago/Turabian StyleFang, Haiyan. 2021. "Responses of Runoff and Soil Loss to Rainfall Regimes and Soil Conservation Measures on Cultivated Slopes in a Hilly Region of Northern China" International Journal of Environmental Research and Public Health 18, no. 4: 2102. https://doi.org/10.3390/ijerph18042102