
MALDI-TOF Protein Profiling Reflects Changes in Type 1 Diabetes Patients Depending on the Increased Amount of Adipose Tissue, Poor Control of Diabetes and the Presence of Chronic Complications

 , , , , , and
Abstract
:1. Introduction
2. Materials and Methods
2.1. Study Groups
2.2. Methods
- Obesity (BMI < 30 vs. BMI > 30 kg/m2): BMI was calculated from the formula of the ratio of body weight to squared height.
- Presence of diabetic complications (retinopathy, nephropathy, and neuropathy, all complications or any of them)
- HbA1c value < 7% and > 7%: A reasonable A1C goal according to American Diabetes Association Guidelines 2020 for many nonpregnant adults [4].
2.2.1. Assessment of Diabetic Complications
Assessment of Diabetic Kidney Disease (DKD)
Assessment of Diabetic Retinopathy
Assessment of Diabetic Neuropathy
2.2.2. Laboratory Analysis
2.2.3. MALDI-TOF MS Profiling
Sample Pretreatment
MALDI-TOF MS Analysis
nanoLC MALDI-TOF/TOF MS Identification of Discriminatory Peaks
2.2.4. Statistical Analysis
3. Results
4. Discussion
5. Conclusions
Author Contributions
Funding
Institutional Review Board Statement
Informed Consent Statement
Conflicts of Interest
References
- Diaz-Valencia, P.A.; Bougnères, P.; Valleron, A.J. Global epidemiology of type 1 diabetes in young adults and adults. A systematic review. BMC Public Health 2015, 15, 255. [Google Scholar] [CrossRef]
- Araszkiewicz, A.; Zozulinska-Ziolkiewicz, D.; Trepinska, M.; Wierusz-Wysocka, B. Knowledge after five-day teaching program in intensive insulin therapy performed at the onset of type 1 diabetes influence the development of late diabetic complications. Diabetes Res. Clin. Pract. 2008, 81, 61–67. [Google Scholar] [CrossRef]
- Liu, C.W.; Bramer, L.; Webb-Robertson, B.J.; Waugh, K.; Rewers, M.J.; Zhang, Q. Temporal profiles of plasma proteome during childhood development. J. Proteom. 2017, 30, 321–328. [Google Scholar] [CrossRef] [PubMed] [Green Version]
- Hariri, M.A.; Elmedawar, M.; Zhu, R.; Jaffa, M.A.; Zhao, J.; Mirzaei, P.; Ahmed, A.; Kobeissy, F.; Ziyadeh, F.N.; Mechref, Y.; et al. Proteome profiling in the aorta and kidney of type 1 diabetic rats. PLoS ONE 2017, 12, e0187752. [Google Scholar] [CrossRef] [Green Version]
- Merchant, M.L.; Klein, J.B. Proteomics and diabetic nephropathy. Semin. Nephrol. 2007, 27, 627–636. [Google Scholar] [CrossRef] [PubMed]
- Polish Diabetes AssociationStandards of Medical Care in Diabetesd. Diabetes Care 2020, 6, 1–106.
- Matuszewska, E.; Matysiak, J.; Brȩborowicz, A.; Olejniczak, K.; Kycler, Z.; Kokot, Z.J.; Matysiak, J. Proteomic features characterization of Hymenoptera venom allergy. Allergy Asthma Clin. Immunol. 2019, 15, 77. [Google Scholar] [CrossRef]
- Nordwall, M.; Arnqvist, H.J.; Bojestig, M.; Ludvigsson, J. Good glycemic control remains crucial in prevention of late diabetic complications – the Linköping Diabetes Complications Study. Pediatric Diabetes 2009, 10, 168–176. [Google Scholar] [CrossRef] [PubMed]
- Zhang, L.; Krzentowski, G.; Albert, A.; Lefebvre, P.J. Risk of Developing Retinopathy in Diabetes Control and Complications Trial Type 1 Diabetic Patients With Good or Poor Metabolic Control. Diabetes Care 2001, 24, 1275–1279. [Google Scholar] [CrossRef] [PubMed] [Green Version]
- Hoferab, S.E.; Bennettsc, B.K.; Chana, A.; Hollowaya, B.; Karschimkusd, C.J.; Jenkinsd, A.; Silinkae, M.; CDonaghueae, K. Association between PON 1 polymorphisms, PON activity and diabetes complications. J. Diabetes Its Complicat. 2006, 20, 322–328. [Google Scholar] [CrossRef] [PubMed]
- Løstergaard, J.A.; Ruseva, M.M.; Malik, T.H.; Hoffmann-Petersen, I.T.; Pickering, M.C.; Thiel, S.; Hansen, T.K. Increased Autoreactivity of the Complement-Activating Molecule Mannan-Binding Lectin in a Type 1 Diabetes Model. J. Diabetes Res. 2016, 2016, 1–7. [Google Scholar] [CrossRef] [PubMed] [Green Version]
- Burch, T.C.; Morris, M.A.; Campbell-Thompson, M.; Pugliese, A.; Nadler, J.L.; Nyalwidhe, J.O. ProteomicAnalysisofDiseaseStratified HumanPancreasTissueIndicatesUnique SignatureofType1Diabetes. PLoS ONE 2015, 10, e0135663. [Google Scholar] [CrossRef]
- Nyalwidhe, J.O.; Grzesik, W.J.; Burch, T.C.; Semeraro, M.L.; Waseem, T.; Gerling, I.C.; Mirmira, R.G.; Morris, M.A.; Nadler, J.L. Comparative quantitative proteomic analysis of disease stratified laser captured microdissected human islets identifies proteins and pathways potentially related to type 1 diabetes. PLoS ONE 2017, 12, e0183908. [Google Scholar] [CrossRef] [PubMed] [Green Version]
- Zhang, Q.; Fillmore, T.L.; Schepmoes, A.A.; Clauss, T.R.W.; Gritsenko, M.A.; Mueller, P.W.; Rewers, M.; Atkinson, M.A.; Smith, R.D.; Metz, T.O. Serum proteomics reveals systemic dysregulation of innate immunity in type 1 diabetes. J. Exp. Med. 2013, 210, 191–203. [Google Scholar] [CrossRef] [PubMed] [Green Version]
- De Oliveira, V.N.; Limaneto, A.B.M.; Vantilburg, M.F.; Deoliveira, A.C.; Moreira, M.; Duartepintolobo, M.; Rondina, D.; Fernandes, V.O.; Diasrangelmontenegro, A.P.; Montenegrojúnior, R.M.; et al. Proteomic analysis to identify candidate biomarkers associated with type 1 diabetes. Diabetes Metab. Syndr. Obes. 2018, 11, 289–301. [Google Scholar] [CrossRef] [PubMed] [Green Version]
- Rowe, P.; Wasserfall, C.; Croker, B.; Thompson, M.C.-; Pugliese, A.; Atkinson, M.; Schatz, D. IncreasedComplementActivationin HumanType1DiabetesPancreata. Diabetes Care 2013, 36, 3815–3817. [Google Scholar] [CrossRef] [PubMed] [Green Version]
- Vontoerne, C.; Laimighofer, M.; Achenbach, P.; Beyerlein, A.; Lasherasgala, T.; Krumsiek, J.; Theis, F.J.; Ziegler, A.G.; Hauck, S.M. Peptide serum markers in islet autoantibody-positive children. Diabetologia 2017, 60, 287–295. [Google Scholar] [CrossRef] [PubMed] [Green Version]
- García-Ramírez, M.; Canals, F.; Hernández, C.; Colomé, N.; Ferrer, C.; Carrasco, E.; García-Arumí, J.; Simó, R. Proteomic analysis of human vitreous fluid by fluorescencebased difference gel electrophoresis (DIGE): A new strategy for identifying potential candidates in the pathogenesis of proliferative diabetic retinopathy. Diabetologia 2007, 50, 1294–1303. [Google Scholar]
- Moszak, M.; Klupczynska, A.; Kanikowska, A.; Kokot, Z.J.; Zawada, A.; Grzymisławska, M.; Grzymisławski, M. The influence of 3-week body mass reduction program on the metabolic parameters and free amino acid profiles in adult Polish people with obesity. Adv. Clin. Exp. Med. 2018, 27, 749–757. [Google Scholar] [CrossRef]
- Zhi, W.; Sharma, A.; Purohit, S.; Miller, E.; Bode, B.; Anderson, S.W.; Reed, J.C.; Steed, R.D.; Steed, L.; Hopkins, D.; et al. Discovery and Validation of Serum Protein Changes in Type 1 Diabetes Patients Using High Throughput Two Dimensional Liquid Chromatography-Mass Spectrometry and Immunoassays. Mol. Cell. Proteom. 2011, 10, M111.02203–M111.02210. [Google Scholar] [CrossRef] [PubMed] [Green Version]


| Variable | Median (IQR) |
|---|---|
| Sex [M/F], n (%) | 50 (48.5)/ 53 (51.5) |
| Age [y] | 34 (30–42) |
| DD [y] | 17 (12–23) |
| IFI [y] | 12 (8–18) |
| WHR [n] | 0.9 (0.8–0.9) |
| BMI [kg/m2] | 26 (23–29) |
| TBF [kg] | 19 (14–27) |
| VF [n] | 5 (3–8) |
| DDI [µ/kg/d] | 0.5 (0.4–0.6) |
| HbA1c [%] | 8 (7–9) |
| AST [U/L] | 19 (16–24) |
| ALT [U/L] | 19 (14–26) |
| Creatynine, [μmol/L] | 80 (71–88) |
| eGFR [mL/min/1.73 m2] | 88 (77–90) |
| hsCRP [mg/dL] | 2 (1–3) |
| T-ch [mmol/L] | 48 (42–54) |
| TAG [mmol/L] | 1 (1–2) |
| HDL-ch [mmol/L] | 2 (1–2) |
| LDL-ch [mmol/L] | 3 (2–3) |
| non-HDL-c [mmol/L] | 3 (3–4) |
| Complications | Incidence Frequency in Numbers (n = 103) | Incidence Frequency as a Ratio (103 = 100%) |
|---|---|---|
| Diabetic retinopathy | 39 | 37.9% |
| Diabetic renal disease | 9 | 8.7% |
| Autonomic neuropathy | 21 | 20.4% |
| Peripheral neuropathy | 32 | 31.1% |
| The group with any complications | 54 | 52.4 |
| Value | EBF N = 46 | NBF N = 57 | EBF/NBF P < 0.05 | HbA1c > 7% N = 80 | HbA1c < 7% N = 23 | HbA1cp < 0.05 | PofC N = 55 | AofC N = 48 | PofC/ AofC P < 0.05 |
|---|---|---|---|---|---|---|---|---|---|
| Age [y] | 35.0 (31.0–46.0) | 33.0 (29.0–40.0) | 0.09 | 34.0 (25.0–40.0) | 35.0 (31.0–42.0) | 0.64 | 38.0 (32.0–47.0) | 32.0 (24.0–37.0) | 0.00 |
| Sex [M/F] | 23/23 | 27/30 | 0.82 | 35/45 | 15/8 | 0.07 | 25/30 | 25/23 | 0.51 |
| DD [y] | 18.0 (12.0–23.5) | 16.0 (11.0–23.0) | 0.90 | 15.0 (11.0–20.0) | 19.0 (7.0–21.0) | 0.38 | 20.0 (15.0–29.0) | 13.0 (8.0–17.0) | 0.00 |
| TBF [kg] | 27.6 (23.1–33.2) | 14.1 (10.9–18.2) | 0.00 | 21.7 (14.1–29.7) | 17.3 (11.8–20.0) | 0.07 | 20.0 (14.1–27.1) | 18.2 (13.5–25.0) | 0.32 |
| BMI [kg/m2] | 29.3 (27.8–30.6) | 23.7 (21.4–25.7) | 0.00 | 27.1 (24.0–29.8) | 24.2 (22.1–28.3) | 0.06 | 26.4 (23.4–30.3) | 27.1 (23.0–28.8) | 0.66 |
| VF [n] | 8.0 (6.5–10.0) | 4.0 (2.0–5.0) | 0.00 | 5.0 (3.0–8.0) | 6.0 (3.0–7.0) | 0.93 | 6.0 (4.0–8.0) | 5.0 (2.0–7.0) | 0.12 |
| WHR [n] | 0.9 (0.8–0.9) | 0.8 (0.8–0.9) | 0.00 | 0.9 (0.8–0.9) | 0.8 (0.9–1.0) | 0.04 | 6.0 (4.0–8.0) | 5.0 (2.0–7.0) | 0.05 |
| HbA1c [%] | 8.4 (7.3–8.9) | 7.8 (6.8–8.9) | 0.18 | 8.9 (8.4–9.8) | 6.5 (6.2–6.8) | 0.00 | 7.9 (6.9–9.0) | 8.4 (7.2–8.9) | 0.75 |
| AST [IU/L] | 19.0 (15.5–27.0) | 19.0 (16.0–22.0) | 0.54 | 18.0 (16.0–27.0) | 19.0 (15.0–22.0) | 0.66 | 19.0 (15.0–24.0) | 19.0 (16.0–27.0) | 0.38 |
| ALT [IU/L] | 21.0 (14.0–28.5) | 17.0 (14.0–25.0) | 0.13 | 18.0 (13.0–27.0) | 21.0 (15.0–25.0) | 0.61 | 18.0 (14.0–24.0) | 21.0 (14.0–29.0) | 0.25 |
| Creatinine [µmol/L] | 70.7 (61.9–88.4) | 77.8 (70.7–88.4) | 0.19 | 70.7 (61.9–79.6) | 79.6 (70.7–88.4) | 0.14 | 79.6 (70.7–88.4) | 79.6 (70.7–88.4) | 0.18 |
| GFR [mL/min/1.72 m2] | 88.2 (82.2–90.0) | 86.0 (75.7–90.0) | 0.31 | 90.0 (75.5–90.0) | 84.1 (76.5–90.0) | 0.38 | 83.1 (73.4–90.0) | 90.0 (84.5–90.0) | 0.01 |
| CRP [mg/dL] | 2.2 (1.0–4.5) | 1.2 (0.6–2.1) | 0.00 | 2.1 (1.0–4.1) | 1.0 (0.4–2.0) | 0.03 | 1.4 (0.7–3.1) | 1.7 (0.8–3.1) | 0.85 |
| TCh [mmol/L] | 4.9 (4.5–5.7) | 4.6 (3.9–5.1) | 0.00 | 4.8 (4.2–5.3) | 4.7 (4.1–5.5) | 0.96 | 4.9 (4.3–5.4) | 4.6 (4.0–5.2) | 0.31 |
| TAG [mmol/L] | 1.2 (1.0–1.8) | 0.9 (0.7–1.3) | 0.00 | 1.1 (0.9–1.7) | 0.9 (0.7–1.2) | 0.00 | 1.3 (0.9–1.5) | 1.3 (0.8–1.4) | 0.45 |
| HDL-ch [mmol/L] | 1.5 (1.3–1.9) | 1.7 (1.4–2.0) | 0.11 | 1.6 (1.3–1.9) | 1.7 (1.4–2.3) | 0.13 | 1.6 (1.3–2.0) | 1.6 (1.3–2.0) | 0.96 |
| LDL-ch [mmol/L] | 2.7 (2.5–3.3) | 2.4 (1.9–2.9) | 0.01 | 2.6 (2.1–3.1) | 2.5 (1.9–3.4) | 0.84 | 2.7 (2.6–3.2) | 2.5 (1.9–3.1) | 0.18 |
| non-HDL-ch [mmol/L] | 3.2 (2.9–4.0) | 2.7 (2.2–3.3) | 0.00 | 3.1 (2.6–3.6) | 2.7 (2.3–3.9) | 0.41 | 3.2 (2.7–3.6) | 2.8 (2.4–3.8) | 0.33 |
| ACR [mg/d] | 3.5 (2.5–5.2) | 3.8 (2.7–5.4) | 0.82 | 3.8 (2.5–5.4) | 3.7 (2.9–5.3) | 0.88 | 4.3 (2.9–8.1) | 3.3 (2.3–4.3) | 0.00 |
| Division Due to Excess Fat | ||||
|---|---|---|---|---|
| Model | Cross Validation [%] | Recognition Capability [%] | External Validation—Correct Classified Part of Valid Spectra [%]—TEST | External Validation—Correct Classified Part of Valid Spectra [%]—CONTROL |
| GA | 49.5 | 93.8 | 52.9 | 82.1 |
| SNN | 59.2 | 67.1 | 60.8 | 38.5 |
| QC | 58.0 | 63.4 | 43.1 | 74.4 |
| Identified peaks (m/z) classified as discriminatory based on GA | ||||
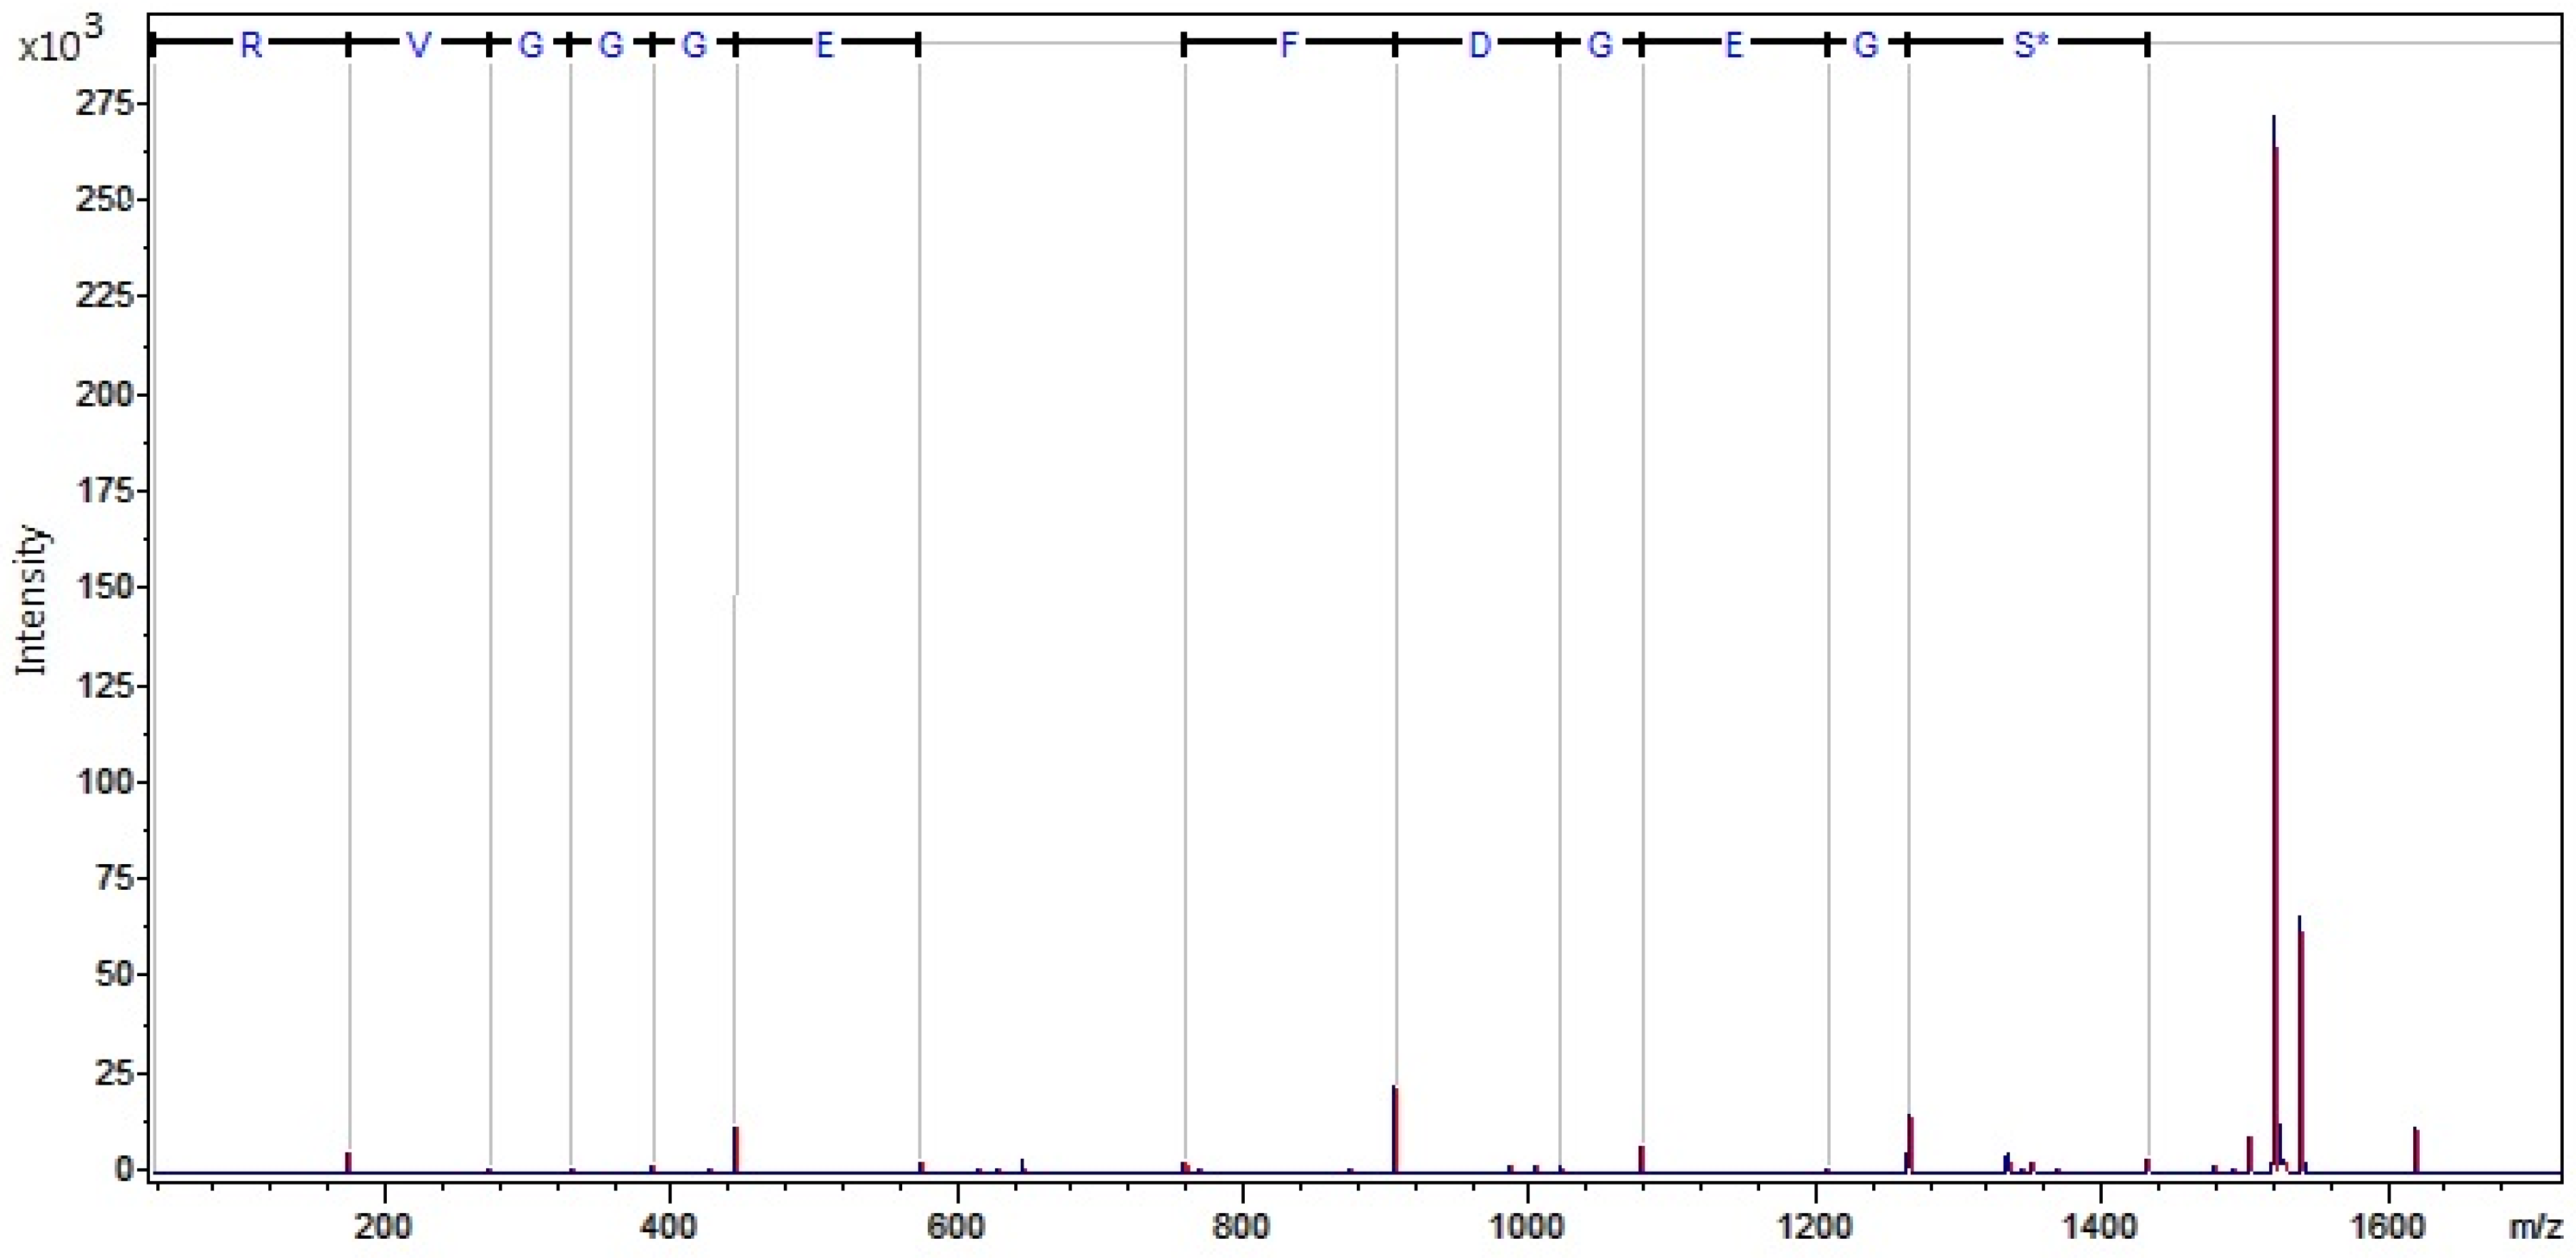
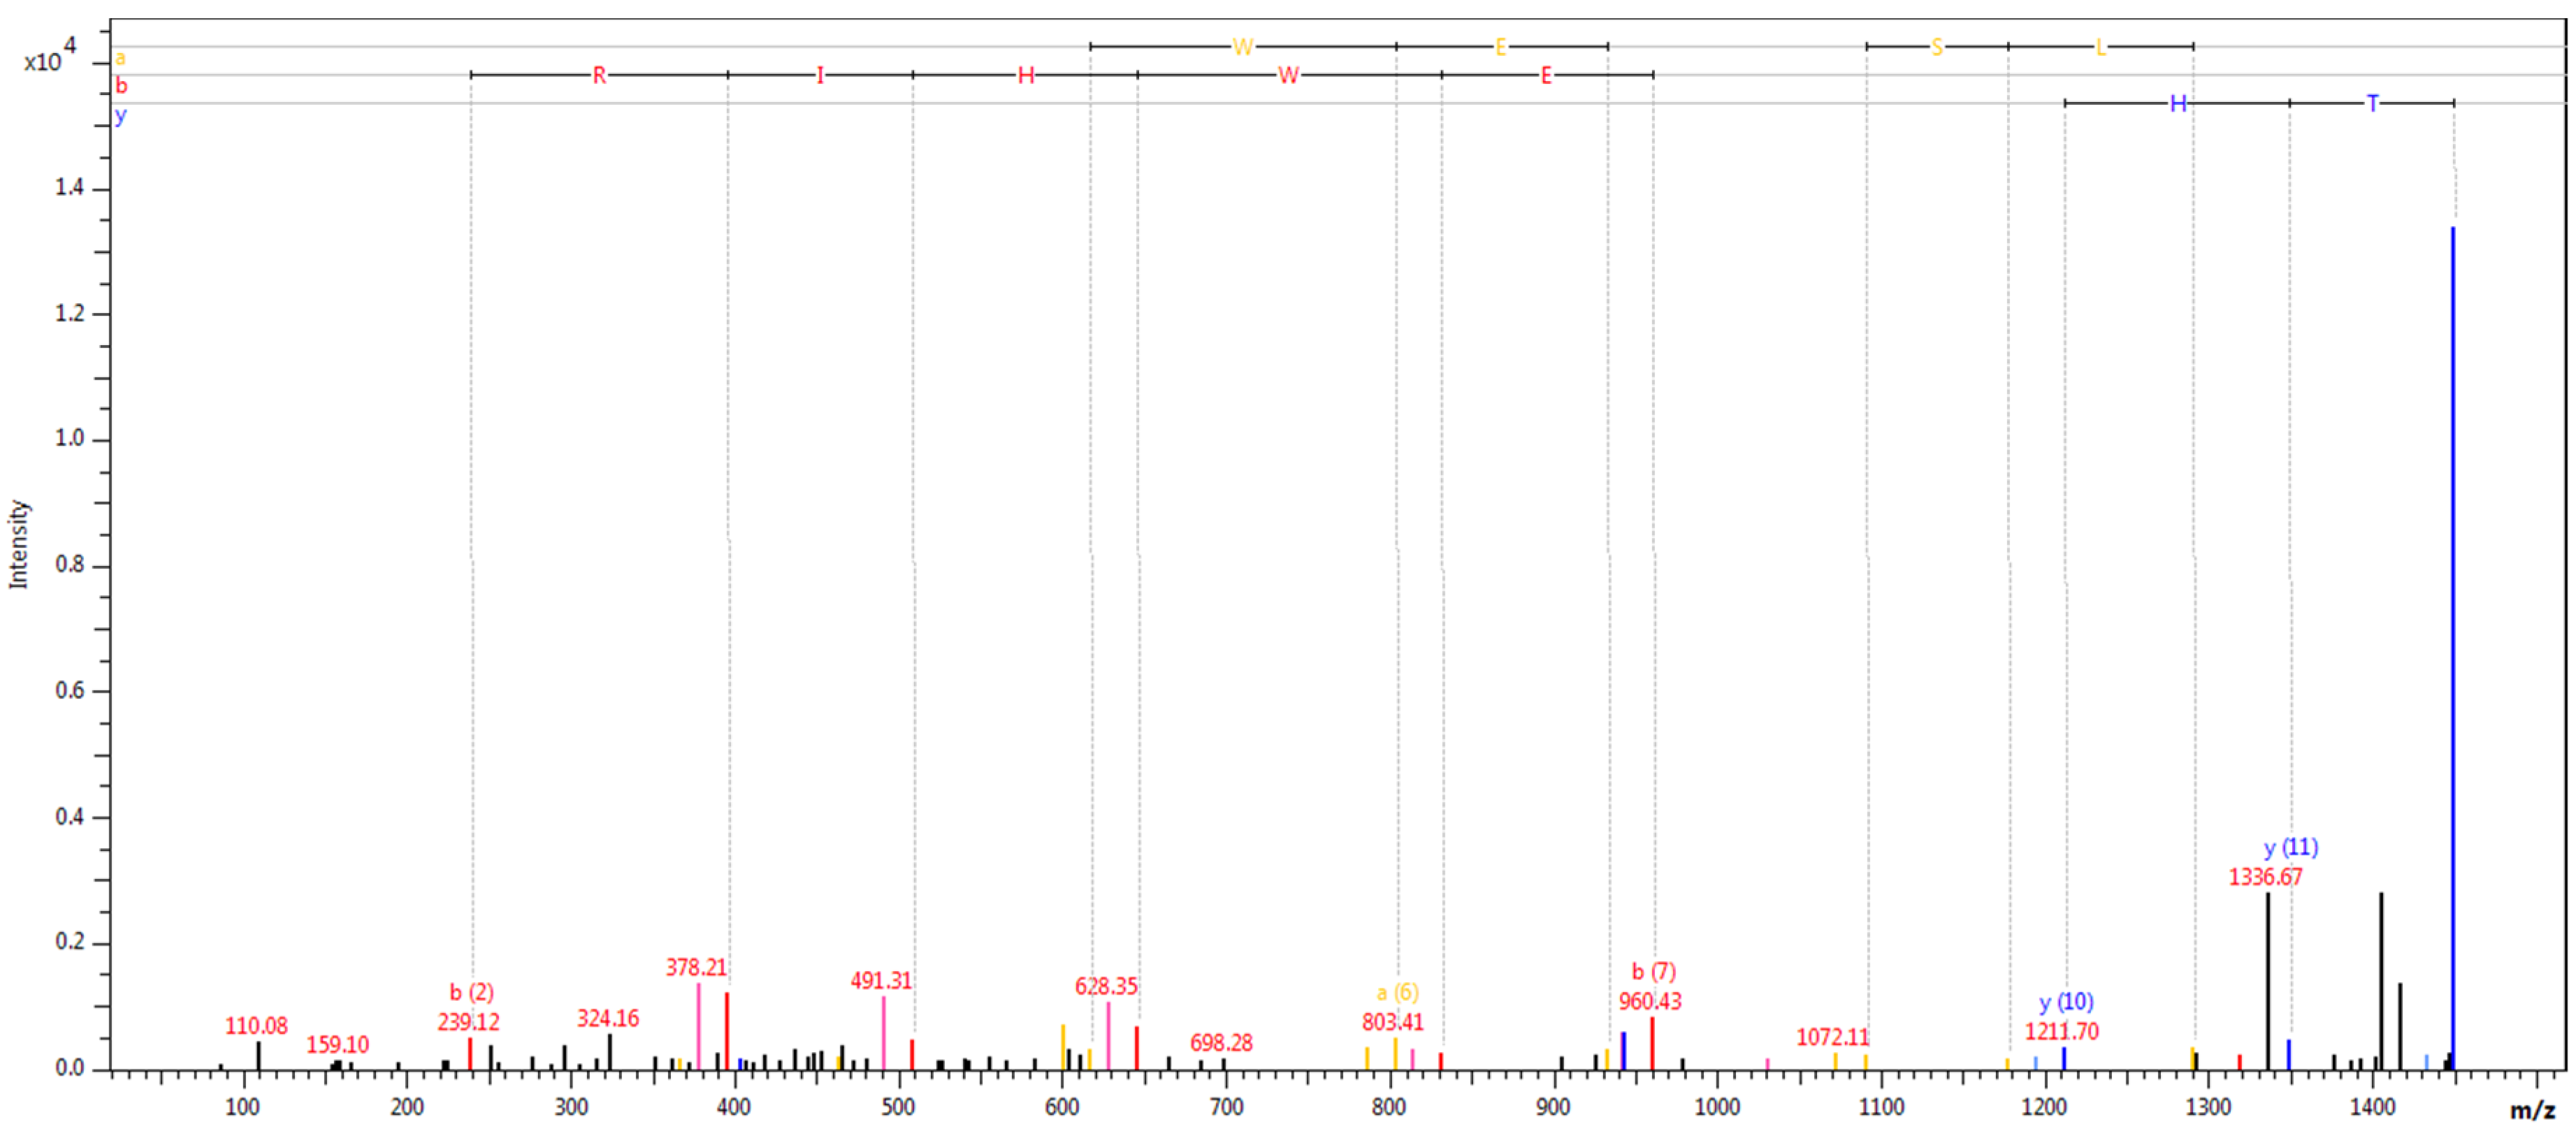
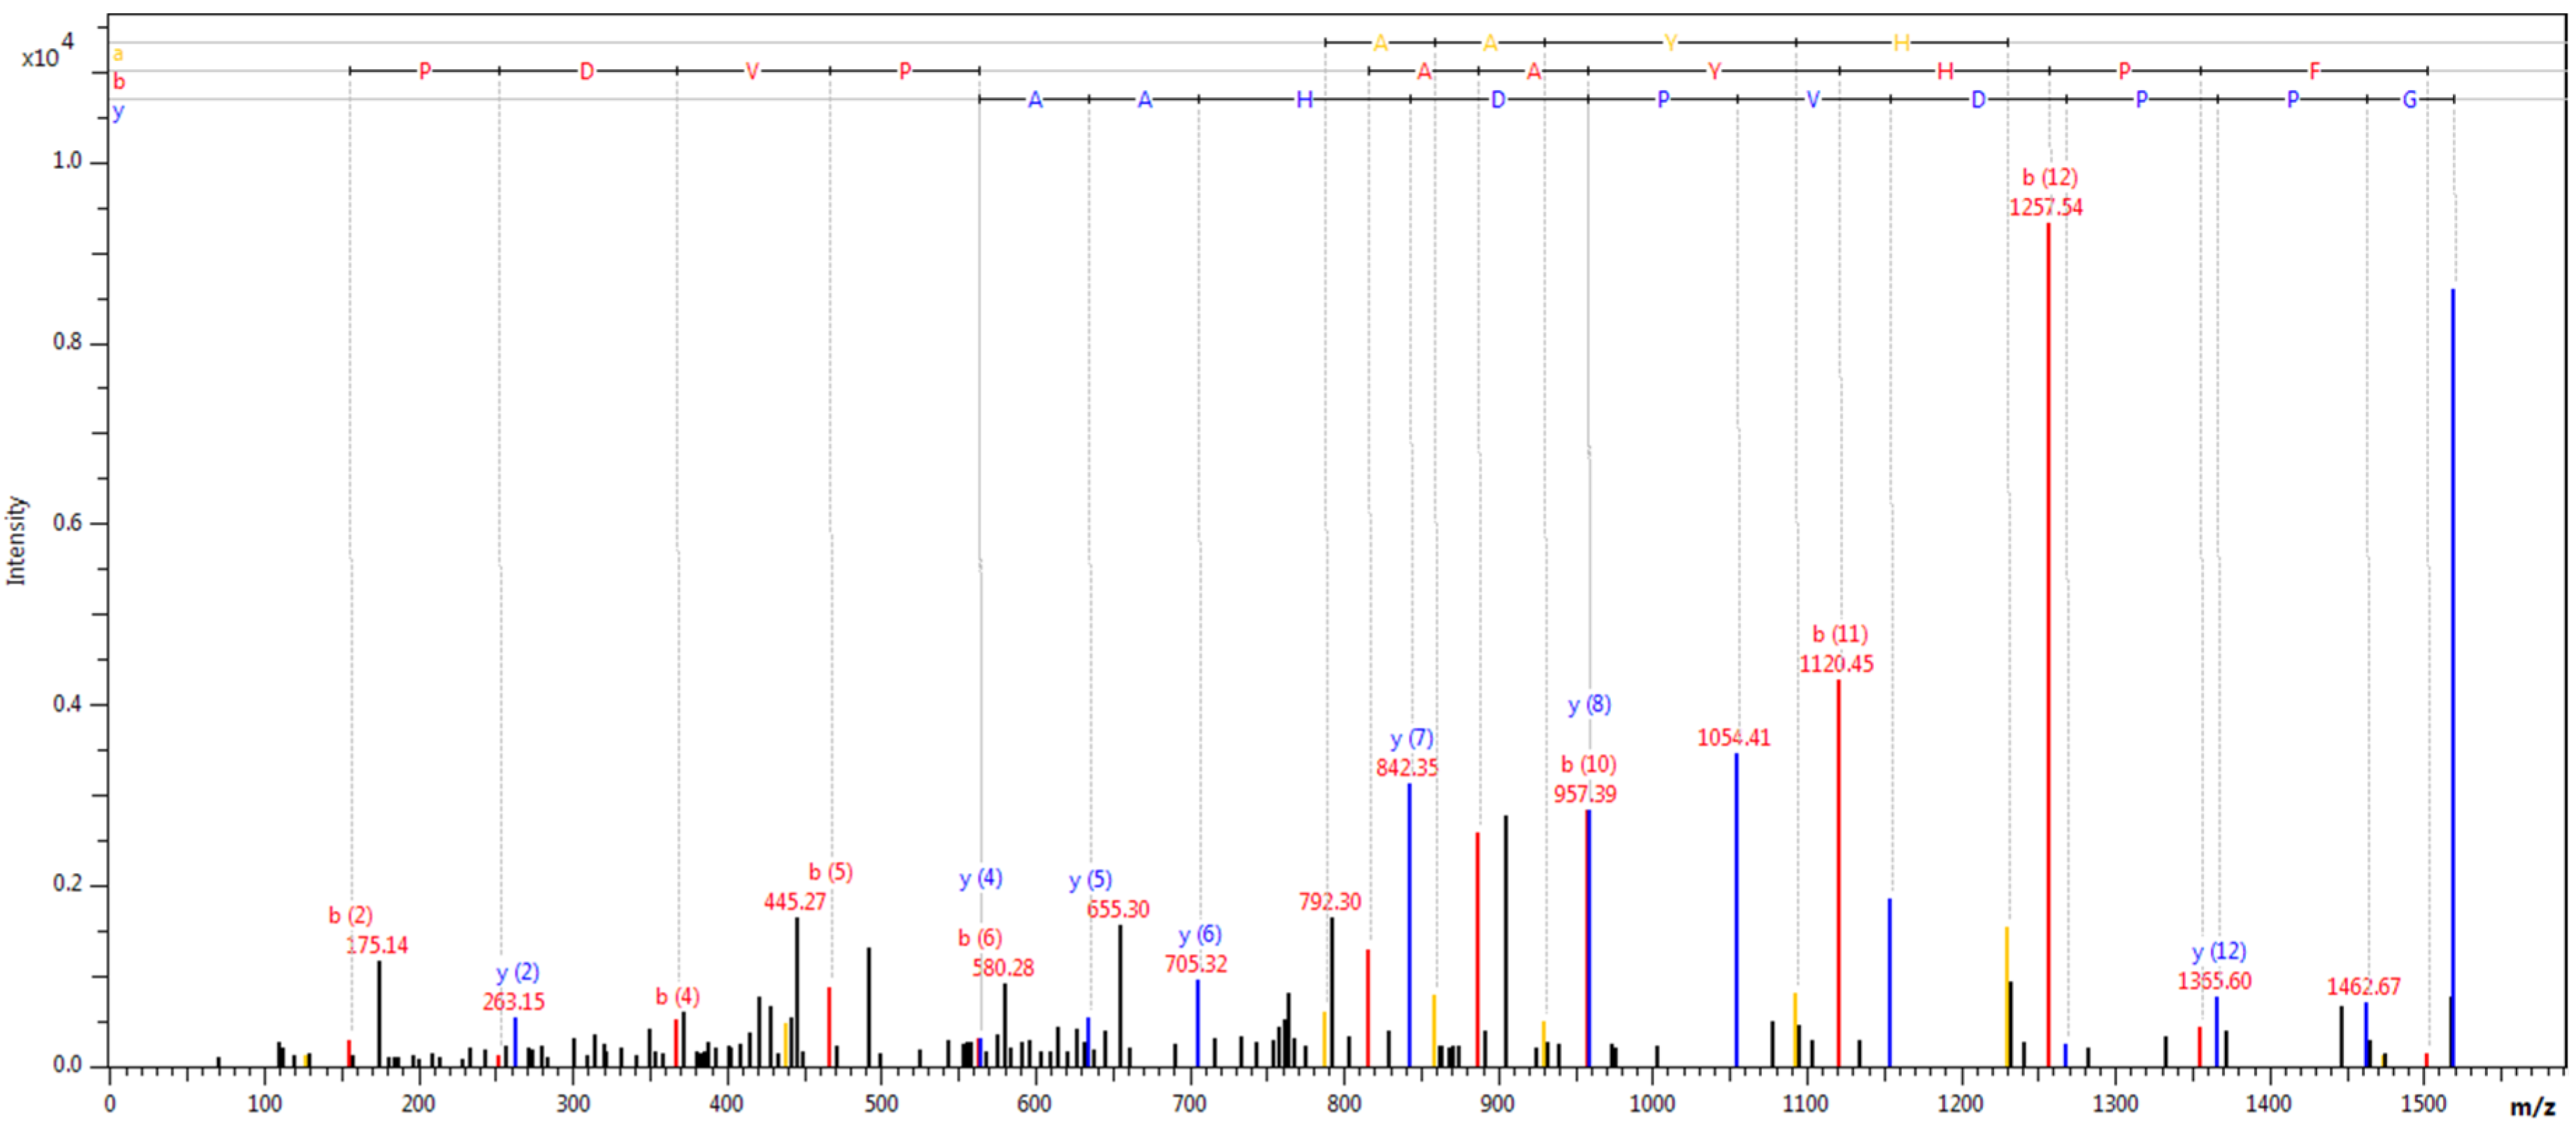
| 1537.88 | fibrinogen alpha chain | |||
| 1519.99 | complement C3 (oxidation) | |||
| 1449.61 | complement C4A | |||
| Identified peaks (m/z) classified as discriminatory based on SNN | ||||
| 1519.99 | complement C3 (oxidation) | |||
| 1537.88 | fibrinogen alpha chain | |||
| Identified peaks (m/z) classified as discriminatory based on QC | ||||
| 1435.73 | complement C4A | |||
| 1449.61 | complement C4A | |||
| 1519.99 | complement C3 (oxidation) | |||
| 1537.88 | fibrinogen alpha chain | |||
| Division Due to Diabetes Control (HbA1c > 7%) | ||||
|---|---|---|---|---|
| Model | Cross Validation [%] | Recognition Capability [%] | External Validation—Correct Classified Part of Valid Spectra [%]—TEST | External Validation—Correct Classified Part of Valid Spectra [%]—CONTROL |
| GA | 62.2 | 85.8 | 63.6 | 30.6 |
| SNN | 64.6 | 53.7 | 0 | 88.9 |
| QC | 66.9 | 66.9 | 56.8 | 55.6 |
| Identified peaks (m/z) classified as discriminatory based on GA | ||||
| 1537.88 | fibrinogen alpha chain | |||
| 1449.61 | complement C4A | |||
| 1520.00 | complement C3 (oxidation) | |||
| Identified peaks (m/z) classified as discriminatory based on SNN | ||||
| 1519.99 | complement C3 (oxidation) | |||
| 1537.88 | fibrinogen alpha chain | |||
| Identified peaks (m/z) classified as discriminatory based on QC | ||||
| 1537.88 | fibrinogen alpha chain | |||
| Division Due to Diabetes Complications | ||||
|---|---|---|---|---|
| Model | Cross Validation [%] | Recognition Capability [%] | External Validation—Correct Classified Part of Valid Spectra [%]—TEST | External Validation—Correct Classified Part of Valid Spectra [%]—CONTROL |
| GA | 48.2 | 84.6 | 46.2 | 67.6 |
| SNN | 48.1 | 65.6 | 53.8 | 79.4 |
| QC | 38.0 | 63.1 | 46.2 | 58.8 |
| Identified peaks (m/z) classified as discriminatory based on GA | ||||
| 1537.88 | fibrinogen alpha chain | |||
| 1617.79 | fibrinogen alpha chain (peak 1537 phosphorylation) | |||
| 1435.73 | complement C4A | |||
| Identified peaks (m/z) classified as discriminatory based on SNN | ||||
| 1537.88 | fibrinogen alpha chain | |||
| 1435.73 | complement C4A | |||
| 1520.00 | complement C3 (oxidation) | |||
| 1617.79 | fibrinogen alpha chain (peak 1537 phosphorylation) | |||
| Identified peaks (m/z) classified as discriminatory based on QC | ||||
| 1537.88 | fibrinogen alpha chain | |||
Publisher’s Note: MDPI stays neutral with regard to jurisdictional claims in published maps and institutional affiliations. |
© 2021 by the authors. Licensee MDPI, Basel, Switzerland. This article is an open access article distributed under the terms and conditions of the Creative Commons Attribution (CC BY) license (http://creativecommons.org/licenses/by/4.0/).
Share and Cite
Zawada, A.; Naskręt, D.; Matuszewska, E.; Kokot, Z.; Grzymisławski, M.; Zozulińska-Ziółkiewicz, D.; Dobrowolska, A.; Matysiak, J. MALDI-TOF Protein Profiling Reflects Changes in Type 1 Diabetes Patients Depending on the Increased Amount of Adipose Tissue, Poor Control of Diabetes and the Presence of Chronic Complications. Int. J. Environ. Res. Public Health 2021, 18, 2263. https://doi.org/10.3390/ijerph18052263
Zawada A, Naskręt D, Matuszewska E, Kokot Z, Grzymisławski M, Zozulińska-Ziółkiewicz D, Dobrowolska A, Matysiak J. MALDI-TOF Protein Profiling Reflects Changes in Type 1 Diabetes Patients Depending on the Increased Amount of Adipose Tissue, Poor Control of Diabetes and the Presence of Chronic Complications. International Journal of Environmental Research and Public Health. 2021; 18(5):2263. https://doi.org/10.3390/ijerph18052263
Chicago/Turabian StyleZawada, Agnieszka, Dariusz Naskręt, Eliza Matuszewska, Zenon Kokot, Marian Grzymisławski, Dorota Zozulińska-Ziółkiewicz, Agnieszka Dobrowolska, and Jan Matysiak. 2021. "MALDI-TOF Protein Profiling Reflects Changes in Type 1 Diabetes Patients Depending on the Increased Amount of Adipose Tissue, Poor Control of Diabetes and the Presence of Chronic Complications" International Journal of Environmental Research and Public Health 18, no. 5: 2263. https://doi.org/10.3390/ijerph18052263