
Australian Experiences of Out-of-Pocket Costs and Financial Burden Following a Cancer Diagnosis: A Systematic Review

 , ,
, ,
Abstract
:1. Introduction
2. Materials and Methods
2.1. Search Strategy
2.2. Inclusion and Exclusion Criteria
2.3. Screening and Data Extraction
2.4. Data Synthesis and Quality

| Author(s)-Year | Participant Sample Characteristics | Study Design | Data Source | Outcome Measures | Out-of-Pocket Costs (Direct and/or Indirect) | Key Findings |
|---|---|---|---|---|---|---|
| Boyages, 2017 [8] | Total of 361 women diagnosed with breast cancer (BC), or BC and lymphoedema (LE) were recruited by Breast Cancer Network Australia and Australasian Lymphology Association. | Cross-sectional online survey | Self-reported | Study-specific survey items Lymphoedema severity scale | Mean OOP cost of LE was AUD 977 (s.d. AUD 111; range AUD 0–AUD 12,000) Average cost of garments per year increased with lymphoedema severity, from AUD 207 for subclinical severity and AUD 1400 for severe severity. | Financial burden Coping mechanisms BC and BC+LE pts reported spending less on social activities (24% vs. 24%, respectively) and holidays (21% vs. 19%, respectively). Household income Among the patients, 39% of BC and 34% of BC+LE pts reported reduction in income. Impact of financial burden BC+LE pts indicated that their BC diagnosis had significantly affected them financially compared with BC pts only (p < 0.020). |
| Callander et al., 2019 [9] | Total of 25,553 adult pts diagnosed with cancer in Queensland between 1 July 2011 and 30 June 2012 were recorded by the Queensland Cancer Registry. | Cohort | Medical Benefits Scheme, Pharmaceutical Benefits Scheme | CancerCostMod | Indigenous vs. non-Indigenous 0–12 months: AUD 401 vs. AUD 1074 13–24 months: AUD 200 vs. AUD 484 25–36 months: AUD 181 vs. AUD 441 | Impact of OOP cost Indigenous status Indigenous status was a significant predictor of OOP expenditure (p < 0.001), irrespective of demographic and social characteristics being adjusted for. Indigenous pts with cancer on average accessed 236 services per person. If Indigenous pts had the same rate of service use as non-Indigenous pts, this would increase to 309 services per person. Socioeconomic status Pts in Q4 and Q5 paid significantly more in OOP expenditure than pts in Q1. |
| Callander et al., 2019 [10] | Total of 25,553 adult pts diagnosed with cancer in Queensland between 1 July 2011 and 30 June 2012 were recorded by the Queensland Cancer Registry. | Cohort | Medical Benefits Scheme, Pharmaceutical Benefits Scheme | CancerCostMod | Indigenous vs. non-Indigenous 0–6 months: AUD 269 vs. AUD 732 7–12 months: AUD 110 vs. AUD 359 | Impact of OOP cost Indigenous status After adjusting for confounding factors, Indigenous Australians were 61% less likely to accrue patient co-payments 0–6 months post-diagnosis. They were also 63% less likely to accrue patient co-payments at 7–12 months post-diagnosis. |
| Dussel et al., 2011 [11] | Total of 89 bereaved Australian parents whose child was cared for at Royal Children’s Hospital, Melbourne between 1996 and 2004. | Cross-sectional | Self-reported | Study-specific survey items Degree of financial hardship National Median Equivalised Income (NMEI) | NR | Financial burden Coping mechanisms Fundraising (33%) followed by reduction in consumption (25%) and borrowing money (22%) were coping mechanisms. Employment status Among the Australian families, 88% reported substantial work disruptions, with 49% quitting their job. Household income More than one-third of Australians families lost ≥ 40% of their income, with 22% falling below the poverty line. Pts from the lowest income categories experienced the greatest income loss. Impact of financial burden Among the Australian families, 39% reported overall financial hardship due to their child’s illness. |
| Gordon et al., 2019 [12] | Total of 289 men diagnosed with prostate cancer were recruited from the Prostate Cancer Foundation of Australia. | Cross-sectional, online survey | Self-reported | Study-specific survey items | Median OOP for cancer treatment was AUD 8000 (IQR AUD 14,000) | Financial burden Coping mechanisms Drawing on savings (38%), selling assets (8%) and increasing credit card limits (22%) were coping mechanisms used to pay for treatment. Employment status Among the men, 39% reported that they were in the workforce at the time of the diagnosis, and nearly 25% stated they chose an earlier retirement age and had stopped work due to their diagnosis. On average, those who had retired early had retired 4–5 years earlier than planned. Impact of financial burden Among the men, 22% found the cost of treating their prostate cancer caused a “great deal” of distress. |
| Gordon et al., 2017 [13] | Total of 542 colorectal cancer survivors were recruited through the Queensland Cancer Registry between January 2010 and September 2011. | Cohort | Self-reported | Household Income and Labour Dynamics in Australia (HILDA) survey degree of financial hardship | NR | Financial burden Employment status Cancer survivors were more likely to report not being financially comfortable if they had ceased or decreased employment, compared to those who maintained or increased employment participation (OR 1.66, 95% CI 1.12–2.44; p < 0.05). Higher proportion of workers reported financial strain at 6 months compared to 12 months (15% vs. 7%, respectively; p = 0.003). |
| Gordon et al., 2017 [14] | Total of 5673 pts diagnosed with at least one histopathological keratinocyte cancer or melanoma were recruited from the Queensland electoral roll between 2010 and 2011. | Cohort | Medical Benefits Scheme, Pharmaceutical Benefits Scheme | QSkin Sun and Health study | Melanoma: Mean OOP costs -1 melanoma: AUD 559 (s.d. AUD 549) - ≥1 melanoma: AUD 1151 (s.d. AUD 779) Keratinocyte cancers: Mean OOP costs -low frequency: AUD 407 (s.d. AUD 598) -high frequency: AUD 1520 (s.d. AUD 1698) Skin lesions: Avg. costs ranging from AUD 193–AUD 377 | NR |
| Gordon et al., 2018 [15] | Total of 840 pts diagnosed with either melanoma, prostate, breast, colorectal or lung cancer from the QSkin Sun and Health Study were recruited, at random, from the Queensland electoral roll between 2010 and 2011. | Cohort | Medicare, Queensland Cancer Registry | QSkin Sun and Health study | Median OOP costs: AUD 4192 breast cancer, AUD 3175 prostate cancer, AUD 1078 lung cancer. Therapeutic procedures (median: AUD 2062) were largest OOP expenses for pts, followed by professional attendances (AUD 546) and PBS medicines (AUD 428). | NR |
| Gordon et al., 2020 [16] | Total of 204 pts diagnosed with neuroendocrine tumours were recruited from hospital clinics in Queensland, Victoria and New South Wales, and the Unicorn Foundation. | Cross-sectional, survey | Self-reported | Study-specific survey items EuroQol 5-dimension 5-level (EQ-5D-5L), Comprehensive Financial Toxicity (COST) tools | Mean OOP costs were AUD 1698 (s.d. AUD 2132). Mean OOP costs for medical tests was AUD 376 (s.d. AUD 722), travel-related expenses AUD 289 (s.d. AUD 559) and specialists visits AUD 225 (s.d. AUD 342). | Financial burden Employment status One-third of current workers reported that cancer had prevented them from securing employment, and another third reported a decrease in their work hours. Among the pts, 17% said colleagues treated them differently, 16% had not told their employers or work colleagues about their cancer, and 7% were overlooked for promotion. One-third of current workers said they would retire early due to their cancer. Place of residence Among the rural pts, 30% reported travel and accommodation as their largest expense, compared to urban pts (13%). Private health insurance More than two-thirds of pts had private health insurance and of those, 58% stated that insurance did not cover expected expenses. Pts with private health insurance paid more OOP costs than those without insurance for medical tests (18% vs. 7%, respectively) and specialist visits (11% vs. 5%). Treatment Among the pts, 31% reported that cost was a consideration in choosing their cancer treatment course, and 8% did not proceed with treatment due to cost. Among the pts, 60% purchased alternative therapies due to high cost of recommended treatment. Impact of financial burden Financial assistance One in five needed financial advice after their cancer diagnosis. Quality of life Overall mean health-related quality of life score for the EQ-5D-5L was 0.65 (s.d. 0.23). Poorer quality-of-life scores were significantly associated with a poorer financial toxicity score (mean 0.53, 95% CI 0.45–0.61; p = 0.01), two or more co-morbidities (mean 0.59, 95% CI 0.53–0.66; p = 0.02), younger age (mean 0.61, 95% CI 0.55–0.60; p = 0.02), not working due to cancer (mean 0.56, 95% CI 0.47–0.65; p = 0.03), and nausea/diarrhoea (mean 0.63, 95% CI 0.60–0.67; p = 0.01). |
| Hall et al., 2016 [17] | Total of 4299 haematological cancer survivors were recruited from 5 Australian state population-based cancer registries. | Cross-sectional, survey | Self-reported | Depression Anxiety and Stress Scale 21-item. | NR | Impact of financial burden Quality of life Survivors who had less income due to their cancer (OR 1.81, 95% CI 1.10–2.99; p = 0.004) and did not have time off work (OR 1.76, 95% CI 1.02–3.02; p = 0.012) had higher odds of reporting above normal levels of anxiety compared to their counterparts. Survivors who reported having to use their savings due to cancer diagnosis (OR 1.81, 95% CI 1.07–3.05; p = 0.006) or had difficulty paying their bills (OR 1.94, 95% CI 1.03–3.67; p = 0.012) had greater odds of experiencing above normal levels of depression. Survivors aged between 50 and 59 years at diagnosis (OR 2.69, 95% CI 1.10–6.56; p = 0.008) reported difficulties in paying their bills due to cancer (OR 1.94, 95% CI 1.03–3.67; p = 0.012) and having used up their savings due to cancer (OR 1.81, 95% CI 1.07–3.05; p = 0.006) had higher odds of reporting above normal levels of stress. |
| Hall et al., 2015 [18] | Total of 715 haematological cancer survivors were recruited from 4 Australian state population-based cancer registries. | Cross-sectional, survey | Self-reported | Survivors Unmet Needs Survey | NR | Financial burden Coping mechanisms Survivors having trouble meeting day-to-day expenses due to their cancer and treatment had higher odds of reporting a “high/very high” unmet need in relation to “dealing with feeling worried” than those who did not (OR 3.1, 95% CI 1.47–6.47; p = 0.003). Survivors who reported using up their savings due to cancer and treatment had higher odds of reporting a high level of need for “dealing with feeling tired” (OR 3.0, 95% CI 1.71–5.14; p < 0.001) and “coping with having a bad memory or lack of focus” compared to those survivors who did not (OR 2.3, 95% CI 1.07–5.02; p = 0.04). |
| McGrath, 2016 [19] | Total of 45 haematological cancer pts from regional, rural and remote areas of Queensland. | Cross-sectional, phone interviews, qualitative | Self-reported | Study-specific survey items | NR | Place of residence Food was described as a significant cost associated with travel and accommodation for specialist care. Parking at metropolitan hospitals was a significant expense. Many pts described it as being “trapped” without options, other than to pay the high cost of parking for both pts and their carers. Private health insurance For some pts with private health insurance being treated in the private hospital system, the “gap payments” were a problem. Treatment Follow-up treatment drugs after discharge from hospital, including the drugs for symptom relief, the immunosuppressant drugs, the steroids, and maintenance drugs were a significant expense. |
| McNeil 2018, [20] | Total of 196 adolescents and young adults aged 15–25 years receiving cancer care across Australia between September 2010 and December 2012. | Cohort survey | Self-reported | Study-specific survey items Psychosocial Assessment Tool, Likert scale | NR | Financial burden Employment status Among the AYAs, 45% reported they had been able to “get back on track” with work plans, 30% were back on track to some extent and 15% were not able to get back on track. Impact of financial burden Financial assistance Among the AYAs, 60% reported it was important for them to receive income support during treatment and 48% reported it was important after treatment. Of those AYAs who needed income support during treatment, 77% reported needing income support after treatment. The need for income support for AYAs during treatment was significantly associated with older age at diagnosis (OR 2.22, 95% CI 1.23–4.01, p < 0.01) and being unemployed (OR 3.29, 95% CI 1.28–8.45, p = 0.01). AYAs who indicated they did not need government income support reported financial assistance from other sources, including pre-existing employment structures, income protection, parents, and personal savings. |
| Newton et al., 2018 [21] | Total of 400 pts diagnosed with breast, lung, colorectal or prostate cancer who resided in rural regions of Western Australia (Great Southern Goldfields, South West and Midwest) were recruited through the Western Australia Cancer Registry. | Cross-sectional | Self-reported | Modified version of Paul et al.’s questionnaire Catastrophic spending defined as at least 10% of household income spent on health. | Median OOP cost of AUD 2179 (95% CI AUD 1873–AUD 2518) | Financial burden Employment status Among the pts, 19% reported a change in employment circumstances post-diagnosis. Household income One in ten pts experienced catastrophic spending on healthcare, with 7% reporting on OOP costs that equated to 10%–20% of their total household income, 4% reporting 20%–40% and 1% reporting more than 40%. |
| Paul et al., 2016 [22] | Total of 255 oncology pts were recruited from outpatient clinics at two large hospitals in Australia. | Cross-sectional, questionnaire | Self-reported | Study-specific survey items | NR | Financial burden Employment status Among the pts, 67% indicated a change in employment with permanent employment changes. The most frequently reported changes were reduced hours (23.1%), retirement (20.2%) and resigning or being unemployed (16.4%). Household income Among the pts, 63% reported reduced household income since their diagnosis, with a mean reduction in fortnightly income of AUD 752.2 (s.d. AUD 583.60). Private health insurance After adjusting for employment status and age, pts with private health insurance had higher odds of reporting financial factors to influence treatment decision making (OR 2.51, 95% CI 1.27–4.98; p < 0.05). Pts with private health insurance had significantly higher odds of reporting that financial factors had influenced their treatment decision making (OR 2.51, 95% CI 1.27–4.98; p < 0.05), even after adjusting for employment and age. Impact of financial burden Financial assistance Among the pts, 74% reported that they did not access financial assistance, with more than a third (37%) of those being unaware that financial assistance was available. Of those who did receive assistance, government benefits were the most-nominated form of financial assistance (16.7%); 4.9% reported using travel assistance schemes, 5.7% financial support from a Cancer Council, 2% assistance from another cancer organisation, and 0.8% using Cancer Assist. Treatment Travel (15%), loss of income (14%) and treatment cost (11%) were commonly cited factors influencing treatment decision-making. |
| Paul et al., 2016 [23] | Total of 255 oncology outpatients attending treatment or appointments in Australia were recruited between January and July 2014. | Cross-sectional, questionnaire | Self-reported | Study-specific survey items | NR | Financial burden Household income Pts reporting reduced income after being diagnosed with cancer had higher odds of reporting a heavy or extreme financial burden associated with prescribed medicines for cancer (OR 3.73, 95% CI 1.1–12.1, p = 0.289). Treatment Among the pts, 63% reported some level of financial burden associated with obtaining prescribed medicines. Of those, 34% of pts reported moderate or heavy financial burden, and 11.8% reported using alternatives to prescribed medicines, such as over-the-counter, medicines from home or medicines from someone else. |
| Rowell et al., 2016 [24] | Total of 4000 pts diagnosed basal or squamous cell skin cancer were recruited between June 2011 and 2012. | Cohort | Medical Benefits Scheme, Pharmaceutical Benefits Scheme | QSkin Sun and Health study | Avg. cost was AUD 306, of which the public subsidy was AUD 241 and the co-payment was AUD 65. | NR |
| Slavova-Azmanova et al., 2019 [25] | Total of 40 cancer pts were recruited from the population sample of out-of-pocket expenses study in outer metropolitan and rural areas of Western Australia. | Cohort, phone interviews, qualitative | Self-reported | Study-specific survey items | NR | Financial burden Private health insurance Pts with private health insurance expressed disappointment with providers who did not make the option of receiving care as a public patient. Pts treated in the private sector acknowledged that cost of treatment had never been discussed and expressed disappointment with the lack of price transparency and cost-related discussions. Treatment Quality of communication regarding treatment options and side effects of treatment was variable and sub-optimal. Impact of financial burden Financial assistance Lack of awareness of services and costs prevented pts from accessing financial assistance, leading to treatment non-adherence and unnecessary stress to pts and their families. |
| Zucca et al., 2011 [26] | Total of 1410 pts diagnosed with one of the eight most incident cancers in Australia were recruited from New South Wales and Victorian cancer registries. | Cohort | Self-reported | Study-specific survey items | NR | Financial burden Place of residence Outer regional/remote pts had the greatest travel burden during the first 12 months after diagnosis. Among the pts, 61% travelled at least 2 h one way to receive treatment, and 49% lived away from home to receive treatment. Strongest associates of travel burden were:
Between 6 and 12 months after diagnosis, 2% of pts had declined cancer treatment because of the time it took to get to treatment. Even after adjusting for confounding factors, pts who travelled more than 2 h or lived away from treatment reported significantly greater financial difficulties (38% and 40%, respectively) than those who did not (12% and 14%, respectively). |
3. Results
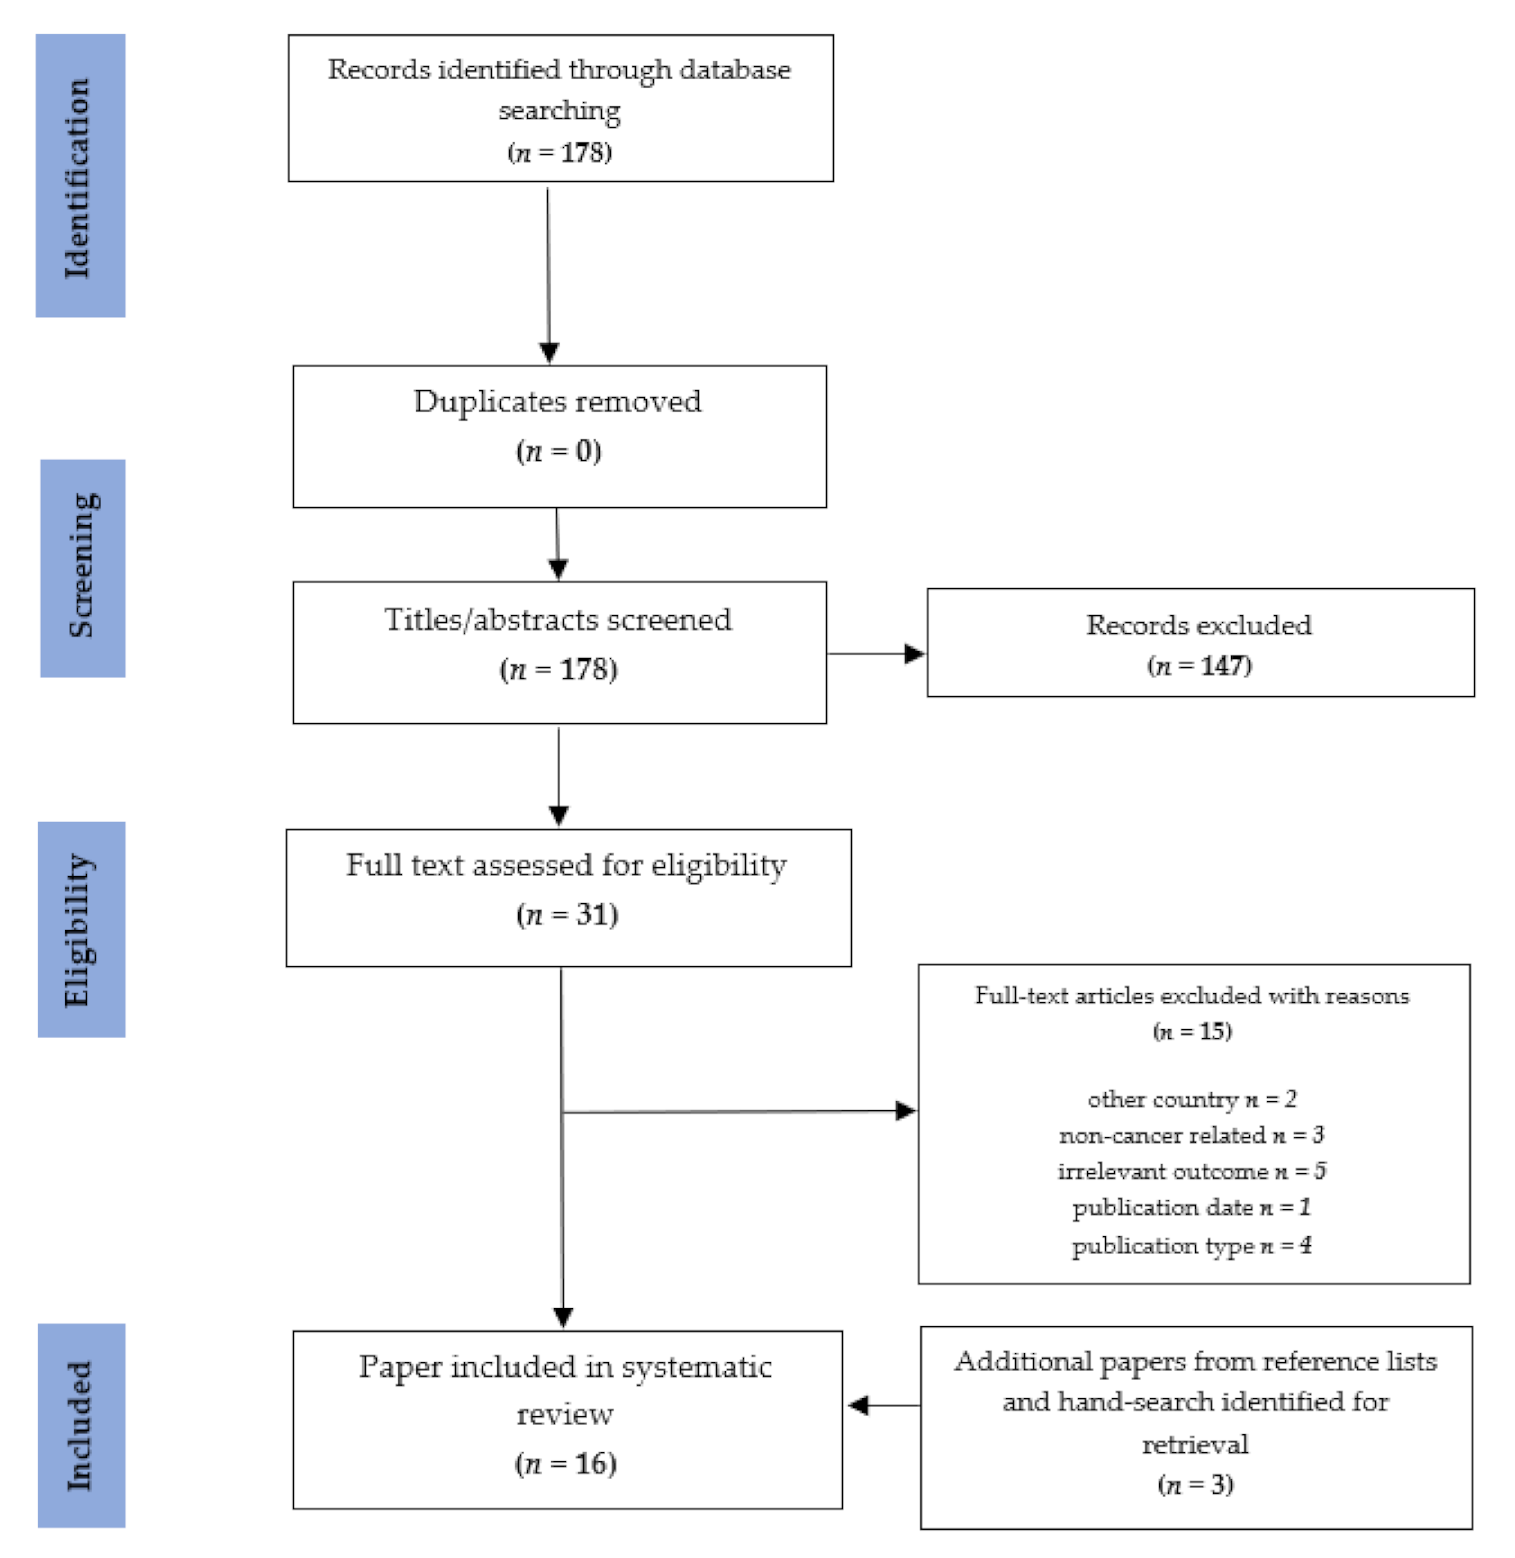
3.1. Study Selection
3.2. Study and Participant Characteristics
3.3. Financial Burden and Out-of-Pocket Cost Measures
3.4. Quality of Studies
3.5. Out-of-Pocket Costs
3.5.1. Direct Costs
3.5.2. Indirect Costs
3.6. Risk Factors Related to Out-of-Pocket Costs or Financial Burden
3.6.1. Age
3.6.2. Indigenous Status
3.6.3. Place of Residence
3.6.4. Household Income
3.6.5. Employment Status
3.6.6. Private Health Insurance Coverage
3.7. Health Outcomes Associated with Financial Burden
3.8. Financial Burden Coping Strategies
4. Discussion
4.1. Some Population Groups Are at Risk of Greater Out-of-Pocket Costs and Financial Burden
4.2. Those Affected by Cancer Will Have Reduced Capacity to Regain Financial Stability
4.3. Opportunities to Reduce the Financial Burden and Impact of Cancer Exist
4.4. Limitations
5. Conclusions
Supplementary Materials
Author Contributions
Funding
Institutional Review Board Statement
Informed Consent Statement
Data Availability Statement
Conflicts of Interest
References
- Australian Institute of Health and Welfare. Cancer Data in Australia. Cat. No: CAN 122. Canberra: AIHW. 2020. Available online: https://www.aihw.gov.au/reports/cancer/cancer-data-in-australia/contents/cancer-summary-data-visualisation (accessed on 22 September 2020).
- Australian Institute of Health and Welfare. Cancer in Australia: In brief 2019. Cancer Series No. 122. Cat No. CAN 126. Canberra: AIHW. 2019. Available online: https://www.aihw.gov.au/getmedia/f4f2b22f-8189-4c51-9e2a-66384cbca683/aihw-can-126.pdf.aspx (accessed on 22 September 2020).
- Consumers Health Forum. Out of Pocket Pain: Research Report. Deakin: CHF. 2018. Available online: https://chf.org.au/sites/default/files/20180404_oop_report.pdf (accessed on 22 September 2020).
- Fenn, K.M.; Evans, S.B.; McCorkle, R.; DiGiovanna, M.P.; Pusztai, L.; Sanft, T.; Hofstatter, E.W.; Killelea, B.K.; Knobf, M.T.; Lannin, D.R.; et al. Impact of financial burden of cancer on survivors’ quality of life. J. Oncol. Pract. 2014, 10, 332–338. [Google Scholar] [CrossRef] [PubMed]
- Moher, D.; Liberati, A.; Totzlaff, J.; Altman, D.; The PRISMA Group. Preferred reporting items for systematic reviews and meta-analysis: The PRSIMA statement. Ann. Intern. Med. 2009, 15, 264–269. [Google Scholar] [CrossRef] [Green Version]
- National Institute of Health. Quality Assessment Tool for Observational Cohort and Cross-Sectional Studies. Available online: https://www.nhlbi.nih.gov/health-topics/study-quality-assessment-tools (accessed on 22 September 2020).
- Carrera, P.; Zafar, S.Y. Financial toxicity. In The MASCC Textbook of Cancer Supportive Care and Survivorship, 2nd ed.; Olver, I., Ed.; Springer: New York, NY, USA, Unpublished Work.
- Boyages, J.; Xu, Y.; Kalfa, S.; Koelmeyer, L.; Parkinson, B.; Mackie, H.; Viveros, H.; Gollan, P.; Taksa, L. Financial cost of lymphedema borne by women with breast cancer. Psycho-Oncology 2017, 26, 849–855. [Google Scholar] [CrossRef]
- Callander, E.; Bates, N.; Lindsay, D.; Larkins, S.; Topp, S.M.; Cunningham, J.; Sabesan, S.; Garvey, G. Long-term out of pocket expenditure of people with cancer: Comparing health service cost and use for Indigenous and non-Indigenous people with cancer in Australia. Int. J. Equity Health 2019, 18, 32. [Google Scholar] [CrossRef] [Green Version]
- Callander, E.; Bates, N.; Lindsay, D.; Larkins, S.; Preston, R.; Topp, S.M.; Cunningham, J.; Garvey, G. The patient co-payment and opportunity costs of accessing healthcare for Indigenous Australians with cancer: A whole of population data linkage study. Asia-Pac. J. Clin. Oncol. 2019, 15, 309–315. [Google Scholar] [CrossRef] [PubMed]
- Dussel, V.; Bona, K.; Heath, J.A.; Hilden, J.M.; Weeks, J.C.; Wolfe, J. Unmeasured costs of a child’s death: Perceived financial burden, work disruptions, and economic coping strategies used by American and Australian families who lost children to cancer. J. Clin. Oncol. 2011, 29, 1007–1013. [Google Scholar] [CrossRef] [Green Version]
- Gordon, L.G.; Walker, S.M.; Mervin, M.C.; Lowe, A.; Smith, D.P.; Gardiner, R.A.; Chambers, S.K. Financial toxicity: A potential side effect of prostate cancer treatment among Australian men. Eur. J. Cancer Care 2019, 26, e12392. [Google Scholar] [CrossRef]
- Gordon, L.G.; Beesley, V.L.; Mihala, G.; Koczwara, B.; Lynch, B.M. Reduced employment and financial hardship among middle-aged individuals with colorectal cancer. Eur. J. Cancer Care 2017, 26, e12744. [Google Scholar] [CrossRef]
- Gordon, L.G.; Elliott, T.M.; Olsen, C.M.; Pandeya, N.; Whiteman, D.C. Multiplicity of skin cancers in Queensland and their cost burden to government and patients. Aust. N. Z. J. Public Health 2017, 42, 86–91. [Google Scholar] [CrossRef] [PubMed] [Green Version]
- Gordon, L.G.; Elliott, T.M.; Olsen, C.M.; Pandeya, N.; Whiteman, D.C. Patient out-of-pocket medical expenses over 2 years among Queenslanders with and without a major cancer. Aust. J. Prim. Health 2018, 24, 530–536. [Google Scholar] [CrossRef]
- Gordon, L.G.; Elliott, T.M.; Wakelin, K.; Leyden, S.; Leyden, J.; Michael, M.; Pavlakis, N.; Mumford, J.; Segelov, E.; Wyld, D.K. The economic impact of Australians patients with neuroendocrine tumours. Patient 2020, 13, 363–373. [Google Scholar] [CrossRef] [PubMed]
- Hall, A.E.; Sanson-Fisher, R.W.; Carey, M.L.; Paul, C.; Williamson, A.; Bradstock, K.; Campbell, H.S. Prevalence and associates of psychological distress in haematological cancer survivors. Support Care Cancer 2016, 24, 4413–4422. [Google Scholar] [CrossRef]
- Hall, A.E.; Sanson-Fisher, R.W.; Lynagh, M.C.; Tzelepis, F.; D’Este, C. What do haematological cancer survivors want help with? A cross-sectional investigation of unmet supportive care needs. BMC Res. Notes 2015, 8, 221. [Google Scholar] [CrossRef] [PubMed] [Green Version]
- McGrath, P. ‘The bills that were coming in…’: Out of pocket costs during relocation for specialist treatment for haematological malignancies. Support Care Cancer 2016, 24, 2893–2903. [Google Scholar] [CrossRef] [PubMed]
- McNeil, R.J.; McCarthy, M.; Dunt, D.; Thompson, K.; Kosola, S.; Orme, L.; Drew, S.; Sawyer, S. Financial challenges of cancer for adolescents and young adults and their parent caregivers. Soc. Work Res. 2019, 43, 17–30. [Google Scholar] [CrossRef]
- Newton, J.C.; Johnson, C.E.; Hohnen, H.; Bulsara, M.; Ives, A.; McKiernan, S.; Platt, V.; McConigley, R.; Slavova-Azmanova, N.S.; Saunders, C. Out of pocket expenses experienced by rural Western Australians diagnosed with cancer. Supportive Care Cancer 2018, 26, 3543–3552. [Google Scholar] [CrossRef]
- Paul, C.; Boyes, A.; Hall, A.; Bisquera, A.; Miller, A.; O’Brien, L. The impact of cancer diagnosis and treatment on employment, income, treatment decisions and financial assistance and their relationship to socioeconomic and disease factors. Support Care Cancer 2016, 24, 4739–4746. [Google Scholar] [CrossRef]
- Paul, C.L.; Boyes, A.; Searles, A.; Carey, M.; Turon, H. The impact of loss of income and medicine costs on the financial burden for cancer patients in Australia. J. Community Supportive Oncol. 2016, 14, 307–313. [Google Scholar] [CrossRef]
- Rowell, D.; Gordon, L.G.; Olsen, C.M.; Whiteman, D.C. A comparison of the direct medical costs for individuals with or without basal or squamous cell skin cancer: A study from Australia. SAGE Open Med. 2016, 4. [Google Scholar] [CrossRef] [Green Version]
- Slavova-Azmanova, N.; Newton, J.C.; Hohnen, H.; Johnson, C.E.; Saunders, C. How communication between cancer patients and their specialists affect the quality and cost of cancer care. Supportive Care Cancer 2019, 27, 4575–4585. [Google Scholar] [CrossRef]
- Zucca, A.; Boyes, A.; Newling, G.; Hall, A.; Girgis, A. Travelling all over the countryside: Travel-related burden and financial difficulties by cancer patients in New South Wales and Victoria. Aust. J. Rural Health 2011, 19, 298–305. [Google Scholar] [CrossRef] [PubMed]
- Bates, N.; Callander, E.; Lindsay, D.; Watt, K. CancerCostMod: A model of the healthcare expenditure, patient resource use, and patient co-payment costs for Australian cancer patients. Health Econ. Rev. 2018, 8, 1–12. [Google Scholar] [CrossRef]
- Australian Institute of Health and Welfare. Health expenditure Australia 2017-18. Health and Welfare Expenditure Series No. 65. Cat. No. HWE 77. Canberra: AIHW. 2019. Available online: https://www.aihw.gov.au/reports/health-welfare-expenditure/health-expenditure-australia-2017-18/contents/summary (accessed on 22 September 2020).
- OECD. Out-of-Pocket Medical Expenditure. OECD. 2017. Available online: https://www.oecd-ilibrary.org/docserver/health_glance-2017-26-en.pdf?expires=1614299152&id=id&accname=guest&checksum=C99A13DBA407E08F5A21E87C0A19E7E8 (accessed on 26 February 2021).
- Breast Cancer Network of Australia. The Financial Impact of Breast Cancer. BCNA. Available online: https://www.bcna.org.au/media/5609/the-financial-impact-of-breast-cancer.pdf (accessed on 22 September 2020).
- Merollini, K.; Gordon, L.; Aitken, J.; Kimlin, M. Lifetime costs of surviving cancer—A Queensland study (COS-Q): Protocol of a large healthcare data linkage study. Int. J. Environ. Res Publich Health 2020, 17, 2831. [Google Scholar] [CrossRef] [Green Version]
- Levesque, J.; Harris, M.; Russel, G. Patient-centred access to healthcare: Conceptualising access at the interface of health systems and populations. Int. J. Equity Health 2013, 12, 1–9. [Google Scholar] [CrossRef] [Green Version]
- Gordon, L.; Merollini, K.; Lowe, A.; Chan, R. A systematic review of financial toxicity among cancer survivors: We can’t pay the co-pay. Patient 2017, 10, 295–309. [Google Scholar] [CrossRef] [Green Version]
- Australian Bureau of Statistics. Household financial stress. In General Social Survey: Summary Results; ABS: Canberra, Australia, 2014. [Google Scholar]
- ACTION Study Group. Catastrophic health expenditure and 12-month mortality associated with cancer in Southeast Asia: Results from a longitudinal study in eight countries. BMC 2015, 13, 190. [Google Scholar]
- Carrera, P.; Kantarjian, H.; Blinder, V. The financial burden and distress of patients with cancer: Understanding and stepping-up action on the financial toxicity of cancer treatment. CA Cancer J. Clin. 2018, 68, 153–165. [Google Scholar] [CrossRef] [PubMed]
- Macmillan Cancer Support. Time to Act on the Financial Impact of Cancer. UK. 2017. Available online: https://www.macmillan.org.uk/_images/MAC16493%20Money%20and%20Cancer%20policy%20report_tcm9-314796.pdf (accessed on 22 September 2020).
- Chi, M. The hidden cost of cancer: Helping clients cope with financial toxicity. Clin. Soc. Work J. 2015, 43, 249–257. [Google Scholar] [CrossRef]
- Zafar, S.; Abernethy, A. Financial toxicity, Part 1: A new name for a growing problem. Oncology 2013, 27, 80–149. [Google Scholar] [PubMed]

| Criteria | Boyages, 2017 [8] | Callander, 2019 [9] | Callander, 2019 [10] | Dussel, 2011 [11] | Gordon, 2019 [12] | Gordon, 2017 [13] | Gordon, 2017 [14] | Gordon, 2018 [15] | Gordon, 2020 [16] | Hall, 2016 [17] |
|---|---|---|---|---|---|---|---|---|---|---|
| Was there a clear research question? | Y | Y | Y | Y | Y | Y | Y | Y | Y | Y |
| Was the study population clearly specified? | Y | Y | Y | Y | Y | Y | Y | Y | Y | Y |
| Was the participation rate at least 50%? | CD | Y | Y | N | CD | N | NR | Y | NR | N |
| Were the patients recruited from the same or similar populations? Were inclusion and exclusion criteria applied uniformly? | N | Y | Y | Y | N | Y | Y | N | N | Y |
| Was there a sample size justification? | Y | Y | Y | Y | Y | Y | NR | Y | Y | Y |
| Was the exposure(s) prior to the outcome(s) measured? | N | N | N | N | N | N | N | N | N | N |
| Was the timeframe sufficient? | N | N | N | N | N | CD | N | N | N | N |
| Were different levels of the exposure as related to the outcome measured? | Y | Y | Y | Y | Y | Y | Y | Y | Y | Y |
| Were the exposure measures valid and reliable? | N | Y | Y | N | Y | N | Y | Y | Y | N |
| Was the exposure(s) assessed more than once over time? | N | N | N | N | N | Y | N | N | N | N |
| Were the outcome measures clearly defined, valid and reliable? | N | Y | Y | N | Y | N | Y | Y | Y | N |
| Were the outcome assessors blinded to the exposure status of participants? | Y | Y | Y | Y | Y | NR | Y | Y | NR | NR |
| Was there a loss to follow-up after baseline of 20% or less? | NA | NA | NA | NA | NA | CD | NR | NR | N | NR |
| Were potential confounding variables measured and adjusted for statistically? | N | Y | Y | N | N | Y | Y | Y | Y | Y |
| Criteria | Hall, 2015 [18] | McGrath, 2016 [19] | McNeil, 2019 [20] | Newton, 2018 [21] | Paul, 2016 [22] | Paul, 2016 [23] | Rowell, 2016 [24] | Slavova-Azmanova, 2019 [25] | Zucca, 2011 [26] | |
| Was there a clear research question? | Y | CD | Y | Y | Y | Y | Y | Y | Y | |
| Was the study population clearly specified? | Y | NR | Y | Y | Y | Y | Y | Y | Y | |
| Was the participation rate at least 50%? | N | NR | NR | N | Y | NR | CD | NR | N | |
| Were the patients recruited from the same or similar populations? Were inclusion and exclusion criteria applied uniformly? | Y | Y | N | Y | Y | Y | Y | Y | Y | |
| Was there a sample size justification? | Y | N | Y | N | Y | Y | Y | NR | Y | |
| Was the exposure(s) prior to the outcome(s) measured? | N | N | N | N | N | N | N | N | Y | |
| Was the timeframe sufficient? | N | N | N | N | N | N | N | N | Y | |
| Were different levels of the exposure as related to the outcome measured? | Y | Y | NA | Y | N | NA | Y | N | Y | |
| Were the exposure measures valid and reliable? | Y | N | N | N | N | N | Y | N | N | |
| Was the exposure(s) assessed more than once over time? | N | N | N | N | N | N | N | N | Y | |
| Were the outcome measures clearly defined, valid and reliable? | N | N | N | N | N | N | Y | N | Y | |
| Were the outcome assessors blinded to the exposure status of participants? | NR | Y | N | N | N | N | NR | N | N | |
| Was there a loss to follow-up after baseline of 20% or less? | NR | NR | NA | NR | N | NA | NR | N | N | |
| Were potential confounding variables measured and adjusted for statistically? | Y | Y | Y | Y | Y | Y | Y | NA | Y |
Publisher’s Note: MDPI stays neutral with regard to jurisdictional claims in published maps and institutional affiliations. |
© 2021 by the authors. Licensee MDPI, Basel, Switzerland. This article is an open access article distributed under the terms and conditions of the Creative Commons Attribution (CC BY) license (http://creativecommons.org/licenses/by/4.0/).
Share and Cite
Bygrave, A.; Whittaker, K.; Paul, C.; Fradgley, E.A.; Varlow, M.; Aranda, S. Australian Experiences of Out-of-Pocket Costs and Financial Burden Following a Cancer Diagnosis: A Systematic Review. Int. J. Environ. Res. Public Health 2021, 18, 2422. https://doi.org/10.3390/ijerph18052422
Bygrave A, Whittaker K, Paul C, Fradgley EA, Varlow M, Aranda S. Australian Experiences of Out-of-Pocket Costs and Financial Burden Following a Cancer Diagnosis: A Systematic Review. International Journal of Environmental Research and Public Health. 2021; 18(5):2422. https://doi.org/10.3390/ijerph18052422
Chicago/Turabian StyleBygrave, Annie, Kate Whittaker, Christine Paul, Elizabeth A. Fradgley, Megan Varlow, and Sanchia Aranda. 2021. "Australian Experiences of Out-of-Pocket Costs and Financial Burden Following a Cancer Diagnosis: A Systematic Review" International Journal of Environmental Research and Public Health 18, no. 5: 2422. https://doi.org/10.3390/ijerph18052422
APA StyleBygrave, A., Whittaker, K., Paul, C., Fradgley, E. A., Varlow, M., & Aranda, S. (2021). Australian Experiences of Out-of-Pocket Costs and Financial Burden Following a Cancer Diagnosis: A Systematic Review. International Journal of Environmental Research and Public Health, 18(5), 2422. https://doi.org/10.3390/ijerph18052422