
Equivalent Weight: Connecting Exoskeleton Effectiveness with Ergonomic Risk during Manual Material Handling

 , , ,
, , ,  and
and
Abstract
:
1. Introduction
2. Materials and Methods
2.1. Exoskeleton Prototype
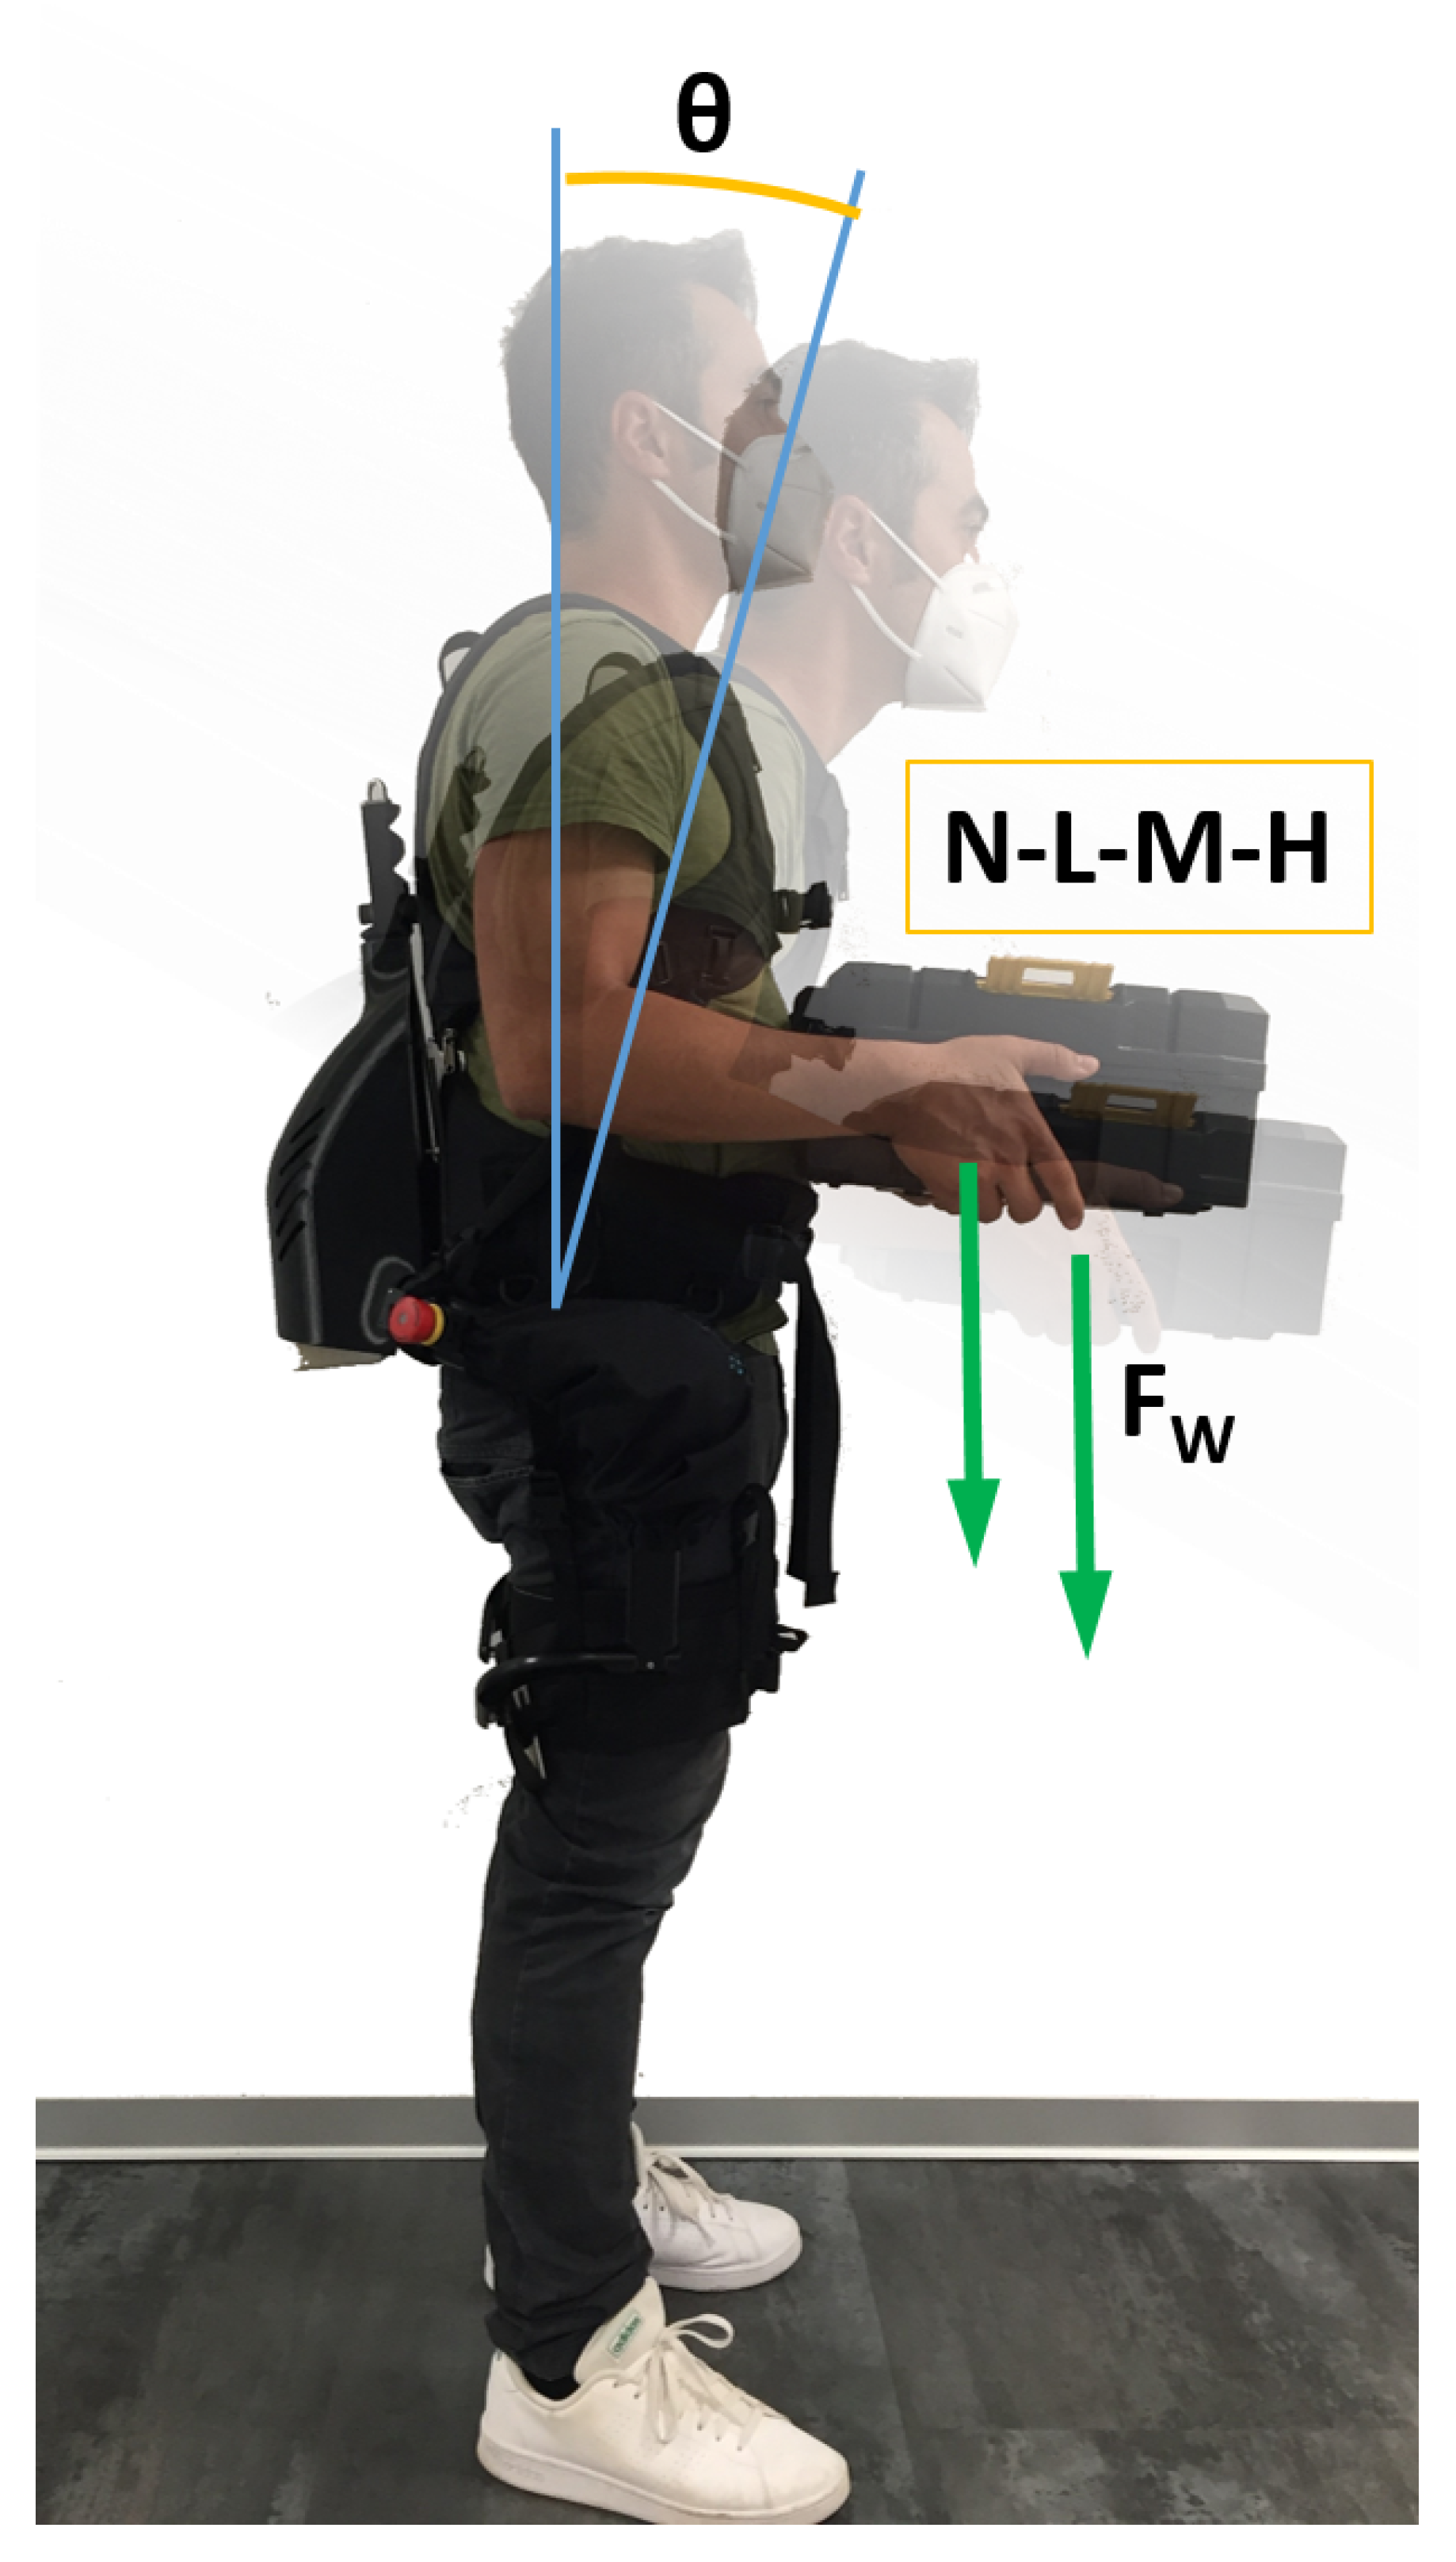
2.2. Biomechanics of Load Handling
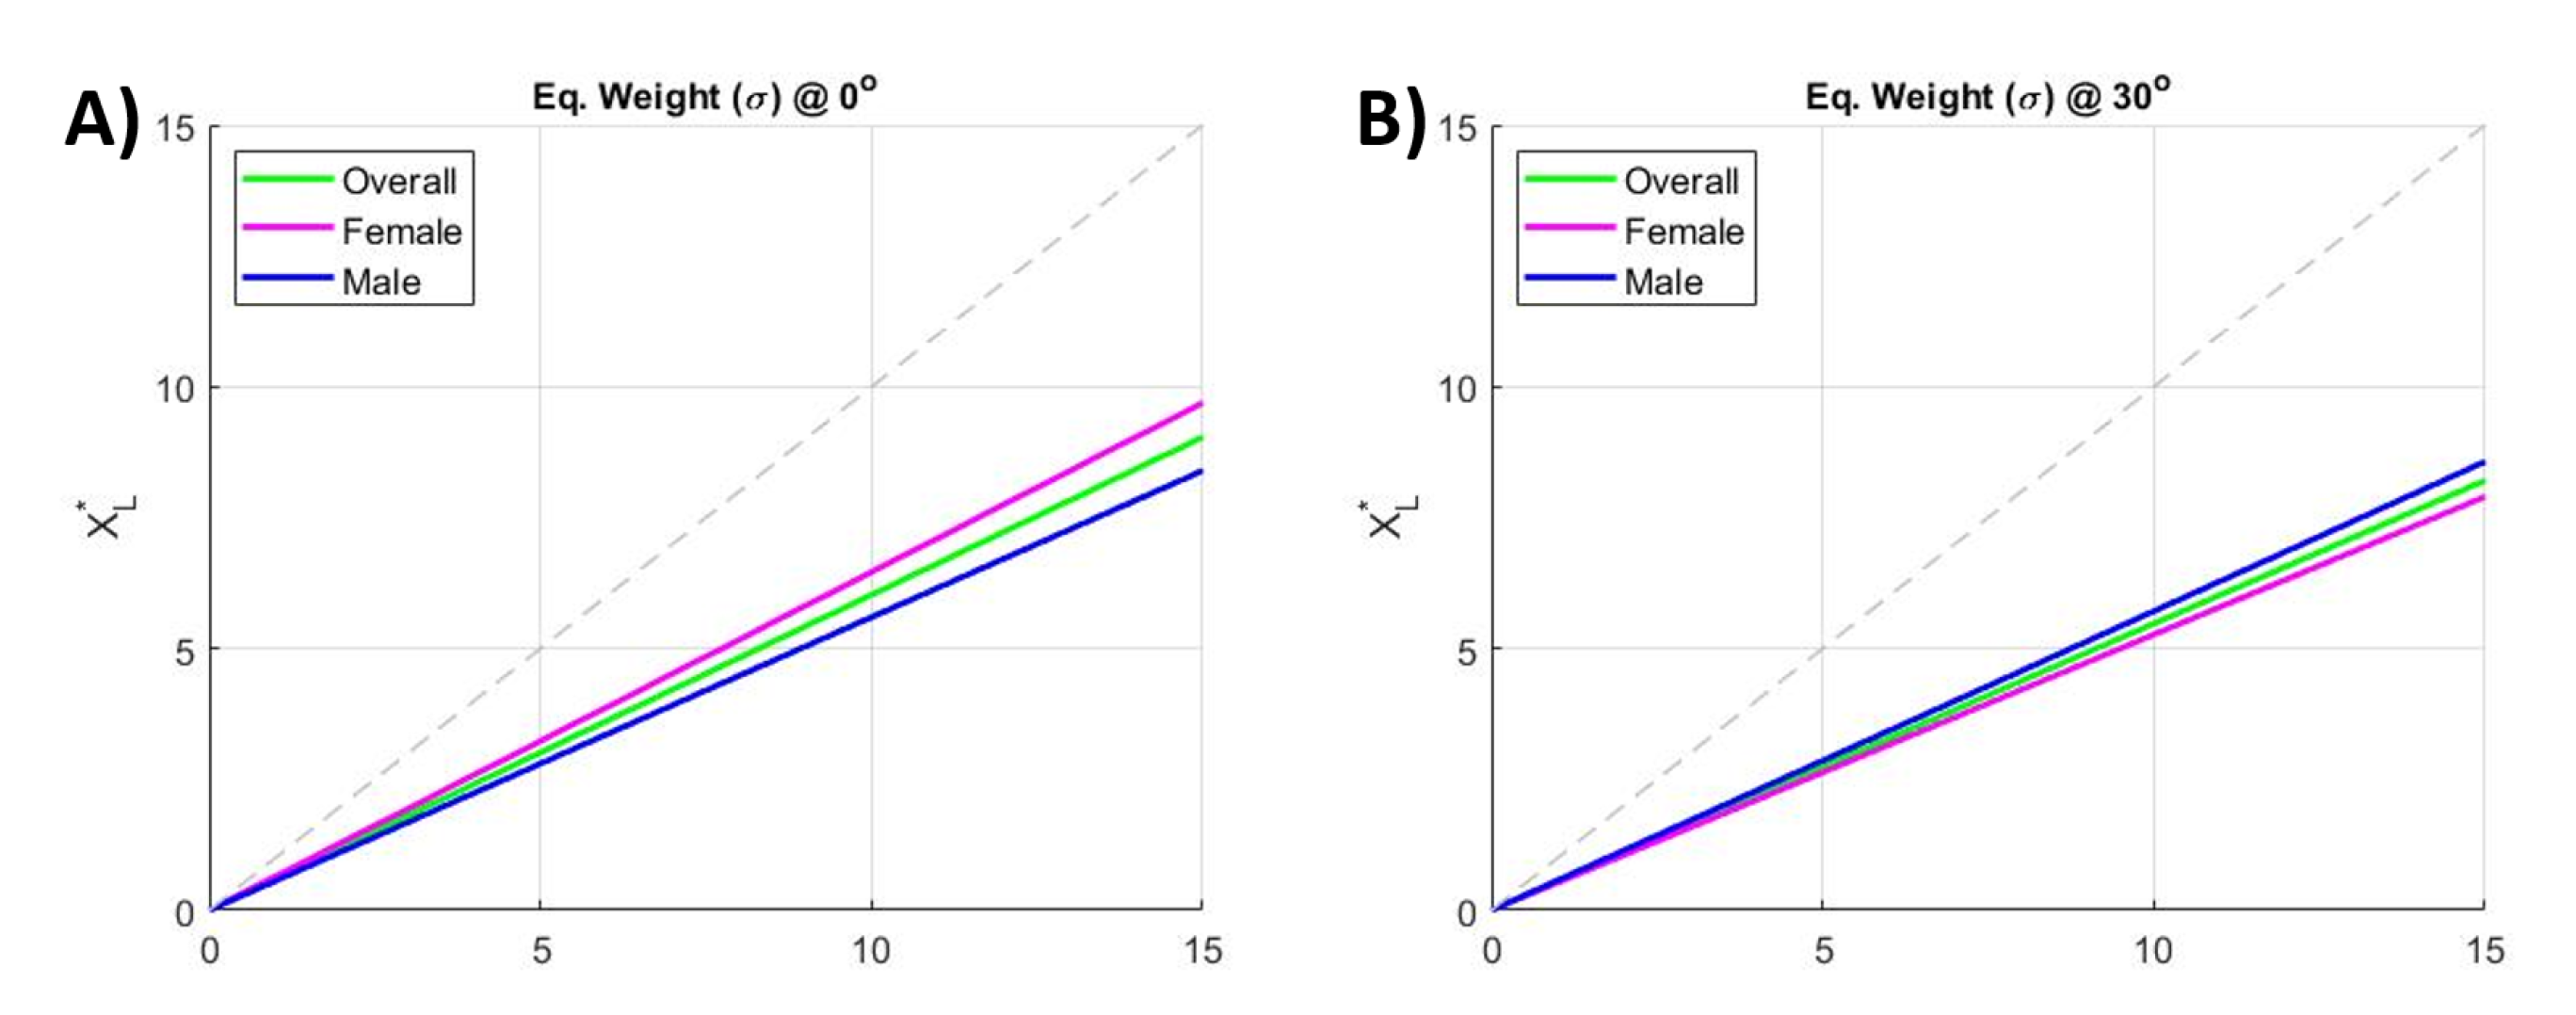
2.3. Equivalent Weight
2.3.1. Method 1: Biomechanical Model
2.3.2. Method 2: Data Interpolation
3. Experimental Assessment
3.1. Experimental Protocol
3.2. Data Analysis
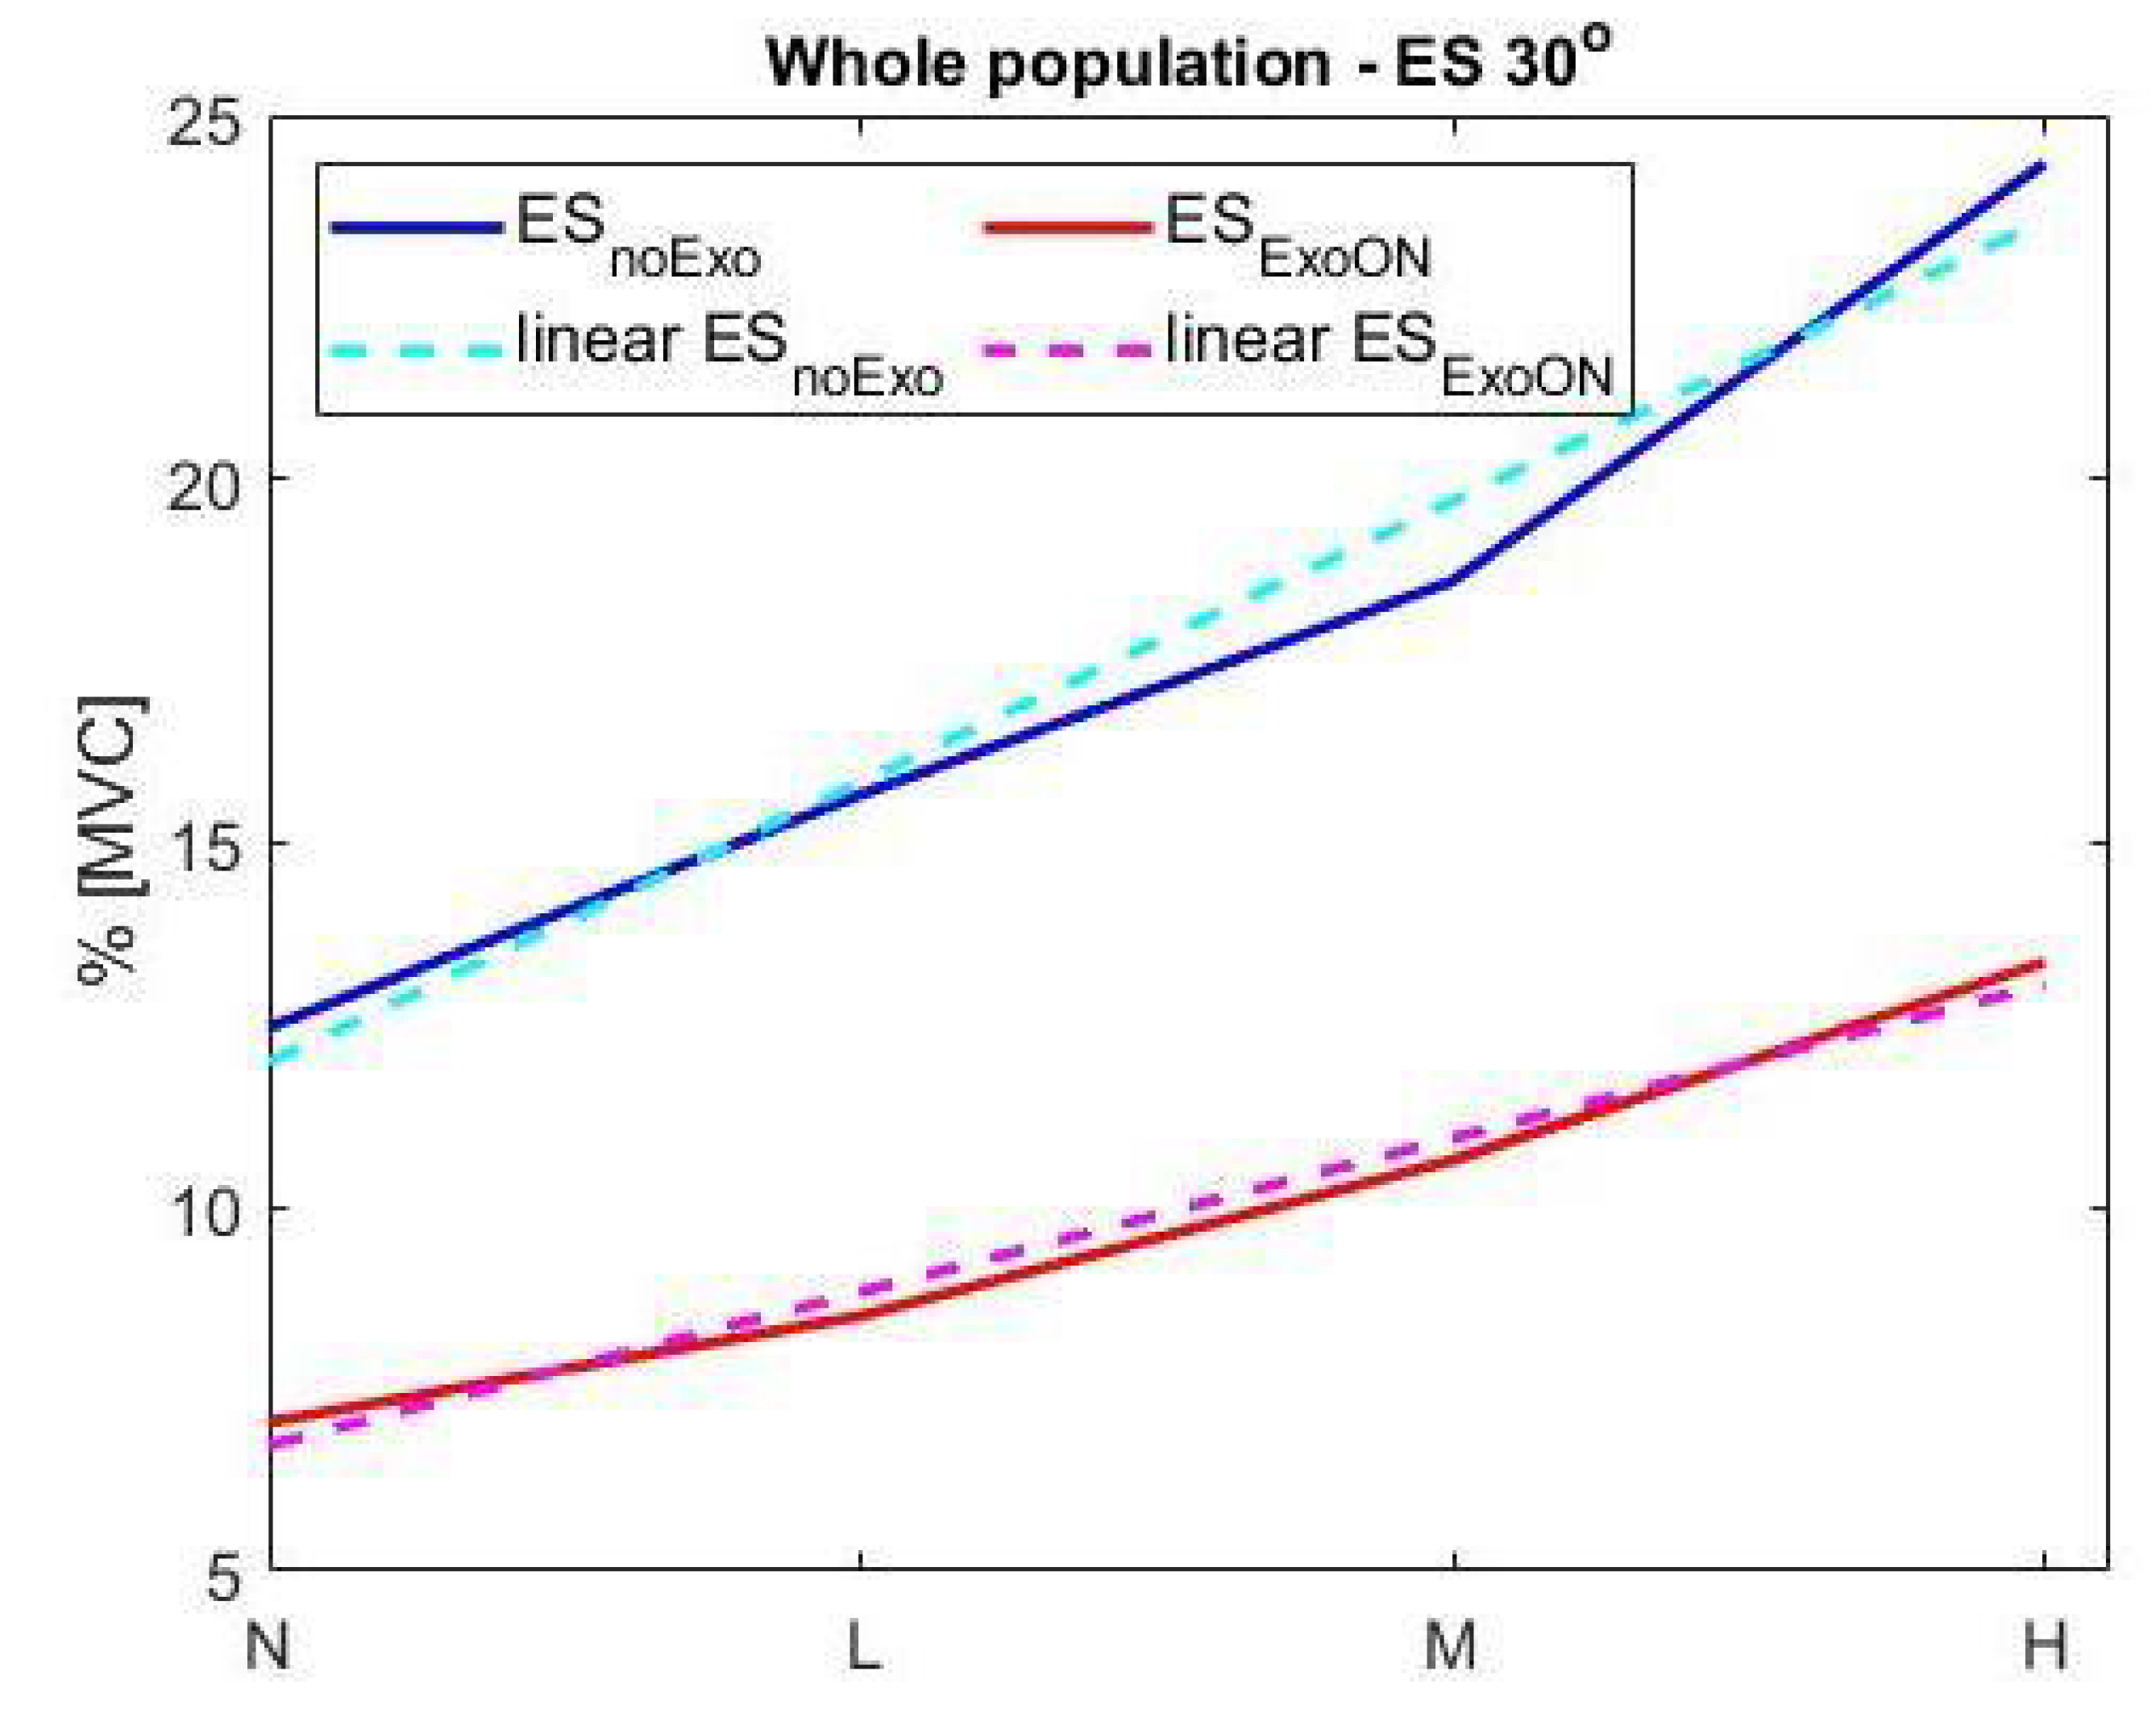
3.3. Muscle Activation: Effect of Exoskeleton Assistance
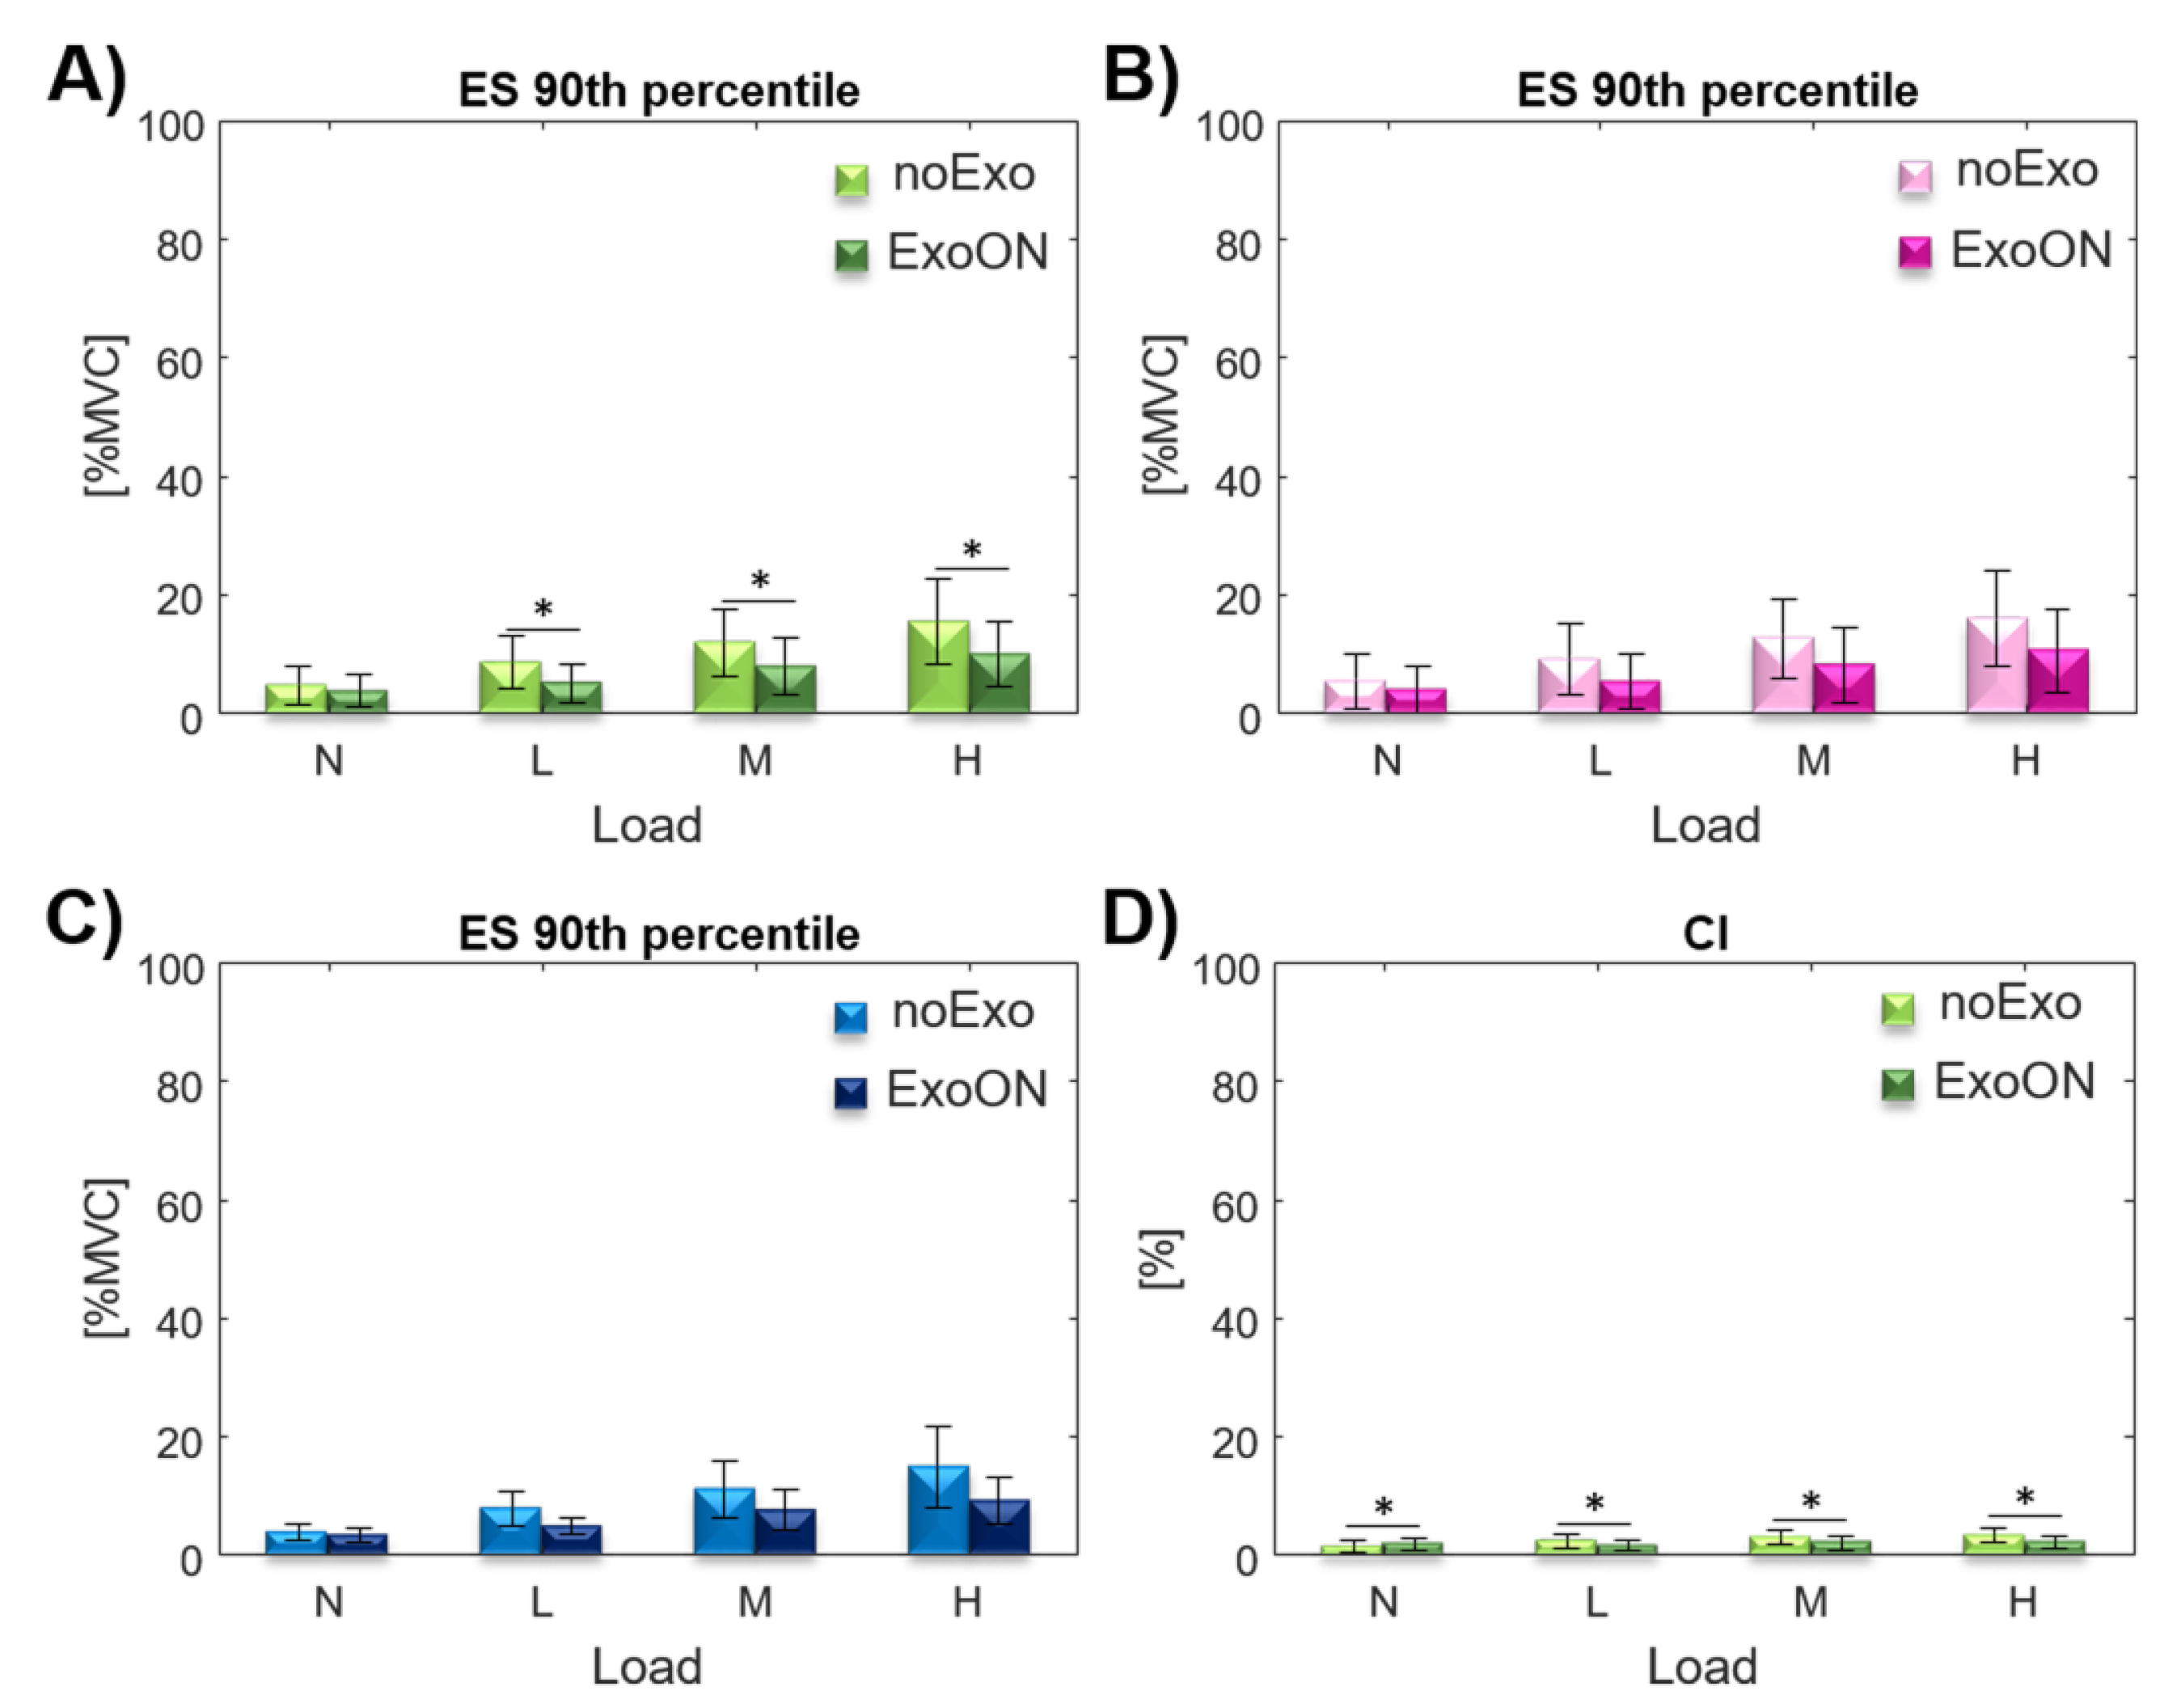
3.3.1. Upright: Trunk Inclination
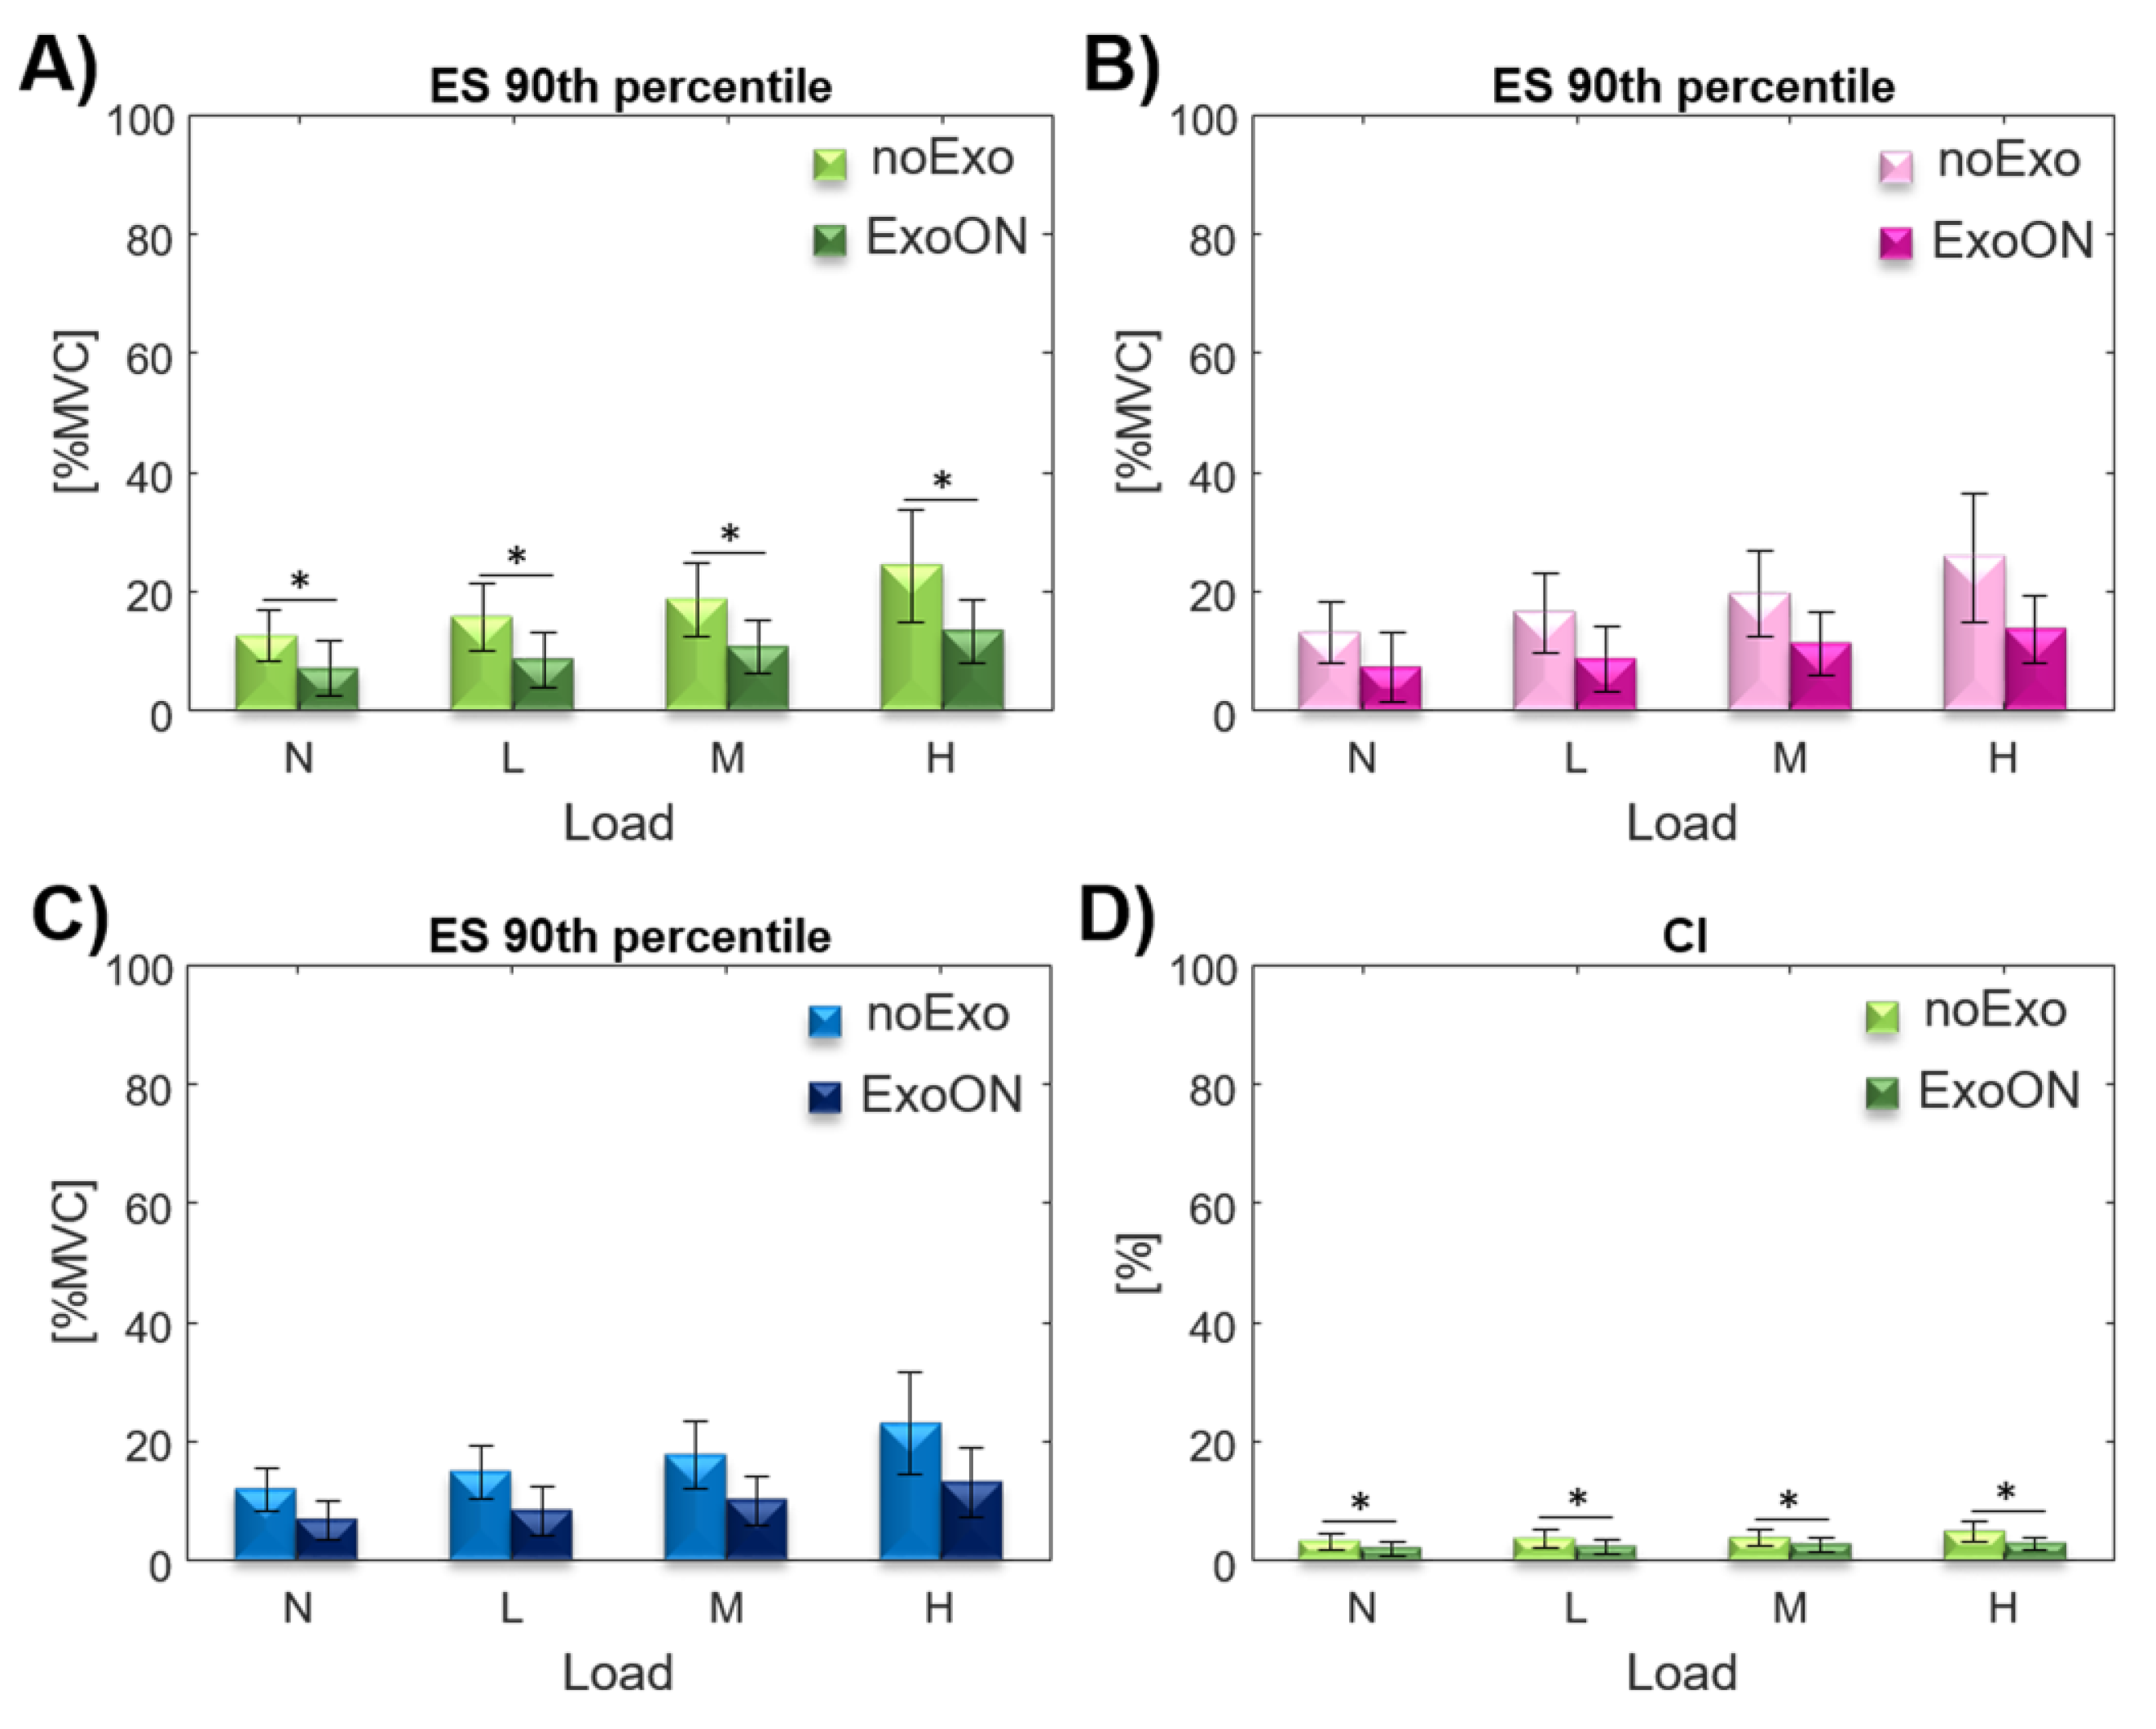
3.3.2. Trunk Inclination
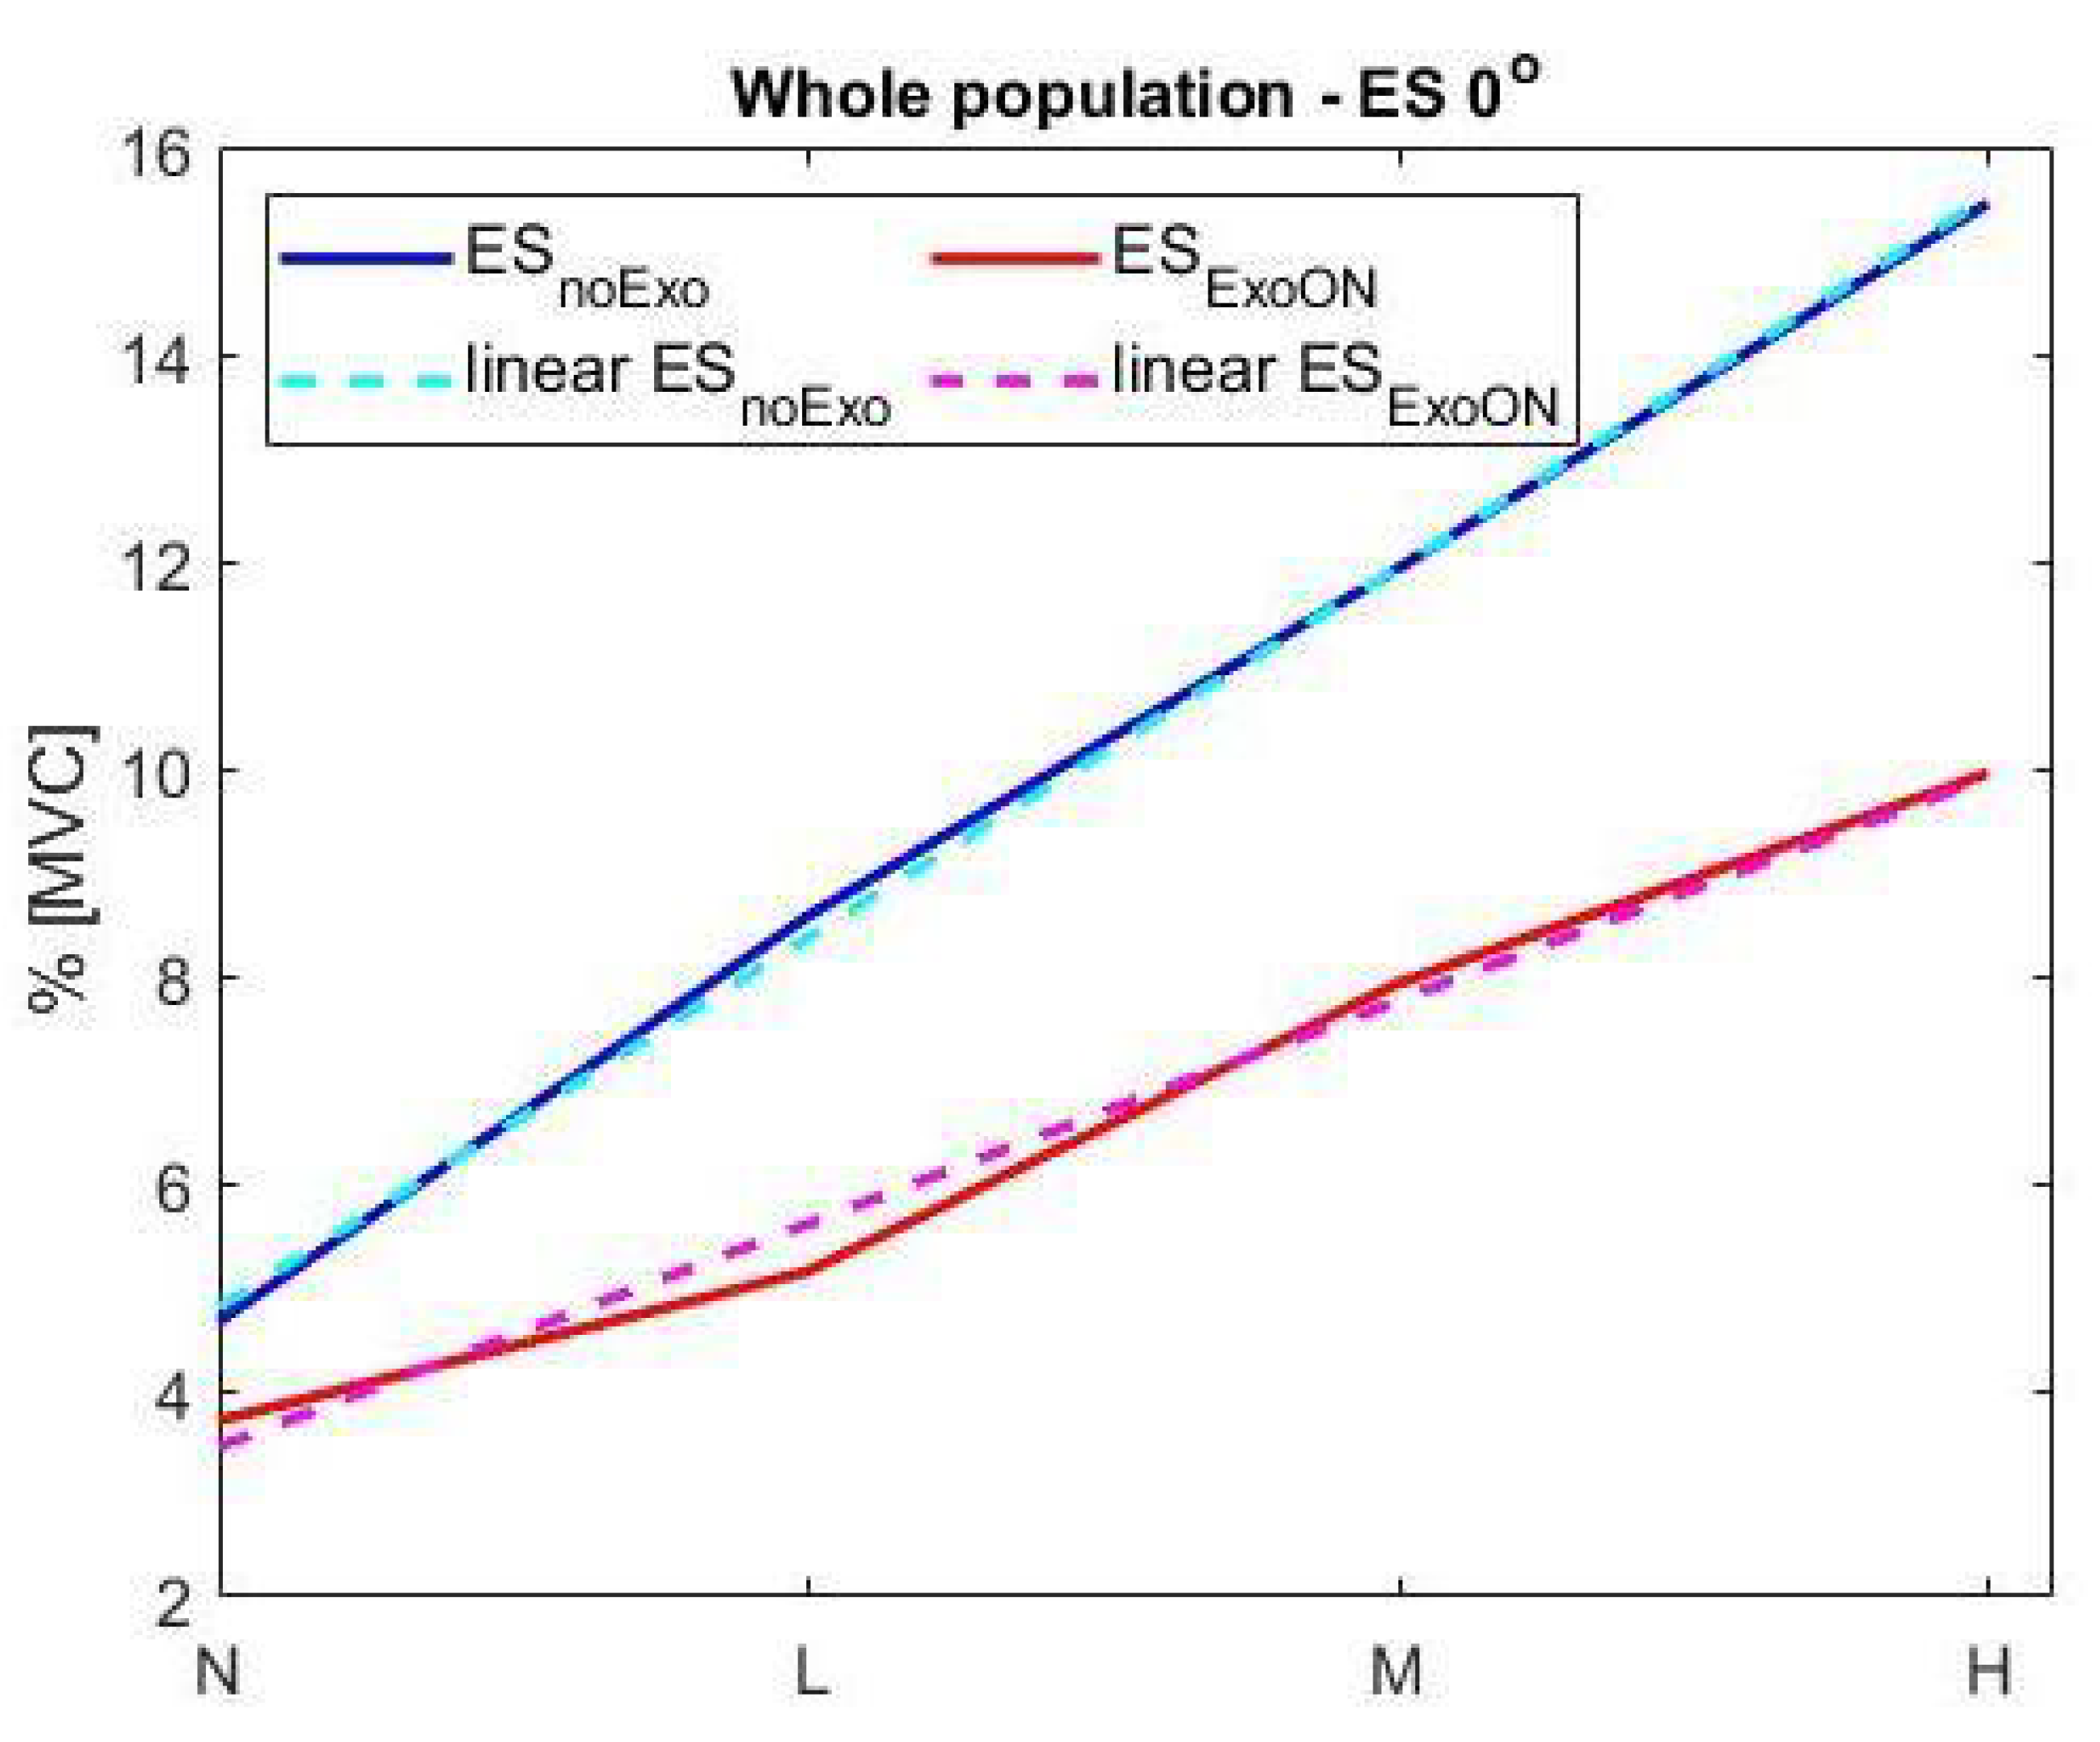
3.3.3. Equivalent Weight Results
4. Discussion
5. Conclusions
Author Contributions
Funding
Institutional Review Board Statement
Informed Consent Statement
Data Availability Statement
Conflicts of Interest
Abbreviations
| WMSDs | Work-related MusculoSkeletal Disorders |
| MMH | Manual Material Handling |
| MVC | Maximum Voluntary Contraction |
| MVA | Maximum Voluntary Activation |
| ES | erector spinae |
| EqW | Equivalent Weight |
| ESI | Erector Spinae Longissimus |
| ESL | Erector Spinae Iliocostalis |
| RAS | Rectus Abdominis Superior |
| CI | Co-activation Indexes |
| N | No load |
| L | Low load |
| M | Medium load |
| H | High load |
| LI | Lifting Index |
| RWL | Recommended Weight Limit |
| VM | Vertical Multiplier |
| HM | Horizontal Multiplier |
| LC | Load Constant |
| TMCf | Time-varying Multi-muscle Co-activation Function |
| noExo | test conducted without the exoskeleton |
| ExoON | test conducted wearing the exoskeleton |
Appendix A. Model Implementation
References
- Lu, M.L.; Waters, T.R.; Krieg, E.; Werren, D. Efficacy of the revised NIOSH lifting equation to predict risk of low-back pain associated with manual lifting: A one-year prospective study. Hum. Factors 2014, 56, 73–85. [Google Scholar] [CrossRef] [PubMed]
- Hartvigsen, J.; Hancock, M.J.; Kongsted, A.; Louw, Q.; Ferreira, M.L.; Genevay, S.; Hoy, D.; Karppinen, J.; Pransky, G.; Sieper, J.; et al. What low back pain is and why we need to pay attention. Lancet 2018, 391, 2356–2367. [Google Scholar] [CrossRef]
- Vos, T.; Abajobir, A.A.; Abate, K.H.; Abbafati, C.; Abbas, K.M.; Abd-Allah, F.; Abdulkader, R.S.; Abdulle, A.M.; Abebo, T.A.; Abera, S.F.; et al. Global, regional, and national incidence, prevalence, and years lived with disability for 328 diseases and injuries for 195 countries, 1990–2016: A systematic analysis for the Global Burden of Disease Study 2016. Lancet 2017, 390, 1211–1259. [Google Scholar] [CrossRef]
- Schneider, E.; Irastoeza, X. European Agency for Safty and Health at Work (EU-OSHA). In OSH in Figures: Work-Related Musculoskeletal Disorders in the EU—Facts and Figures; Publications Office of the European Union: Luxembourg, 2010. [Google Scholar]
- Williams, J.S.; Ng, N.; Peltzer, K.; Yawson, A.; Biritwum, R.; Maximova, T.; Wu, F.; Arokiasamy, P.; Kowal, P.; Chatterji, S. Risk factors and disability associated with low back pain in older adults in low-and middle-income countries. Results from the WHO Study on Global AGEing and Adult Health (SAGE). PLoS ONE 2015, 10, e0127880. [Google Scholar]
- Rudy, T.E.; Weiner, D.K.; Lieber, S.J.; Slaboda, J.; Boston, J.R. The impact of chronic low back pain on older adults: A comparative study of patients and controls. Pain 2007, 131, 293–301. [Google Scholar] [CrossRef] [PubMed]
- Hoy, D.; March, L.; Brooks, P.; Blyth, F.; Woolf, A.; Bain, C.; Williams, G.; Smith, E.; Vos, T.; Barendregt, J.; et al. The global burden of low back pain: Estimates from the Global Burden of Disease 2010 study. Ann. Rheum. Dis. 2014, 73, 968–974. [Google Scholar] [CrossRef] [PubMed]
- Weiner, S.S.; Nordin, M. Prevention and management of chronic back pain. Best Pract. Res. Clin. Rheumatol. 2010, 24, 267–279. [Google Scholar] [CrossRef]
- Punnett, L.; Wegman, D.H. Work-related musculoskeletal disorders: The epidemiologic evidence and the debate. J. Electromyogr. Kinesiol. 2004, 14, 13–23. [Google Scholar] [CrossRef] [PubMed]
- Kim, K.H.; Kim, K.S.; Kim, D.S.; Jang, S.J.; Hong, K.H.; Yoo, S.W. Characteristics of work-related musculoskeletal disorders in Korea and their work-relatedness evaluation. J. Korean Med Sci. 2010, 25, S77–S86. [Google Scholar] [CrossRef]
- Health. Division of Biomedical, & Behavioral Science. Work Practice Guide for Manual Load Lifting (No. 81-122); US Department of Health and Human Services; Public Health Service; Centers for Disease Control; National Institute for Occupational Safety and Health; Division of Biomedical and Behavioral Science: Cincinnati, OH, USA, 1981.
- Waters, T.R.; Lu, M.L.; Piacitelli, L.A.; Werren, D.; Deddens, J.A. Efficacy of the revised NIOSH lifting equation to predict risk of low back pain due to manual lifting: Expanded cross-sectional analysis. J. Occup. Environ. Med. 2011, 53, 1061–1067. [Google Scholar] [CrossRef]
- Burgess-Limerick, R.; Abernethy, B.; Neal, R.J.; Kippers, V. Self-selected manual lifting technique: Functional consequences of the interjoint coordination. Hum. Factors 1995, 37, 395–411. [Google Scholar] [CrossRef] [PubMed]
- Hoozemans, M.J.; Kingma, I.; de Vries, W.H.; van Dieën, J.H. Effect of lifting height and load mass on low back loading. Ergonomics 2008, 51, 1053–1063. [Google Scholar] [CrossRef] [PubMed]
- Kingma, I.; Faber, G.S.; van Dieën, J.H. Supporting the upper body with the hand on the thigh reduces back loading during lifting. J. Biomech. 2016, 49, 881–889. [Google Scholar] [CrossRef] [PubMed]
- Kingma, I.; Faber, G.S.; Van Dieën, J.H. How to lift a box that is too large to fit between the knees. Ergonomics 2010, 53, 1228–1238. [Google Scholar] [CrossRef]
- Marras, W.; Granata, K.; Davis, K.; Allread, W.; Jorgensen, M. Effects of box features on spine loading during warehouse order selecting. Ergonomics 1999, 42, 980–996. [Google Scholar] [CrossRef]
- Toxiri, S.; Näf, M.B.; Lazzaroni, M.; Fernández, J.; Sposito, M.; Poliero, T.; Monica, L.; Anastasi, S.; Caldwell, D.G.; Ortiz, J. Back-Support Exoskeletons for Occupational Use: An Overview of Technological Advances and Trends. IISE Trans. Occup. Ergon. Hum. Factors 2019, 7, 237–249. [Google Scholar] [CrossRef]
- De Looze, M.P.; Bosch, T.; Krause, F.; Stadler, K.S.; O’Sullivan, L.W. Exoskeletons for industrial application and their potential effects on physical work load. Ergonomics 2016, 59, 671–681. [Google Scholar] [CrossRef] [PubMed]
- Grazi, L.; Chen, B.; Lanotte, F.; Vitiello, N.; Crea, S. Towards methodology and metrics for assessing lumbar exoskeletons in industrial applications. In Proceedings of the 2019 II Workshop on Metrology for Industry 4.0 and IoT (MetroInd4. 0&IoT), Naples, Italy, 4–6 June 2019; pp. 400–404. [Google Scholar]
- Lazzaroni, M.; Toxiri, S.; Ortiz, J.; De Momi, E.; Caldwell, D. Towards Standards for the Evaluation of Active Back-Support Exoskeletons to Assist Lifting Task. In Proceedings of the Sixth International Congress of Bioengineering (GNB), Milan, Italy, 25–27 June 2018. [Google Scholar]
- Pesenti, M.; Antonietti, A.; Gandolla, M.; Pedrocchi, A. Towards a Functional Performance Validation Standard for Industrial Low-Back Exoskeletons: State of the Art Review. Sensors 2021, 21, 808. [Google Scholar] [CrossRef] [PubMed]
- Koopman, A.S.; Toxiri, S.; Power, V.; Kingma, I.; van Dieën, J.H.; Ortiz, J.; de Looze, M.P. The effect of control strategies for an active back-support exoskeleton on spine loading and kinematics during lifting. J. Biomech. 2019, 91, 14–22. [Google Scholar] [CrossRef]
- Näf, M.B.; Koopman, A.S.; Baltrusch, S.; Rodriguez-Guerrero, C.; Vanderborght, B.; Lefeber, D. Passive back support exoskeleton improves range of motion using flexible beams. Front. Robot. AI 2018, 5, 72. [Google Scholar] [CrossRef] [PubMed]
- Koopman, A.S.; Kingma, I.; de Looze, M.P.; van Dieën, J.H. Effects of a passive back exoskeleton on the mechanical loading of the low-back during symmetric lifting. J. Biomech. 2020, 102, 109486. [Google Scholar] [CrossRef] [PubMed]
- Lanotte, F.; Grazi, L.; Chen, B.; Vitiello, N.; Crea, S. A low-back exoskeleton can reduce the erector spinae muscles activity during freestyle symmetrical load lifting tasks. In Proceedings of the 2018 7th IEEE International Conference on Biomedical Robotics and Biomechatronics (Biorob), Enschede, The Netherlands, 26–29 August 2018; pp. 701–706. [Google Scholar]
- Huysamen, K.; de Looze, M.; Bosch, T.; Ortiz, J.; Toxiri, S.; O’Sullivan, L.W. Assessment of an active industrial exoskeleton to aid dynamic lifting and lowering manual handling tasks. Appl. Ergon. 2018, 68, 125–131. [Google Scholar] [CrossRef] [PubMed]
- Bosch, T.; van Eck, J.; Knitel, K.; de Looze, M. The effects of a passive exoskeleton on muscle activity, discomfort and endurance time in forward bending work. Appl. Ergon. 2016, 54, 212–217. [Google Scholar] [CrossRef] [PubMed]
- Young, A.J.; Gannon, H.; Ferris, D.P. A biomechanical comparison of proportional electromyography control to biological torque control using a powered hip exoskeleton. Front. Bioeng. Biotechnol. 2017, 5, 37. [Google Scholar] [CrossRef] [PubMed]
- Guerrero, C.R.; Marinero, J.F.; Turiel, J.P.; Farina, P.R. Using psychophysiological feedback to enhance physical human robot interaction in a cooperative scenario. In Proceedings of the 2012 4th IEEE RAS & EMBS International Conference on Biomedical Robotics and Biomechatronics (BioRob), Rome, Italy, 24–27 June 2012; pp. 1176–1181. [Google Scholar]
- Baltrusch, S.; Van Dieën, J.; Koopman, A.; Näf, M.; Rodriguez-Guerrero, C.; Babič, J.; Houdijk, H. SPEXOR passive spinal exoskeleton decreases metabolic cost during symmetric repetitive lifting. Eur. J. Appl. Physiol. 2020, 120, 401–412. [Google Scholar] [CrossRef] [PubMed]
- Baltrusch, S.; Van Dieën, J.; Bruijn, S.; Koopman, A.; Van Bennekom, C.; Houdijk, H. The effect of a passive trunk exoskeleton on metabolic costs during lifting and walking. Ergonomics 2019, 62, 903–916. [Google Scholar] [CrossRef]
- Di Natali, C.; Sadeghi, A.; Mondini, A.; Bottenberg, E.; Hartigan, B.; De Eyto, A.; O’Sullivan, L.; Rocon, E.; Stadler, K.; Mazzolai, B.; et al. Pneumatic Quasi-Passive Actuation for Soft Assistive Lower Limbs Exoskeleton. Front. Neurorobotics 2020, 14, 31. [Google Scholar] [CrossRef]
- Hart, S.G.; Staveland, L.E. Development of NASA-TLX (Task Load Index): Results of empirical and theoretical research. In Advances in Psychology; Elsevier: Amsterdam, The Netherlands, 1988; Volume 52, pp. 139–183. [Google Scholar]
- Brooke, J. SUS: A “quick and dirty’usability. In Usability Evaluation in Industry; Taylor & Francis: Oxford, UK, 1996; p. 189. [Google Scholar]
- Ranavolo, A.; Varrecchia, T.; Iavicoli, S.; Marchesi, A.; Rinaldi, M.; Serrao, M.; Conforto, S.; Cesarelli, M.; Draicchio, F. Surface electromyography for risk assessment in work activities designed using the “revised NIOSH lifting equation”. Int. J. Ind. Ergon. 2018, 68, 34–45. [Google Scholar] [CrossRef]
- Varrecchia, T.; De Marchis, C.; Draicchio, F.; Schmid, M.; Conforto, S.; Ranavolo, A. Lifting Activity Assessment Using Kinematic Features and Neural Networks. Appl. Sci. 2020, 10, 1989. [Google Scholar] [CrossRef]
- Kee, D.; Karwowski, W. A comparison of three observational techniques for assessing postural loads in industry. Int. J. Occup. Saf. Ergon. 2007, 13, 3–14. [Google Scholar] [CrossRef]
- Delleman, N.; Dul, J. International standards on working postures and movements ISO 11226 and EN 1005-4. Ergonomics 2007, 50, 1809–1819. [Google Scholar] [CrossRef] [PubMed]
- Hignett, S.; Fray, M.; Battevi, N.; Occhipinti, E.; Menoni, O.; Tamminen-Peter, L.; Waaijer, E.; Knibbe, H.; Jäger, M. International consensus on manual handling of people in the healthcare sector: Technical report ISO/TR 12296. Int. J. Ind. Ergon. 2014, 44, 191–195. [Google Scholar] [CrossRef]
- Neumann, W.; Wells, R.; Norman, R.; Frank, J.; Shannon, H.; Kerr, M.S.; OUBPS Working Group. A posture and load sampling approach to determining low-back pain risk in occupational settings. Int. J. Ind. Ergon. 2001, 27, 65–77. [Google Scholar] [CrossRef]
- Colombini, D.; Occhipinti, E. Scientific basis of the OCRA method for risk assessment of biomechanical overload of upper limb, as preferred method in ISO standards on biomechanical risk factors. Scand. J. Work. Environ. Health 2018, 44, 436–438. [Google Scholar] [CrossRef]
- Franzblau, A.; Armstrong, T.J.; Werner, R.A.; Ulin, S.S. A cross-sectional assessment of the ACGIH TLV for hand activity level. J. Occup. Rehabil. 2005, 15, 57–67. [Google Scholar] [CrossRef] [PubMed]
- Steven Moore, J.; Garg, A. The strain index: A proposed method to analyze jobs for risk of distal upper extremity disorders. Am. Ind. Hyg. Assoc. J. 1995, 56, 443–458. [Google Scholar] [CrossRef] [PubMed]
- Waters, T.R.; Baron, S.; Kemmlert, K. Accuracy of measurements for the revised NIOSH lifting equation. Appl. Ergon. 1998, 29, 433–438. [Google Scholar] [CrossRef]
- Lu, M.L.; Putz-Anderson, V.; Garg, A.; Davis, K.G. Evaluation of the impact of the revised National Institute for Occupational Safety and Health lifting equation. Hum. Factors 2016, 58, 667–682. [Google Scholar] [CrossRef]
- Mirka, G.A.; Kelaher, D.P.; Nay, D.T.; Lawrence, B.M. Continuous assessment of back stress (CABS): A new method to quantify low-back stress in jobs with variable biomechanical demands. Hum. Factors 2000, 42, 209–225. [Google Scholar] [CrossRef]
- Hidalgo, J.; Genaidy, A.; Karwowski, W.; Christensen, D.; HusTON, R.; Stambough, J. A cross-validation of the NIOSH limits for manual lifting. Ergonomics 1995, 38, 2455–2464. [Google Scholar] [CrossRef]
- Waters, T.; Lu, M.L.; Occhipinti, E. New procedure for assessing sequential manual lifting jobs using the revised NIOSH lifting equation. Ergonomics 2007, 50, 1761–1770. [Google Scholar] [CrossRef]
- Waters, T.; Occhipinti, E.; Colombini, D.; Alvarez-Casado, E.; Fox, R. Variable Lifting Index (VLI) A New Method for Evaluating Variable Lifting Tasks. Hum. Factors 2016, 58, 695–711. [Google Scholar] [CrossRef]
- Toxiri, S.; Calanca, A.; Ortiz, J.; Fiorini, P.; Caldwell, D.G. A parallel-elastic actuator for a torque-controlled back-support exoskeleton. IEEE Robot. Autom. Lett. 2018, 3, 492–499. [Google Scholar] [CrossRef]
- Di Natali, C.; Toxiri, S.; Ioakeimidis, S.; Caldwell, D.G.; Ortiz, J. Systematic framework for performance evaluation of exoskeleton actuators. Wearable Technol. 2020, 1, E4. [Google Scholar] [CrossRef]
- Sposito, M.; Di Natali, C.; Toxiri, S.; Caldwell, D.G.; De Momi, E.; Ortiz, J. Exoskeleton kinematic design robustness: An assessment method to account for human variability. Wearable Technol. 2020, 1. [Google Scholar] [CrossRef]
- Sposito, M.; Poliero, T.; Caldwell, D.G.; De Momi, E.; Ortiz, J. Physical Comfort of Occupational Exoskeletons: Influence of Static Fit on Subjective Scores. Petra21 2021, in press. [Google Scholar]
- Poliero, T.; Toxiri, S.; Anastasi, S.; Monica, L.; Ortiz, D.G.C.J. Assessment of an On-board Classifier for Activity Recognition on an Active Back-Support Exoskeleton. In Proceedings of the 2019 IEEE 16th International Conference on Rehabilitation Robotics (ICORR), Toronto, ON, Canada, 24–28 June 2019; pp. 559–564. [Google Scholar]
- Toxiri, S.; Koopman, A.S.; Lazzaroni, M.; Ortiz, J.; Power, V.; de Looze, M.P.; O’Sullivan, L.; Caldwell, D.G. Rationale, Implementation and Evaluation of Assistive Strategies for an Active Back-Support Exoskeleton. Frontiers in Robotics and AI 2018, 5, 53. [Google Scholar] [CrossRef] [PubMed]
- Morris, J.M.; Lucas, D.B.; Bresler, B. Role of the trunk in stability of the spine. JBJS 1961, 43, 327–351. [Google Scholar] [CrossRef]
- Tichauer, E. The biomechanics of the arm-back aggregate under industrial working conditions. J. Occup. Environ. Med. 1966, 8, 346. [Google Scholar] [CrossRef]
- Chaffin, D.B. A computerized biomechanical model—Development of and use in studying gross body actions. J. Biomech. 1969, 2, 429–441. [Google Scholar] [CrossRef]
- Toxiri, S.; Ortiz, J.; Masood, J.; Fernández, J.; Mateos, L.A.; Caldwell, D.G. A wearable device for reducing spinal loads during lifting tasks: Biomechanics and design concepts. In Proceedings of the 2015 IEEE International Conference on Robotics and Biomimetics (ROBIO), Zhuhai, China, 6–9 December 2015; pp. 2295–2300. [Google Scholar]
- Stokes, I.A.; Fox, J.R.; Henry, S.M. Trunk muscular activation patterns and responses to transient force perturbation in persons with self-reported low back pain. Eur. Spine J. 2006, 15, 658–667. [Google Scholar] [CrossRef] [PubMed]
- Anders, C.; Brose, G.; Hofmann, G.O.; Scholle, H.C. Evaluation of the EMG–force relationship of trunk muscles during whole body tilt. J. Biomech. 2008, 41, 333–339. [Google Scholar] [CrossRef]
- Plamondon, A.; Serresse, O.; Boyd, K.; Ladouceur, D.; Desjardins, P. Estimated moments at L5/S1 level and muscular activation of back extensors for six prone back extension exercises in healthy individuals. Scand. J. Med. Sci. Sport. 2002, 12, 81–89. [Google Scholar] [CrossRef] [PubMed]
- Hof, A. The relationship between electromyogram and muscle force. Sportverletz. Sportschaden 1997, 11, 79–86. [Google Scholar] [CrossRef]
- Jungtäubl, D.; Aurbach, M.; Melzner, M.; Spicka, J.; Süß, F.; Dendorfer, S. EMG-based validation of musculoskeletal models considering crosstalk. In Proceedings of the 2018 International Conference BIOMDLORE, Bialystok, Poland, 28–30 June 2018; pp. 1–4. [Google Scholar]
- Ranavolo, A.; Mari, S.; Conte, C.; Serrao, M.; Silvetti, A.; Iavicoli, S.; Draicchio, F. A new muscle co-activation index for biomechanical load evaluation in work activities. Ergonomics 2015, 58, 966–979. [Google Scholar] [CrossRef]
- Granata, K.P.; Marras, W. An EMG-assisted model of trunk loading during free-dynamic lifting. J. Biomech. 1995, 28, 1309–1317. [Google Scholar] [CrossRef]
- Hermens, H.J.; Freriks, B.; Disselhorst-Klug, C.; Rau, G. Development of recommendations for SEMG sensors and sensor placement procedures. J. Electromyogr. Kinesiol. 2000, 10, 361–374. [Google Scholar] [CrossRef]
- Barbero, M.; Merletti, R.; Rainoldi, A. Atlas of Muscle Innervation Zones: Understanding Surface Electromyography and Its Applications; Springer Science & Business Media: Milan, Italy, 2012. [Google Scholar]
- Merletti, R.; Botter, A.; Troiano, A.; Merlo, E.; Minetto, M.A. Technology and instrumentation for detection and conditioning of the surface electromyographic signal: State of the art. Clin. Biomech. 2009, 24, 122–134. [Google Scholar] [CrossRef]
- Vera-Garcia, F.J.; Moreside, J.M.; McGill, S.M. MVC techniques to normalize trunk muscle EMG in healthy women. J. Electromyogr. Kinesiol. 2010, 20, 10–16. [Google Scholar] [CrossRef] [PubMed]
- Jonsson, B. Measurement and evaluation of local muscular strain in the shoulder during constrained work. J. Hum. Ergol. 1982, 11, 73–88. [Google Scholar]
- Langford, E. Quartiles in elementary statistics. J. Stat. Educ. 2006, 14. [Google Scholar] [CrossRef]
- Dunning, T.; Ertl, O. Computing extremely accurate quantiles using t-digests. arXiv 2019, arXiv:1902.04023. [Google Scholar]
- Wai, E.K.; Roffey, D.M.; Bishop, P.; Kwon, B.K.; Dagenais, S. Causal assessment of occupational lifting and low back pain: Results of a systematic review. Spine J. 2010, 10, 554–566. [Google Scholar] [CrossRef] [PubMed]
- van Dieën, J.H.; Selen, L.P.; Cholewicki, J. Trunk muscle activation in low-back pain patients, an analysis of the literature. J. Electromyogr. Kinesiol. 2003, 13, 333–351. [Google Scholar] [CrossRef]
- Andersson, G.B. Epidemiological features of chronic low-back pain. Lancet 1999, 354, 581–585. [Google Scholar] [CrossRef]
- Hägg, G.M.; Luttmann, A.; Jäger, M. Methodologies for evaluating electromyographic field data in ergonomics. J. Electromyogr. Kinesiol. 2000, 10, 301–312. [Google Scholar] [CrossRef]
- Dempster, W.T. Space Requirements of the Seated Operator, Geometrical, Kinematic, and Mechanical Aspects of the Body with Special Reference to the Limbs; Technical Report; Michigan State Univ East Lansing: East Lansing, MI, USA, 1955. [Google Scholar]
- Dempster, W.T.; Gaughran, G.R. Properties of body segments based on size and weight. Am. J. Anat. 1967, 120, 33–54. [Google Scholar] [CrossRef]
- NASA. Section 3: Anthropometry and Biomechanics. In Man-System Integration Standards; 1995. Available online: https://msis.jsc.nasa.gov/sections/section03.htm (accessed on 30 December 2020).
- Adolphe, M.; Clerval, J.; Kirchof, Z.; Lacombe-Delpech, R.; Zagrodny, B. Center of mass of human’s body segments. Mech. Mech. Eng. 2017, 21, 485–497. [Google Scholar]
- Arora, N.S.; Rochester, D.F. Effect of body weight and muscularity on human diaphragm muscle mass, thickness, and area. J. Appl. Physiol. 1982, 52, 64–70. [Google Scholar] [CrossRef]
- Arora, N.S.; Rochester, D.F. COPD and human diaphragm muscle dimensions. Chest 1987, 91, 719–724. [Google Scholar] [CrossRef]


| Index | Main Effect-EXO | Main Effect-EXO*Load | ||
|---|---|---|---|---|
| ES | = 22.384 | = 14.855 | ||
| CI | = 11.769 | = 14.795 | ||
| Category | Index | Modality | N | L | M | H | TR |
|---|---|---|---|---|---|---|---|
| Overall | ES | noExo | 4.66 ± 3.19 | 8.58 ± 4.30 | 11.93 ± 5.37 | 15.45 ± 6.77 | 3.32 |
| Overall | ES | ExoON | 3.7 ± 2.66 | 5.14 ± 3.09 | 7.92 ± 4.64 | 9.95 ± 5.18 | 2.69 |
| Overall | ES | RR | 20.6% | 40.1% | 33.6% | 35.6% | 32.5% |
| Male | ES | noExo | 3.93 ± 1.26 | 8.04 ± 2.63 | 11.16 ± 4.38 | 14.93 ± 6.20 | 3.8 |
| Male | ES | ExoON | 3.43 ± 1.10 | 4.95 ± 1.20 | 7.65 ± 3.09 | 9.27 ± 3.45 | 2.7 |
| Male | ES | RR | 12.7% | 38.4% | 31.5% | 37.9% | 30.1% |
| Female | ES | noExo | 5.38 ± 4.20 | 9.11 ± 5.44 | 12.7 ± 6.11 | 15.98 ± 7.25 | 2.97 |
| Female | ES | ExoON | 3.97 ± 3.58 | 5.33 ± 4.20 | 8.2 ± 5.78 | 10.63 ± 6.39 | 2.68 |
| Female | ES | RR | 26.2% | 41.5% | 35.4% | 33.5% | 34.1% |
| Overall | CI | noExo | 1.45 ± 1.03 | 2.46 ± 1.21 | 3.05 ± 1.29 | 3.38 ± 1.16 | 2.33 |
| Overall | CI | ExoON | 2.02 ± 0.97 | 1.67 ± 0.85 | 2.25 ± 1.13 | 2.25 ± 0.90 | 1.11 |
| Index | Main Effect-EXO | Main Effect-EXO*Load | ||
|---|---|---|---|---|
| ES | = 22.657 | = 4.479 | ||
| CI | = 19.355 | = 10.209 | ||
| Category | Index | Modality | N | L | M | H | TR |
|---|---|---|---|---|---|---|---|
| Overall | ES | noExo | 12.47 ± 4.12 | 15.67 ± 5.30 | 18.6 ± 6.04 | 24.34 ± 9.03 | 1.95 |
| Overall | ES | ExoON | 7.05 ± 4.28 | 8.51 ± 4.38 | 10.65 ± 4.30 | 13.37 ± 5.14 | 1.89 |
| Overall | ES | RR | 43.5% | 45.7% | 42.7% | 45.1% | 44.3% |
| Male | ES | noExo | 11.94 ± 3.30 | 14.88 ± 4.18 | 17.67 ± 5.25 | 22.91 ± 7.84 | 1.92 |
| Male | ES | ExoON | 6.86 ± 3.00 | 8.39 ± 3.72 | 10.1 ± 3.74 | 13.09 ± 5.22 | 1.91 |
| Male | ES | RR | 42.5% | 43.6% | 42.8% | 42.9% | 42.9% |
| Female | ES | noExo | 13.0 ± 4.75 | 16.45 ± 6.12 | 19.54 ± 6.60 | 25.77 ± 9.88 | 1.98 |
| Female | ES | ExoON | 7.23 ± 5.25 | 8.62 ± 4.95 | 11.19 ± 5.74 | 13.64 ± 5.05 | 1.89 |
| Female | ES | RR | 44.4% | 47.6% | 42.7% | 47.1% | 45.5% |
| Overall | CI | noExo | 3.13 ± 1.32 | 3.62 ± 1.42 | 3.69 ± 1.30 | 4.75 ± 1.61 | 1.52 |
| Overall | CI | ExoON | 1.98 ± 1.09 | 2.26 ± 1.17 | 2.6 ± 1.18 | 2.76 ± 1.05 | 1.4 |
| Condition | Population | RMSE | |
|---|---|---|---|
| noExo@ | Female | 99.92% | 0.115 |
| ExoON@ | Female | 98.22% | 0.344 |
| noExo@ | Female | 97.17% | 0.797 |
| ExoON@ | Female | 98.49% | 0.302 |
| noExo@ | Male | 99.75% | 0.202 |
| ExoON@ | Male | 98.77% | 0.252 |
| noExo@ | Male | 97.44% | 0.646 |
| ExoON@ | Male | 97.21% | 0.386 |
| Population | @ | @ | Mean |
|---|---|---|---|
| Overall | 0.67 | 0.67 | 0.67 |
| Male | 0.59 | 0.69 | 0.64 |
| Female | 0.73 | 0.66 | 0.695 |
| Population | @ | @ | Mean |
|---|---|---|---|
| Overall | 0.61 | 0.55 | 0.58 |
| Male | 0.56 | 0.57 | 0.565 |
| Female | 0.65 | 0.53 | 0.59 |
Publisher’s Note: MDPI stays neutral with regard to jurisdictional claims in published maps and institutional affiliations. |
© 2021 by the authors. Licensee MDPI, Basel, Switzerland. This article is an open access article distributed under the terms and conditions of the Creative Commons Attribution (CC BY) license (http://creativecommons.org/licenses/by/4.0/).
Share and Cite
Di Natali, C.; Chini, G.; Toxiri, S.; Monica, L.; Anastasi, S.; Draicchio, F.; Caldwell, D.G.; Ortiz, J. Equivalent Weight: Connecting Exoskeleton Effectiveness with Ergonomic Risk during Manual Material Handling. Int. J. Environ. Res. Public Health 2021, 18, 2677. https://doi.org/10.3390/ijerph18052677
Di Natali C, Chini G, Toxiri S, Monica L, Anastasi S, Draicchio F, Caldwell DG, Ortiz J. Equivalent Weight: Connecting Exoskeleton Effectiveness with Ergonomic Risk during Manual Material Handling. International Journal of Environmental Research and Public Health. 2021; 18(5):2677. https://doi.org/10.3390/ijerph18052677
Chicago/Turabian StyleDi Natali, Christian, Giorgia Chini, Stefano Toxiri, Luigi Monica, Sara Anastasi, Francesco Draicchio, Darwin G. Caldwell, and Jesús Ortiz. 2021. "Equivalent Weight: Connecting Exoskeleton Effectiveness with Ergonomic Risk during Manual Material Handling" International Journal of Environmental Research and Public Health 18, no. 5: 2677. https://doi.org/10.3390/ijerph18052677
APA StyleDi Natali, C., Chini, G., Toxiri, S., Monica, L., Anastasi, S., Draicchio, F., Caldwell, D. G., & Ortiz, J. (2021). Equivalent Weight: Connecting Exoskeleton Effectiveness with Ergonomic Risk during Manual Material Handling. International Journal of Environmental Research and Public Health, 18(5), 2677. https://doi.org/10.3390/ijerph18052677