
Healthcare-Seeking Behavior among Chinese Older Adults: Patterns and Predictive Factors


Abstract
1. Introduction
Ageing and Healthcare-Seeking Behavior in China
2. Materials and Methods
2.1. Data
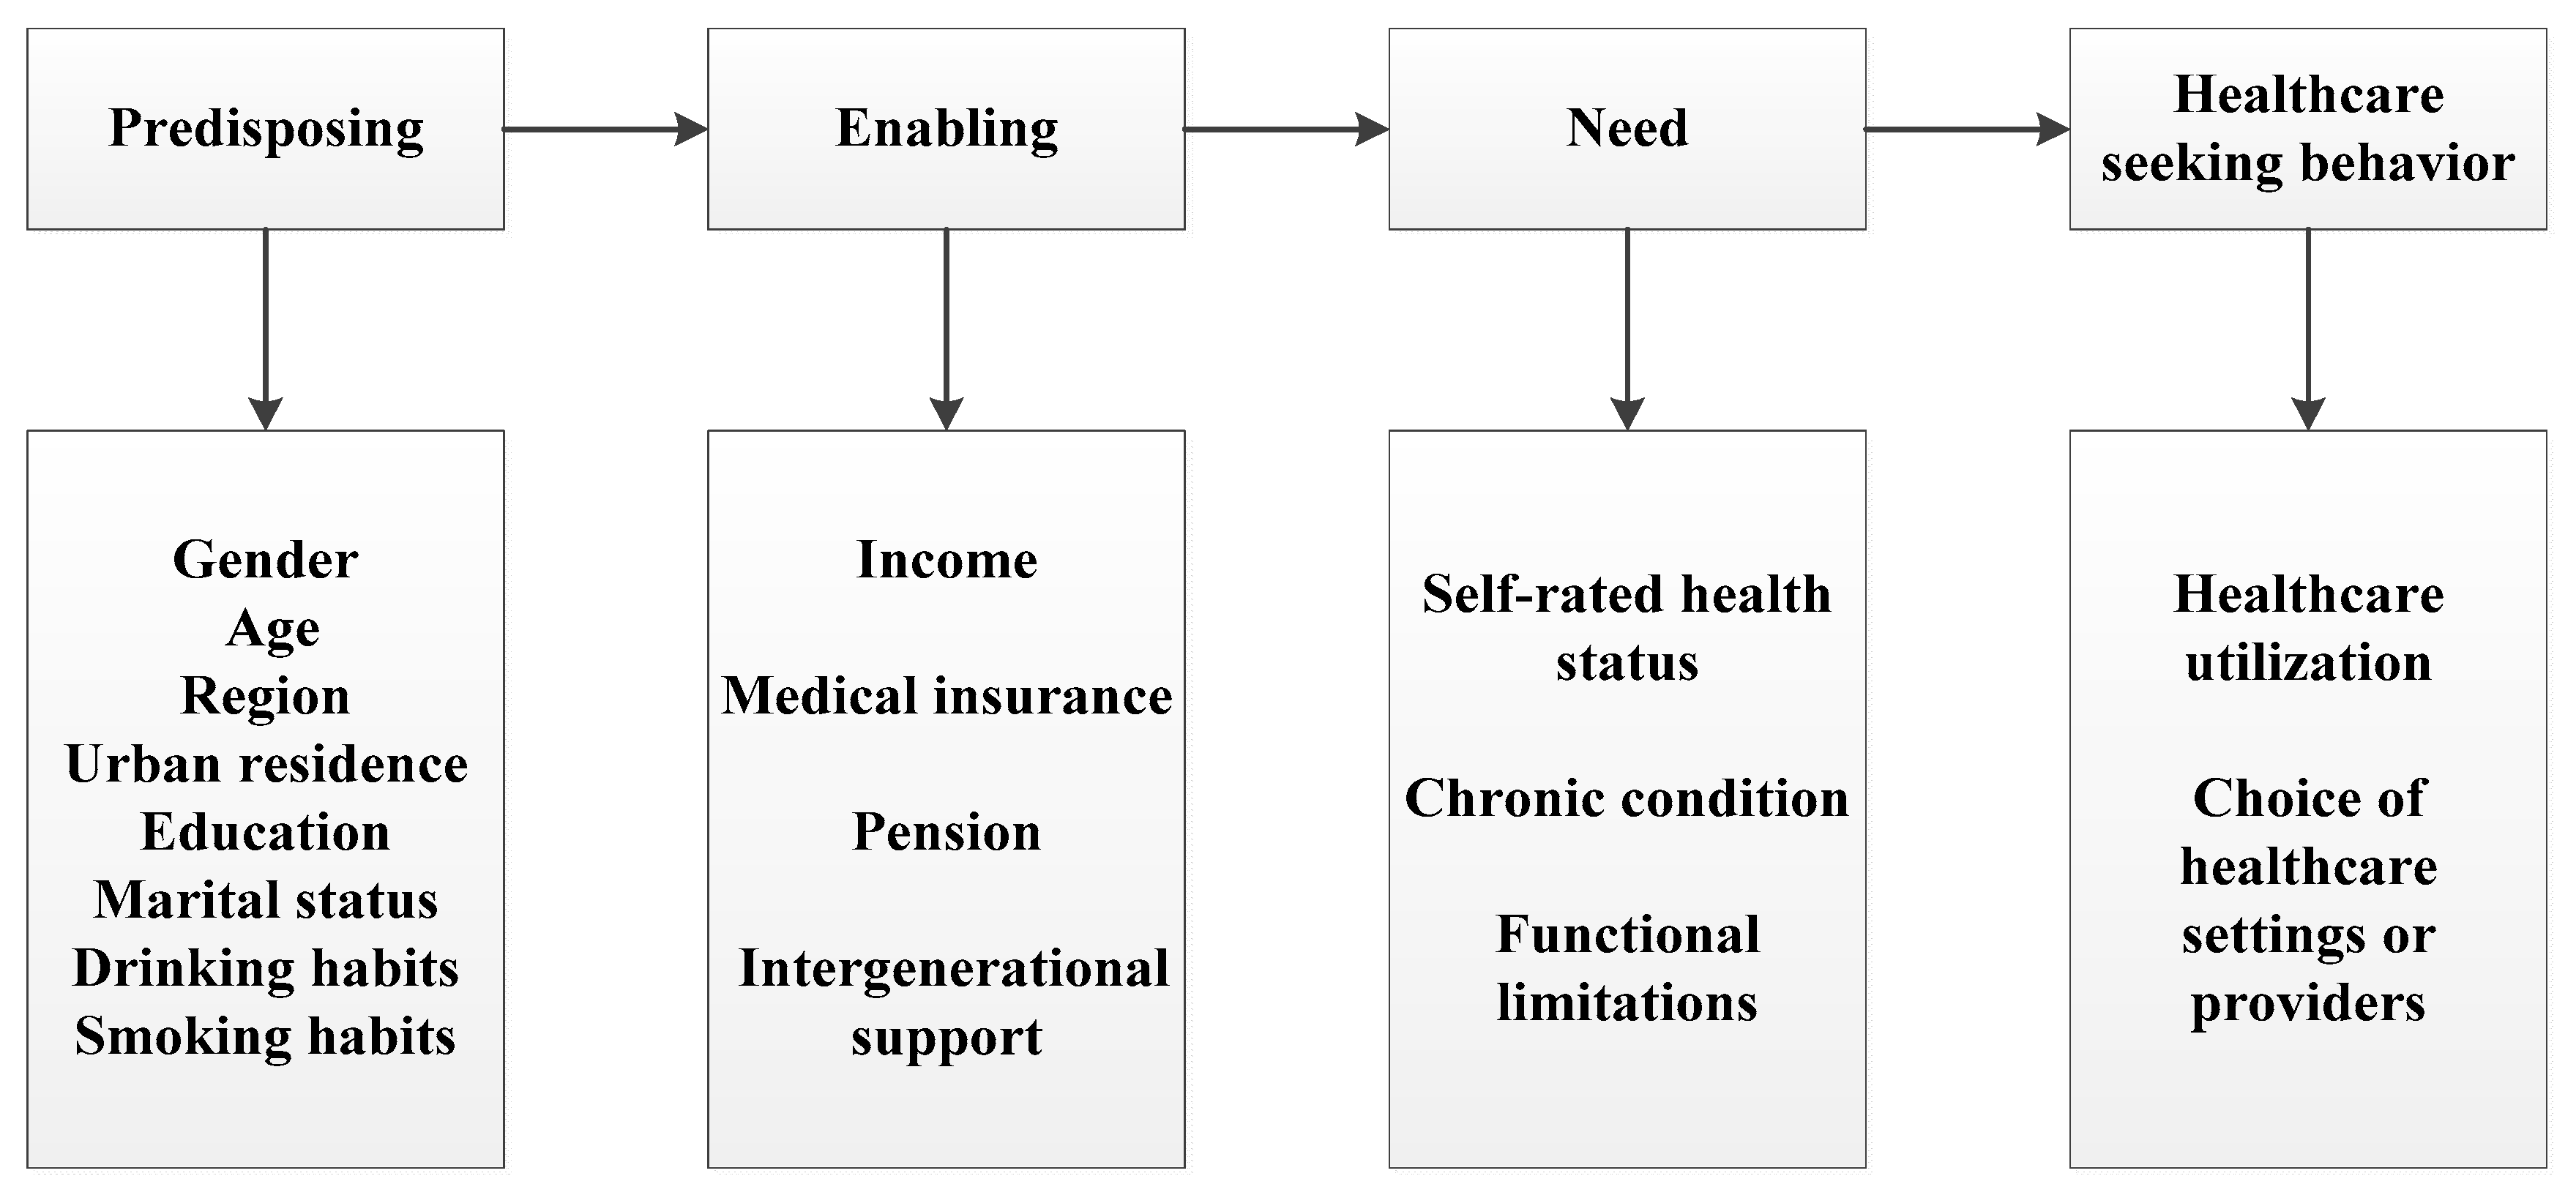
2.2. Andersen’s Behavioral Model of Health Service Use
2.3. Measures
2.4. Analysis
3. Results
3.1. Sample Characteristics
3.2. Patterns of Healthcare-Seeking Behavior
3.3. Predictors of Healthcare-Seeking Behavior
3.3.1. Healthcare Services Utilization
3.3.2. Choices of Healthcare Provider
4. Discussion
4.1. Healthcare-Seeking Behavior among Chinese Elderly People from 2011 to 2015
4.2. Predictors of Healthcare-Seeking Behavior
4.2.1. Predisposing Characteristics
4.2.2. Enabling Resources
4.2.3. Healthcare Need Factors
5. Conclusions
Author Contributions
Funding
Institutional Review Board Statement
Informed Consent Statement
Data Availability Statement
Acknowledgments
Conflicts of Interest
References
- Kasl, S.V.; Cobb, S. Health behavior, illness behavior, and sick-role behavior. II. Sick-role behavior. Arch. Env. Health 1966, 12, 531–541. [Google Scholar] [CrossRef]
- Garnick, D.W.; Lichtenberg, E.; Phibbs, C.S.; Luft, H.S.; Peltzman, D.J.; McPhee, S.J. The sensitivity of conditional choice models for hospital care to estimation technique. J. Health Econ. 1990, 8, 377–397. [Google Scholar] [CrossRef]
- Li, L.Y.; Yan, S. The Impact of Population Aging to the Growth of Health Care Cost. Soc. Secur. Stud. 2017, 3, 27–39. [Google Scholar]
- Nan-Ping, Y.; Yi-Hui, L.; Chi-Yu, C.; Jin-Chyr, H.; Liang, Y.; Nien-Tzu, C.; Chien-Lung, C. Comparisons of medical utilizations and categorical diagnoses of emergency visits between the elderly with catastrophic illness certificates and those without. BMC Health Serv Res. 2013, 13, 152. [Google Scholar] [CrossRef] [PubMed]
- Li, Q.; Lin, Y.; Qiu, Y.; Gao, B.; Xu, Y. The assessment of health-related quality of life and related factors in Chinese elderly patients undergoing chemotherapy for advanced cancer: A cross-sectional study. Eur. J. Oncol. Nurs. 2014, 18, 425–435. [Google Scholar] [CrossRef]
- Heitsch, L.E.; Panagos, P.D. Treating the elde rly stroke patient: Complications, controversies, and best care metrics. Clin. Geriatr. Med. 2013, 29, 31–255. [Google Scholar] [CrossRef]
- Zhu, Y. Annual Report on China’s Private Hospitals Development; Social Sciences Academic Press: Beijing, China, 2013. [Google Scholar]
- Eggleston, K.; Lu, M.; Li, C.; Wang, J.; Yang, Z.; Zhang, J.; Quan, H. Comparing public and private hospitals in China: Evidence from Guangdong. BMC Health Serv. Res. 2010, 10, 76. [Google Scholar] [CrossRef]
- Liu, Y.; Berman, P.; Yip, W. Health care in China: The role of non-government providers. Health Policy 2006, 77, 212–220. [Google Scholar] [CrossRef]
- Health and Family Planning Commission, People’s Republic of China. In China Health Statistical Yearbook; Peking Union Medical Press: Beijing, China, 2015.
- Liu, M.; Zhang, Q.; Lu, M.; Kwon, C.S.; Quan, H. Rural and urban disparity in health services utilization in China. Med. Care 2007, 45, 767–774. [Google Scholar] [CrossRef] [PubMed]
- Yu, W.Y.; Li, M.N.; Ye, F.; Xue, C.; Zhang, L.L. Patient preference and choice of healthcare providers in Shanghai, China: A cross-sectional study. BMJ Open 2017, 7. [Google Scholar] [CrossRef] [PubMed]
- Wang, Q.; Zhang, D.; Hou, Z. Insurance coverage and socioeconomic differences in patient choice between private and public health care providers in China. Soc. Sci. Med. 2016, 170, 124–132. [Google Scholar] [CrossRef]
- Wang, C.; Rao, K.; Wu, S.; Liu, Q. Health Care in China: Improvement, Challenges, and Reform. Chest 2013, 143, 524–531. [Google Scholar] [CrossRef]
- Chen, H.; Chi, I.; Liu, R. Hospital Utilization Among Chinese Older Adults: Patterns and Predictors. J. Aging Health 2018. [Google Scholar] [CrossRef] [PubMed]
- Cheng, S.H.; Chiang, T. Disparity of medical care utilization among different health insurance schemes in Taiwan. Soc. Sci. Med. 1998, 47, 613–620. [Google Scholar] [CrossRef]
- Li, X.; Zhang, W. The impacts of health insurance on health care utilization among the older people in China. Soc. Sci. Med. 2013, 85, 59–65. [Google Scholar] [CrossRef]
- Wang, Z.; Li, X.; Chen, M.; Si, L. Social health insurance, healthcare utilization, and costs in middle-aged and elderly community-dwelling adults in China. Int. J. Equity Health 2018, 17, 17. [Google Scholar] [CrossRef]
- Zeng, Y.; Li, J.; Yuan, Z.; Fang, Y. The effect of China’s new cooperative medical scheme on health expenditures among the rural elderly. Int. J. Equity Health 2019, 18, 27. [Google Scholar] [CrossRef] [PubMed]
- Zhang, C.; Lei, X.; Strauss, J.; Zhao, Y. Health Insurance and Health Care among the Mid-Aged and Older Chinese: Evidence from the National Baseline Survey of CHARLS. Health Econ. 2017, 26, 431–449. [Google Scholar] [CrossRef] [PubMed]
- Song, Y.; Bian, Y. Gender differences in the use of health care in China: Cross-sectional analysis. Int. J. Equity Health 2014, 13, 8. [Google Scholar] [CrossRef] [PubMed]
- Zhu, D.; Guo, N.; Wang, J.; Nicholas, S.; Chen, L. Socioeconomic inequalities of outpatient and inpatient service utilization in China: Personal and regional perspectives. Int. J. Equity Health 2017, 16, 210. [Google Scholar] [CrossRef]
- Yip, W.C.; Wang, H.; Liu, Y. Determinants of patient choice of medical provider: A case study in rural China. Health Policy Plan. 1998, 13, 311–322. [Google Scholar] [CrossRef] [PubMed]
- Brown, P.H.; Theoharides, C. Health-seeking behavior and hospital choice in China’s New Cooperative Medical System. Health Econ. 2009, 18 (Suppl. 2), S47–S64. [Google Scholar] [CrossRef]
- Liu, Y.; Kong, Q.; de Bekker-Grob, E.W. Public preferences for health care facilities in rural China: A discrete choice experiment. Soc. Sci. Med. 2019, 237, 112396. [Google Scholar] [CrossRef]
- Ali, S.; Cookson, R.; Dusheiko, M. Addressing care-seeking as well as insurance-seeking selection biases in estimating the impact of health insurance on out-of-pocket expenditure. Soc. Sci. Med. 2017, 177, 127–140. [Google Scholar] [CrossRef] [PubMed][Green Version]
- Zhao, Y.H.; Hu, Y.S.; Smith, J.P.; Strauss, J.; Yang, G.H. Cohort Profile: The China Health and Retirement Longitudinal Study (CHARLS). Int. J. Epidemiol. 2014, 43, 61–68. [Google Scholar] [CrossRef] [PubMed]
- Andersen, R.M. Revisiting the Behavioral Model and Access to Medical Care: Does it Matter? J. Health Soc. Behav. 1995, 36. [Google Scholar] [CrossRef]
- Evashwick, C.; Rowe, G.; Diehr, P.; Branch, L. Factors explaining the use of health care services by the elderly. Health Serv. Res. 1984, 19, 357–382. [Google Scholar]
- Heider, D.; Matschinger, H.; Muller, H.; Saum, K.U.; Quinzler, R.; Haefeli, W.E. Health care costs in the elderly in Germany: An analysis applying Andersen’s behavioral model of health care utilization. BMC Health Serv. Res. 2014, 14, 71. [Google Scholar] [CrossRef]
- Ogunsanya, M.E.; Jiang, S.; Thach, A.V.; Bamgbade, B.A.; Brown, C.M. Predictors of prostate cancer screening using Andersen’s Behavioral Model of Health Services Use. Urol Oncol 2016, 34, 529-e9. [Google Scholar] [CrossRef]
- Zuzana, S.; Sonia, I.; Cristina, S. Understanding the drivers for Natura 2000 payments in forests: A Heckman selection analysis. J. Nat. Conserv. 2018. [Google Scholar] [CrossRef]
- Byrd, D.T.; Mizruchi, M.S. Bankers on the board and the debt ratio of firms. J. Corp. Financ. 2005, 11, 129–173. [Google Scholar] [CrossRef]
- Heckman, J.J. Sample Selection Bias as a Specification Error. Econometrica 1979, 47. [Google Scholar] [CrossRef]
- Li, X.; Lu, J.P.; Hu, S.; Cheng, K.K.; De Maeseneer, J.; Meng, Q. The primary health-care system in China. Lancet 2017, 390, 2584–2594. [Google Scholar] [CrossRef]
- Kim, A.M.; Cho, S.; Kim, H.J.; Jung, H.; Jo, M.W.; Lee, J.Y.; Eun, S.J. Primary Care Patients’ Preference for Hospitals over Clinics in Korea. Int. J. Env. Res. Public Health 2018, 15, 1119. [Google Scholar] [CrossRef]
- Kim, R. A logit analysis of hospital choice behavior in Chollabukdo Province of Korea. Soc. Sci. Med. 1990, 30, 1119–1129. [Google Scholar] [CrossRef]
- Lee, J.C.; Kim, K.H.; Kim, H.N.; Park, Y.H. Factors associated with the hypertension outpatients’ choice of healthcare providers in Korea. J. Korean Med. Assoc. Taehan Uisa Hyophoe Chi 2011, 54, 961–970. [Google Scholar] [CrossRef][Green Version]
- You, C.H.; Kwon, Y.D. Factors influencing medical institution selection for outpatient services. J. Korean Med. Assoc. Taehan Uisa Hyophoe Chi 2012, 55, 898–910. [Google Scholar] [CrossRef]
- Anson, O.; Paran, E.; Neumann, L.; Chernichovsky, D. Gender Differences in Health Perceptions and Their Predictors. Soc. Sci. Med. 1993, 36, 419–427. [Google Scholar] [CrossRef]
- Crimmins, E.M.; Kim, J.K.; Sole-Auro, A. Gender differences in health: Results from SHARE, ELSA and HRS. Eur. J. Public Health 2011, 21, 81–91. [Google Scholar] [CrossRef] [PubMed]
- Zeng, Y.; Feng, Q.; Hesketh, T.; Christensen, K.; Vaupel, J.W. Survival, disabilities in activities of daily living, and physical and cognitive functioning among the oldest-old in China: A cohort study. Lancet 2017, 389, 1619–1629. [Google Scholar] [CrossRef]
- Liu, Y.; Zhong, L.W.; Yuan, S.S.; van de Klundert, J. Why patients prefer high-level healthcare facilities: A qualitative study using focus groups in rural and urban China. BMJ Glob. Health 2018, 3, e000854. [Google Scholar] [CrossRef]
- Bergner, L.; Yerby, A.S. Low income and barriers to use of health services. N. Engl. J. Med. 1968, 278, 541–546. [Google Scholar] [CrossRef] [PubMed]
- Khullar, D.; Chokshi, D.A. Health, Income, & Poverty: Where We Are & What Could Help. Health Affairs Health Policy Brief. 2018. [Google Scholar] [CrossRef]
- Andersen, R.; Chen, M.S.; Aday, L.A.; Cornelius, L. Health Status and Medical Care Utilization. Health Aff. 1987, 6, 136–156. [Google Scholar] [CrossRef] [PubMed][Green Version]
- Mielck, A.; Kiess, R.; von dem Knesebeck, O.; Stirbu, I.; Kunst, A.E. Association between forgone care and household income among the elderly in five Western European countries—analyses based on survey data from the SHARE-study. BMC Health Serv Res. 2009, 9, 52. [Google Scholar] [CrossRef]
- Meyer, S.B.; Luong, T.C.; Mamerow, L.; Ward, P.R. Inequities in access to healthcare: Analysis of national survey data across six Asia-Pacific countries. BMC Health Serv Res. 2013, 13, 238. [Google Scholar] [CrossRef] [PubMed]
- Zhang, L.; Wang, Z.; Qian, D.; Ni, J. Effects of changes in health insurance reimbursement level on outpatient service utilization of rural diabetics: Evidence from Jiangsu Province, China. BMC Health Serv. Res. 2014, 14, 185. [Google Scholar] [CrossRef]
- Wang, H.; Zhang, D.; Hou, Z.; Yan, F.; Hou, Z. Association between social health insurance and choice of hospitals among internal migrants in China: A national cross-sectional study. BMJ Open 2018, 8, e018440. [Google Scholar] [CrossRef] [PubMed]
- Hu, A. Providing More but Receiving Less: Daughters in Intergenerational Exchange in Mainland China. J. Marriage Fam. 2017, 79, 739–757. [Google Scholar] [CrossRef]
- Chen, F.; Liu, G. The health implications of grandparents caring for grandchildren in China. J. Gerontol B Psychol. Sci. Soc. Sci. 2012, 67, 99–112. [Google Scholar] [CrossRef]
- Zhu, B.; Mao, Y. Intergenerational Support, Social Capital and Medical Service Utilization—An Empirical Analysis Using CHARSL Data. Soc. Secur. Stud. 2017, 1, 48–59. [Google Scholar]
- Bo, Y. The impact of intergenerational support on medical consumption among rural elderly. Consum. Econ. 2016, 32, 16–23. [Google Scholar]
- Harris, B.; Goudge, J.; Ataguba, J.E.; McIntyre, D.; Nxumalo, N.; Jikwana, S.; Chersich, M. Inequities in access to health care in South Africa. J. Public Health Policy 2011, 32 (Suppl. 1), S102–S123. [Google Scholar] [CrossRef] [PubMed]
- Syed, S.T.; Gerber, B.S.; Sharp, L.K. Traveling towards disease: Transportation barriers to health care access. J. Community Health 2013, 38, 976–993. [Google Scholar] [CrossRef] [PubMed]
- Luft, H.S. Does Quality Influence Choice of Hospital? JAMA J. Am. Med. Assoc. 1990, 263. [Google Scholar] [CrossRef]
- Kim, J.; Frank-Miller, E. Poverty, Health Insurance Status, and Health Service Utilization Among the Elderly. J. Poverty 2015, 19, 424–444. [Google Scholar] [CrossRef]
- Chatterjee, C.; Nayak, N.C.; Mahakud, J.; Chatterjee, S.C. Factors affecting the choice of health care utilisation between private and public services among the elderly population in India. Int. J. Health Plann Manag. 2019, 34, e736–e751. [Google Scholar] [CrossRef] [PubMed]


| Variable | Total | Outpatient (%) | |||||
|---|---|---|---|---|---|---|---|
| Utilization | Non-Utilization | Public | Private | Primary | Higher-Level | ||
| Total | 32.41 | 67.59 | 72.93 | 27.07 | 57.63 | 42.37 | |
| Gender | |||||||
| Male | 49.48 | 31.21 ** | 68.79 ** | 75.65 ** | 24.35 ** | 53.40 *** | 46.6 *** |
| Female | 50.52 | 33.55 | 66.45 | 70.62 | 29.38 | 61.23 | 38.77 |
| Age | |||||||
| 60–79 | 89.57 | 32.24 ** | 67.76 ** | 72.88 | 27.12 | 57.01 *** | 42.99 *** |
| ≥80 | 10.43 | 35.80 | 64.2 | 72.57 | 27.43 | 65.34 | 34.66 |
| Region | |||||||
| East | 31.32 | 30.56 *** | 69.44 *** | 80.12 *** | 19.88 *** | 54.26 *** | 45.74 *** |
| Central | 28.45 | 31.65 | 68.35 | 63.19 | 36.81 | 63.62 | 36.38 |
| West | 33.28 | 35.72 | 64.28 | 73.21 | 26.79 | 59.50 | 40.5 |
| North-east | 6.95 | 27.92 | 72.08 | 80.90 | 19.1 | 27.47 | 72.53 |
| Residence | |||||||
| Rural | 71.08 | 31.85 * | 68.15 * | 69.44 *** | 30.56 *** | 66.82 *** | 33.18 *** |
| Urban | 28.92 | 33.82 | 66.18 | 82.31 | 17.69 | 32.75 | 67.25 |
| Education | |||||||
| No formal education | 56.78 | 32.43 | 67.57 | 68.96 *** | 31.04 *** | 66.94 *** | 33.06 *** |
| Elementary school | 22.02 | 31.76 | 68.24 | 74.15 | 25.85 | 54.78 | 45.22 |
| Middle school and above | 21.20 | 33.90 | 66.1 | 82.08 | 17.92 | 39.76 | 60.24 |
| Marital status | |||||||
| Unmarried | 21.42 | 35.04 *** | 64.96 *** | 68.09 *** | 31.91 *** | 62.63 ** | 37.37 ** |
| Married | 78.58 | 31.69 | 68.31 | 74.28 | 25.72 | 56.25 | 43.75 |
| Medical insurance | |||||||
| No insurance | 10.58 | 27.45 *** | 72.55 *** | 72.41 *** | 27.59 *** | 58.33 *** | 41.67 *** |
| UEMI | 10.95 | 36.99 | 63.01 | 82.17 | 17.83 | 31.90 | 68.1 |
| URMI | 5.83 | 30.76 | 69.24 | 75.79 | 24.21 | 49.48 | 50.52 |
| NCMS | 66.08 | 31.96 | 68.04 | 69.37 | 30.63 | 65.44 | 34.56 |
| Others | 6.57 | 37.80 | 62.2 | 90.12 | 9.88 | 33.94 | 66.06 |
| Self-reported health | |||||||
| Not good | 76.5 | 36.40 *** | 63.60 *** | 72.79 | 27.21 | 57.83 | 42.17 |
| Good | 23.5 | 18.23 | 81.77 | 76.05 | 23.95 | 60.74 | 39.26 |
| ADL difficulty | |||||||
| No | 60.75 | 26.26 *** | 73.74 *** | 74.47 * | 25.53 * | 56.39 ** | 43.61 ** |
| Yes | 39.25 | 41.93 | 58.07 | 71.26 | 28.74 | 59.04 | 40.96 |
| Variable | Total | Inpatient (%) | |||||
|---|---|---|---|---|---|---|---|
| Utilization | Non-Utilization | Public | Private | Primary | Higher-Level | ||
| Total | 17.68 | 82.32 | 92.18 | 7.82 | 17.00 | 83 | |
| Gender | |||||||
| Male | 49.48 | 17.50 | 82.50 | 92.50 | 7.50 | 16.43 | 83.57 |
| Female | 50.52 | 17.83 | 82.17 | 91.86 | 8.14 | 17.57 | 82.43 |
| Age | |||||||
| 60–79 | 89.57 | 22.63 *** | 77.37 *** | 91.73 | 8.27 | 16.44 | 83.56 |
| ≥80 | 10.43 | 17.23 | 82.77 | 94.71 | 5.29 | 21.39 | 78.61 |
| Region | |||||||
| East | 31.32 | 15.22 *** | 84.78 *** | 94.33 *** | 5.67 *** | 12.72 *** | 87.28 *** |
| Central | 28.45 | 17.07 | 82.93 | 92.27 | 7.73 | 20.85 | 79.15 |
| West | 33.28 | 20.09 | 79.91 | 92.47 | 7.53 | 18.40 | 81.6 |
| North-east | 6.95 | 19.63 | 80.37 | 83.04 | 16.96 | 11.61 | 88.39 |
| Residence | |||||||
| Rural | 71.08 | 16.85 *** | 83.15 *** | 93.01 * | 6.99 * | 21.65 *** | 78.35 *** |
| Urban | 28.92 | 19.78 | 80.22 | 90.46 | 9.54 | 7.14 | 92.86 |
| Education | |||||||
| No formal education | 56.78 | 17.65 | 82.35 | 93.02 | 6.98 | 20.30 *** | 79.70 *** |
| Elementary school | 22.02 | 16.96 | 83.04 | 93.16 | 6.84 | 19.19 | 80.81 |
| Middle school and above | 21.20 | 18.57 | 81.43 | 89.24 | 10.76 | 9.00 | 91 |
| Marital status | |||||||
| Unmarried | 21.42 | 20.20 *** | 79.8 *** | 92.96 | 7.04 | 19.83 | 80.17 |
| Married | 78.58 | 16.99 | 83.01 | 91.91 | 8.09 | 16.08 | 83.92 |
| Medical insurance | |||||||
| No insurance | 10.58 | 15.97 *** | 84.03 *** | 96.12 | 3.88 | 14.06 *** | 85.94 *** |
| UEMI | 10.95 | 22.92 | 77.08 | 90.55 | 9.45 | 5.64 | 94.36 |
| URMI | 5.83 | 18.21 | 81.79 | 91.40 | 8.6 | 6.45 | 93.55 |
| NCMS | 66.08 | 16.78 | 83.22 | 92.51 | 7.49 | 22.20 | 77.8 |
| Others | 6.57 | 20.55 | 79.45 | 87.37 | 12.63 | 8.16 | 91.84 |
| Self-reported health | |||||||
| Not good | 76.5 | 19.67 *** | 80.33 *** | 91.72 | 8.28 | 16.87 | 83.13 |
| Good | 23.5 | 9.32 | 90.68 | 92.31 | 7.69 | 16.94 | 83.06 |
| ADL difficulty | |||||||
| No | 60.75 | 12.50 *** | 87.5 *** | 91.82 | 8.18 | 15.12 * | 84.88 * |
| Yes | 39.25 | 25.69 | 74.31 | 92.45 | 7.55 | 18.58 | 81.42 |
| Variables | Outpatient | Inpatient | ||
|---|---|---|---|---|
| Coef. | S.E. | Coef. | S.E. | |
| Predisposing characteristics | ||||
| Gender (ref: female) | −0.04 | (0.04) | 0.16 *** | (0.05) |
| Age (ref: 60–79) | −0.08 | (0.06) | 0.11 ** | (0.06) |
| Region (ref: east) | ||||
| Central | −0.08 ** | (0.04) | −0.01 | (0.04) |
| West | 0.02 | (0.04) | 0.10 ** | (0.04) |
| North-east | −0.36 *** | (0.07) | 0.08 | (0.06) |
| Urban residence (ref: rural) | −0.05 | (0.04) | 0.04 | (0.04) |
| Education (ref: no formal education) | ||||
| Elementary school | 0.01 | (0.04) | −0.01 | (0.04) |
| Middle school and above | 0.08 * | (0.04) | 0.04 | (0.05) |
| Married (ref: unmarried) | −0.02 | (0.04) | −0.08 ** | (0.04) |
| Smoking | −0.03 | (0.04) | −0.02 | (0.04) |
| Drinking | −0.03 | (0.04) | −0.21 *** | (0.04) |
| Healthcare satisfaction | −0.01 | (0.01) | −0.04 *** | (0.01) |
| Enabling resources | ||||
| Logpce | 0.04 *** | (0.01) | 0.05 *** | (0.01) |
| Medical insurance (ref: no insurance) | ||||
| UEMI | 0.13 * | (0.07) | 0.21 *** | (0.07) |
| URMI | −0.05 | (0.08) | 0.07 | (0.08) |
| NCMS | 0.08 | (0.05) | 0.06 | (0.05) |
| Others | 0.29 *** | (0.09) | 0.08 | (0.09) |
| Multiple medical insurances | −0.08 | (0.09) | 0.08 | (0.09) |
| Pension | 0.07 ** | (0.03) | −0.02 | (0.03) |
| Number of children alive | 0.02 ** | (0.01) | 0.02 ** | (0.01) |
| Number of children living together | 0.02 | (0.02) | −0.02 | (0.02) |
| Economic support from children | 0.01 ** | (0.00) | 0.01 | (0.01) |
| Economic support to children | −0.01 ** | (0.00) | 0.00 | (0.00) |
| Caring grandchildren | 0.06 * | (0.03) | −0.06 * | (0.03) |
| Need factors | ||||
| Self-reported health (ref: not good) | −0.34 *** | (0.04) | −0.20 *** | (0.04) |
| Number of chronic diseases | 0.13 *** | (0.01) | 0.17 *** | (0.01) |
| ADL difficulty (ref: no) | 0.14 *** | (0.03) | 0.32 *** | (0.03) |
| Observations | 10,164 | 10161 | ||
| Prob > chi2 | <0.001 | <0.001 | ||
| Log likelihood | −4928.20 | −4305.50 | ||
| pseudo R-squared | 0.12 | 0.09 | ||
| Variables | Outpatient | Inpatient | ||
|---|---|---|---|---|
| Coef. | S.E. | Coef. | S.E. | |
| Predisposing characteristics | ||||
| Gender (ref: female) | 0.10 | (0.12) | −0.01 | (0.24) |
| Age (ref: 60–79) | 0.11 | (0.16) | 0.16 | (0.32) |
| Region (ref: east) | ||||
| Central | −0.29 *** | (0.10) | −0.12 | (0.23) |
| West | −0.04 | (0.10) | −0.29 | (0.23) |
| North-east | −0.07 | (0.22) | −0.87 *** | (0.29) |
| Urban residence (ref: rural) | 0.23 ** | (0.11) | 0.01 | (0.21) |
| Education (ref: no formal education) | ||||
| Elementary school | −0.05 | (0.10) | −0.01 | (0.21) |
| Middle school and above | 0.12 | (0.12) | −0.22 | (0.21) |
| Married (ref: unmarried) | 0.20 ** | (0.10) | 0.29 | (0.19) |
| Smoking | −0.02 | (0.12) | −0.13 | (0.22) |
| Drinking | −0.03 | (0.10) | −0.01 | (0.20) |
| Healthcare satisfaction | −0.06 * | (0.03) | −0.02 | (0.07) |
| Enabling resources | ||||
| Logpce | −0.03 | (0.03) | 0.01 | (0.06) |
| Medical insurance (ref: no insurance) | ||||
| UEMI | −0.03 | (0.20) | −0.33 | (0.44) |
| URMI | 0.07 | (0.21) | −0.46 | (0.46) |
| NCMS | 0.07 | (0.15) | −0.29 | (0.36) |
| Others | 0.47 * | (0.27) | −1.19 ** | (0.51) |
| Multiple medical insurances | 0.11 | (0.25) | 0.59 | (0.45) |
| Pension | 0.12 | (0.09) | −0.17 | (0.19) |
| Number of children alive | −0.03 | (0.03) | −0.15 *** | (0.05) |
| Number of children living together | −0.09 * | (0.05) | 0.28 ** | (0.12) |
| Economic support from children | 0.00 | (0.01) | 0.00 | (0.03) |
| Economic support to children | −0.00 | (0.01) | −0.01 | (0.02) |
| Caring grandchildren | −0.02 | (0.08) | −0.03 | (0.16) |
| One-way travel time | 0.02 | (0.02) | 0.03 | (0.07) |
| Means of transport (ref: others) | ||||
| Bus | 0.21 * | (0.11) | 0.32 * | (0.18) |
| Walk | −0.43 *** | (0.10) | 0.22 | (0.28) |
| Travel cost | −0.02 | (0.04) | 0.02 | (0.06) |
| Total medical cost | 0.10 *** | (0.03) | 0.31 *** | (0.08) |
| Out-of-pocket portion | −1.04 *** | (0.15) | −0.22 | (0.26) |
| Need factors | ||||
| Self-reported health (ref: not good) | 0.12 | (0.12) | 0.05 | (0.24) |
| Number of chronic diseases | 0.00 | (0.02) | 0.03 | (0.04) |
| ADL difficulty (ref: no) | −0.04 | (0.08) | −0.04 | (0.16) |
| Emergency | 0.96 *** | (0.31) | — | — |
| Observations | 1518 | 716 | ||
| Prob > chi2 | <0.001 | 0.001 | ||
| Log likelihood | −756.41 | −169.72 | ||
| pseudo R-squared | 0.15 | 0.16 | ||
| Variables | Outpatient Outcome Model | Outpatient Selection Model | Inpatient Outcome Model | Inpatient Selection Model | ||||
|---|---|---|---|---|---|---|---|---|
| Coef. | S.E. | Coef. | S.E. | Coef. | S.E. | Coef. | S.E. | |
| Predisposing characteristics | ||||||||
| Gender (ref: female) | 0.01 | (0.09) | 0.01 | (0.05) | 0.07 | (0.12) | 0.19 *** | (0.05) |
| Age (ref: 60–79) | −0.02 | (0.12) | −0.14 ** | (0.07) | 0.26 * | (0.15) | 0.07 | (0.07) |
| Region (ref: east) | ||||||||
| Central | −0.00 | (0.07) | −0.04 | (0.04) | 0.22 * | (0.11) | 0.06 | (0.05) |
| West | 0.04 | (0.07) | 0.07 * | (0.04) | 0.17 | (0.11) | 0.15 *** | (0.05) |
| North-east | −0.38 *** | (0.14) | −0.33 *** | (0.08) | 0.18 | (0.18) | 0.20 *** | (0.07) |
| Urban residence (ref: rural) | −0.6 2 *** | (0.11) | −0.09 ** | (0.04) | −0.41 *** | (0.13) | 0.10 ** | (0.05) |
| Education (ref: no formal education) | ||||||||
| Elementary school | −0.05 | (0.07) | 0.04 | (0.04) | 0.12 | (0.10) | −0.01 | (0.05) |
| Middle school and above | −0.08 | (0.08) | 0.09 * | (0.05) | −0.11 | (0.12) | 0.08 | (0.05) |
| Married (ref: unmarried) | 0.05 | (0.07) | 0.01 | (0.04) | 0.01 | (0.10) | −0.08 * | (0.05) |
| Smoking | −0.14 * | (0.08) | −0.06 | (0.05) | 0.00 | (0.11) | −0.01 | (0.05) |
| Drinking | 0.06 | (0.07) | −0.02 | (0.04) | −0.05 | (0.11) | −0.22 *** | (0.05) |
| Healthcare satisfaction | 0.01 | (0.02) | −0.00 | (0.01) | 0.01 | (0.04) | −0.03 ** | (0.02) |
| Enabling resources | ||||||||
| Logpce | 0.01 | (0.02) | 0.06 *** | (0.01) | 0.08 ** | (0.03) | 0.10 *** | (0.02) |
| Medical insurance (ref: no insurance) | ||||||||
| UEMI | 0.04 | (0.14) | 0.17 ** | (0.08) | 0.07 | (0.22) | 0.23 *** | (0.09) |
| URMI | 0.02 | (0.15) | 0.08 | (0.09) | −0.06 | (0.25) | 0.13 | (0.10) |
| NCMS | 0.18 * | (0.10) | 0.17 *** | (0.06) | 0.23 | (0.16) | 0.13 ** | (0.07) |
| Others | −0.13 | (0.19) | 0.31 *** | (0.10) | −0.28 | (0.30) | −0.01 | (0.12) |
| Multiple medical insurances | 0.19 | (0.17) | −0.05 | (0.09) | 0.37 | (0.26) | 0.15 | (0.11) |
| Pension | 0.00 | (0.06) | 0.07 ** | (0.04) | −0.05 | (0.09) | 0.01 | (0.04) |
| Number of children alive | 0.07 *** | (0.02) | 0.02 | (0.01) | 0.02 | (0.03) | 0.02 | (0.01) |
| Number of children living together | 0.06 * | (0.04) | 0.01 | (0.02) | 0.01 | (0.05) | −0.01 | (0.02) |
| Economic support from children | 0.01 | (0.01) | 0.01 ** | (0.01) | 0.02 | (0.01) | 0.01 ** | (0.01) |
| Economic support to children | −0.01 | (0.01) | −0.01 | (0.00) | 0.01 | (0.01) | 0.00 | (0.00) |
| Caring grandchildren | 0.11 ** | (0.05) | 0.06 * | (0.03) | −0.03 | (0.09) | −0.02 | (0.04) |
| One-way travel time | −0.02 | (0.01) | — | — | −0.01 | (0.02) | — | — |
| Means of transport (ref: others) | ||||||||
| Bus | −0.40 *** | (0.09) | — | — | −0.25 *** | (0.09) | — | — |
| Walk | 0.27 *** | (0.08) | — | — | 0.08 | (0.12) | — | — |
| Travel cost | −0.13 *** | (0.03) | — | — | −0.13 *** | (0.03) | — | — |
| Total medical cost | −0.18 *** | (0.03) | — | — | −0.39 *** | (0.07) | — | — |
| Out-of-pocket portion | −0.11 | (0.08) | — | — | −0.32 ** | (0.12) | — | — |
| Need factors | ||||||||
| Self-reported health (ref: not good) | −0.34 *** | (0.08) | −0.35 *** | (0.04) | 0.04 | (0.12) | −0.18 *** | (0.05) |
| Number of chronic diseases | 0.12 *** | (0.02) | 0.13 *** | (0.01) | 0.11 *** | (0.02) | 0.15 *** | (0.01) |
| ADL difficulty (ref: no) | 0.06 | (0.06) | 0.05 | (0.04) | 0.19 ** | (0.08) | 0.26 *** | (0.04) |
| Emergency | −0.52 *** | (0.16) | — | — | — | — | — | — |
| Observations | 9543 | 9418 | ||||||
| Inverse Mills ratio | 1.58 *** | (0.34) | 1.32 *** | (0.34) | ||||
| Prob > chi2 | <0.001 | 0.001 | ||||||
| Log likelihood | −4517.29 | −3350.70 | ||||||
Publisher’s Note: MDPI stays neutral with regard to jurisdictional claims in published maps and institutional affiliations. |
© 2021 by the authors. Licensee MDPI, Basel, Switzerland. This article is an open access article distributed under the terms and conditions of the Creative Commons Attribution (CC BY) license (http://creativecommons.org/licenses/by/4.0/).
Share and Cite
Zeng, Y.; Wan, Y.; Yuan, Z.; Fang, Y. Healthcare-Seeking Behavior among Chinese Older Adults: Patterns and Predictive Factors. Int. J. Environ. Res. Public Health 2021, 18, 2969. https://doi.org/10.3390/ijerph18062969
Zeng Y, Wan Y, Yuan Z, Fang Y. Healthcare-Seeking Behavior among Chinese Older Adults: Patterns and Predictive Factors. International Journal of Environmental Research and Public Health. 2021; 18(6):2969. https://doi.org/10.3390/ijerph18062969
Chicago/Turabian StyleZeng, Yanbing, Yuanyuan Wan, Zhipeng Yuan, and Ya Fang. 2021. "Healthcare-Seeking Behavior among Chinese Older Adults: Patterns and Predictive Factors" International Journal of Environmental Research and Public Health 18, no. 6: 2969. https://doi.org/10.3390/ijerph18062969
APA StyleZeng, Y., Wan, Y., Yuan, Z., & Fang, Y. (2021). Healthcare-Seeking Behavior among Chinese Older Adults: Patterns and Predictive Factors. International Journal of Environmental Research and Public Health, 18(6), 2969. https://doi.org/10.3390/ijerph18062969