Our observations were made in a population of subjects who were in the active growth phase. It was presumed that growth might not cause a considerable interference with the studied parameters if evaluated for a period of 6 to 7 months [
32]. Torun et al. found no significant difference between pre-pubertal and post-pubertal subjects [
31]. This is in agreement with the outcomes of Johnson et al., who found that the developmental status had no significant effect on the soft tissue changes after RME [
30]. Longo et al. proposed that the impact of growth is not a factor if a six-month observation period is used [
33]. In their meta-analysis, Huang and co-workers came to the same conclusion [
32]. Thus, in this study, a six-month retention period was applied.
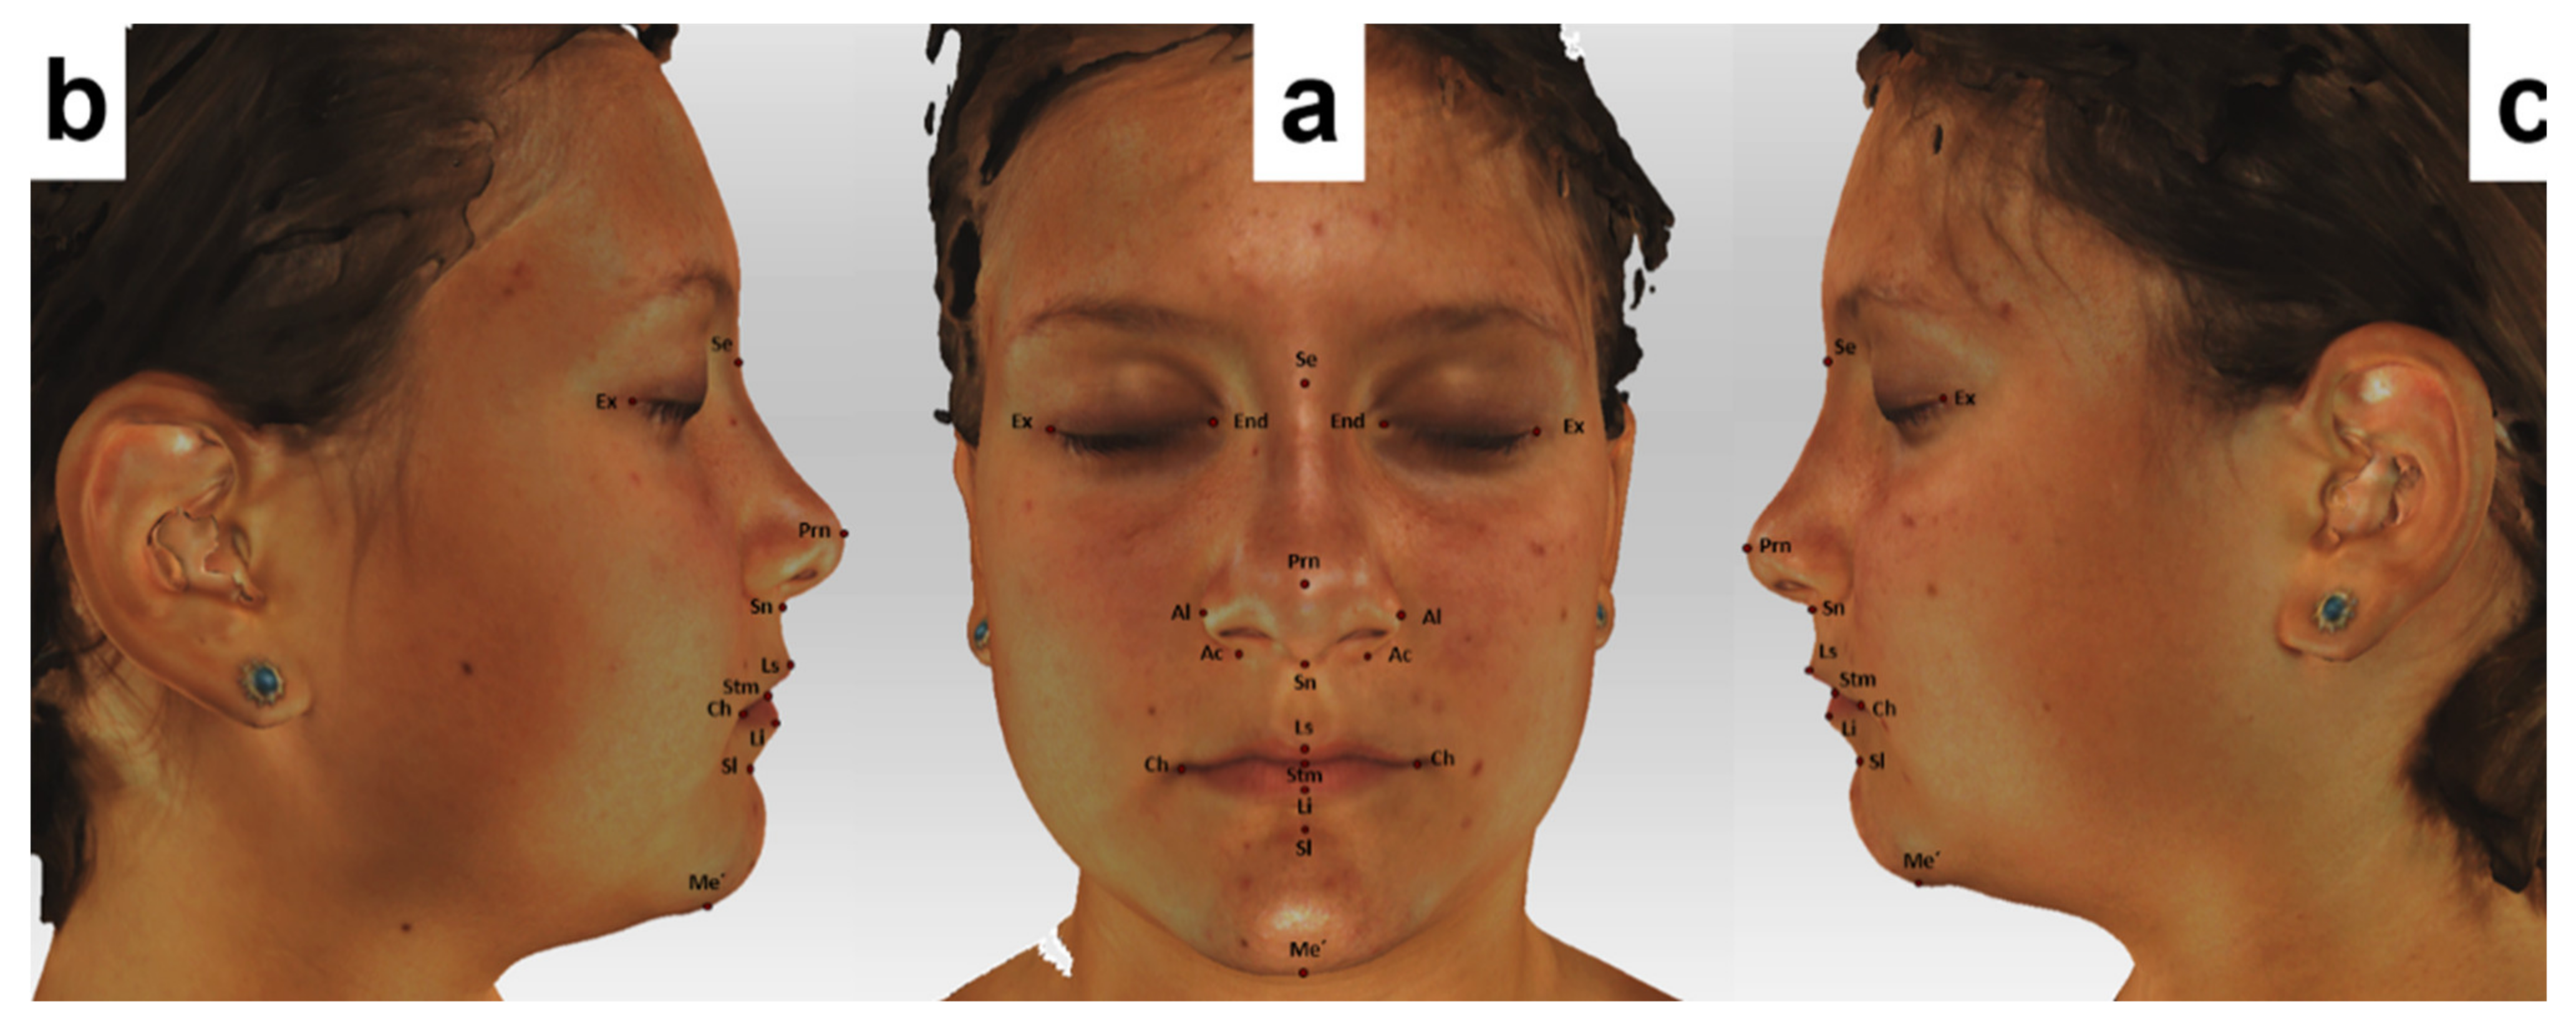
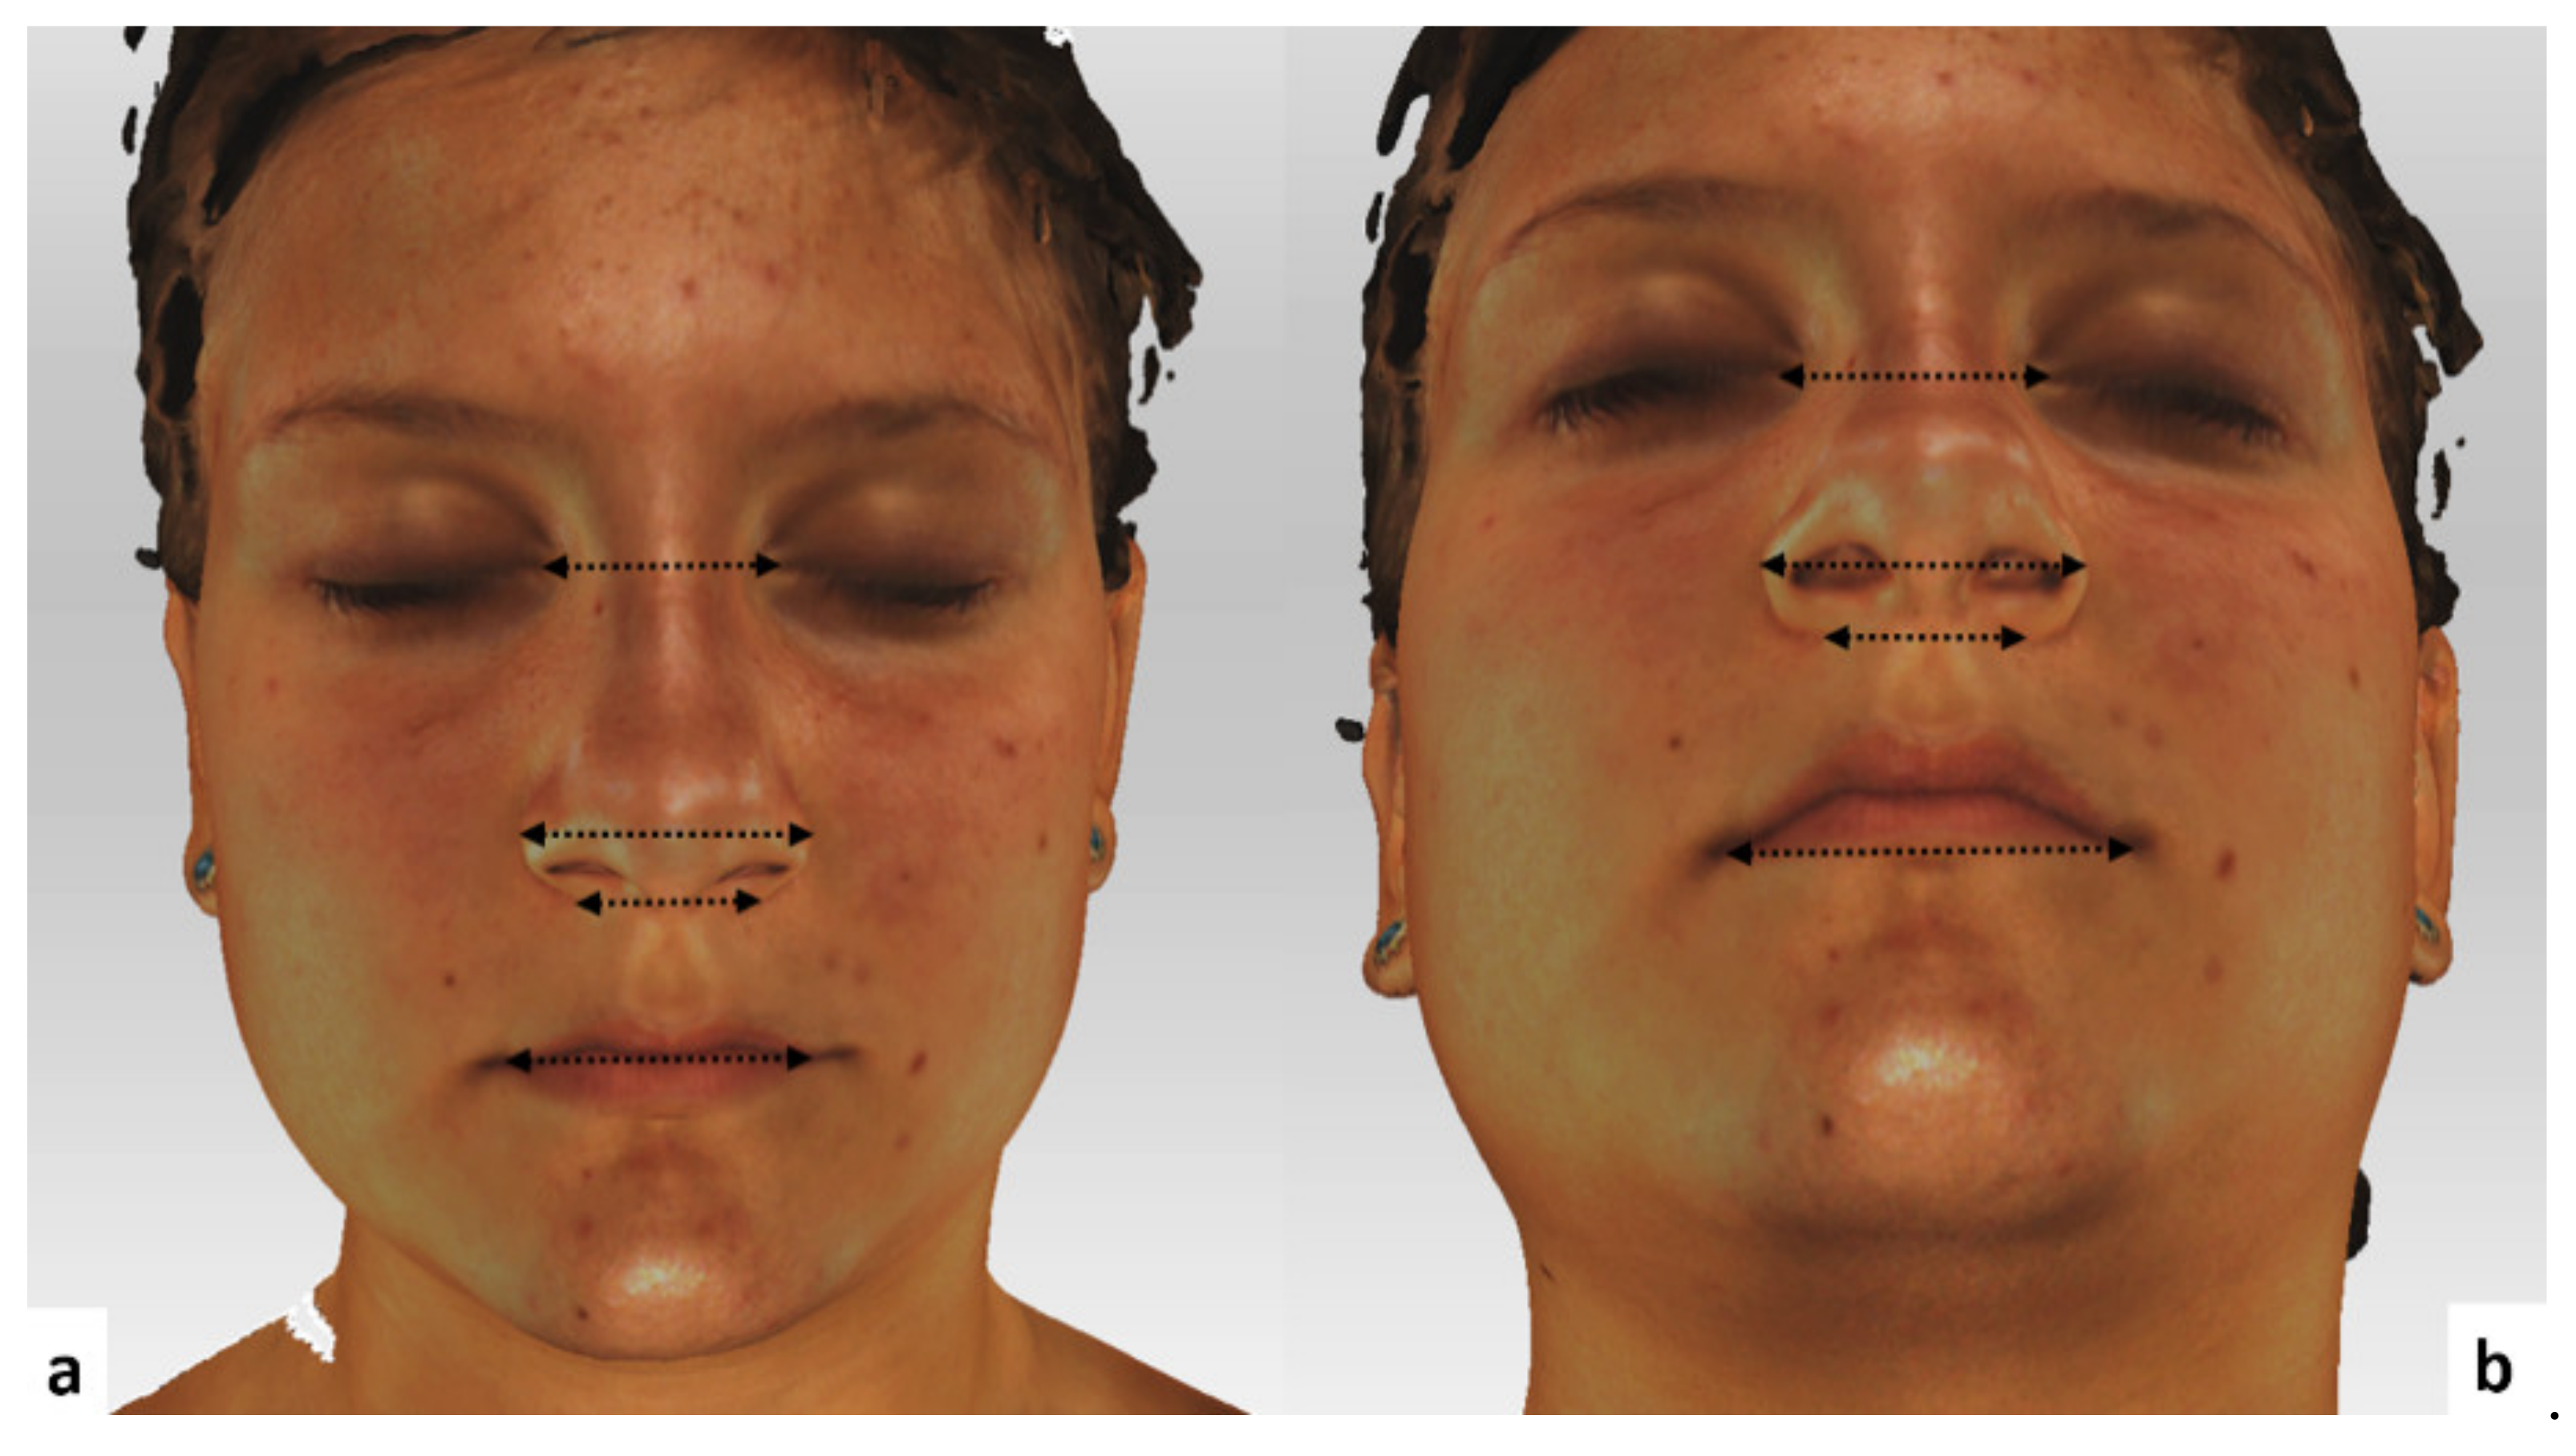
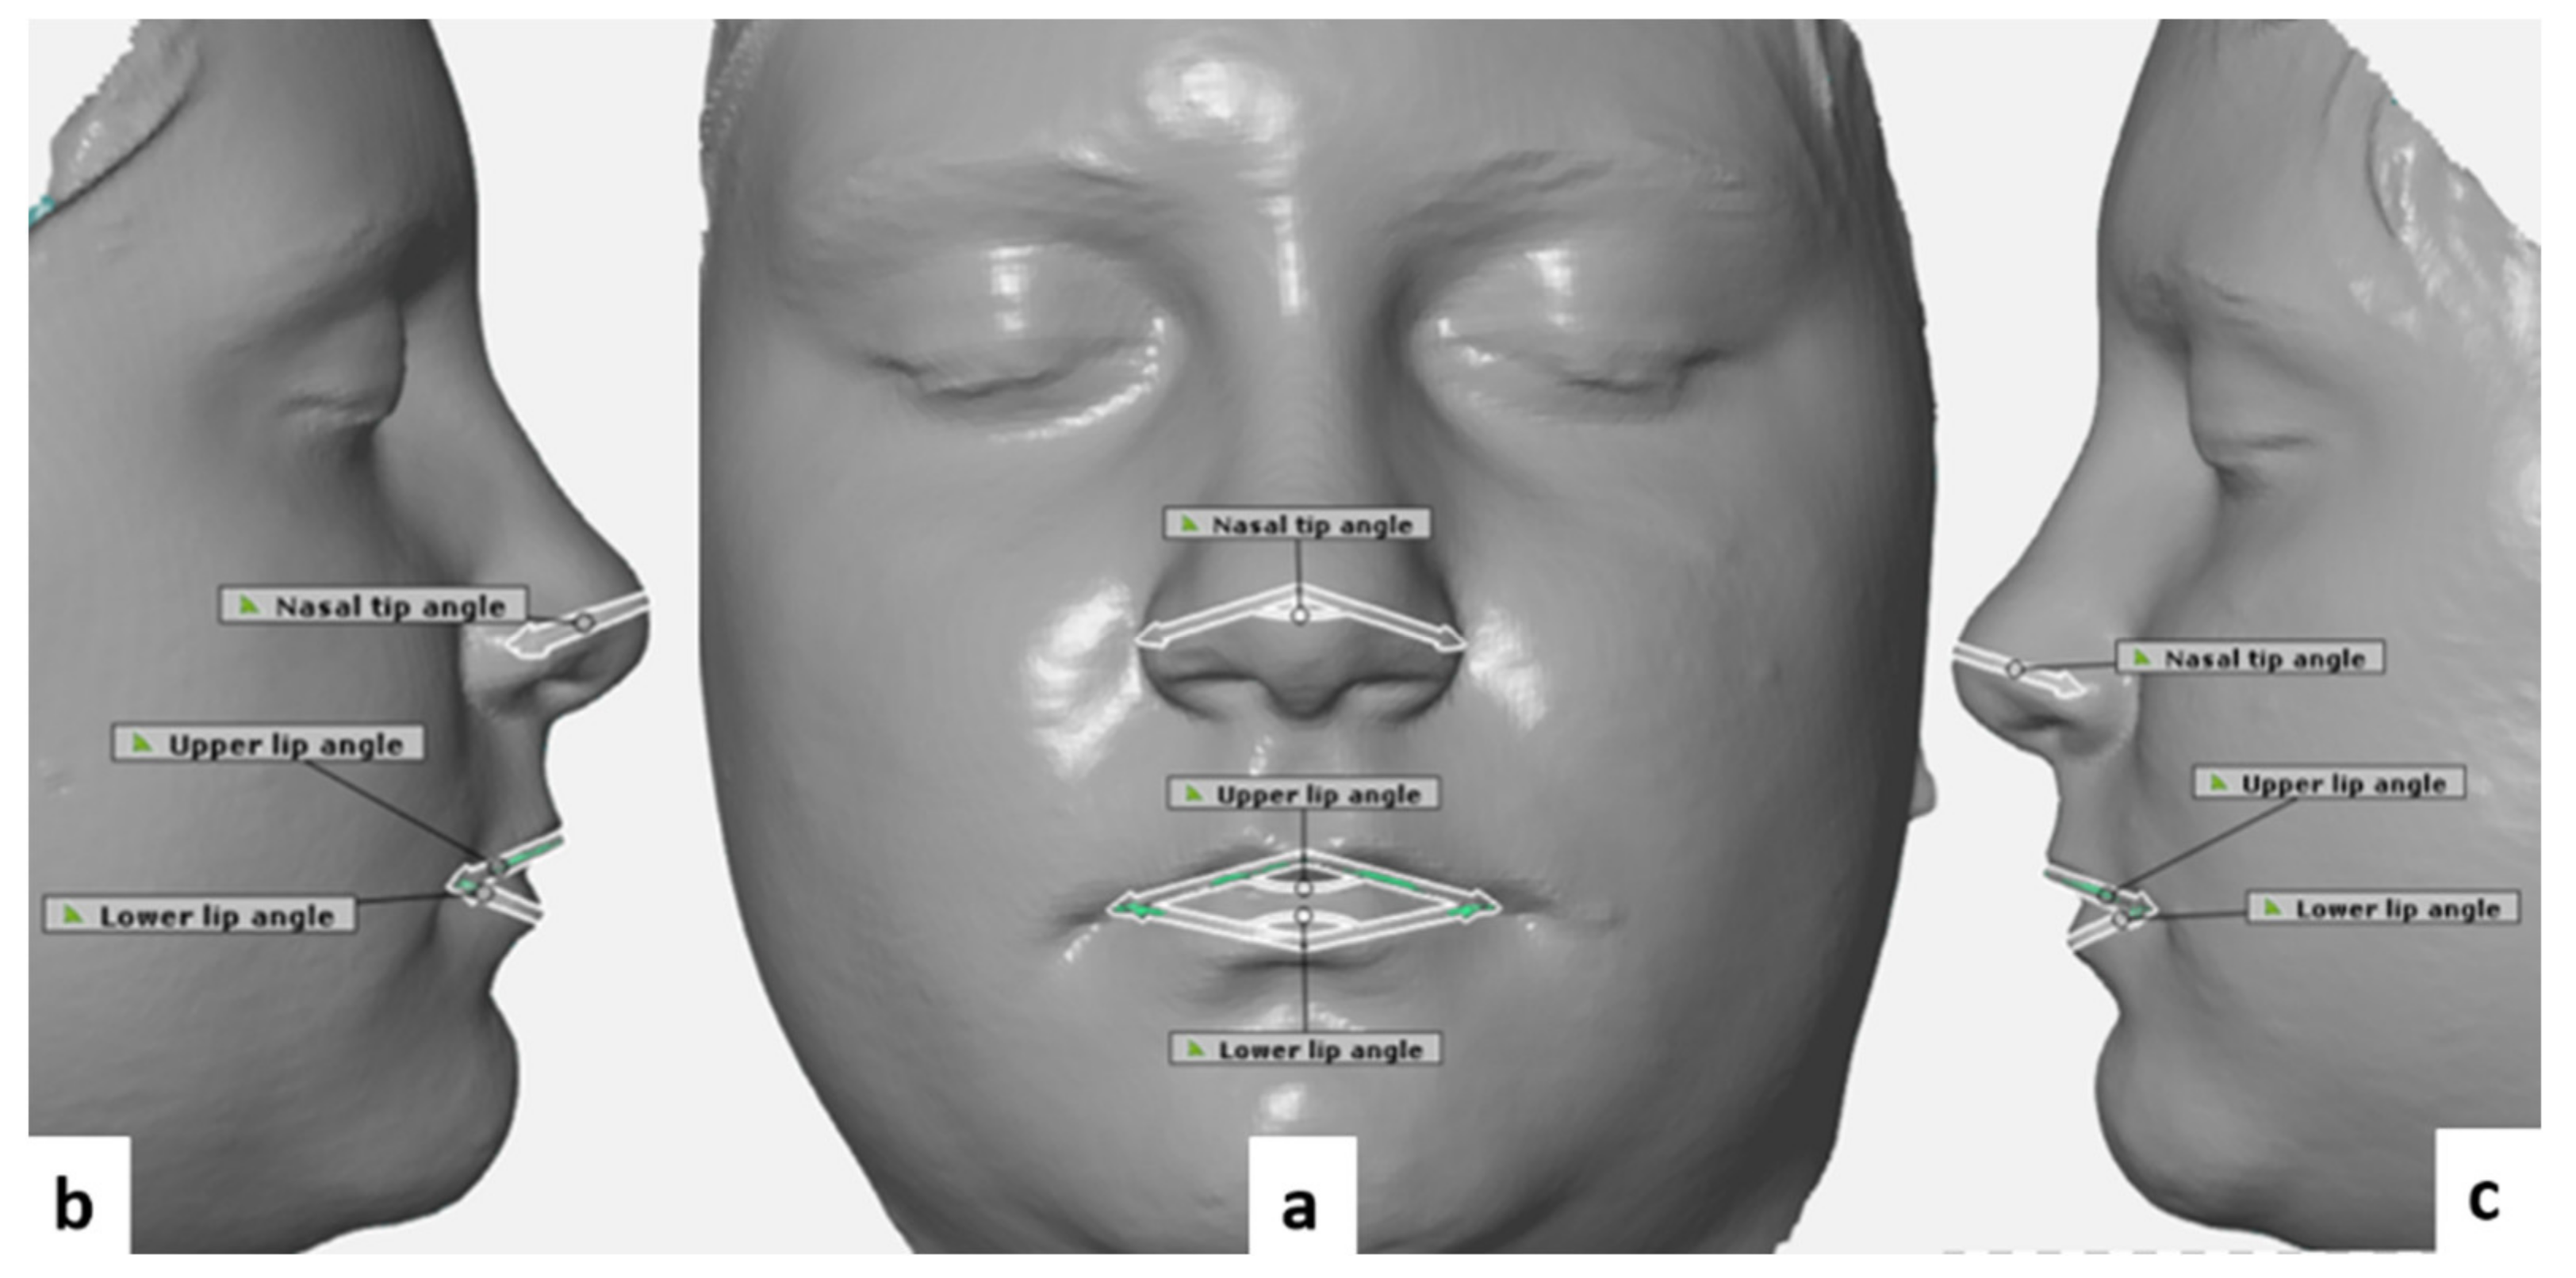
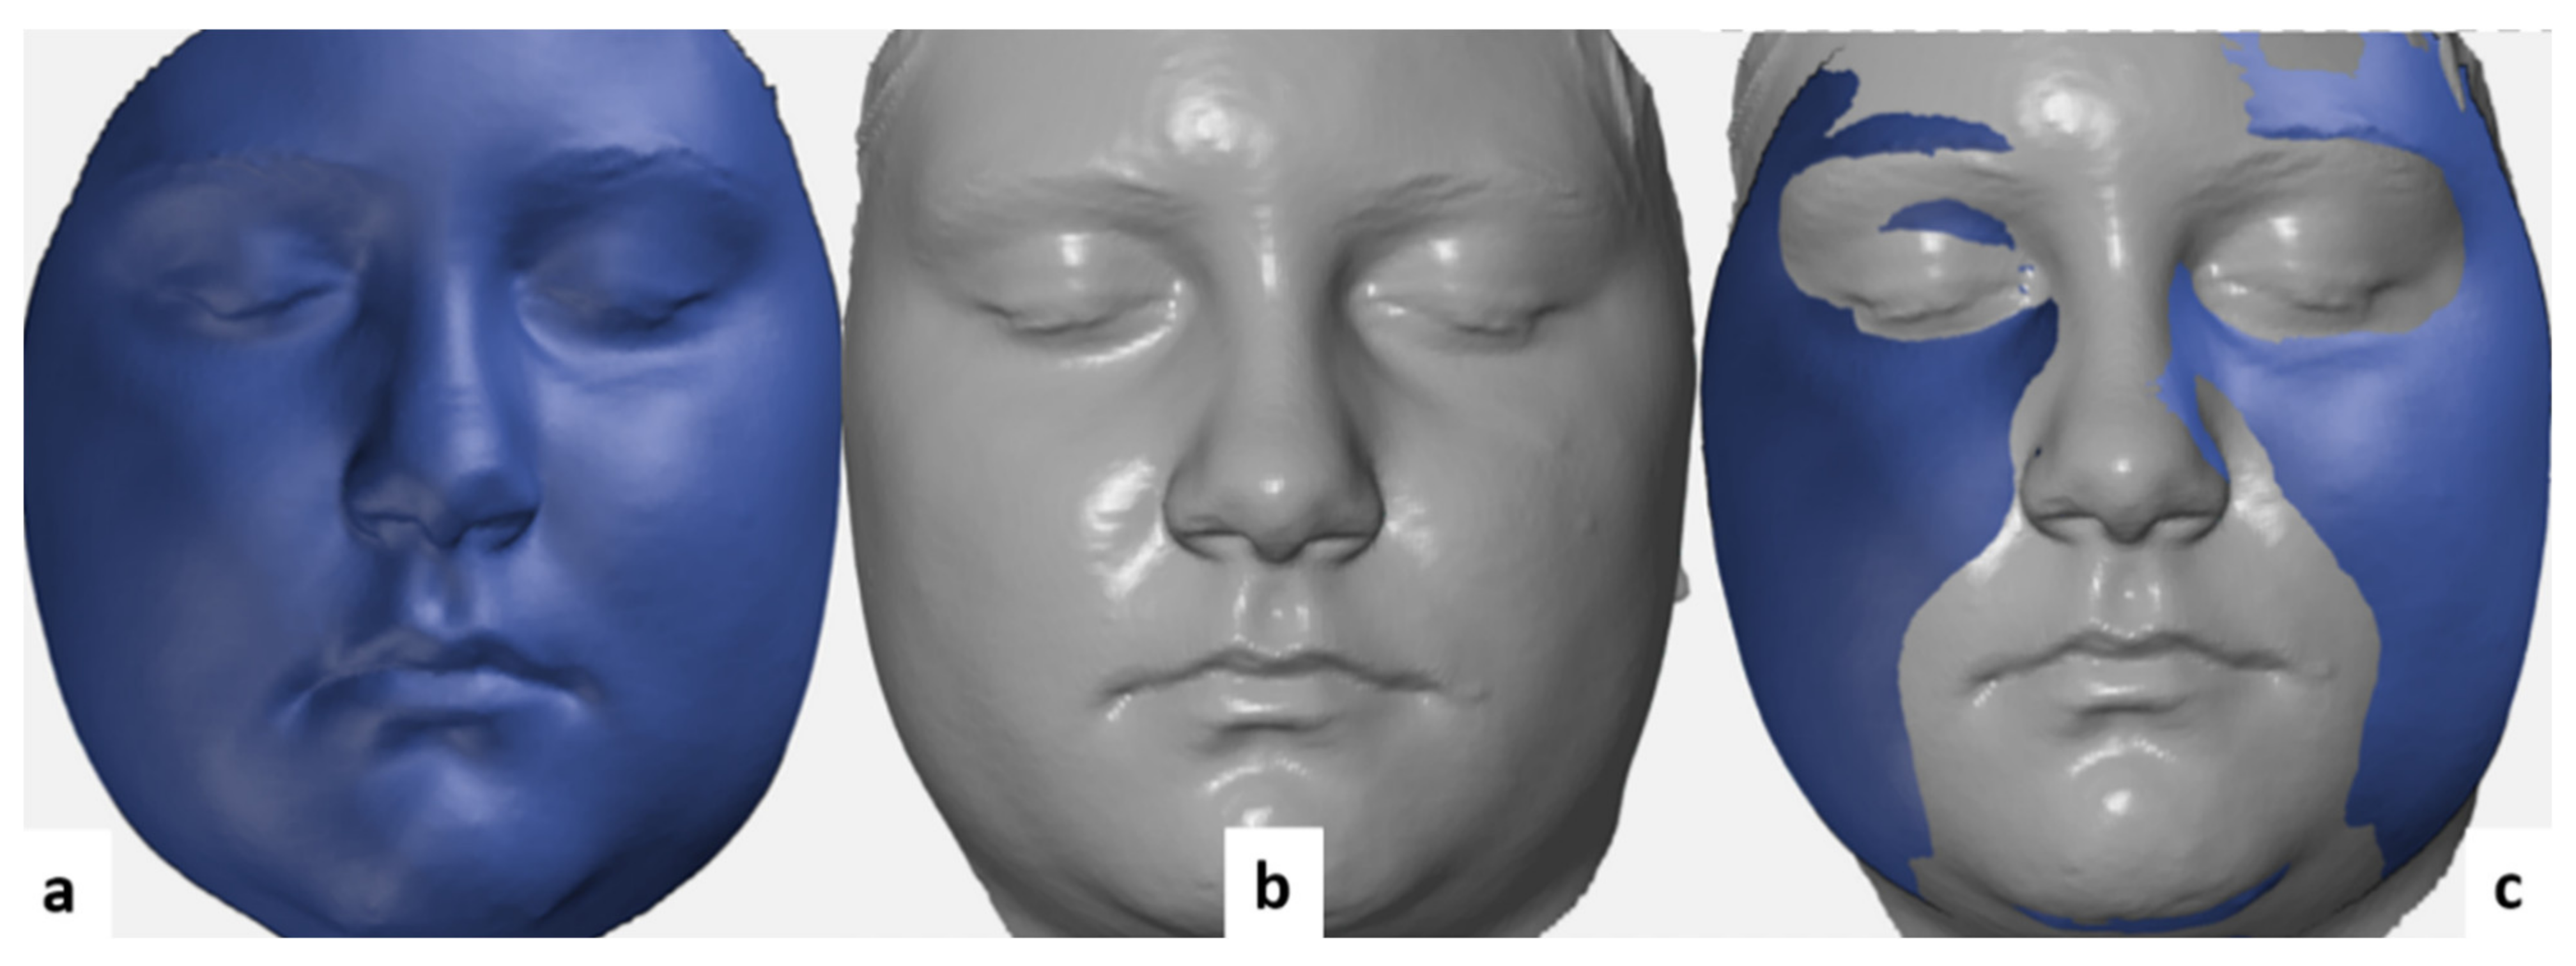
To evaluate soft tissue changes, linear and angular measurements were made between point pairs and triads, completed with regional deviation analyses for various morphological regions of the face and for the facial landmarks.
4.1. Facial Soft Tissue Changes
Intercantal width increased by a mean of 0.65 mm after RME expansion. However, this increase did not reach a statistically significant level. Generally, forces generated with the aid of RME are claimed to affect circummaxillary sutures, along with the fronto-maxillary, nasomaxillary, and frontonasal ones [
34,
35,
36]. The previously mentioned findings could provide an explanation for the 3D deviations observed around the eye. Baysal et al. suggested that the significant increase that they found in the intercanthal distance was the result of normal growth and development [
37]. Dindaroglu and co-workers noted that, even if 3D facial images are captured rapidly, apparent 3D changes might occur in soft tissues around the eye because of the movement of the eyelids [
26].
One of the most frequently examined anatomical regions in connection with RME is the nose, given the close anatomical relationship between the maxilla and the nasal area [
26].
In this study, statistically significant increases were observed in nasal width (mean: 1.02 mm, p < 0.05), nasal base width (mean: 1.21 mm, p < 0.05), and nasal angle (mean: 3.2°, p < 0.05).
Berger and colleagues found a mean increase of 1.6 mm in nasal width, and a mean increase of 1 mm in nasal length after RME [
10]. Furthermore, Altorkat and colleagues found that RME produces pyramidal expansion with the greatest transverse expansion at the anterior nasal spine landmark (ANS) [
19]. However, the authors suggested that these changes may be neither symmetrical nor homogeneous when the anatomical relationship between the nose and maxilla is considered.
Pangrazio-Kulbersch and co-workers found a mean increase of 1.34 mm in alar width after RME [
38], which is in accordance with our findings. Johnson et al. used direct measurements with an average of 7 mm of appliance expansion and found less than 1.5 mm change in nasal base and alar cartilage width, neither of which was clinically significant [
30].
Increases were also observed in all transverse linear measurements in the nasal area including nasal base width, alar cartridge width, nasal tip retraction, and flattening of the nasal tip following RME. However, it was reported that these changes were very small and highly variable [
19]. On the other hand, Silva Filho et al. used 2D photographs and concluded that RME did not cause changes in nasal morphology [
39]. These observations markedly differ from our findings, and the reason for this difference most likely lies in the different scanning methods.
In this study, we found a statically significant increase (mean: 2.62 mm, p < 0.05) in mouth width after RME, likely because of the transverse expansion of the maxillary halves. We also found statically significant increases in the upper and lower lip angle (mean: 3.45° (p < 0.05) and 3.78° (p < 0.05), respectively).
Our results correspond to those of Altındi S et al. who also found a statistically significant increase in mouth width [
18]. Similar changes in mouth width after RME were demonstrated in a recent CBCT study by Kim et al. [
20]. On the contrary, the study of Baysal et al. found no statistically significant change in this respect [
37], but this lack of significance might well be put down to the small sample size (17 subjects).
Despite the significant changes in both the linear and angular parameters found in the study of Dindaroglu F et al., it was considered that changes measured only in these dimensions may not reflect the actual soft tissue changes properly [
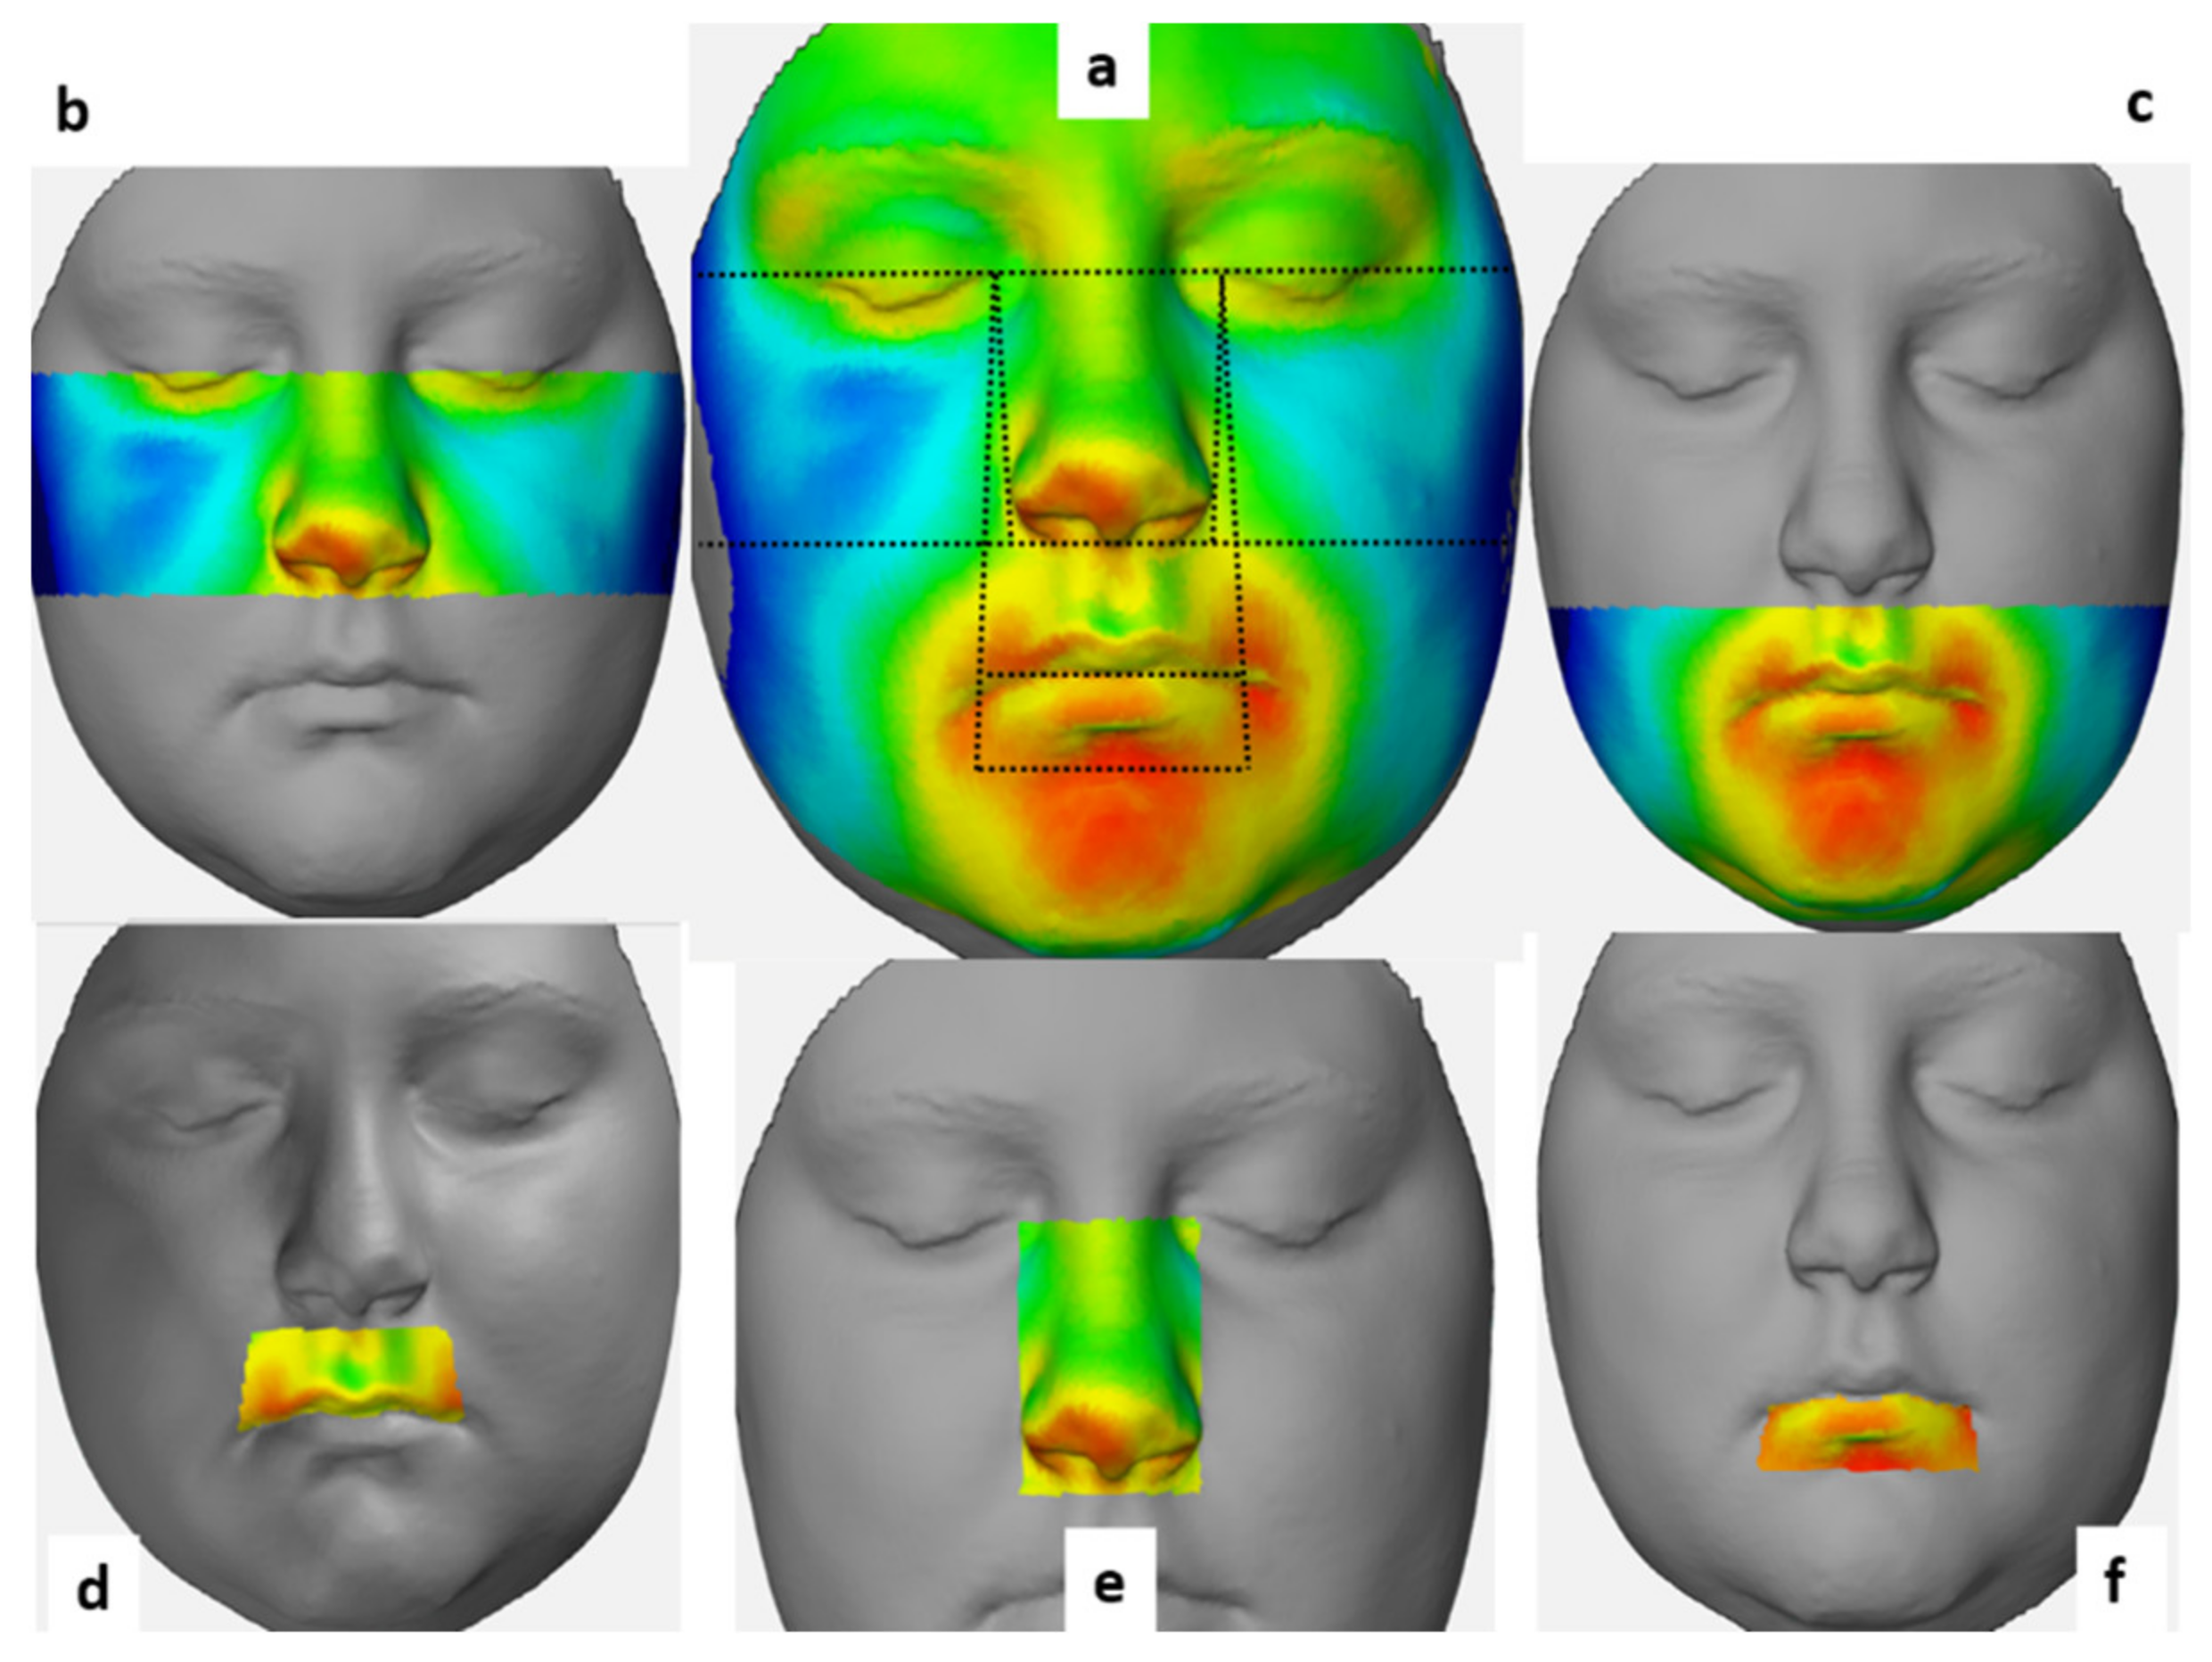
26]. Thus, to complete linear and angular measurements, volumetric analyses were also conducted in the present study. A region was characterized by the mean value of all points of measurement within the given region.
We found significant facial soft tissue changes in both the nose and the upper lip regions (0.55 ± 0.26, 0.53 ± 0.67 mm, respectively), and we also noticed highly positive and negative deviations in the other facial morphological regions of the face, but the mean deviation for these regions changed only to a negligible extent.
The results of Dindaroglu et al. [
26] are quite similar in this respect. The authors found that both positive and negative deviations were below 2 mm regardless of which morphological region of the face was examined. Specifically, the mean maximum positive and negative deviations for the nose area were 0.77 ± 0.34 and −0.94 ± 0.41 mm, respectively, and when all the points forming the nose region were considered, the mean deviation was 0.41 ± 0.21 mm, which is similar to our results.
Regarding the upper lip region, the mean positive and negative change in the same study was 0.87 ± 0.38 and −0.57 ± 0.14 mm, respectively, while the greatest recorded mean deviation was 1.44 mm [
26].
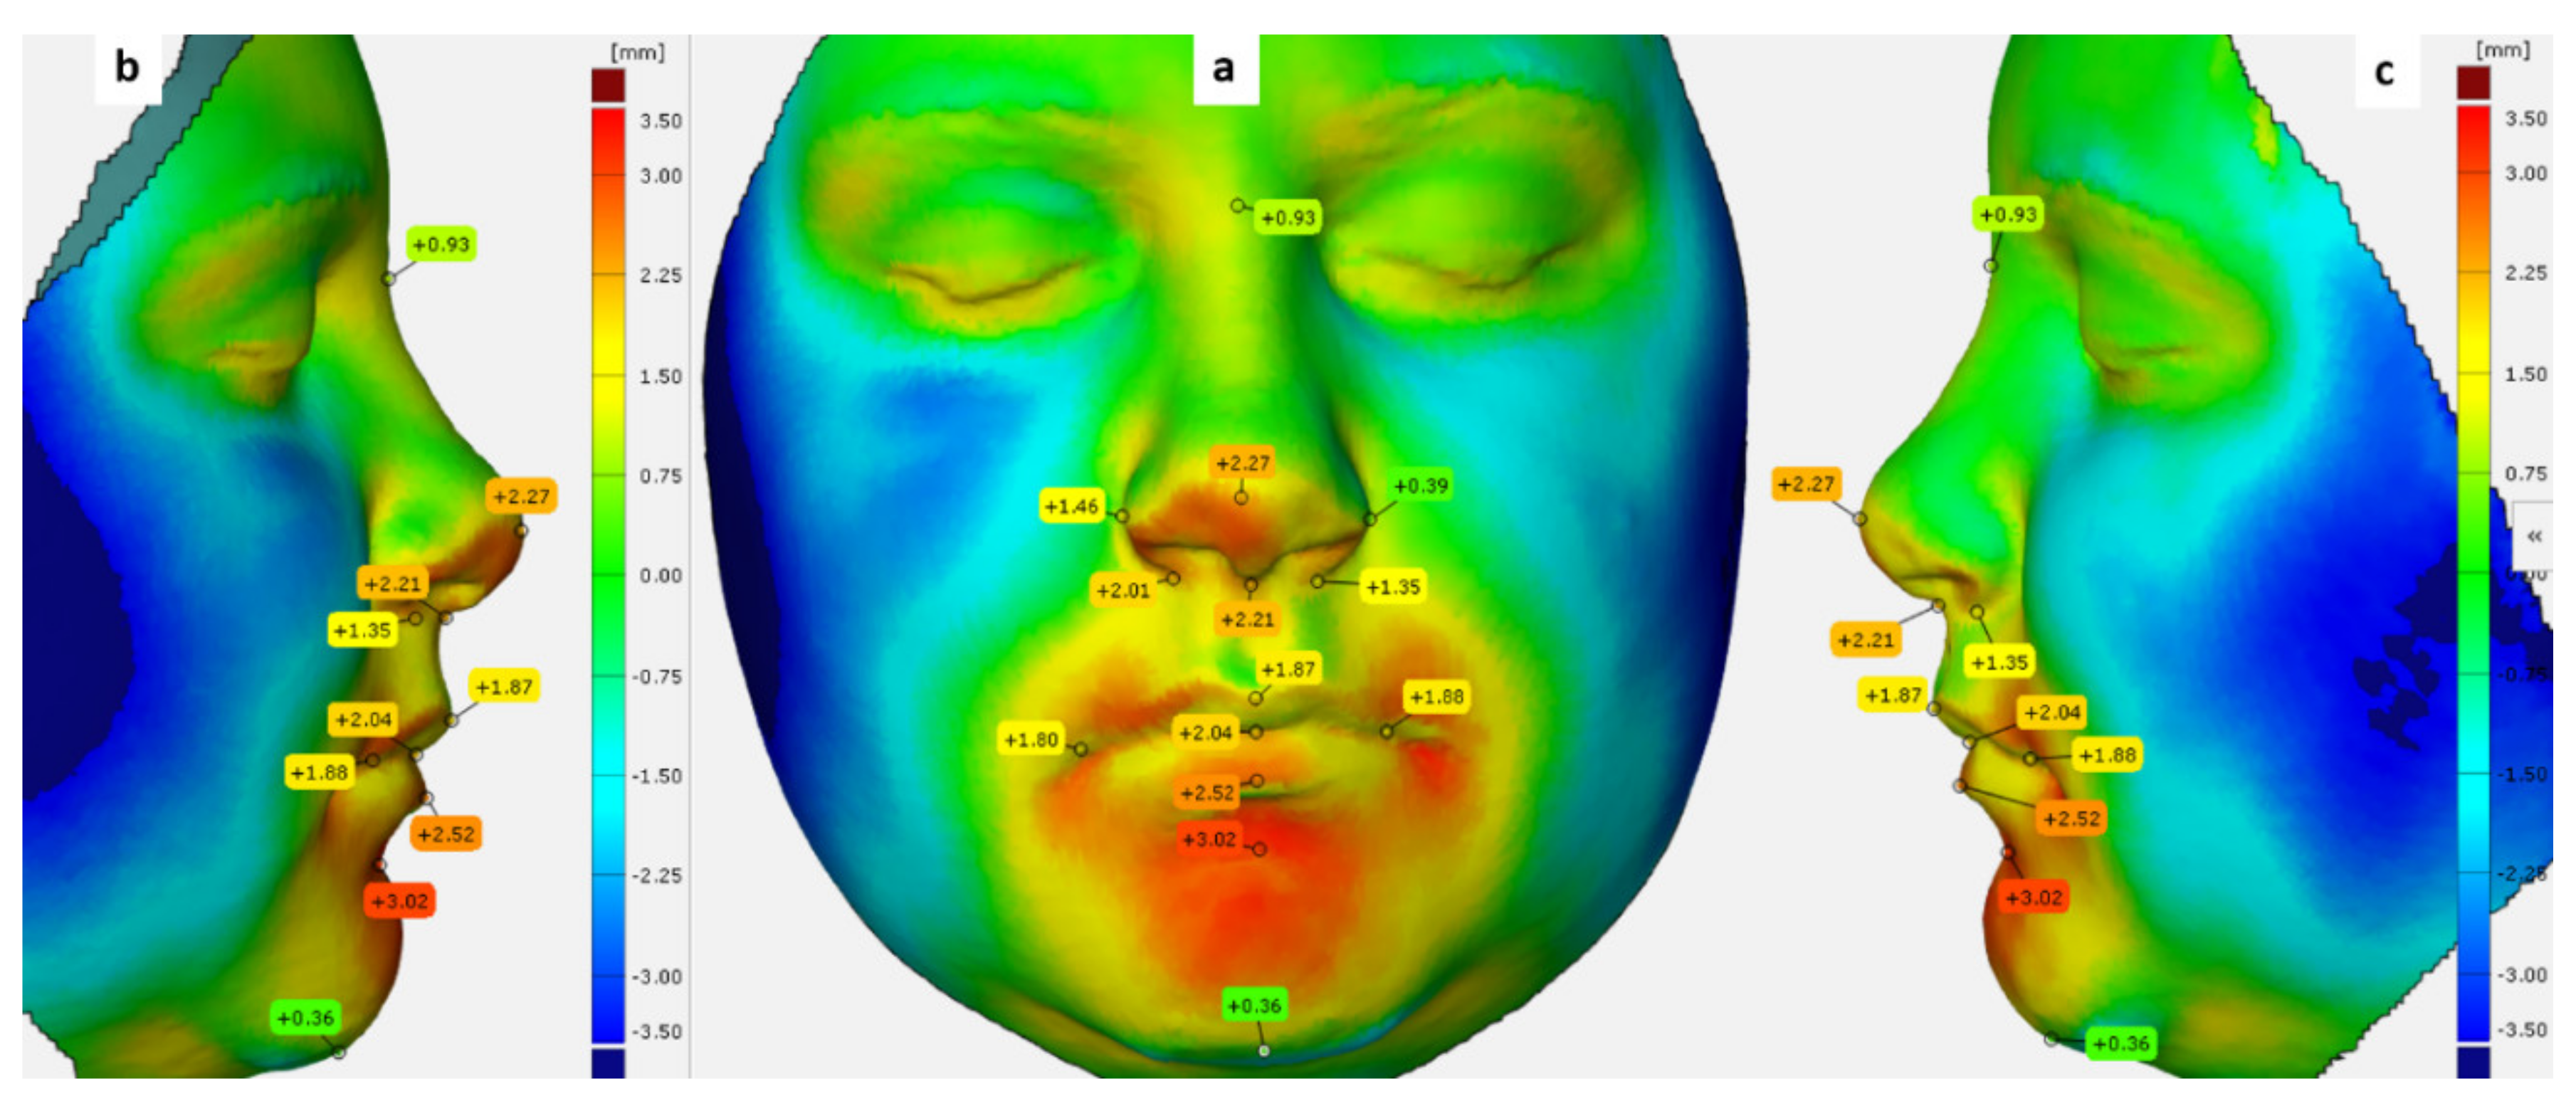
The mean of the maximum positive deviation for the total face was 3.09 ± 0.92 mm in our study. It was 2.16 ± 0.77, 2.81± 0.87 mm for the upper and lower face regions, respectively, while the mean of the maximum negative deviation was −2.93 ± 0.85 mm for the total face, and −1.9 ± 0.79, −2.78 ± 0.89 mm for the upper and lower face regions, respectively.
Ong and co-workers, in a 3D study, reported that the mean maximum maxillary deviation was 1.2 ± 0.4 mm and 1.0 ± 0.3 mm for the right and left sides, respectively [
23]. These results are quite close to our findings.
Although, in this study, the greatest mean deviations were recorded in the lower lip region (2.19 and 2.54 mm, positive and negative, respectively). The mean deviation for the whole sample in the lower lip region was negligible (−0.04 ± 1.24 mm).
For a more detailed understanding of the soft tissue alterations, deviations were calculated for specific facial landmarks. The greatest deviation was found at the alar point (0.72 ± 0.45 mm). Furthermore, the left alar point shifted by 0.46 ± 0.59 mm, and the subnasal point shifted by 0.66 ± 0.64 mm.
Kim et al. evaluated the deviations at different points in various nasal regions and detected a mean deviation of less than 1 mm for all the points, except for the ones in the sub-nasal region, where a mean deviation of 2.21 ± 1.23 mm was found [
20]. The authors also found that the position of the left lip commissure changed by 0.65 mm, whereas the position of the right lip commissure changed by a mean of 1.20 mm [
20]. Furthermore, we found that the position of the left and the right lip commissures changed by 0.66 and 0.46 mm, respectively, and also found a positive deviation at the pro-nasal point (0.44 mm) and negative deviation at the sublabial point (−0.43 mm). Kim et al. [
20] found a positive change of 0.43 ± 1.24 mm at the nasion point, which did not change in our study.
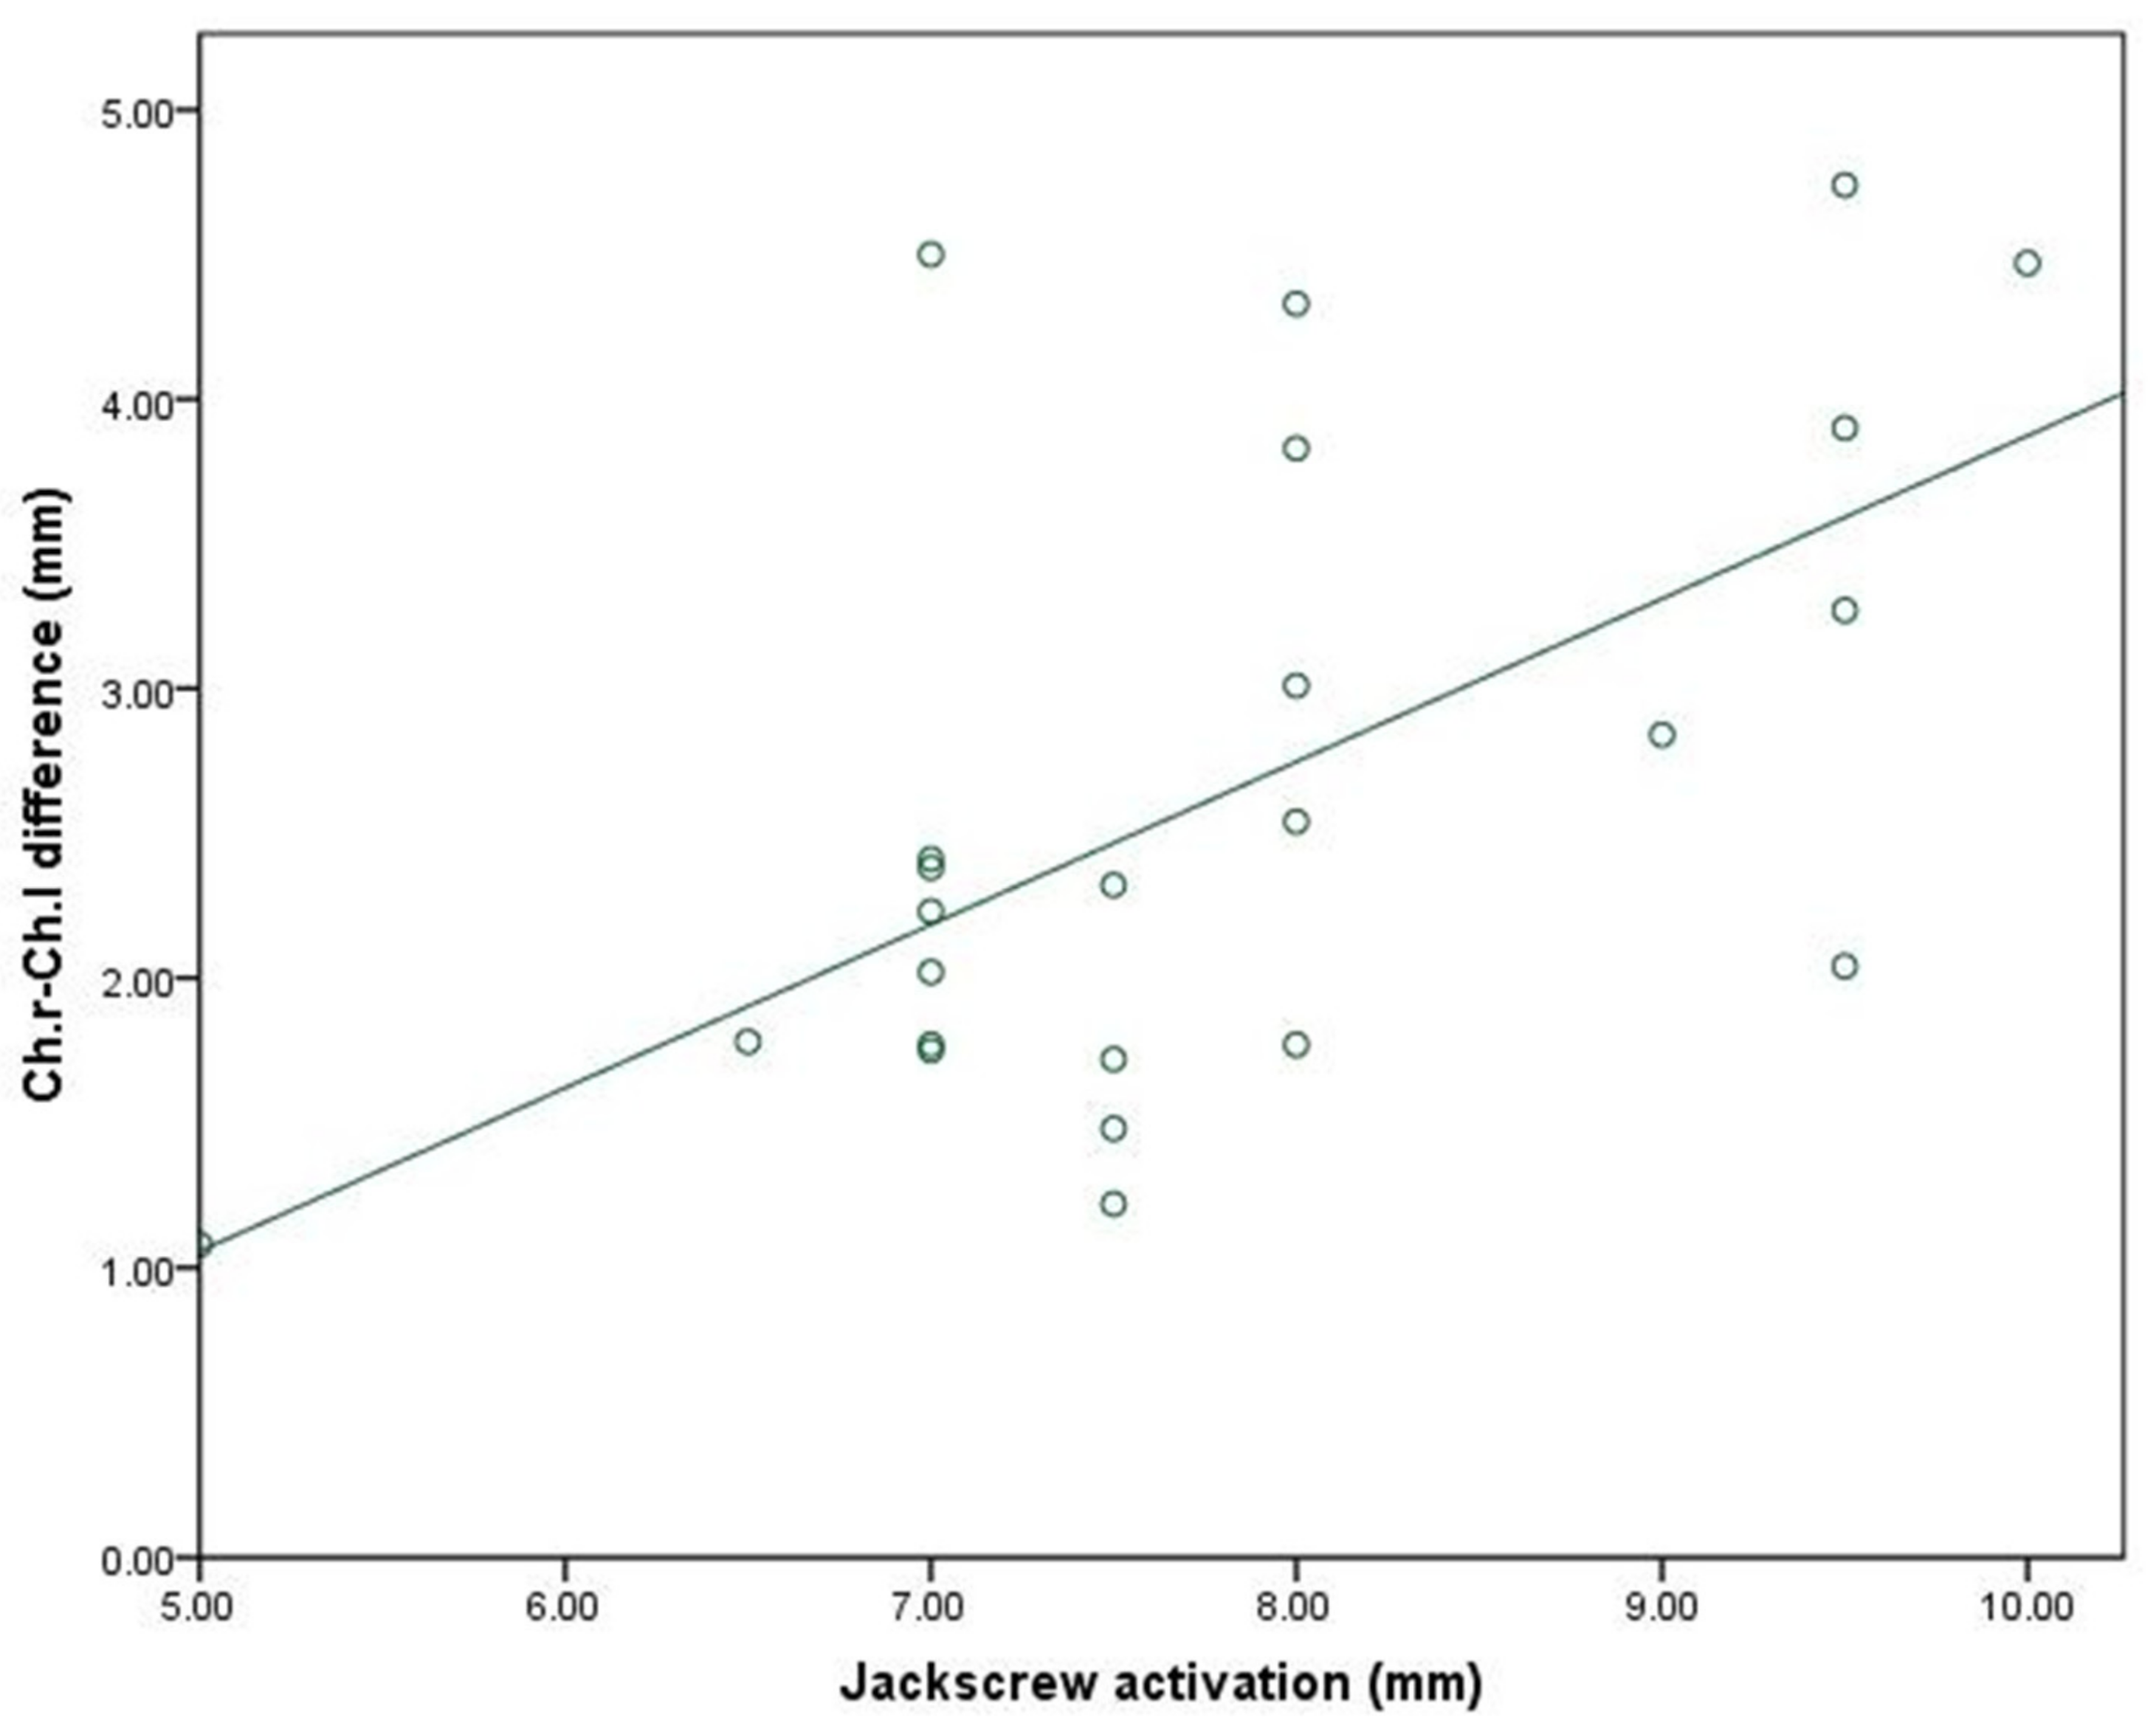
Although we found positive and negative correlations between the amount of expansion and most of the facial soft tissue variables, these correlations did not reach a level of statistical significance. Only mouth width showed a moderately significant positive correlation with the amount of jackscrew activation (p < 0.05).


 ,
, 


