
The Impact of the COVID-19 Pandemic on Ambient Air Quality in China: A Quasi-Difference-in-Difference Approach


Abstract
:1. Introduction
2. Data and Empirical Methodology
2.1. Datasets
2.2. Quasi-DID Identification
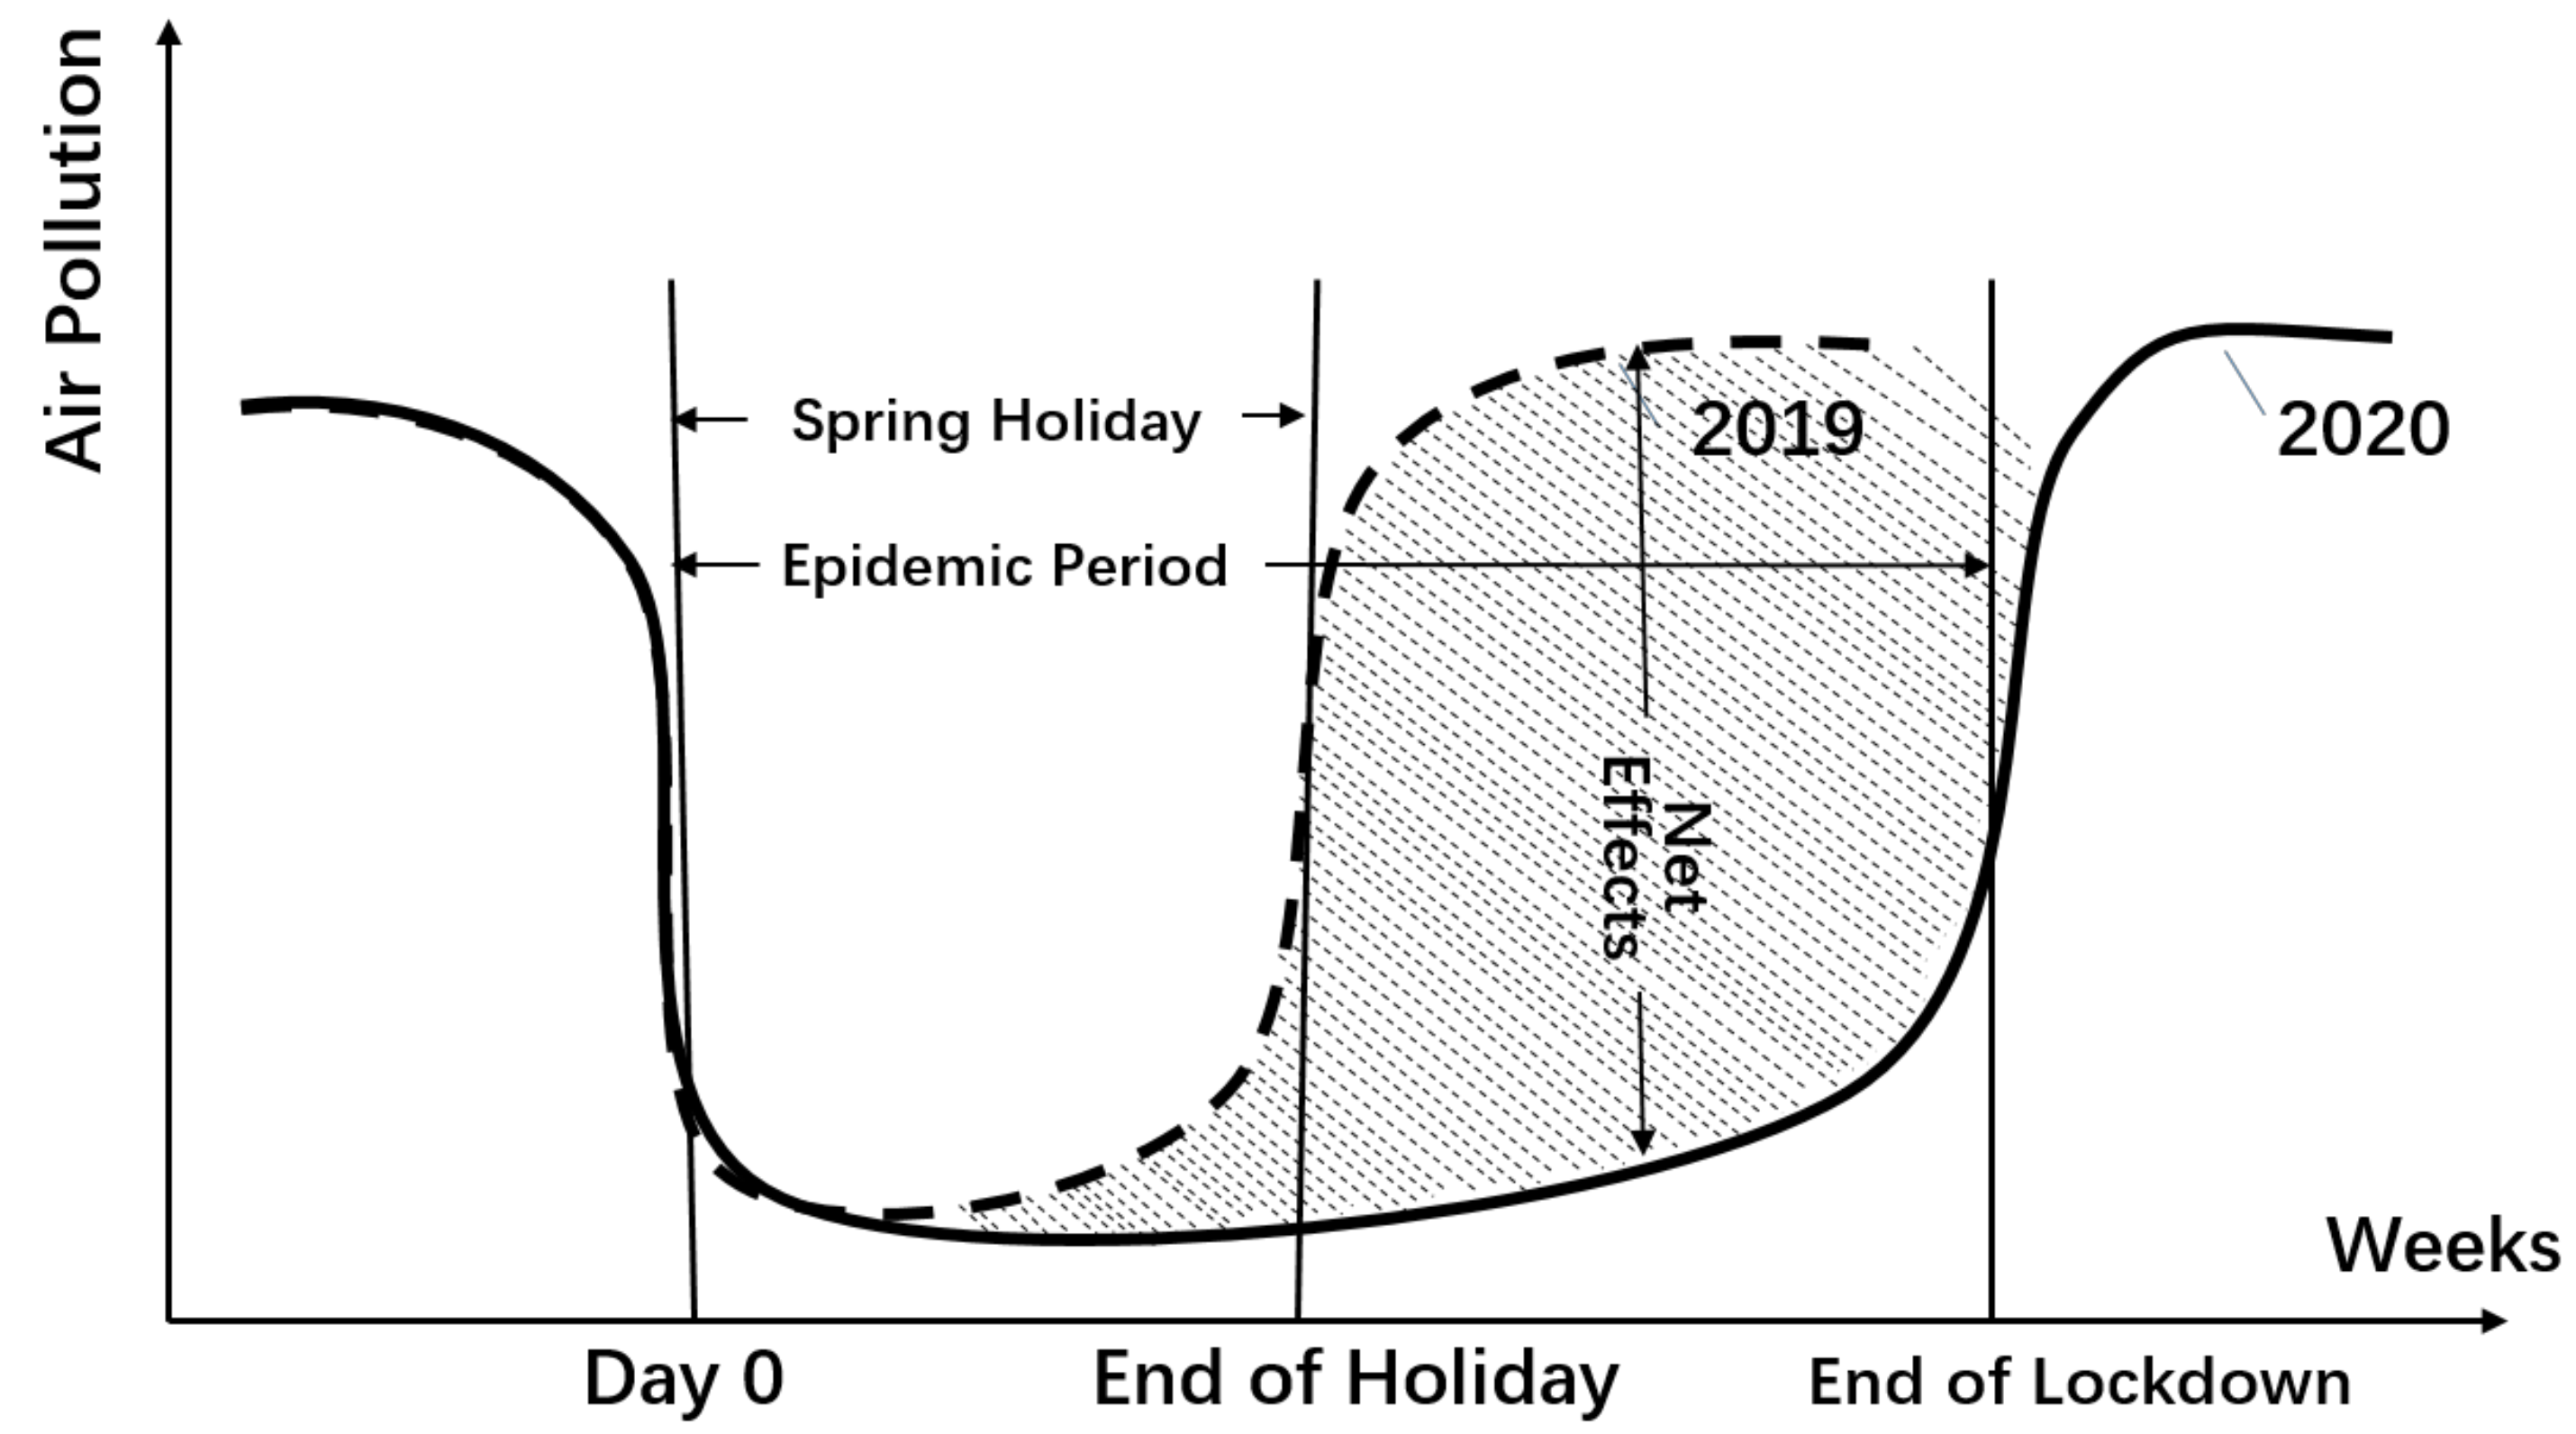
2.2.1. Identification Strategy
2.2.2. The Average Effect on Air Pollution
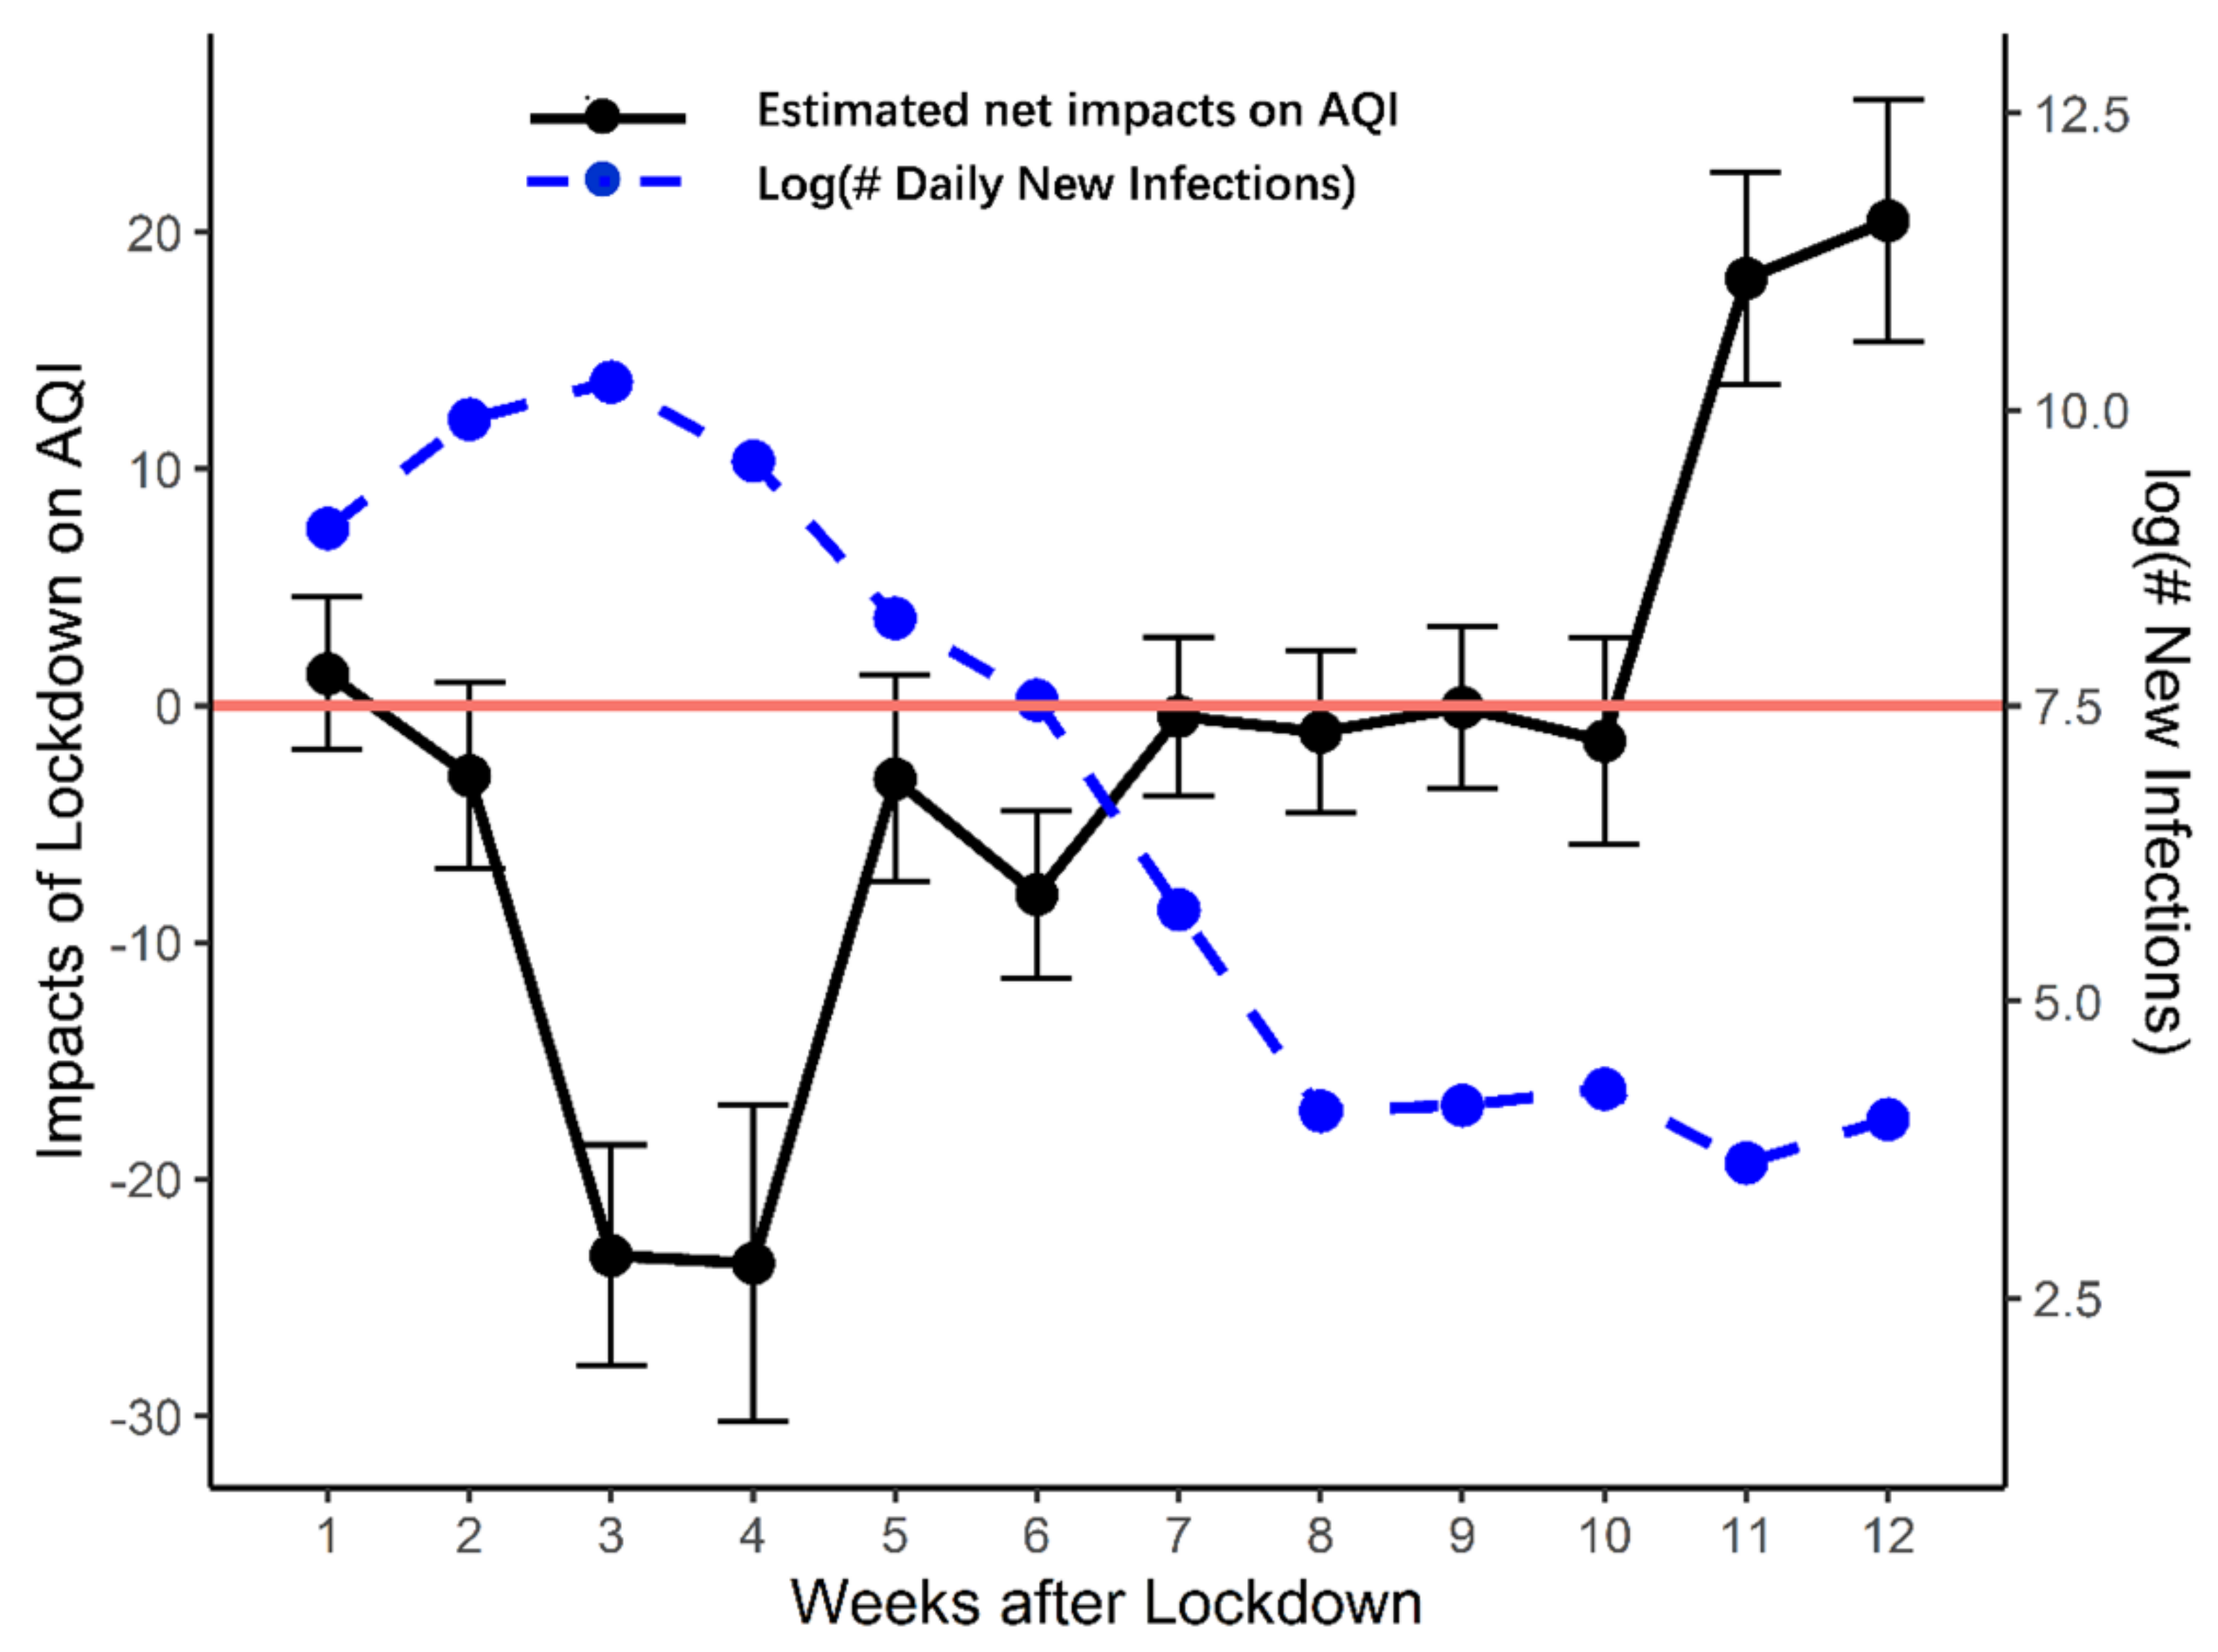
2.2.3. Dynamic Impacts on Air Pollution
2.3. Summary Statistics
3. The Average Effect on Air Quality
4. Discussion: The Dynamic Patterns of the Lockdown Effects
5. Conclusions
Author Contributions
Funding
Institutional Review Board Statement
Informed Consent Statement
Data Availability Statement
Acknowledgments
Conflicts of Interest
References
- Zhu, N.; Zhang, D.; Wang, W.; Li, X.; Yang, B.; Song, J.; Zhao, X.; Huang, B.; Shi, W.; Lu, R.; et al. A novel coronavirus from patients with pneumonia in China, 2019. N. Engl. J. Med. 2020, 382, 727–733. [Google Scholar] [CrossRef] [PubMed]
- Lau, H.; Khosrawipour, V.; Kocbach, P.; Mikolajczyk, A.; Schubert, J.; Bania, J.; Khosrawipour, T. The positive impact of lockdown in Wuhan on containing the COVID-19 outbreak in China. J. Travel Med. 2020, 27, taaa037. [Google Scholar] [CrossRef] [Green Version]
- He, G.; Pan, Y.; Tanaka, T. The short-term impacts of COVID-19 lockdown on urban air pollution in China. Nat. Sustain. 2020, 3, 1005–1011. [Google Scholar] [CrossRef]
- Sun, G.-Q.; Wang, S.-F.; Li, M.-T.; Li, L.; Zhang, J.; Zhang, W.; Jin, Z.; Feng, G.-L. Transmission dynamics of COVID-19 in Wuhan, China: Effects of lockdown and medical resources. Nonlinear Dyn. 2020, 101, 1981–1993. [Google Scholar] [CrossRef]
- Ji, T.; Chen, H.-L.; Xu, J.; Wu, L.-N.; Li, J.-J.; Chen, K.; Qin, G. Lockdown contained the spread of 2019 novel coronavirus disease in Huangshi city, China: Early epidemiological findings. Clin. Infect. Dis. 2020, 71, 1454–1460. [Google Scholar] [CrossRef] [PubMed]
- Muhammad, S.; Long, X.; Salman, M. COVID-19 pandemic and environmental pollution: A blessing in disguise? Sci. Total Environ. 2020, 728, 138820. [Google Scholar] [CrossRef] [PubMed]
- Elavarasan, R.M.; Shafiullah, G.; Raju, K.; Mudgal, V.; Arif, M.T.; Jamal, T.; Subramanian, S.; Balaguru, V.S.; Reddy, K.; Subramaniam, U. COVID-19: Impact analysis and recommendations for power sector operation. Appl. Energ. 2020, 279, 115739. [Google Scholar] [CrossRef] [PubMed]
- Wang, Q.; Lu, M.; Bai, Z.; Wang, K. Coronavirus pandemic reduced China’s CO2 emissions in short-term, while stimulus packages may lead to emissions growth in medium-and long-term. Appl. Energ. 2020, 278, 115735. [Google Scholar] [CrossRef]
- Dutheil, F.; Baker, J.S.; Navel, V. COVID-19 as a factor influencing air pollution? Environ. Pollut. 2020, 263, 114466. [Google Scholar] [CrossRef]
- He, C.; Yang, L.; Cai, B.; Ruan, Q.; Hong, S.; Wang, Z. Impacts of the COVID-19 event on the NOx emissions of key polluting enterprises in China. Appl. Energ. 2020, 281, 116042. [Google Scholar] [CrossRef]
- Verma, S.; Gustafsson, A. Investigating the emerging COVID-19 research trends in the field of business and management: A bibliometric analysis approach. J. Bus. Res. 2020, 118, 253–261. [Google Scholar] [CrossRef] [PubMed]
- He, M.Z.; Kinney, P.L.; Li, T.; Chen, C.; Sun, Q.; Ban, J.; Wang, J.; Liu, S.; Goldsmith, J.; Kioumourtzoglou, M.-A. Short-and intermediate-term exposure to NO2 and mortality: A multi-county analysis in China. Environ. Pollut. 2020, 261, 114165. [Google Scholar] [CrossRef] [PubMed]
- He, L.; Zhang, S.; Hu, J.; Li, Z.; Zheng, X.; Cao, Y.; Xu, G.; Yan, M.; Wu, Y. On-road emission measurements of reactive nitrogen compounds from heavy-duty diesel trucks in China. Environ. Pollut. 2020, 262, 114280. [Google Scholar] [CrossRef] [PubMed]
- Hao, Y.; Xie, S. Optimal redistribution of an urban air quality monitoring network using atmospheric dispersion model and genetic algorithm. Atmos. Environ. 2018, 177, 222–233. [Google Scholar] [CrossRef]
- He, J.; Gong, S.; Yu, Y.; Yu, L.; Wu, L.; Mao, H.; Song, C.; Zhao, S.; Liu, H.; Li, X. Air pollution characteristics and their relation to meteorological conditions during 2014–2015 in major Chinese cities. Environ. Pollut. 2017, 223, 484–496. [Google Scholar] [CrossRef]
- Chan, L.; Kwok, W. Roadside suspended particulates at heavily trafficked urban sites of Hong Kong–Seasonal variation and dependence on meteorological conditions. Atmos. Environ. 2001, 35, 3177–3182. [Google Scholar] [CrossRef]
- Zhao, D.; Chen, H.; Li, X.; Ma, X. Air pollution and its influential factors in China’s hot spots. J. Clean. Prod. 2018, 185, 619–627. [Google Scholar] [CrossRef]
- Jayamurugan, R.; Kumaravel, B.; Palanivelraja, S.; Chockalingam, M. Influence of temperature, relative humidity and seasonal variability on ambient air quality in a coastal urban area. Int. J. Atmos. Sci. 2013, 2013, 264046. [Google Scholar] [CrossRef] [Green Version]
- Tu, J.; Wang, H.; Zhang, Z.; Jin, X.; Li, W. Trends in chemical composition of precipitation in Nanjing, China, during 1992–2003. Atmos. Res. 2005, 73, 283–298. [Google Scholar] [CrossRef]
- Chen, W.; Tang, H.; Zhao, H. Diurnal, weekly and monthly spatial variations of air pollutants and air quality of Beijing. Atmos. Environ. 2015, 119, 21–34. [Google Scholar] [CrossRef]
- Chiquetto, J.B.; Alvim, D.S.; Rozante, J.R.; Faria, M.; Rozante, V.; Gobo, J.P.A. Impact of a truck Driver’s strike on air pollution levels in São Paulo. Atmos. Environ. 2021, 246, 118072. [Google Scholar] [CrossRef]
- Li, Y.; Wang, W.; Kan, H.; Xu, X.; Chen, B. Air quality and outpatient visits for asthma in adults during the 2008 Summer Olympic Games in Beijing. Sci. Total Environ. 2010, 408, 1226–1227. [Google Scholar] [CrossRef]
- Feng, J.; Sun, P.; Hu, X.; Zhao, W.; Wu, M.; Fu, J. The chemical composition and sources of PM2. 5 during the 2009 Chinese New Year’s holiday in Shanghai. Atmos. Res. 2012, 118, 435–444. [Google Scholar] [CrossRef]
- Tan, P.-H.; Chou, C.; Liang, J.-Y.; Chou, C.C.-K.; Shiu, C.-J. Air pollution “holiday effect” resulting from the Chinese New Year. Atmos. Environ. 2009, 43, 2114–2124. [Google Scholar] [CrossRef]
- Tan, P.-H.; Chou, C.; Chou, C.C.-K. Impact of urbanization on the air pollution “holiday effect” in Taiwan. Atmos. Environ. 2013, 70, 361–375. [Google Scholar] [CrossRef]
- Hua, J.; Zhang, Y.; de Foy, B.; Mei, X.; Shang, J.; Feng, C. Competing PM2. 5 and NO2 holiday effects in the Beijing area vary locally due to differences in residential coal burning and traffic patterns. Sci. Total Environ. 2020, 750, 141575. [Google Scholar] [CrossRef]
- Wilder-Smith, A.; Freedman, D.O. Isolation, quarantine, social distancing and community containment: Pivotal role for old-style public health measures in the novel coronavirus (2019-nCoV) outbreak. J. Travel Med. 2020, 27, taaa020. [Google Scholar] [CrossRef] [PubMed]
- Pepe, E.; Bajardi, P.; Gauvin, L.; Privitera, F.; Lake, B.; Cattuto, C.; Tizzoni, M. COVID-19 outbreak response: A dataset to assess mobility changes in Italy following national lockdown. Sci. Data 2020, 7, 230. [Google Scholar] [CrossRef]
- Li, L.; Li, Q.; Huang, L.; Wang, Q.; Zhu, A.; Xu, J.; Liu, Z.; Li, H.; Shi, L.; Li, R. Air quality changes during the COVID-19 lockdown over the Yangtze River Delta Region: An insight into the impact of human activity pattern changes on air pollution variation. Sci. Total Environ. 2020, 732, 139282. [Google Scholar] [CrossRef] [PubMed]
- Guo, F.; Shi, Q. Official turnover, collusion deterrent and temporary improvement of air quality. Econ. Res. J. 2017, 52, 155–168. (In Chinese) [Google Scholar]
- Shi, Q.; Guo, F.; Chen, S. “Political Blue Sky” in fog and haze governance: Evidence from the local annual “Two Sessions” in China. Chin. Ind. Econ. J. 2016, 40–56. (In Chinese) [Google Scholar] [CrossRef]
- World Health Organization. Air Quality Guidelines: Global Update 2005: Particulate Matter, Ozone, Nitrogen Dioxide, and Sulfur Dioxide; World Health Organization: Geneva, Switzerland, 2006. [Google Scholar]
- Wooldridge, J.M. Econometric Analysis of Cross Section and Panel Data; MIT Press: Cambridge, MA, USA, 2010. [Google Scholar]
- Wang, P.; Guo, H.; Hu, J.; Kota, S.H.; Ying, Q.; Zhang, H. Responses of PM2.5 and O3 concentrations to changes of meteorology and emissions in China. Sci. Total Environ. 2019, 662, 297–306. [Google Scholar] [CrossRef] [PubMed]
- Mahmud, A.; Hixson, M.; Kleeman, M. Quantifying population exposure to airborne particulate matter during extreme events in California due to climate change. Atmos. Chem. Phys. 2012, 12, 7453. [Google Scholar] [CrossRef] [Green Version]
- Megaritis, A.; Fountoukis, C.; Charalampidis, P.; Van Der Gon, H.D.; Pilinis, C.; Pandis, S. Linking climate and air quality over Europe: Effects of meteorology on PM2.5 concentrations. Atmos. Chem. Phys. 2014, 14, 10283–10298. [Google Scholar] [CrossRef] [Green Version]
- Kota, S.H.; Guo, H.; Myllyvirta, L.; Hu, J.; Sahu, S.K.; Garaga, R.; Ying, Q.; Gao, A.; Dahiya, S.; Wang, Y. Year-long simulation of gaseous and particulate air pollutants in India. Atmos. Environ. 2018, 180, 244–255. [Google Scholar] [CrossRef]
- Wang, P.; Chen, K.; Zhu, S.; Wang, P.; Zhang, H. Severe air pollution events not avoided by reduced anthropogenic activities during COVID-19 outbreak. Resour. Conserv. Recy. 2020, 158, 104814. [Google Scholar] [CrossRef] [PubMed]
- De Leon, S.F.; Thurston, G.D.; Ito, K. Contribution of respiratory disease to nonrespiratory mortality associations with air pollution. Am. J. Respir. Crit. Care Med. 2003, 167, 1117–1123. [Google Scholar] [CrossRef] [PubMed] [Green Version]
- Ferkol, T.; Schraufnagel, D. The global burden of respiratory disease. Ann. Am. Thorac. Soc. 2014, 11, 404–406. [Google Scholar] [CrossRef]
- Lee, B.-J.; Kim, B.; Lee, K. Air pollution exposure and cardiovascular disease. Toxicol. Res. 2014, 30, 71–75. [Google Scholar] [CrossRef] [PubMed]
- Franchini, M.; Mannucci, P.M. Air pollution and cardiovascular disease. Thromb. Res. 2012, 129, 230–234. [Google Scholar] [CrossRef] [PubMed]
- Schwartz, J. The distributed lag between air pollution and daily deaths. Epidemiology 2000, 11, 320–326. [Google Scholar] [CrossRef] [PubMed]
- Landrigan, P.J. Air pollution and health. Lancet Public Health 2017, 2, e4–e5. [Google Scholar] [CrossRef] [Green Version]
- Clancy, L.; Goodman, P.; Sinclair, H.; Dockery, D.W. Effect of air-pollution control on death rates in Dublin, Ireland: An intervention study. Lancet 2002, 360, 1210–1214. [Google Scholar] [CrossRef]
- Rohde, R.A.; Muller, R.A. Air pollution in China: Mapping of concentrations and sources. PLoS ONE 2015, 10, e0135749. [Google Scholar] [CrossRef]
- Ebenstein, A.; Fan, M.; Greenstone, M.; He, G.; Zhou, M. New evidence on the impact of sustained exposure to air pollution on life expectancy from China’s Huai River Policy. Proc. Natl. Acad. Sci. USA 2017, 114, 10384–10389. [Google Scholar] [CrossRef] [PubMed] [Green Version]
- Almond, D.; Chen, Y.; Greenstone, M.; Li, H. Winter heating or clean air? Unintended impacts of China’s Huai river policy. Am. Econ. Rev. 2009, 99, 184–190. [Google Scholar] [CrossRef] [Green Version]
- Fattorini, D.; Regoli, F. Role of the chronic air pollution levels in the Covid-19 outbreak risk in Italy. Environ. Pollut. 2020, 264, 114732. [Google Scholar] [CrossRef]
- Mahato, S.; Pal, S.; Ghosh, K.G. Effect of lockdown amid COVID-19 pandemic on air quality of the megacity Delhi, India. Sci. Total Environ. 2020, 730, 139086. [Google Scholar] [CrossRef] [PubMed]
- Westerdahl, D.; Wang, X.; Pan, X.; Zhang, K.M. Characterization of on-road vehicle emission factors and microenvironmental air quality in Beijing, China. Atmos. Environ. 2009, 43, 697–705. [Google Scholar] [CrossRef]
- Ding, A.; Wang, T.; Fu, C. Transport characteristics and origins of carbon monoxide and ozone in Hong Kong, South China. J. Geophys. Res. Atmos. 2013, 118, 9475–9488. [Google Scholar] [CrossRef]
- Shao, M.; Zhang, Y.; Zeng, L.; Tang, X.; Zhang, J.; Zhong, L.; Wang, B. Ground-level ozone in the Pearl River Delta and the roles of VOC and NOx in its production. J. Environ. Manag. 2009, 90, 512–518. [Google Scholar] [CrossRef] [PubMed]
- Tobías, A.; Carnerero, C.; Reche, C.; Massagué, J.; Via, M.; Minguillón, M.C.; Alastuey, A.; Querol, X. Changes in air quality during the lockdown in Barcelona (Spain) one month into the SARS-CoV-2 epidemic. Sci. Total Environ. 2020, 726, 138540. [Google Scholar] [CrossRef] [PubMed]
- Siciliano, B.; Dantas, G.; da Silva, C.M.; Arbilla, G. Increased ozone levels during the COVID-19 lockdown: Analysis for the city of Rio de Janeiro, Brazil. Sci. Total Environ. 2020, 737, 139765. [Google Scholar] [CrossRef] [PubMed]
- Dantas, G.; Siciliano, B.; França, B.B.; da Silva, C.M.; Arbilla, G. The impact of COVID-19 partial lockdown on the air quality of the city of Rio de Janeiro, Brazil. Sci. Total Environ. 2020, 729, 139085. [Google Scholar] [CrossRef]
- Nakada, L.Y.K.; Urban, R.C. COVID-19 pandemic: Impacts on the air quality during the partial lockdown in São Paulo state, Brazil. Sci. Total Environ. 2020, 730, 139087. [Google Scholar] [CrossRef]
- Hodan, W.M.; Barnard, W.R. Evaluating the Contribution of PM2.5 Precursor Gases and Re-Entrained Road Emissions to Mobile Source PM2.5 Particulate Matter Emissions; MACTEC: Durham, NC, USA, 2004. [Google Scholar]
- Cadotte, M. Early evidence that COVID-19 government policies reduce urban air pollution. EarthArXiv 2020. [Google Scholar] [CrossRef] [Green Version]
- Sharma, S.; Zhang, M.; Gao, J.; Zhang, H.; Kota, S.H. Effect of restricted emissions during COVID-19 on air quality in India. Sci. Total Environ. 2020, 728, 138878. [Google Scholar] [CrossRef] [PubMed]
- Jiménez, P.; Baldasano, J.M. Ozone response to precursor controls in very complex terrains: Use of photochemical indicators to assess O3-NOx-VOC sensitivity in the northeastern Iberian Peninsula. J. Geophys. Res. Atmos. 2004, 109, D20309. [Google Scholar] [CrossRef] [Green Version]


| Panel A: 2019 Sample | |||||||
| (1) | (2) | (3) | (4) | (5) | (6) | (7) | |
| Obs. | Mean | p10 | p25 | p50 | p75 | p90 | |
| All | 45718 | 77.32 | 36.33 | 47.58 | 64.21 | 89.63 | 134.85 |
| pre: [−22, −1] | 7944 | 92.40 | 41.46 | 55.75 | 78.94 | 113.88 | 158.82 |
| post: [0, 93] | 33444 | 71.55 | 35.92 | 46.46 | 61.08 | 81.42 | 116.79 |
| Panel B: 2020 Sample | |||||||
| (1) | (2) | (3) | (4) | (5) | (6) | (7) | |
| Obs. | Mean | p10 | p25 | p50 | p75 | p90 | |
| All | 41960 | 67.86 | 27.96 | 39.21 | 56.58 | 79.05 | 116.71 |
| pre: [−22, −1] | 7955 | 90.25 | 31.90 | 46.96 | 72.71 | 116.94 | 179.36 |
| post: [0, 93] | 33644 | 62.32 | 27.38 | 37.92 | 54.25 | 73.46 | 99.28 |
| Panel C: Mean difference of city-level air pollutants | |||||||
| (1) | (2) | (3) | (1) | (2) | (3) | ||
| pre:2019 | post:2019 | post-pre:2019 | pre:2020 | post:2020 | post-pre:2020 | ||
| AQI | 92.40 | 71.55 | −20.85 *** | 90.25 | 62.32 | −27.92 *** | |
| Type: | |||||||
| SO2 | 16.42 | 11.42 | −5.00 *** | 14.21 | 10.48 | −3.73 *** | |
| NO2 | 36.36 | 26.56 | −9.80 *** | 37.24 | 22.21 | −15.03 *** | |
| CO | 1.15 | 0.80 | −0.34 *** | 1.15 | 0.74 | −0.41 *** | |
| O3 | 75.31 | 103.77 | 28.46 *** | 69.24 | 100.84 | 31.6 *** | |
| PM2.5 | 63.43 | 41.97 | −21.45 *** | 65.18 | 38.52 | −26.66 *** | |
| PM10 | 99.53 | 76.79 | −22.73 *** | 86.60 | 66.58 | −20.02 *** | |
| Dependent Variable | AQI | ||||
|---|---|---|---|---|---|
| (1) | (2) | (3) | (4) | (5) | |
| Treat*Post | −7.125 *** | −5.604 *** | −4.749 ** | −5.831 *** | −4.884 ** |
| (1.605) | (1.842) | (1.945) | (1.827) | (1.944) | |
| Treat | −1.412 | −4.176 *** | −4.226 *** | −4.034 ** | −4.172 *** |
| (1.452) | (1.598) | (1.596) | (1.588) | (1.602) | |
| Wind Speed | −0.424 | −0.559 * | −0.372 | −0.478 | |
| (0.296) | (0.292) | (0.296) | (0.293) | ||
| L.Wind Speed | −6.094 *** | −6.033 *** | −6.088 *** | −6.072 *** | |
| (0.461) | (0.462) | (0.460) | (0.459) | ||
| L2. Wind Speed | −5.146 *** | −5.172 *** | −5.151 *** | −5.163 *** | |
| (0.311) | (0.309) | (0.311) | (0.307) | ||
| L3. Wind Speed | −2.759 *** | −2.799 *** | −2.763 *** | −2.865 *** | |
| (0.286) | (0.280) | (0.286) | (0.283) | ||
| L4. Wind Speed | −2.037 *** | −2.199 *** | −2.054 *** | −2.219 *** | |
| (0.314) | (0.294) | (0.314) | (0.293) | ||
| Temperature (Minimum) | 0.093 | 0.120 | |||
| (0.098) | (0.110) | ||||
| Temperature (Highest) | 0.385 ** | 0.396 ** | |||
| (0.166) | (0.178) | ||||
| Sunny | 1.189 *** | 1.296 *** | |||
| (0.433) | (0.487) | ||||
| Constant | 100.713 *** | 112.625 *** | 112.971 *** | 111.668 *** | 117.206 *** |
| (1.937) | (3.152) | (3.078) | (3.173) | (4.102) | |
| Date Dummy | Y | Y | Y | Y | Y |
| City Dummy | Y | Y | Y | Y | Y |
| Groups | 367 | 335 | 335 | 335 | 335 |
| Sample | 83,710 | 71,597 | 71,597 | 71,597 | 71,597 |
| adj R2 | 0.127 | 0.141 | 0.143 | 0.141 | 0.144 |
| (1) | (2) | (3) | (4) | (5) | (6) | |
|---|---|---|---|---|---|---|
| SO2 Concentration | NO2 Concentration | CO Concentration | O3 Concentration | PM2.5 Concentration | PM10 Concentration | |
| Treat*Post | 1.679 *** | −5.113 *** | −0.105 *** | 3.881 *** | −5.772 *** | 2.721 |
| (0.343) | (0.402) | (0.012) | (0.794) | (1.526) | (2.198) | |
| Treat | −3.073 *** | −0.156 | 0.019 | −3.134 *** | 1.077 | −11.821 *** |
| (0.425) | (0.427) | (0.013) | (0.605) | (1.347) | (1.647) | |
| Wind Speed | −0.149 ** | −0.120 * | −0.005 ** | 1.945 *** | −0.645 *** | 0.725 * |
| (0.067) | (0.065) | (0.002) | (0.190) | (0.209) | (0.387) | |
| L.Wind Speed | −1.391 *** | −4.008 *** | −0.075 *** | 0.584 *** | −5.363 *** | −0.563 |
| (0.106) | (0.113) | (0.004) | (0.177) | (0.294) | (0.645) | |
| L2. Wind Speed | −1.239 *** | −3.363 *** | −0.084 *** | −2.013 *** | −7.452 *** | −6.733 *** |
| (0.094) | (0.105) | (0.004) | (0.183) | (0.346) | (0.476) | |
| L3. Wind Speed | −0.458 *** | −0.879 *** | −0.038 *** | −2.036 *** | −3.954 *** | −4.282 *** |
| (0.056) | (0.069) | (0.003) | (0.173) | (0.295) | (0.428) | |
| Temperature (Minimum) | 0.129 *** | 0.270 *** | −0.003 *** | 2.105 *** | −0.242 *** | 0.179 |
| (0.020) | (0.021) | (0.001) | (0.076) | (0.087) | (0.139) | |
| Temperature (Highest) | −0.241 *** | −0.362 *** | −0.002 * | −0.835 *** | 0.314 ** | 0.649 ** |
| (0.027) | (0.031) | (0.001) | (0.081) | (0.151) | (0.304) | |
| No-rain | −0.322 *** | −0.735 *** | −0.029 *** | 0.234 | −0.735 ** | 0.711 |
| (0.076) | (0.101) | (0.003) | (0.329) | (0.351) | (0.662) | |
| Constant | 22.881 *** | 54.813 *** | 1.648 *** | 57.874 *** | 108.913 *** | 135.890 *** |
| (1.059) | (1.119) | (0.040) | (2.182) | (3.177) | (5.310) | |
| Groups | 335 | 335 | 335 | 335 | 335 | 335 |
| Sample | 72,281 | 72,281 | 72,281 | 72,281 | 72,281 | 72,281 |
| adj R2 | 0.153 | 0.403 | 0.347 | 0.418 | 0.208 | 0.059 |
Publisher’s Note: MDPI stays neutral with regard to jurisdictional claims in published maps and institutional affiliations. |
© 2021 by the authors. Licensee MDPI, Basel, Switzerland. This article is an open access article distributed under the terms and conditions of the Creative Commons Attribution (CC BY) license (http://creativecommons.org/licenses/by/4.0/).
Share and Cite
Zhang, T.; Tang, M. The Impact of the COVID-19 Pandemic on Ambient Air Quality in China: A Quasi-Difference-in-Difference Approach. Int. J. Environ. Res. Public Health 2021, 18, 3404. https://doi.org/10.3390/ijerph18073404
Zhang T, Tang M. The Impact of the COVID-19 Pandemic on Ambient Air Quality in China: A Quasi-Difference-in-Difference Approach. International Journal of Environmental Research and Public Health. 2021; 18(7):3404. https://doi.org/10.3390/ijerph18073404
Chicago/Turabian StyleZhang, Tuo, and Maogang Tang. 2021. "The Impact of the COVID-19 Pandemic on Ambient Air Quality in China: A Quasi-Difference-in-Difference Approach" International Journal of Environmental Research and Public Health 18, no. 7: 3404. https://doi.org/10.3390/ijerph18073404