
Risk Factors for Acute Urticaria in Central California


Abstract
1. Introduction
2. Methods
2.1. Outcome Assessment
| ICD-10 Code | Diagnosis |
|---|---|
| L50.0 | Allergic Urticaria |
| L50.1 | Idiopathic Urticaria |
| L50.2 | Cold and Heat Urticaria |
| L50.3 | Dermatographic Urticaria |
| L50.4 | Vibratory Urticaria |
| L50.5 | Cholinergic Urticaria |
| L50.6 | Contact Urticaria |
| L50.8 | Chronic or Recurrent Urticaria |
| L50.9 | Unspecified Urticaria |
2.2. Assessment of Covariates
2.3. Statistical Analysis
3. Results
4. Discussion
4.1. Prevalence of Urticaria
4.2. Risk Factors for Acute Urticaria
4.2.1. Working in Agriculture
4.2.2. Urban Indicator
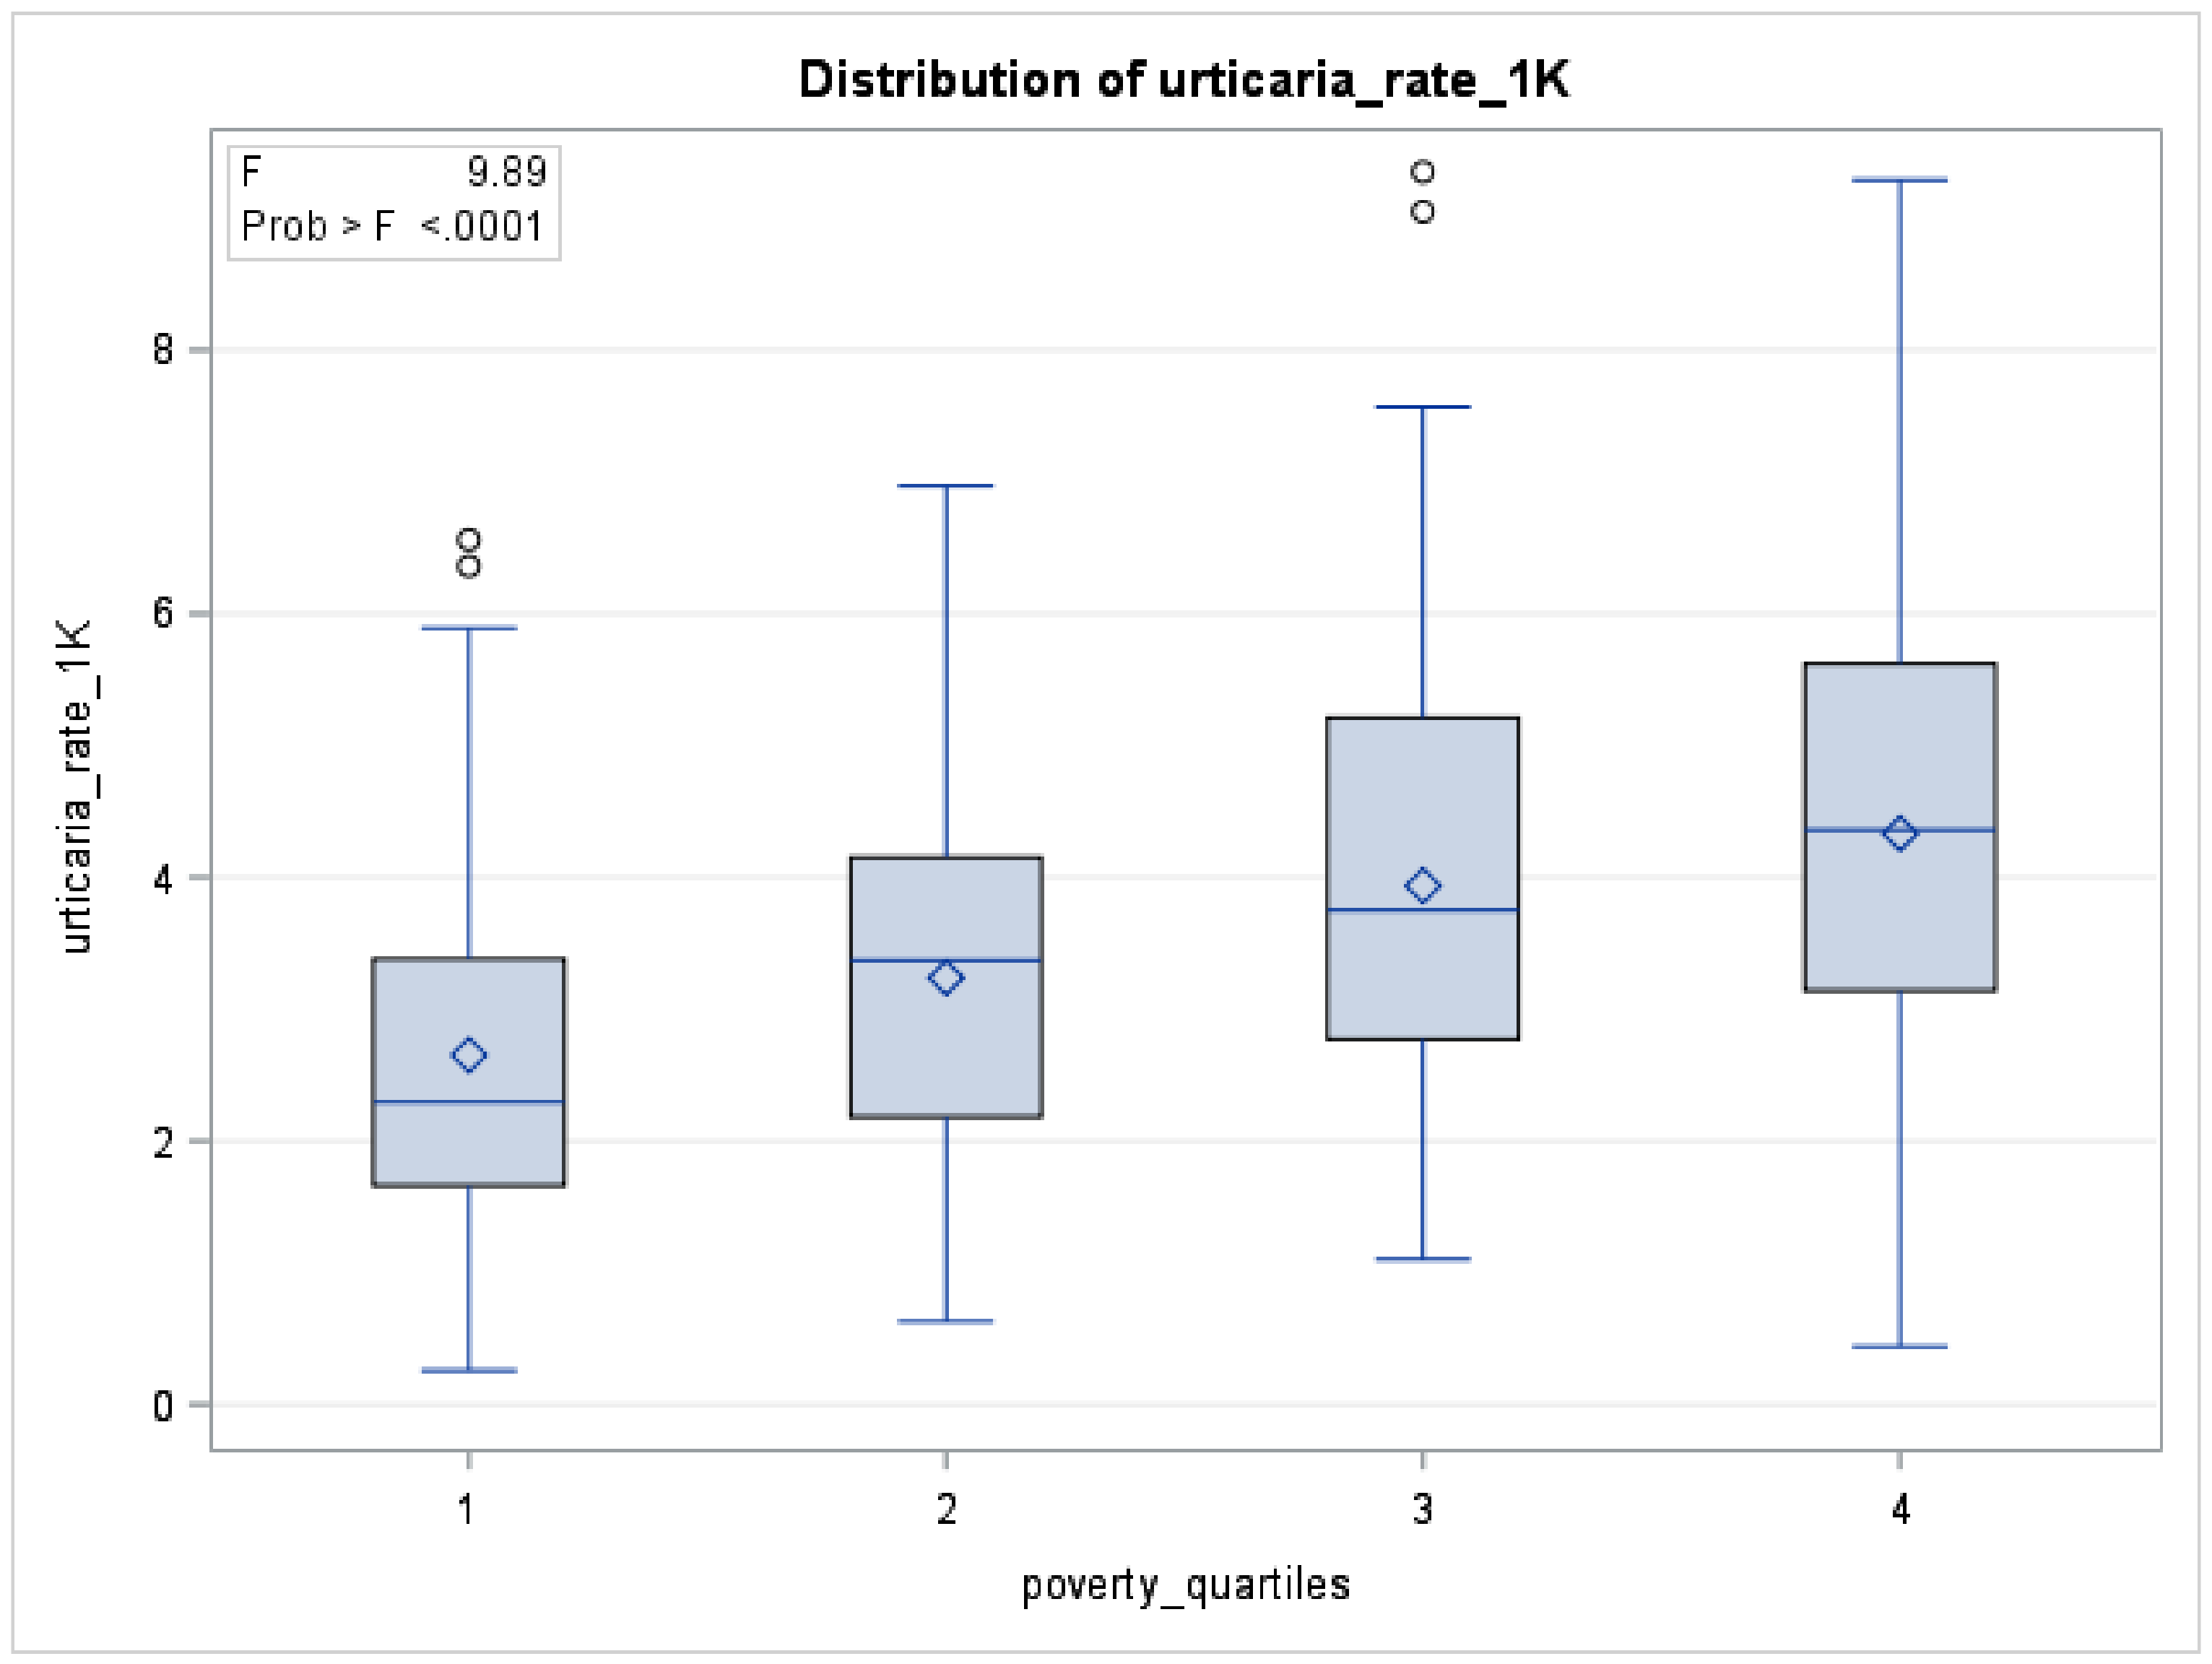
4.2.3. Percentage of Poverty
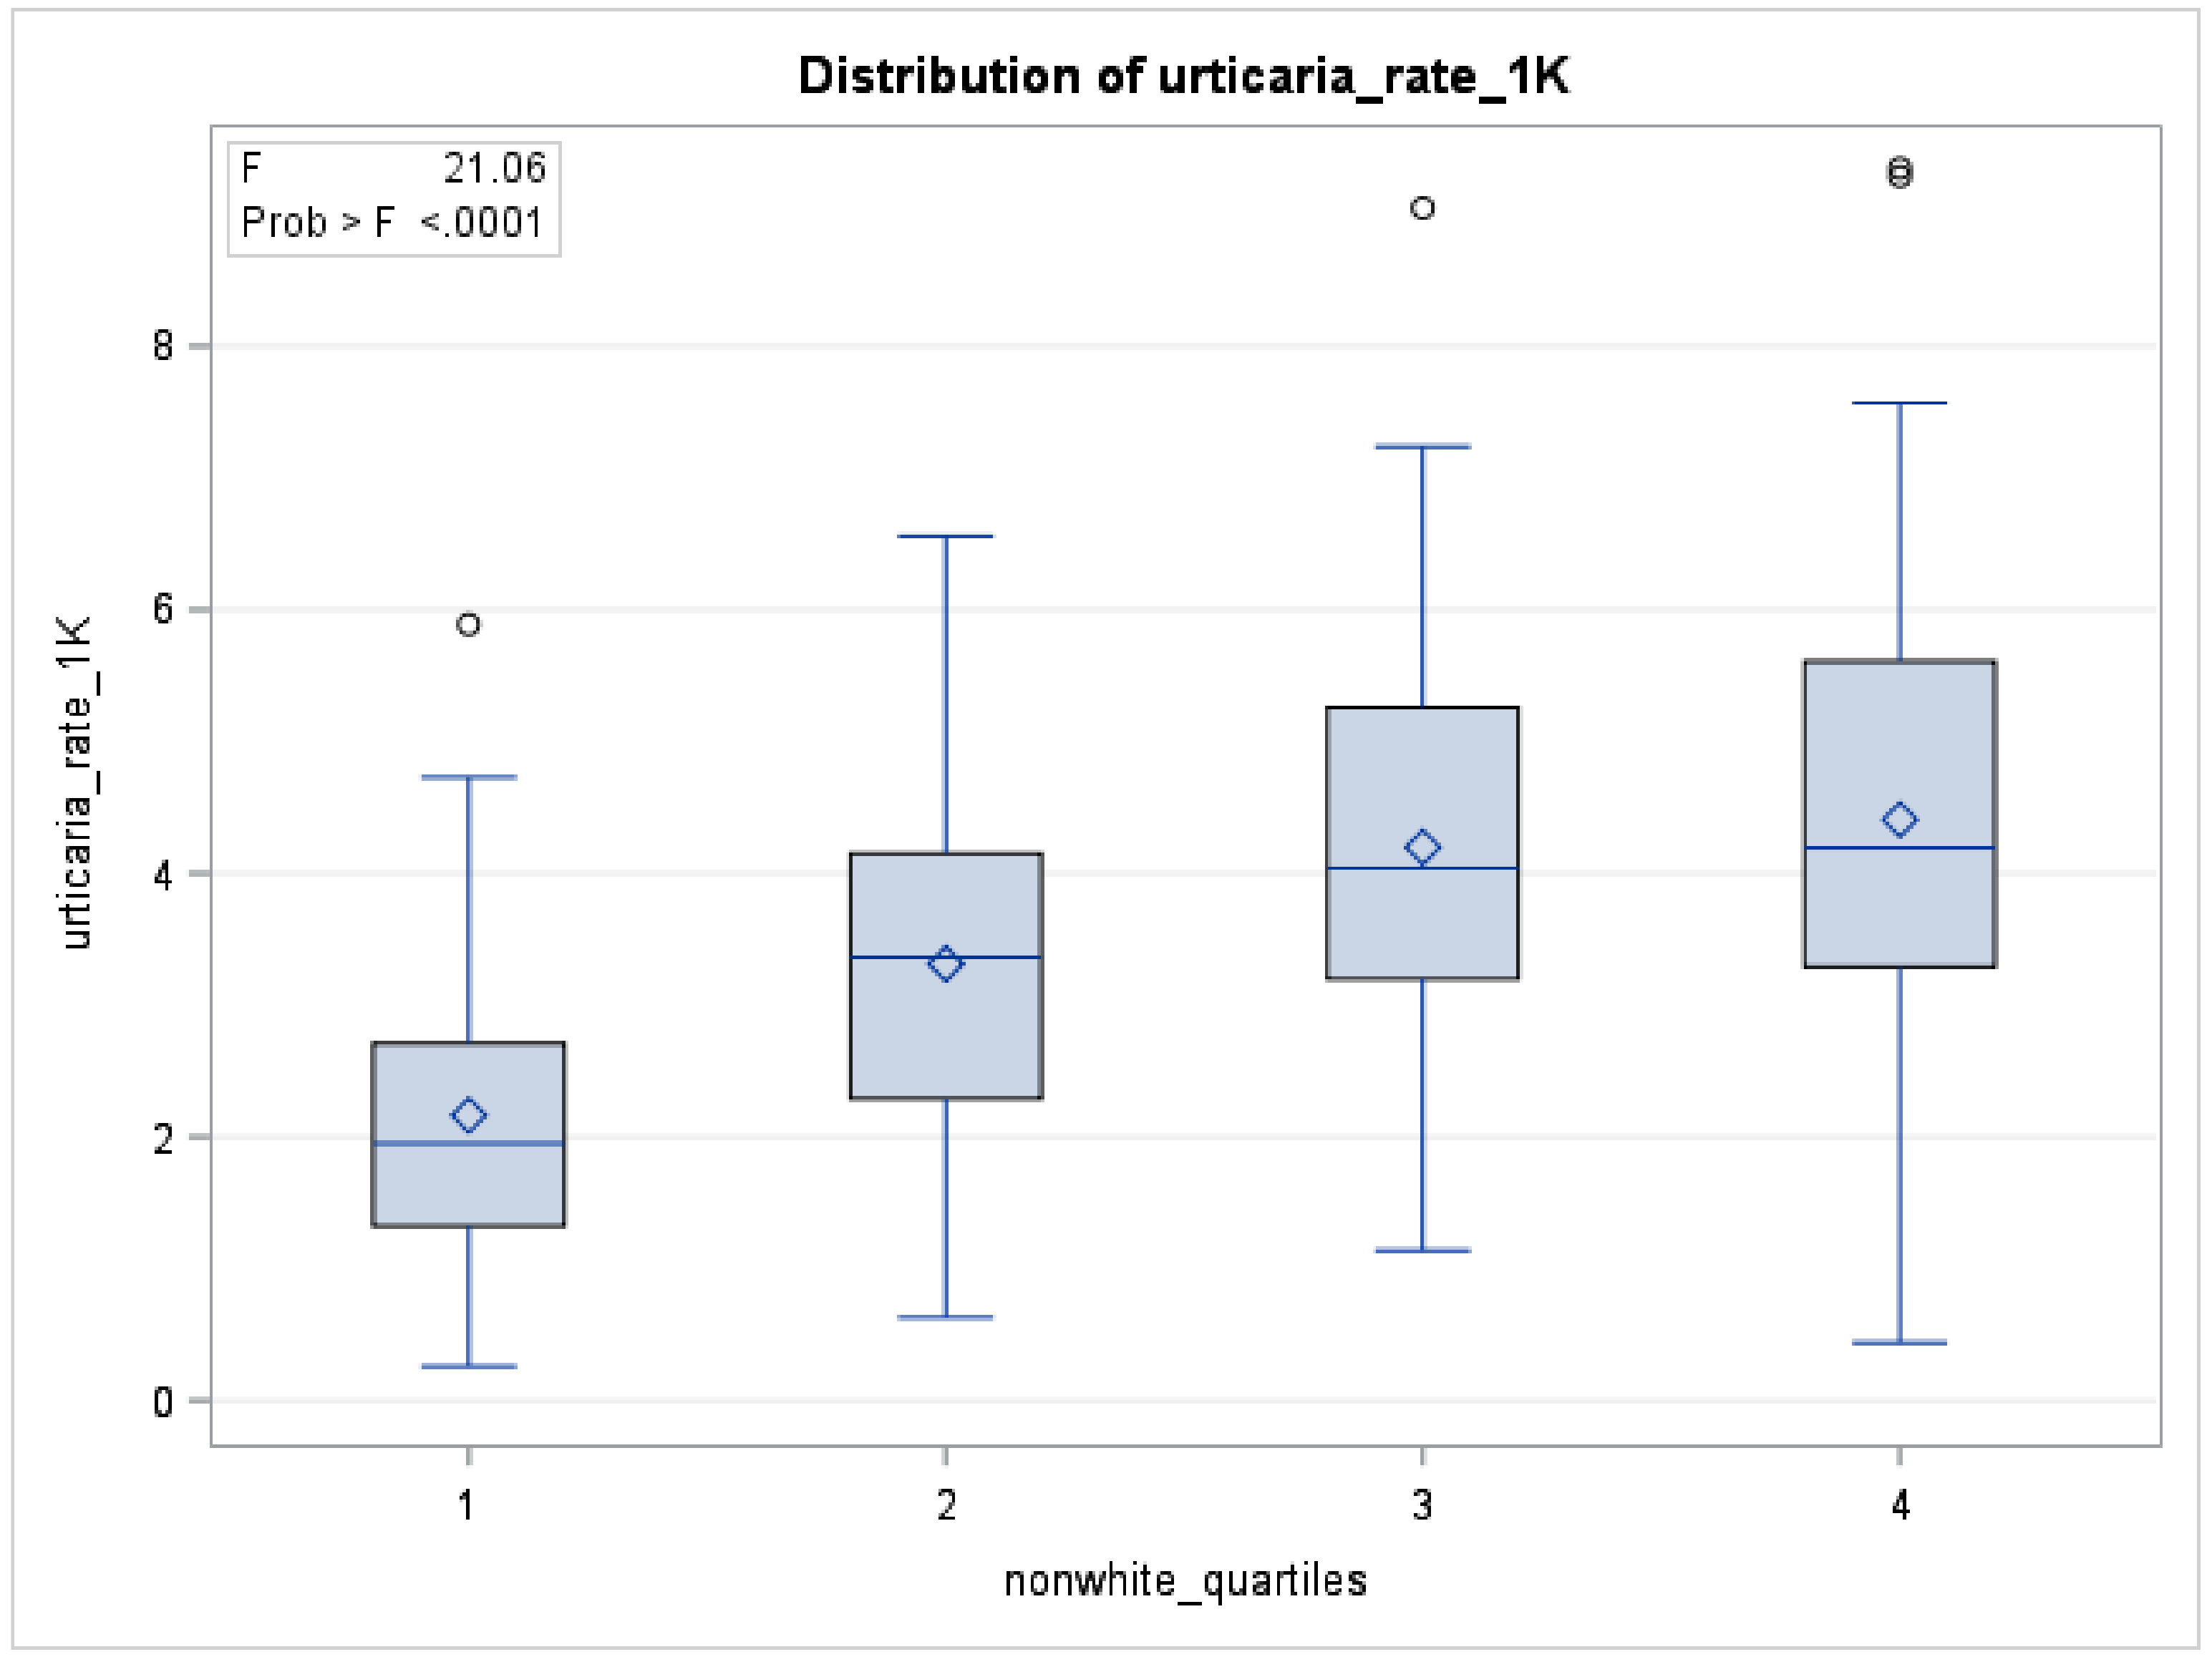
4.2.4. Percentage of Non-White Race
4.2.5. Percentage Less Than 18 Years of Age
4.2.6. Gender
4.2.7. Diesel Particulate Matter
4.3. Strengths
4.4. Limitations
5. Conclusions
Author Contributions
Funding
Institutional Review Board Statement
Informed Consent Statement
Data Availability Statement
Conflicts of Interest
References
- Zuberbier, T. Urticaria. Allergy 2003, 58, 1224–1234. [Google Scholar] [CrossRef] [PubMed]
- Raciborski, F.; Kłak, A.; Czarnecka-Operacz, M.; Jenerowicz, D.; Sybilski, A.; Kuna, P.; Samoliński, B.; Wg, E. Epidemiology of urticaria in Poland—nationally representative survey results. Postepy Dermatol. Alergol. 2018, 35, 67–73. [Google Scholar] [CrossRef] [PubMed]
- Kayiran, M.A.; Akdeniz, N. Diagnosis and treatment of urticaria in primary care. North. Clin. Istanb. 2019, 6, 93–99. [Google Scholar]
- Wedi, B.; Wieczorek, D.; Raap, U.; Kapp, A. Urticaria. JDDG J. Dtsch. Dermatol. Ges. 2014, 12, 997–1009. [Google Scholar] [CrossRef]
- Radonjic-Hoesli, S.; Hofmeier, K.S.; Micaletto, S.; Schmid-Grendelmeier, P.; Bircher, A.; Simon, D. Urticaria and angioedema: An update on classification and pathogenesis. Clin. Rev. Allergy Immunol. 2017, 54, 88–101. [Google Scholar] [CrossRef] [PubMed]
- Shrestha, P.; Dhital, R.; Poudel, D.; Donato, A.; Karmacharya, P.; Craig, T. Trends in hospitalizations related to anaphylaxis, angioedema, and urticaria in the United States. Ann. Allergy Asthma Immunol. 2019, 122, 401–406.e2. [Google Scholar] [CrossRef] [PubMed]
- Kanerva, L.; Toikkanen, J.; Jolanki, R.; Estlander, T. Statistical data on occupational contact urticaria. Contact Dermat. 1996, 35, 229–233. [Google Scholar] [CrossRef]
- Poulos, L.M.; Waters, A.-M.; Correll, P.K.; Loblay, R.H.; Marks, G.B. Trends in hospitalizations for anaphylaxis, angioedema, and urticaria in Australia, 1993–1994 to 2004–2005. J. Allergy Clin. Immunol. 2007, 120, 878–884. [Google Scholar] [CrossRef] [PubMed]
- Silvares, M.R.C.; Coelho, K.I.R.; Dalben, I.; Lastória, J.C.; Abbade, L.P.F. Sociodemographic and clinical characteristics, causal factors and evolution of a group of patients with chronic urticaria-angioedema. Sao Paulo Med. J. 2007, 125, 281–285. [Google Scholar] [CrossRef] [PubMed]
- Chow, S.K. Management of chronic urticaria in Asia: 2010 AADV consensus guidelines. Asia Pac. Allergy 2012, 2, 149–160. [Google Scholar] [CrossRef] [PubMed]
- Misirlioglu, E.D.; Özmen, S.; Susam, H.; Doksöz, Ö.; Doğru, M.; Duman, H. Characteristics of children with urticaria in the pediatric allergy department. Turk. J. Pediatric Dis. 2013, 7, 6–10. [Google Scholar] [CrossRef]
- Dice, J.P. Physical Urticeria. Immunol. Allergy Clin. N. Am. 2004, 24, 225–246. [Google Scholar] [CrossRef] [PubMed]
- Meng, Y.Y.; Rull, R.P.; Wilhelm, M.; Lombardi, C.; Balmes, J.; Ritz, B. Outdoor air pollution and uncontrolled asthma in the San Joaquin Valley, California. J. Epidemiol. Community Health. 2010, 64, 142–147. [Google Scholar] [CrossRef] [PubMed]
- Li, J.; Mahalov, A.; Hyde, P. Impacts of agricultural irrigation on ozone concentrations in the Central Valley of California and in the contiguous United States based on WRF-Chem simulations. Agric. For. Meteorol. 2016, 221, 34–49. [Google Scholar] [CrossRef]
- Hu, J.; Howard, C.J.; Mitloehner, F.; Green, P.G.; Kleeman, M.J. Mobile source and livestock feed contributions to regional ozone formation in Central California. Environ. Sci. Technol. 2012, 46, 2781–2789. [Google Scholar] [CrossRef] [PubMed]
- Kedarisetty, S.; Jones, E.; Tint, D.; Soliman, A.M.S. Air Pollution and Angioedema. Otolaryngol. Head Neck Surg. 2019, 161, 431–438. [Google Scholar] [CrossRef] [PubMed]
- Kousha, T.; Valacchi, G. The air quality health index and emergency department visits for urticaria in Windsor, Canada. J. Toxicol. Environ. Health Part A 2015, 78, 524–533. [Google Scholar] [CrossRef]
- Alcala, E.; Cisneros, R.; Capitman, J.A. Health care access, concentrated poverty, and pediatric asthma hospital care use in California’s San Joaquin Valley: A multilevel approach. J. Asthma 2018, 55, 1253–1261. [Google Scholar] [CrossRef] [PubMed]
- Entwistle, M.R.; Gharibi, H.; Tavallali, P.; Cisneros, R.; Schweizer, D.; Brown, P.; Ha, S. Ozone pollution and asthma emergency department visits in Fresno, CA, USA, during the warm season (June–September) of the years 2005 to 2015: A time-stratified case-crossover analysis. Air Qual. Atmos. Health 2019, 12, 661–672. [Google Scholar] [CrossRef]
- Vempilly, J.; Abejie, B.; Diep, V.; Gushiken, M.; Rawat, M.; Tyner, T.R. The synergetic effect of ambient PM2.5exposure and rhinovirus infection in airway dysfunction in asthma: A pilot observational study from the central valley of california. Exp. Lung Res. 2013, 39, 434–440. [Google Scholar] [CrossRef]
- Zuberbier, T.; Iffländer, J.; Semmler, C.; Henz, B.M. Acute urticaria: Clinical aspects and therapeutic responsiveness. Acta Derm. Venereol. 1996, 76, 295–297. [Google Scholar] [PubMed]
- Office of Statewide Planning and Development. Available online: https://oshpd.ca.gov/ (accessed on 1 December 2020).
- American Academy of Asthma Allergy and Immunology. Urticaria Codes for ICD-10. Available online: https://www.aaaai.org/Aaaai/media/MediaLibrary/PDF%20Documents/Practice%20Management/finances-coding/Urticaria-Codes-ICD-10.pdf (accessed on 6 March 2021).
- ICDdata Reference Website. Available online: https://www.icd10data.com/ICD10CM/Codes/L00-L99/L49-L54/L50- (accessed on 6 March 2021).
- American Academy of Asthma Allergy and Immunology. Allergy Top Fifty ICD 9 to ICD 10. Available online: https://aaaai.confex.com/aaaai/2014/webprogram/Handout/Session4100/Allergy_Top_50_ICD9_to_ICD10_final.pdf (accessed on 6 March 2021).
- California Office of Environmental Health Hazard Assessment. Calenviroscreen 3.0. Available online: https://oehha.ca.gov/calenviroscreen/report/calenviroscreen-30 (accessed on 1 December 2020).
- California Air Resources Board. Available online: https://ww3.arb.ca.gov/qaweb/mapdemo/map_module.php (accessed on 1 December 2020).
- Song, M.K.; Lin, F.C.; Ward, S.E.; Fine, J.P. Composite variables: When and how. Nurs. Res. 2013, 62, 45–49. [Google Scholar] [CrossRef] [PubMed]
- R Project for Statistical Computing. Available online: https://www.r-project.org/ (accessed on 1 December 2020).
- Losappio, L.; Heffler, E.; Bussolino, C.; Cannito, C.D.; Carpentiere, R.; Raie, A.; Di Biase, M.; Bugiani, M.; Rolla, G. Acute urticaria presenting in the emergency room of a general hospital. Eur. J. Intern. Med. 2014, 25, 147–150. [Google Scholar] [CrossRef] [PubMed]
- Lee, S.J.; Ha, E.K.; Jee, H.M.; Lee, K.S.; Kim, M.; Kim, D.H.; Jung, Y.-H.; Sheen, Y.H.; Sung, M.S.; Han, M.Y. Prevalence and risk factors of urticaria with a focus on chronic urticaria in children. Allergy Asthma Immunol. Res. 2017, 9, 212–219. [Google Scholar] [CrossRef]
- Śpiewak, R.; Góra-Florek, A.; Horoch, A.; Jarosz, M.J.; Doryńska, A.; Golec, M.; Dutkiewicz, J. Risk factors for work-related eczema and urticaria among vocational students of agriculture. Ann. Agric. Environ. Med. 2017, 24, 716–721. [Google Scholar] [CrossRef]
- Arcangeli, G.; Traversini, V.; Tomasini, E.; Baldassarre, A.; Lecca, L.I.; Galea, R.P.; Mucci, N. Allergic Anaphylactic Risk in Farming Activities: A Systematic Review. Int. J. Environ. Res. Public Health 2020, 17, 4921. [Google Scholar] [CrossRef]
- Patel, N.P.; Prizment, A.E.; Thyagarajan, B.; Roberts, E.; Nelson, H.H.; Church, T.R.; Lazovich, D. Urban vs rural residency and allergy prevalence among adult women: Iowa Women’s Health Study. Ann. Allergy Asthma Immunol. 2018, 120, 654–660. [Google Scholar] [CrossRef]
- Xiao, Y.; Huang, X.; Jing, D.; Huang, Y.; Chen, L.; Zhang, X.; Zhao, S.; Zhang, M.; Luo, Z.; Su, J.; et al. The Prevalence of Atopic Dermatitis and Chronic Spontaneous Urticaria are Associated with Parental Socioeconomic Status in Adolescents in China. Acta Derm. Venereol. 2019, 99, 321–326. [Google Scholar] [CrossRef]
- Wertenteil, S.; Strunk, A.; Garg, A. Prevalence estimates for chronic urticaria in the United States: A sex- and age-adjusted population analysis. J. Am. Acad. Dermatol. 2019, 81, 152–156. [Google Scholar] [CrossRef]
- Techasatian, L.; Phungoen, P.; Chaiyarit, J.; Uppala, R. Etiological and predictive factors of pediatric urticaria in an emergency context. BMC Pediatrics 2021, 21, 1–6. [Google Scholar] [CrossRef]
- Sánchez-Borges, M.; Capriles-Hulett, A.; Caballero-Fonseca, F. Demographic and clinical profiles in patients with acute urticaria. Allergol. Immunopathol. 2015, 43, 409–415. [Google Scholar] [CrossRef] [PubMed]
- Shin, M.; Lee, S. Prevalence and Causes of Childhood Urticaria. Allergy Asthma Immunol. Res. 2017, 9, 189–190. [Google Scholar] [CrossRef]
- World Health Organization; International Agency for Research on Cancer. Diesel and Gasoline Engine Exhausts and Some Nitroarenes. IARC Monographs on the Evaluation of Carcinogenic Risks to Humans Volume 105. Available online: https://publications.iarc.fr/Book-And-Report-Series/Iarc-Monographs-On-The-Identification-Of-Carcinogenic-Hazards-To-Humans/Diesel-And-Gasoline-Engine-Exhausts-And-Some-Nitroarenes-2013#:~:text=In%201988%2C%20IARC%20classified%20diesel,for%20re%2Devaluation%20since%201998 (accessed on 6 March 2021).
- McCreanor, J.; Cullinan, P.; Nieuwenhuijsen, M.J.; Stewart-Evans, J.; Malliarou, E.; Jarup, L.; Harrington, R.; Svartengren, M.; Han, I.-K.; Ohman-Strickland, P.; et al. Respiratory effects of exposure to diesel traffic in persons with asthma. N. Engl. J. Med. 2007, 357, 2348–2358. [Google Scholar] [CrossRef]
- Zhang, J.J.; McCreanor, J.E.; Cullinan, P.; Chung, K.F.; Ohman-Strickland, P.; Han, I.K.; Järup, L.; Nieuwenhuijsen, M.J. Health effects of real-world exposure to diesel exhaust in persons with asthma. Research Report. Rep Health Eff Inst. 2009, 138, 5–109. [Google Scholar]
- Mrad-Nakhlé, M.; Farah, W.; Ziade, N.; Abboud, M.; Chalhoub, E.; Ghabi, E.; Dib, N.; Annesi-Maesano, I. Exposure to fine particulate matter and urticaria: An eco-epidemiological time-series analysis in Beirut. Toxicol. Environ. Health Sci. 2021. [Google Scholar] [CrossRef]
- Lademann, J.; Otberg, N.; Richter, H.; Jacobi, U.; Schaefer, H.; Blume-Peytavi, U.; Sterry, W. Follicular penetration. An important pathway for topically applied substances. Der Hautarzt 2003, 54, 321–323. [Google Scholar] [CrossRef] [PubMed]
- Kalkan, G.; Seçkin, H.Y.; Duygu, F.; Akbaş, A.; Ozyurt, H.; Sahin, M. Oxidative stress status in patients with acute urticaria. Cutan. Ocul. Toxicol. 2013, 33, 109–114. [Google Scholar] [CrossRef] [PubMed]


| Urticaria Diagnosis Code | Frequency (n) | Percentage (%) |
|---|---|---|
| L50.0 (Allergic Urticaria) | 3717 | 25.60 |
| L50.1 (Idiopathic Urticaria) | 101 | 0.70 |
| L50.2 (Cold and Heat Urticaria) | 4 | 0.02 |
| L50.3 (Dermatographic Urticaria) | 15 | 0.10 |
| L50.5 (Cholinergic Urticaria) | 2 | 0.01 |
| L50.6 (Contact Urticaria) | 11 | 0.07 |
| L50.9 (Unspecified Urticaria) | 10,567 | 72.80 |
| Missing Data | 99 | 0.70 |
| Total | 14,516 | 100.00 |
| Demographic Characteristic | n | % |
|---|---|---|
| Gender | ||
| Women | 8100 | 56.2 |
| Men | 6317 | 43.8 |
| Age | ||
| Younger than 5 years of age | 3505 | 24.3 |
| age 5 to 9 | 2179 | 15.1 |
| age 10 to 14 | 1285 | 8.9 |
| age 15 to 19 | 1239 | 8.6 |
| age 20 to 24 | 1200 | 8.3 |
| age 25 to 29 | 1043 | 7.2 |
| age 30 to 34 | 801 | 5.6 |
| age 35 to 44 | 1197 | 8.3 |
| age 45 to 54 | 865 | 6.0 |
| age 55 to 64 | 609 | 4.2 |
| age 65 to 74 | 317 | 2.2 |
| age 75 to 84 | 141 | 1.0 |
| age 85+ | 36 | 0.2 |
| Race/Ethnicity | ||
| White | 3397 | 23.6 |
| Black/African American | 764 | 5.3 |
| Hispanic/Latino | 9041 | 62.7 |
| Asian/Pacific Islander | 711 | 4.9 |
| Other Race/Ethnicity | 504 | 3.5 |
| Insurance | ||
| Medicaid | 10,053 | 69.7 |
| Medicare | 680 | 4.7 |
| Other Payer | 174 | 4.7 |
| Private | 2837 | 19.5 |
| Self-Pay | 673 | 4.7 |
| Demographic Characteristic | Rate Per 1000 |
|---|---|
| Gender | |
| Women | 1.9 |
| Men | 1.5 |
| Age in Years | |
| Younger than 5 years of age | 5.5 |
| Persons younger than 19 | 3.4 |
| Persons 65 years and over | 0.5 |
| Race/Ethnicity | |
| White | 1.2 |
| Black/African American | 2.0 |
| Hispanic/Latino | 2.2 |
| Asian/Pacific Islander | 1.1 |
| Other Race/Ethnicity | 0.4 |
| Measure | Min | Max | Mean | SD | Pearson’s r with Rate of Urticaria |
|---|---|---|---|---|---|
| % agricultural worker | 0 | 75 | 17.92 | 18.10 | 0.234 ** |
| Population density | 0 | 1 | 0.25 | 0.43 | 0.249 ** |
| Diesel exhaust PM | 0.71 | 68.60 | 8.69 | 12.16 | 0.166 * |
| % less than 18 years of age | 11.69 | 42.31 | 26.90 | 3.30 | 0.102 |
| % non-white | 12.38 | 98.48 | 60.47 | 24.76 | 0.413 *** |
| % poverty | 0 | 88.1 | 47.96 | 19.35 | 0.393 *** |
| Count of acute urticaria | 1 | 432 | 73.57 | 84.54 | - |
| ln (population at risk) | 6.03 | 11.32 | 9.21 | 1.36 | - |
| Parameter | beta | 95% CI | RR | 95% CI |
|---|---|---|---|---|
| Intercept | −6.394 *** | (−6.710, −6.078) | 0.002 | (0.001, 0.002) |
| Diesel particulate matter | 0.006 *** | (0.005, 0.007) | 1.006 | (1.005, 1.008) |
| Population density | 1.036 *** | (1.012, 1.059) | 2.817 | (2.752, 2.883) |
| % agricultural worker | 0.399 *** | (0.250, 0.547) | 1.490 | (1.284, 1.728) |
| % less than 18 years of age | 0.015 *** | (0.008, 0.022) | 1.015 | (1.008, 1.022) |
| Composite of lower % of non-white and poverty (dichotomous) | −0.466 *** | (−0.511, −0.420) | 0.628 | (0.600, 0.657) |
Publisher’s Note: MDPI stays neutral with regard to jurisdictional claims in published maps and institutional affiliations. |
© 2021 by the authors. Licensee MDPI, Basel, Switzerland. This article is an open access article distributed under the terms and conditions of the Creative Commons Attribution (CC BY) license (https://creativecommons.org/licenses/by/4.0/).
Share and Cite
Jadhav, R.; Alcala, E.; Sirota, S.; Capitman, J. Risk Factors for Acute Urticaria in Central California. Int. J. Environ. Res. Public Health 2021, 18, 3728. https://doi.org/10.3390/ijerph18073728
Jadhav R, Alcala E, Sirota S, Capitman J. Risk Factors for Acute Urticaria in Central California. International Journal of Environmental Research and Public Health. 2021; 18(7):3728. https://doi.org/10.3390/ijerph18073728
Chicago/Turabian StyleJadhav, Rohan, Emanuel Alcala, Sarah Sirota, and John Capitman. 2021. "Risk Factors for Acute Urticaria in Central California" International Journal of Environmental Research and Public Health 18, no. 7: 3728. https://doi.org/10.3390/ijerph18073728
APA StyleJadhav, R., Alcala, E., Sirota, S., & Capitman, J. (2021). Risk Factors for Acute Urticaria in Central California. International Journal of Environmental Research and Public Health, 18(7), 3728. https://doi.org/10.3390/ijerph18073728