
Blood Lead Level and Renal Impairment among Adults: A Meta-Analysis


Abstract
:1. Background
2. Methods
2.1. Protocol and Registration
2.2. Searches
2.3. Eligibility Criteria
2.4. Study Selection and Data Extraction
2.5. Quality of the Included Studies (Risk of Bias)
2.6. Study Outcomes
2.7. Statistical Analysis
3. Results
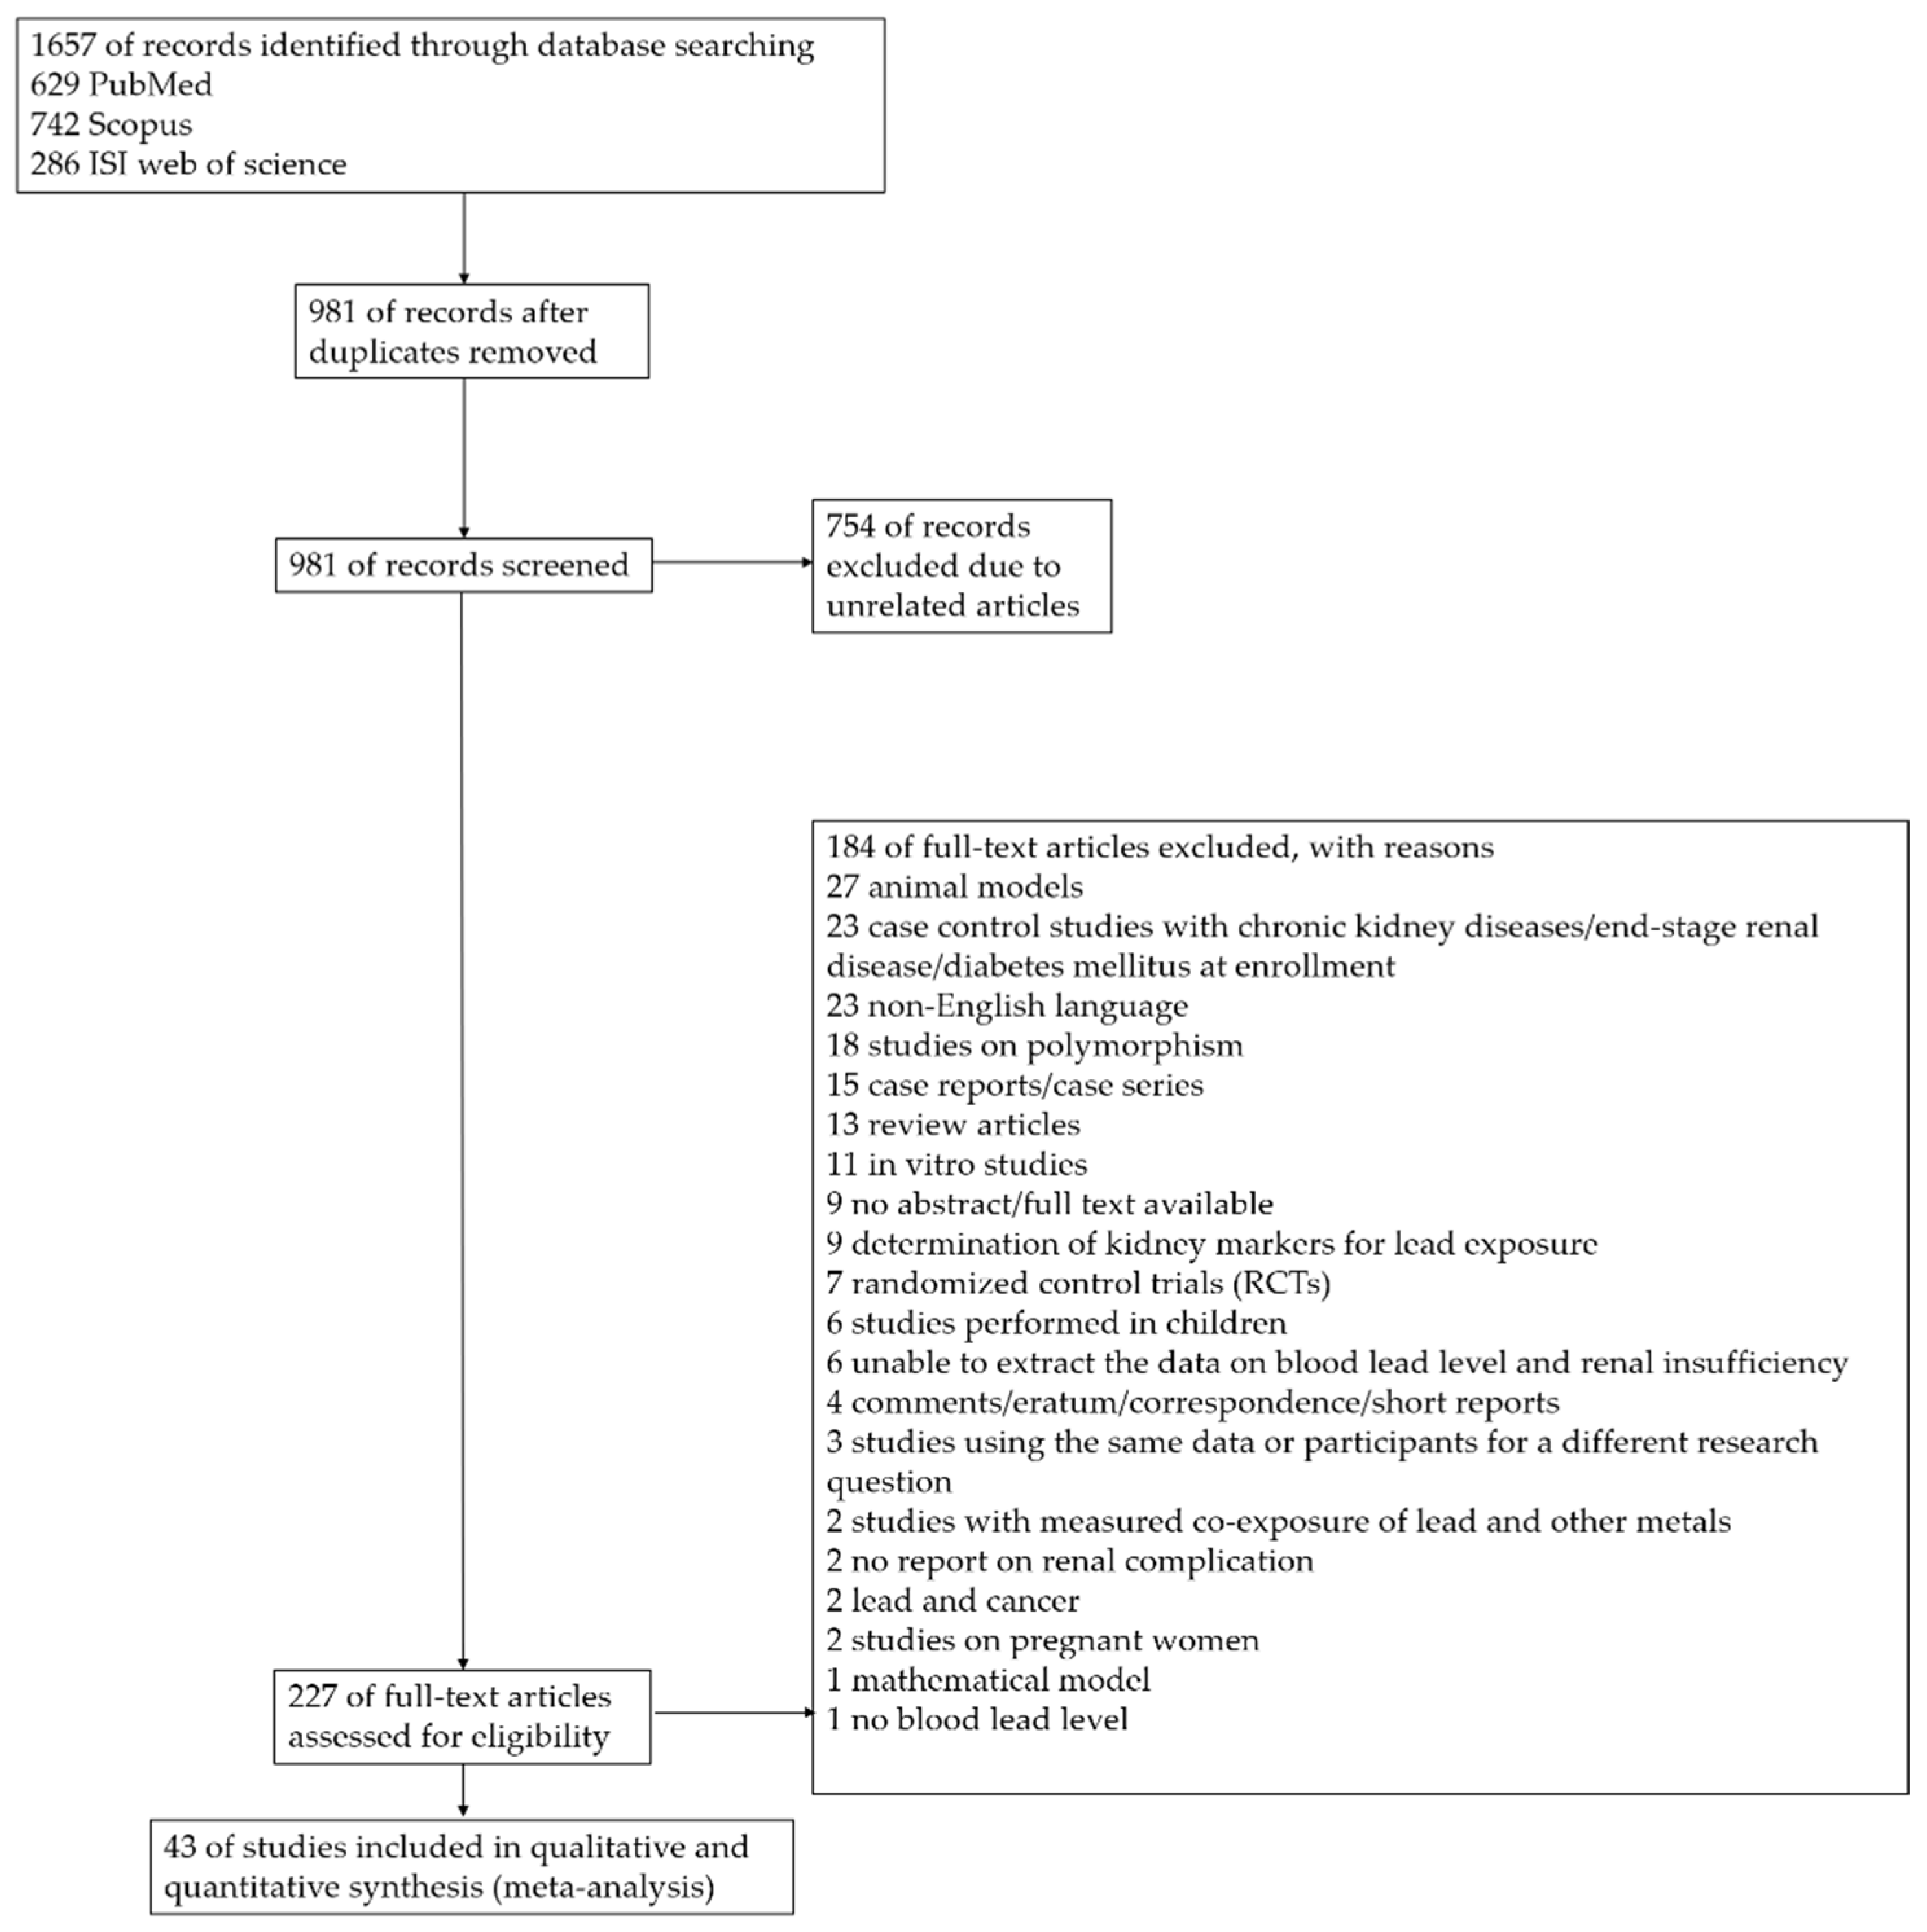
3.1. Search Results
3.2. Characteristics of the Included Studies
3.3. Quality of the Included Studies
3.4. Pooled Mean Blood Lead Level (BLL) among Exposed Participants
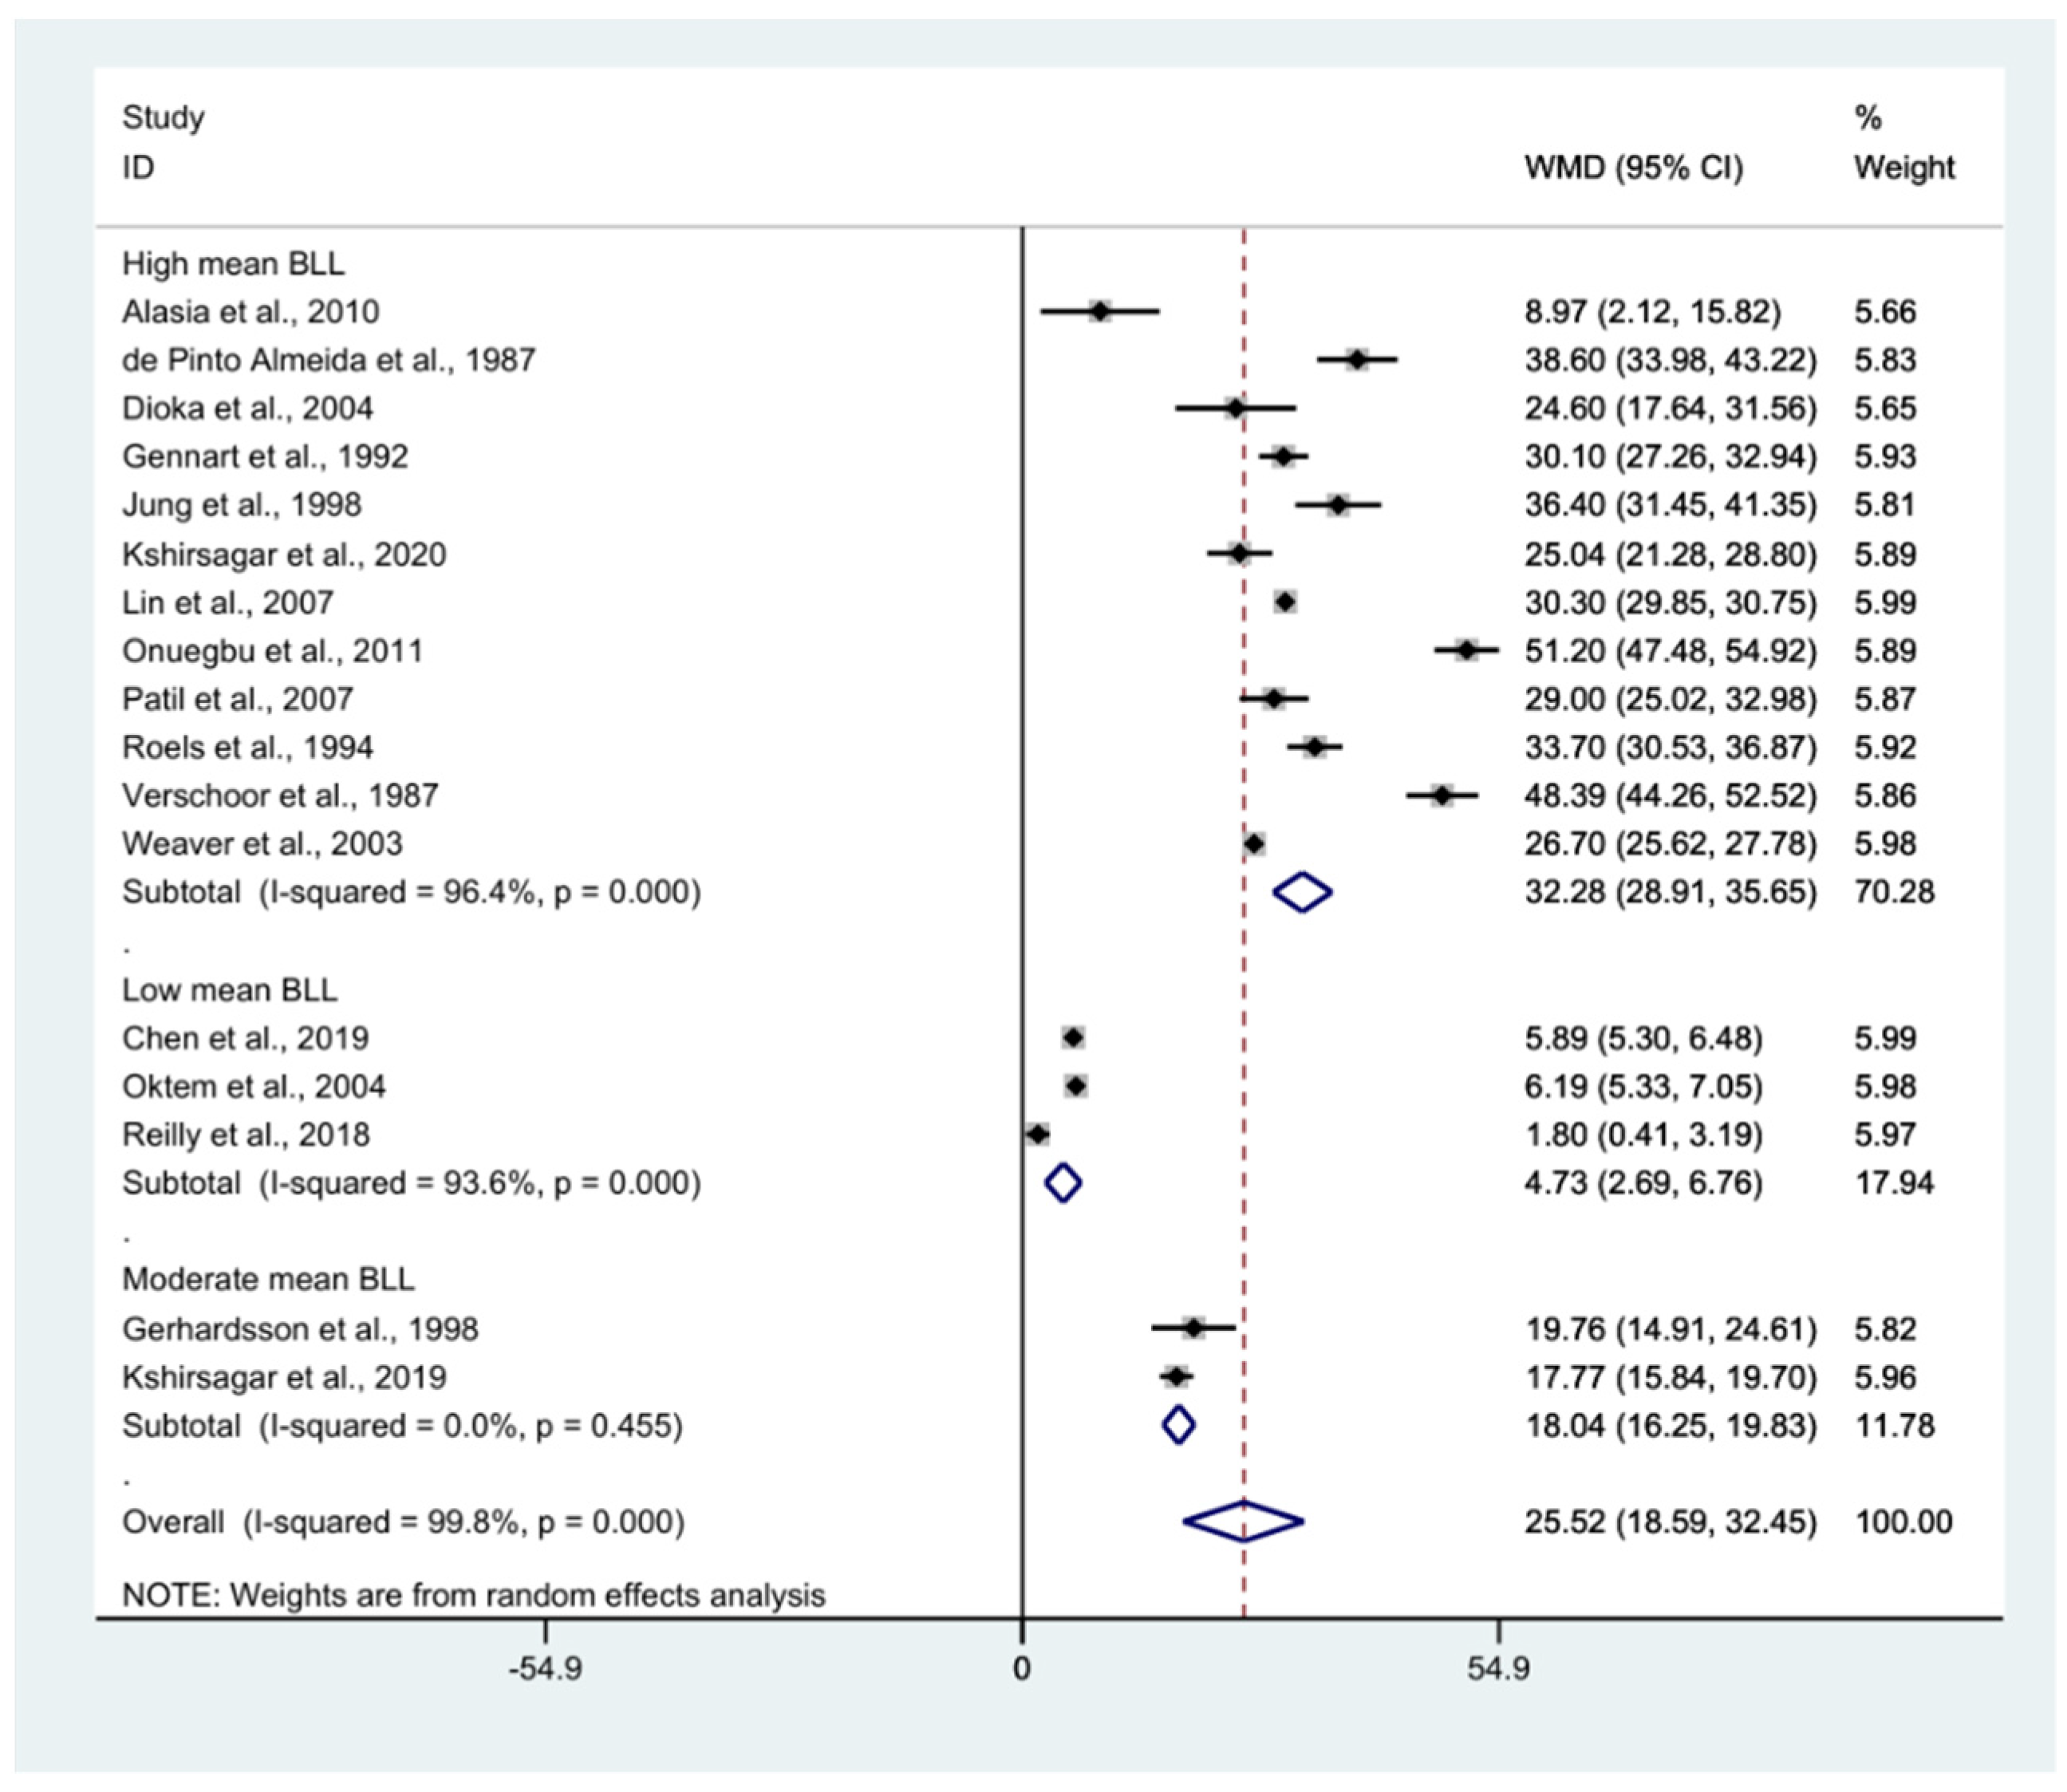
3.5. Pooled Mean Difference in BLL between Exposed and Control Participants
3.6. BLL and Gender
3.7. Renal Function Tests
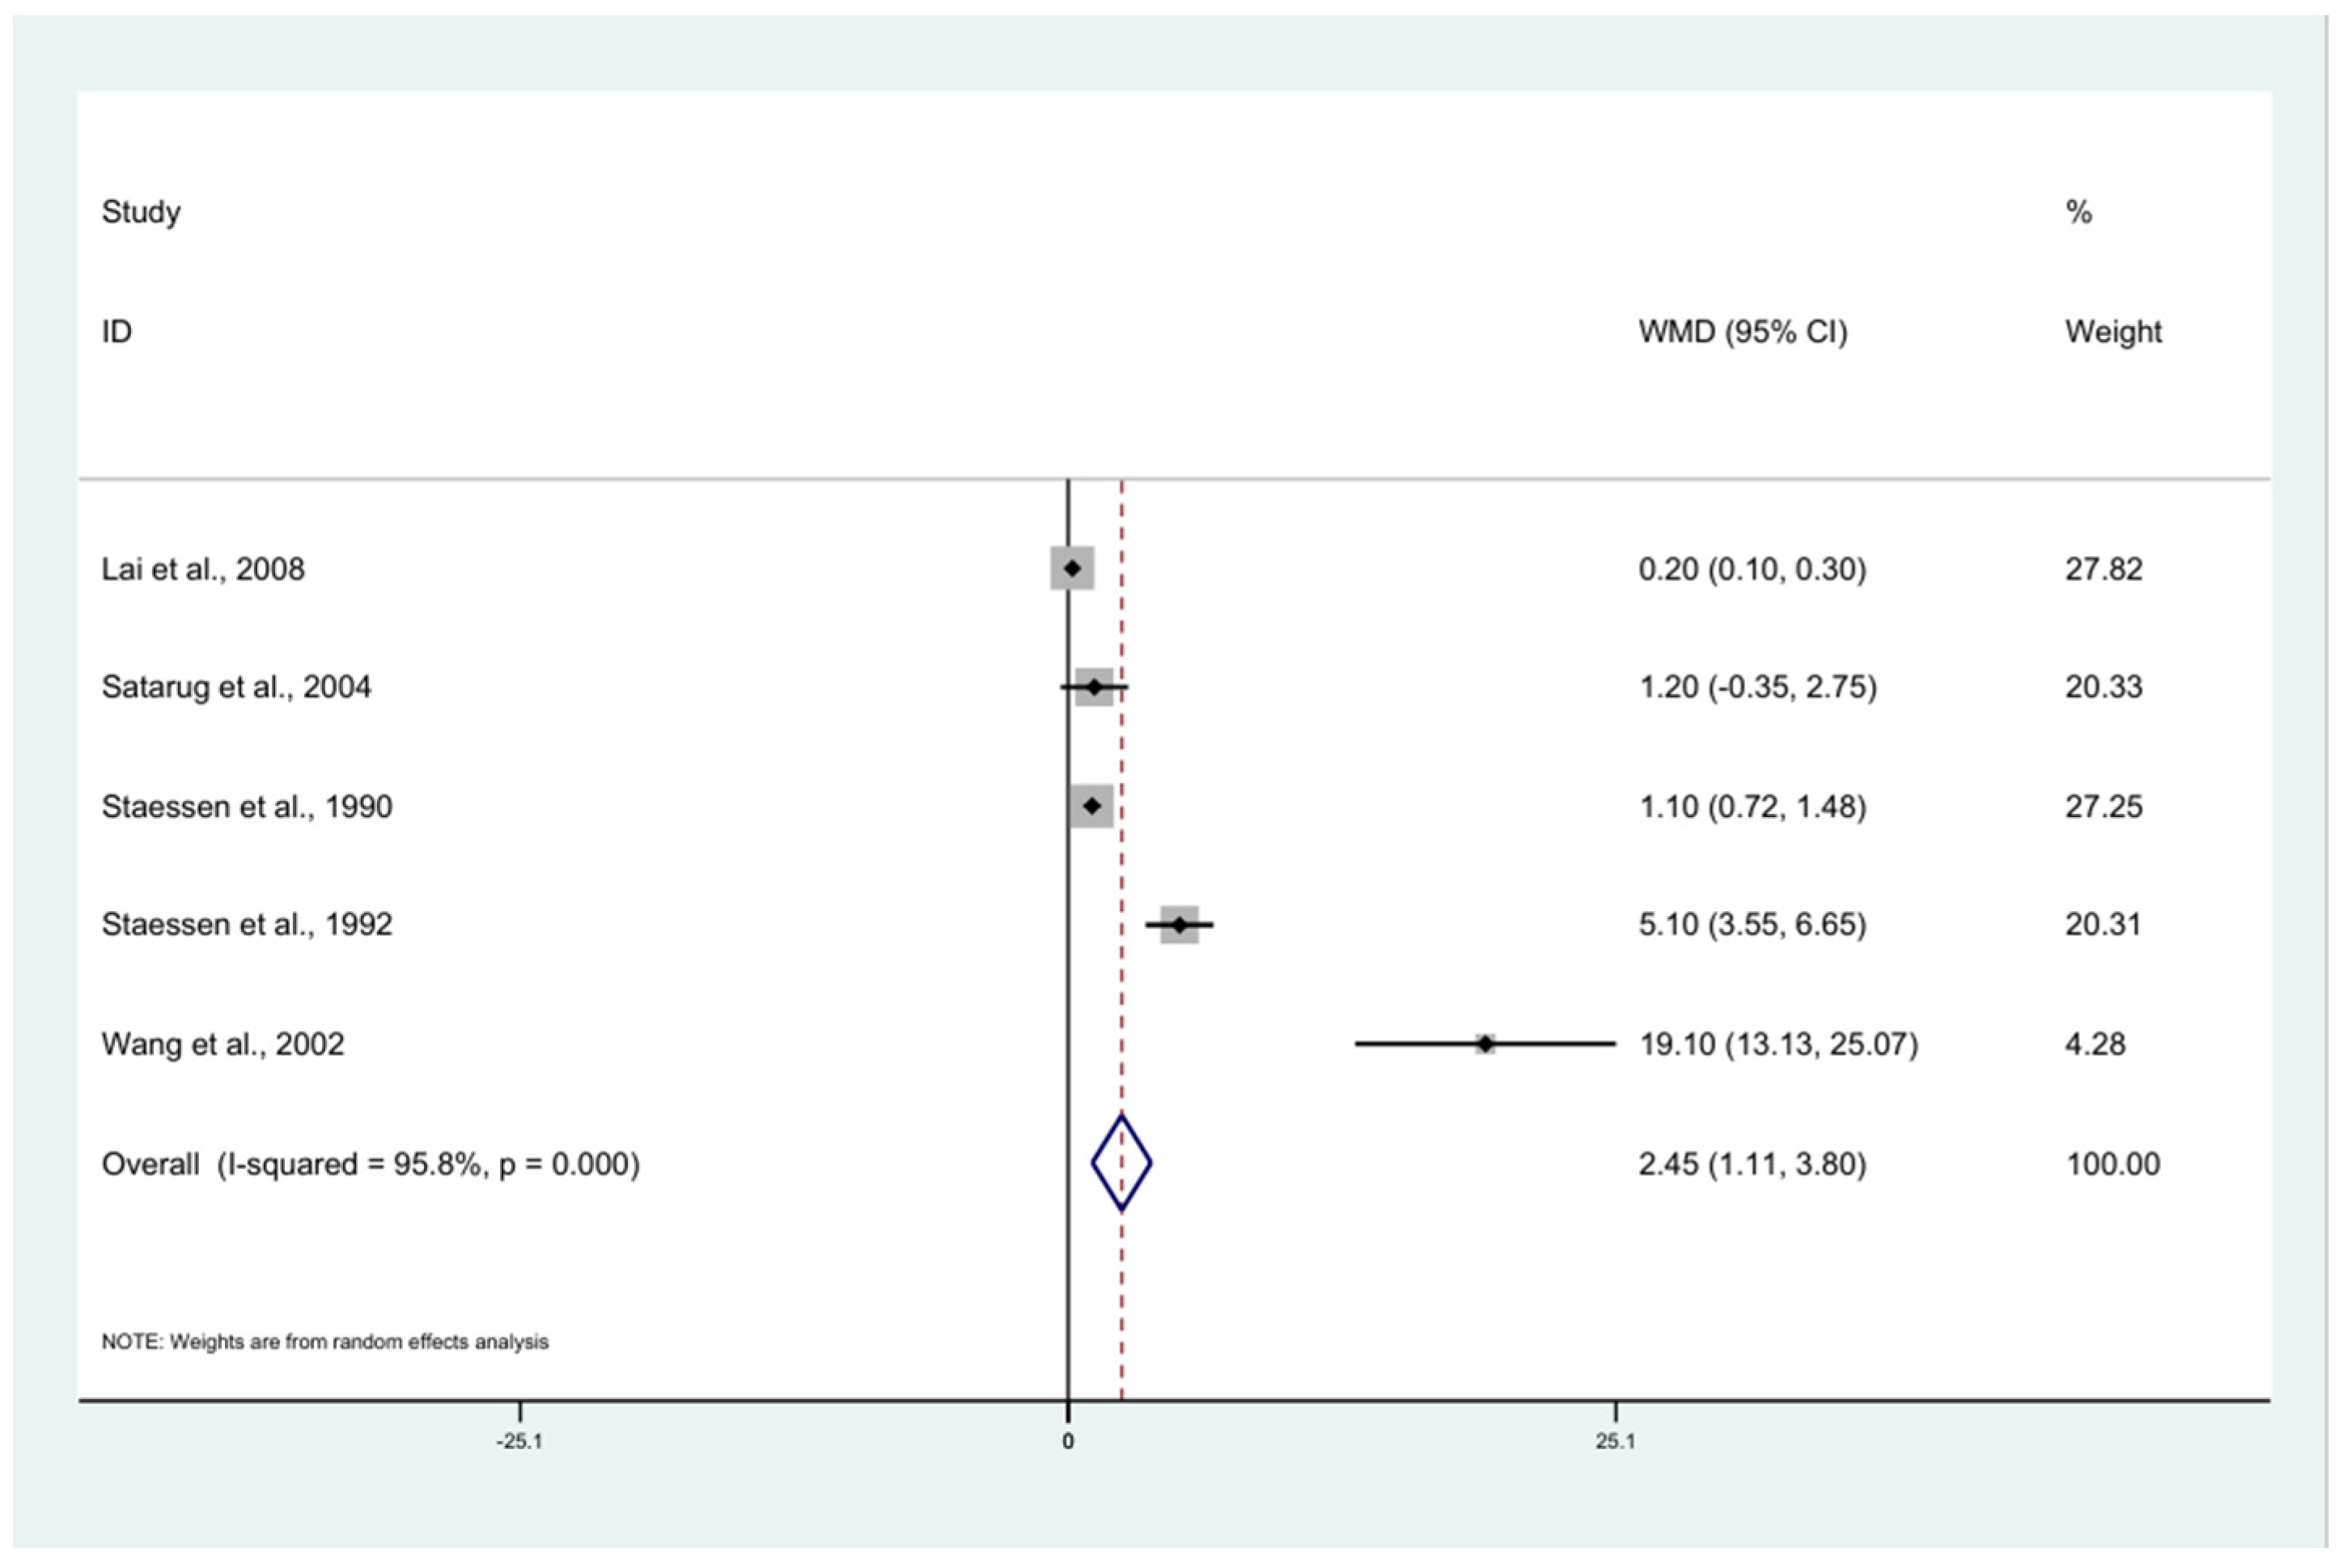
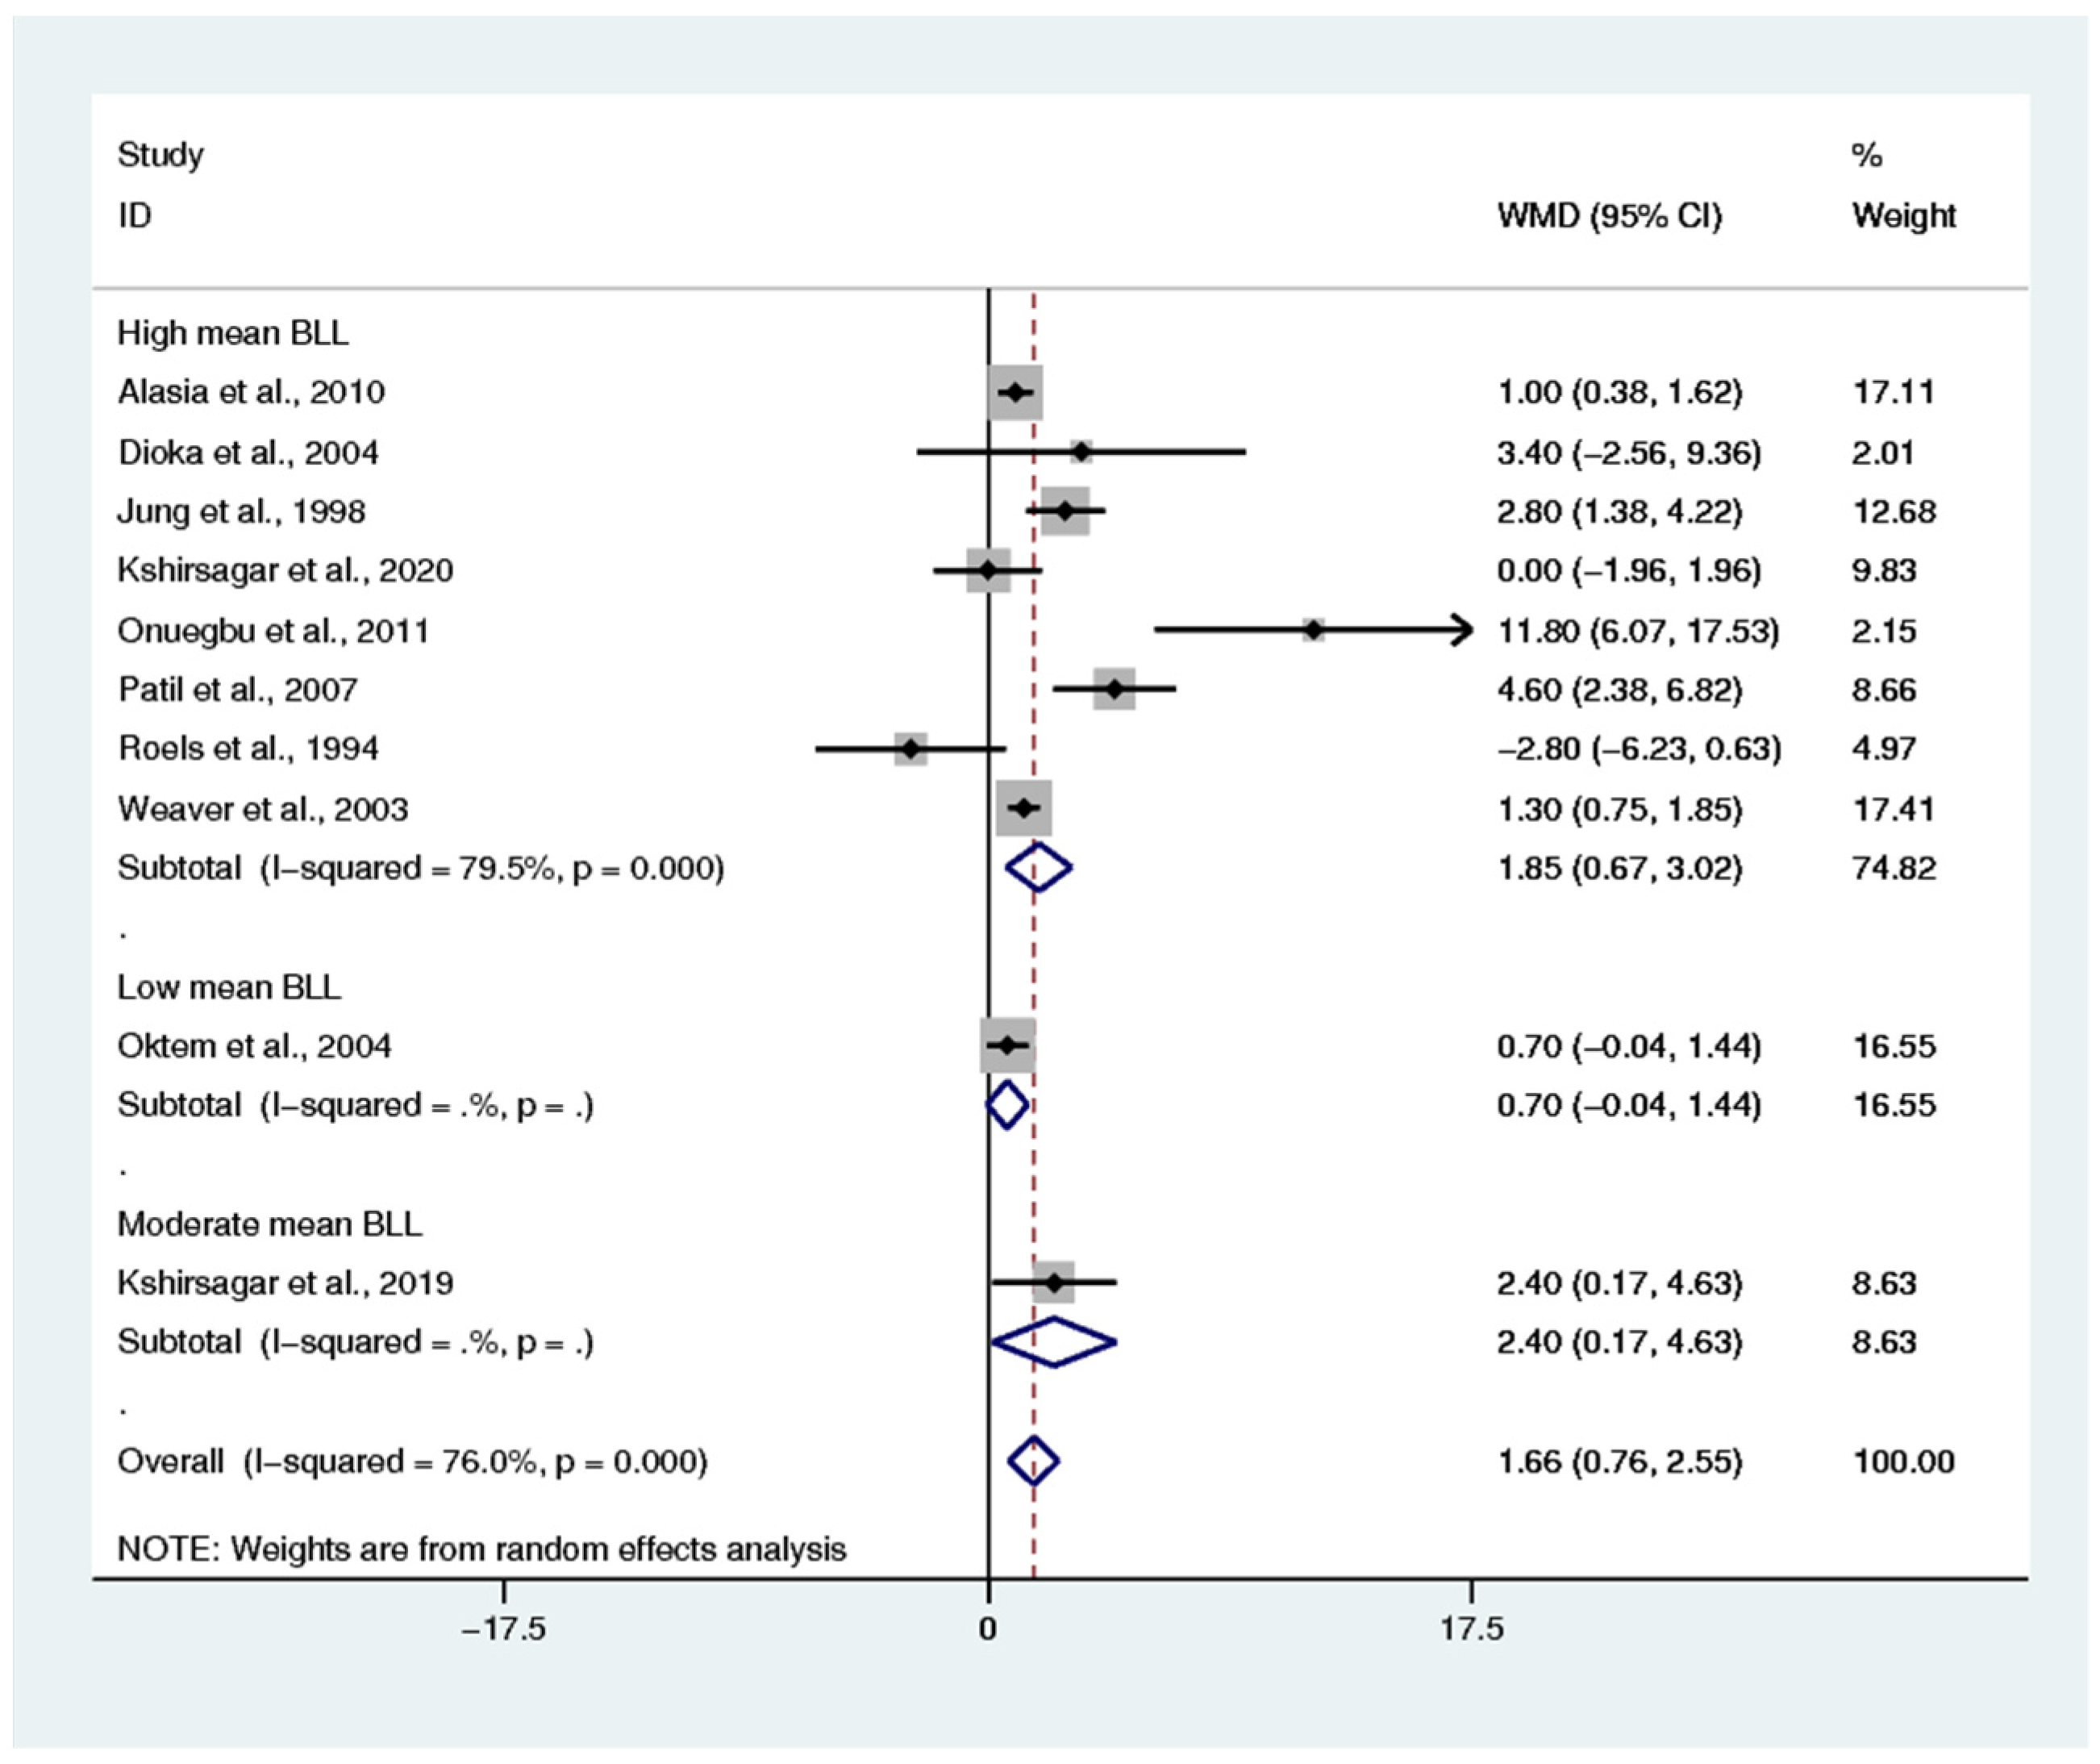
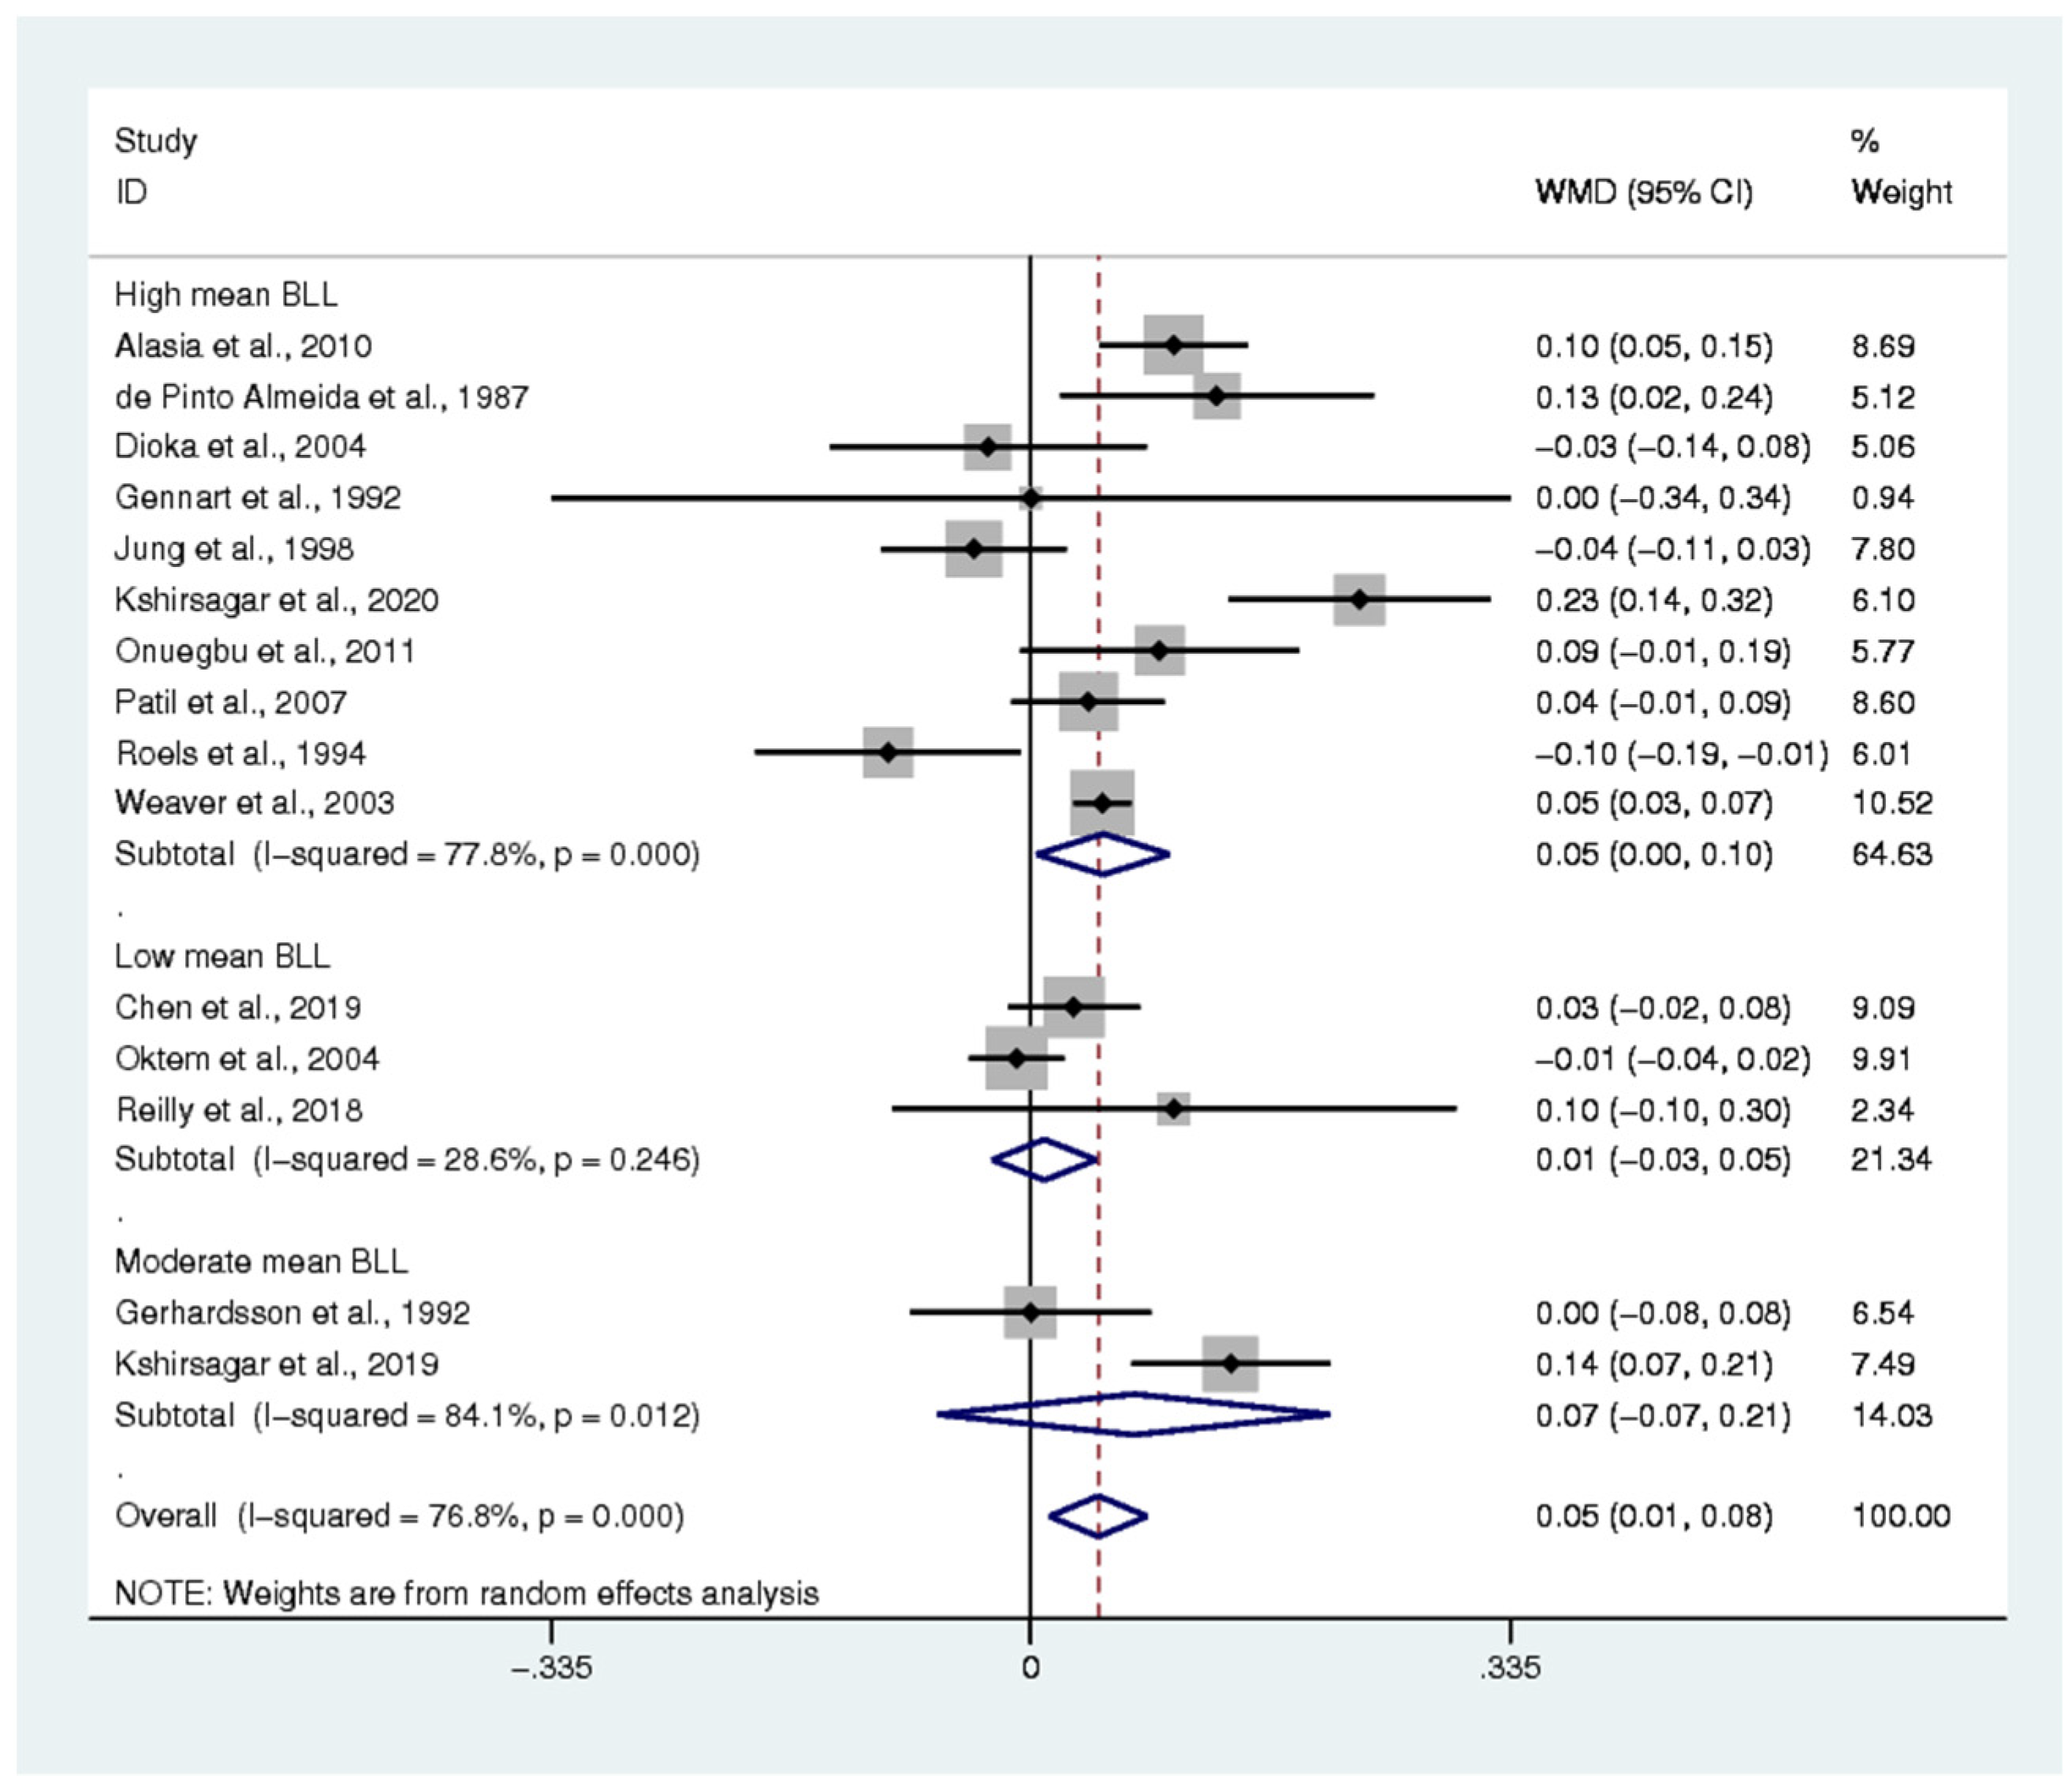
3.8. Renal Function Tests and BLL
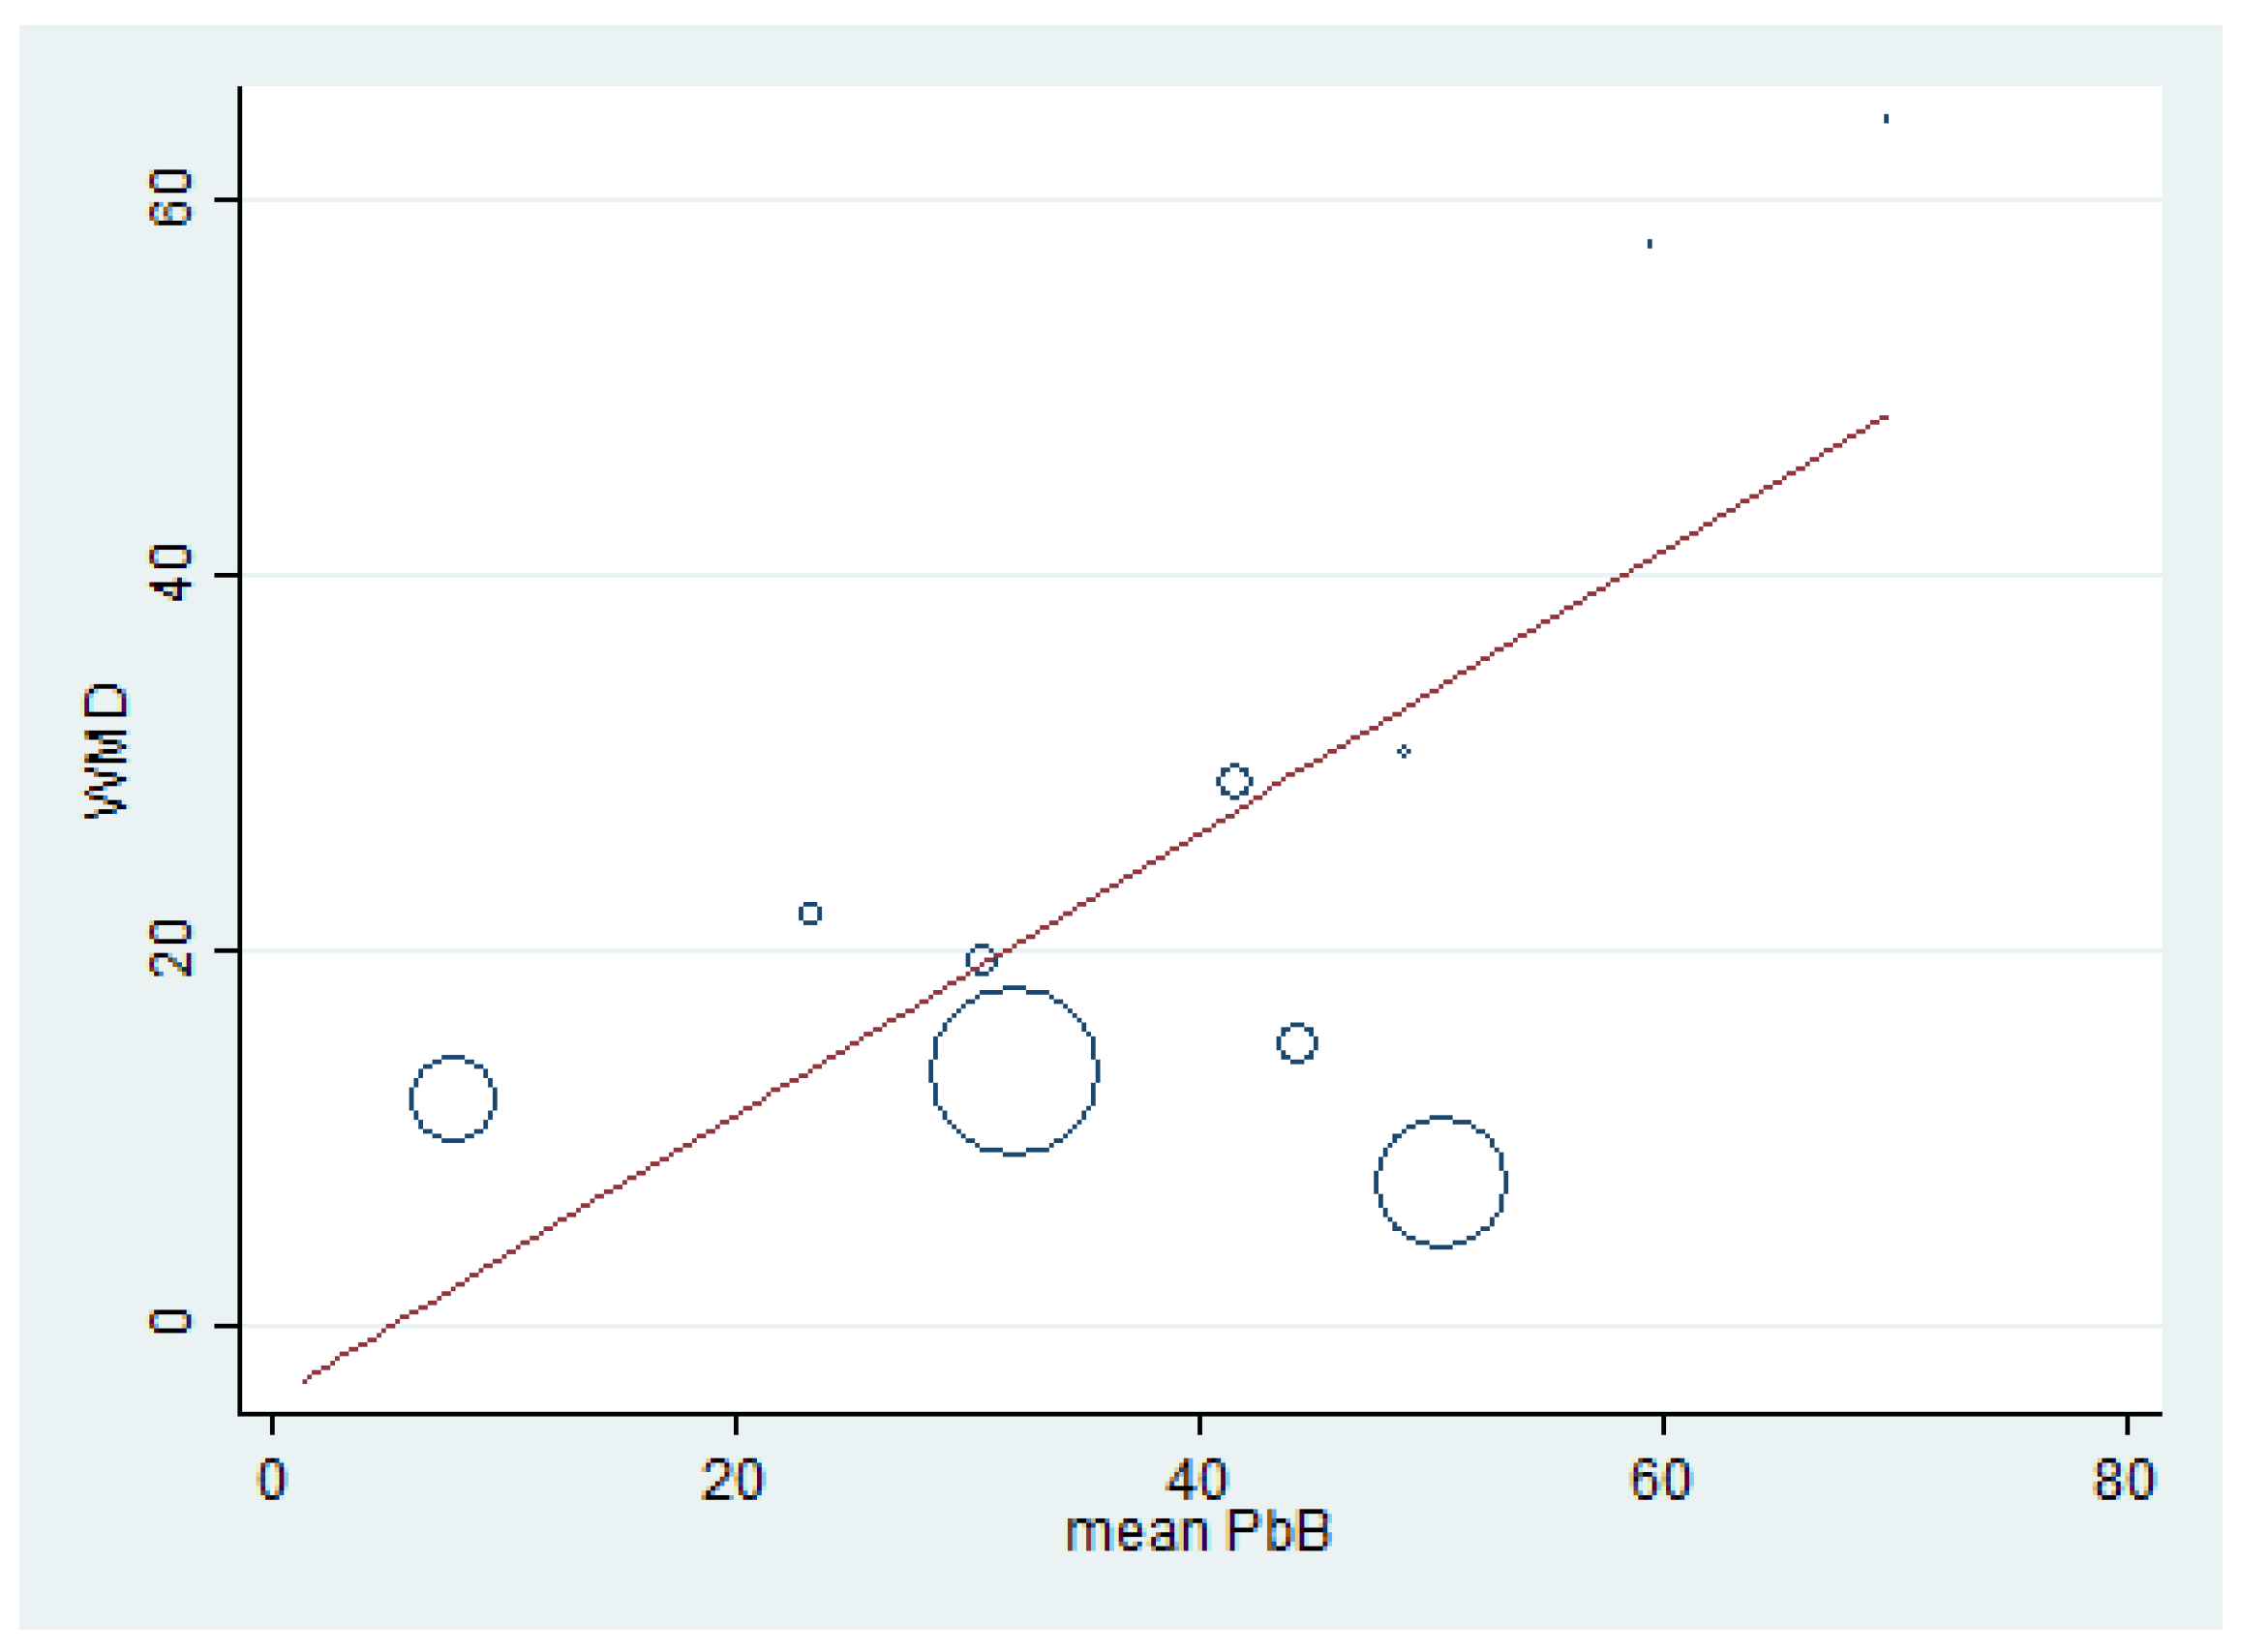
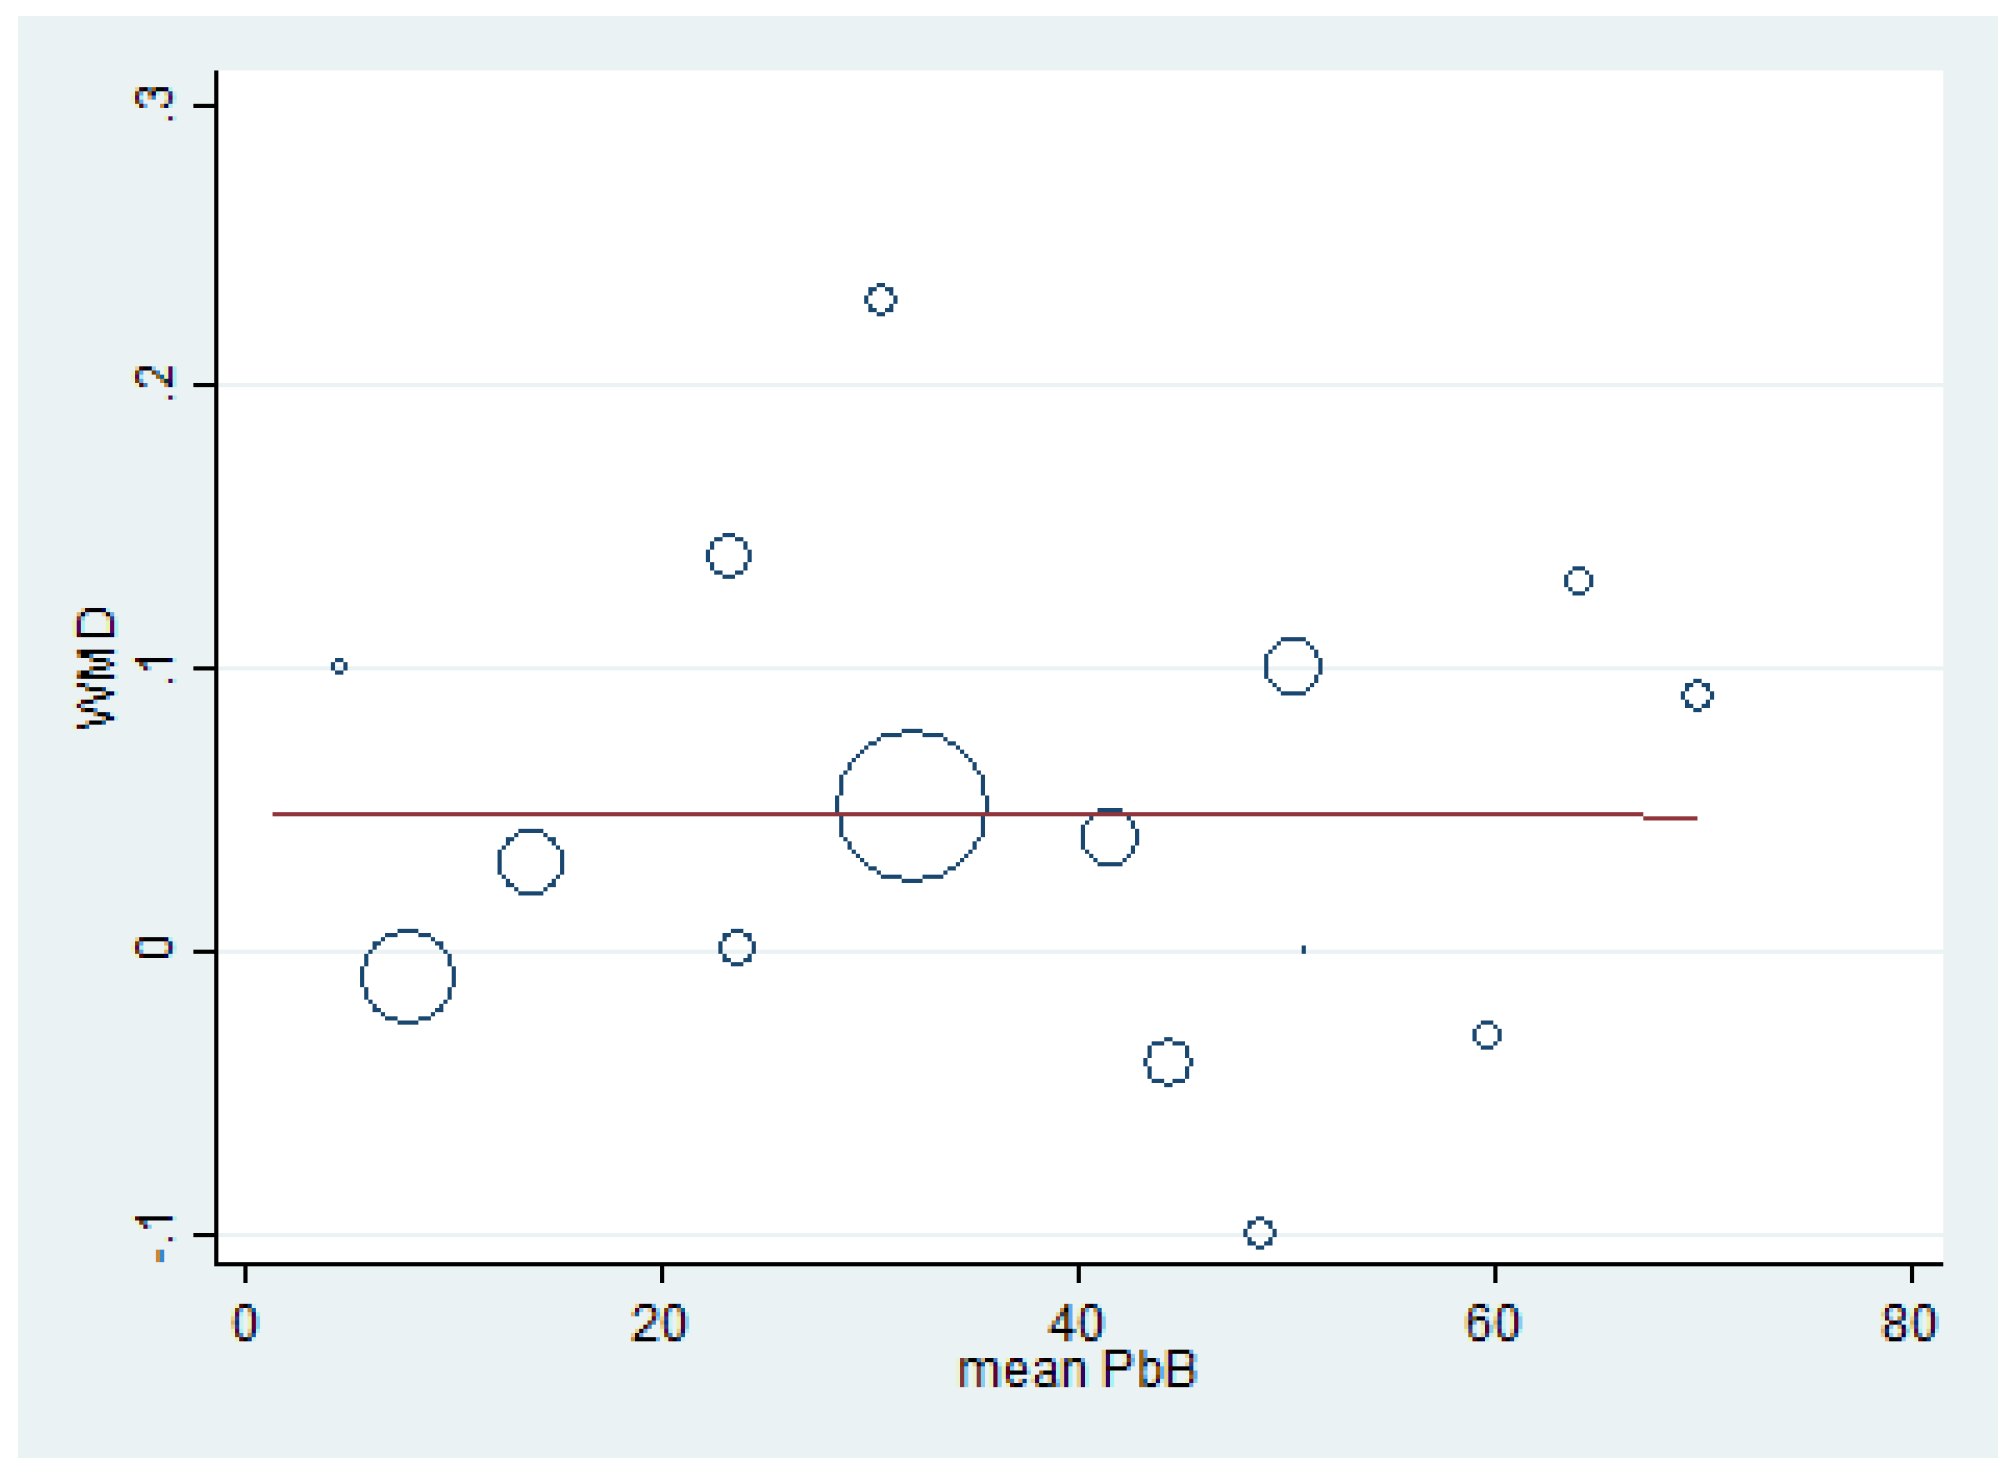
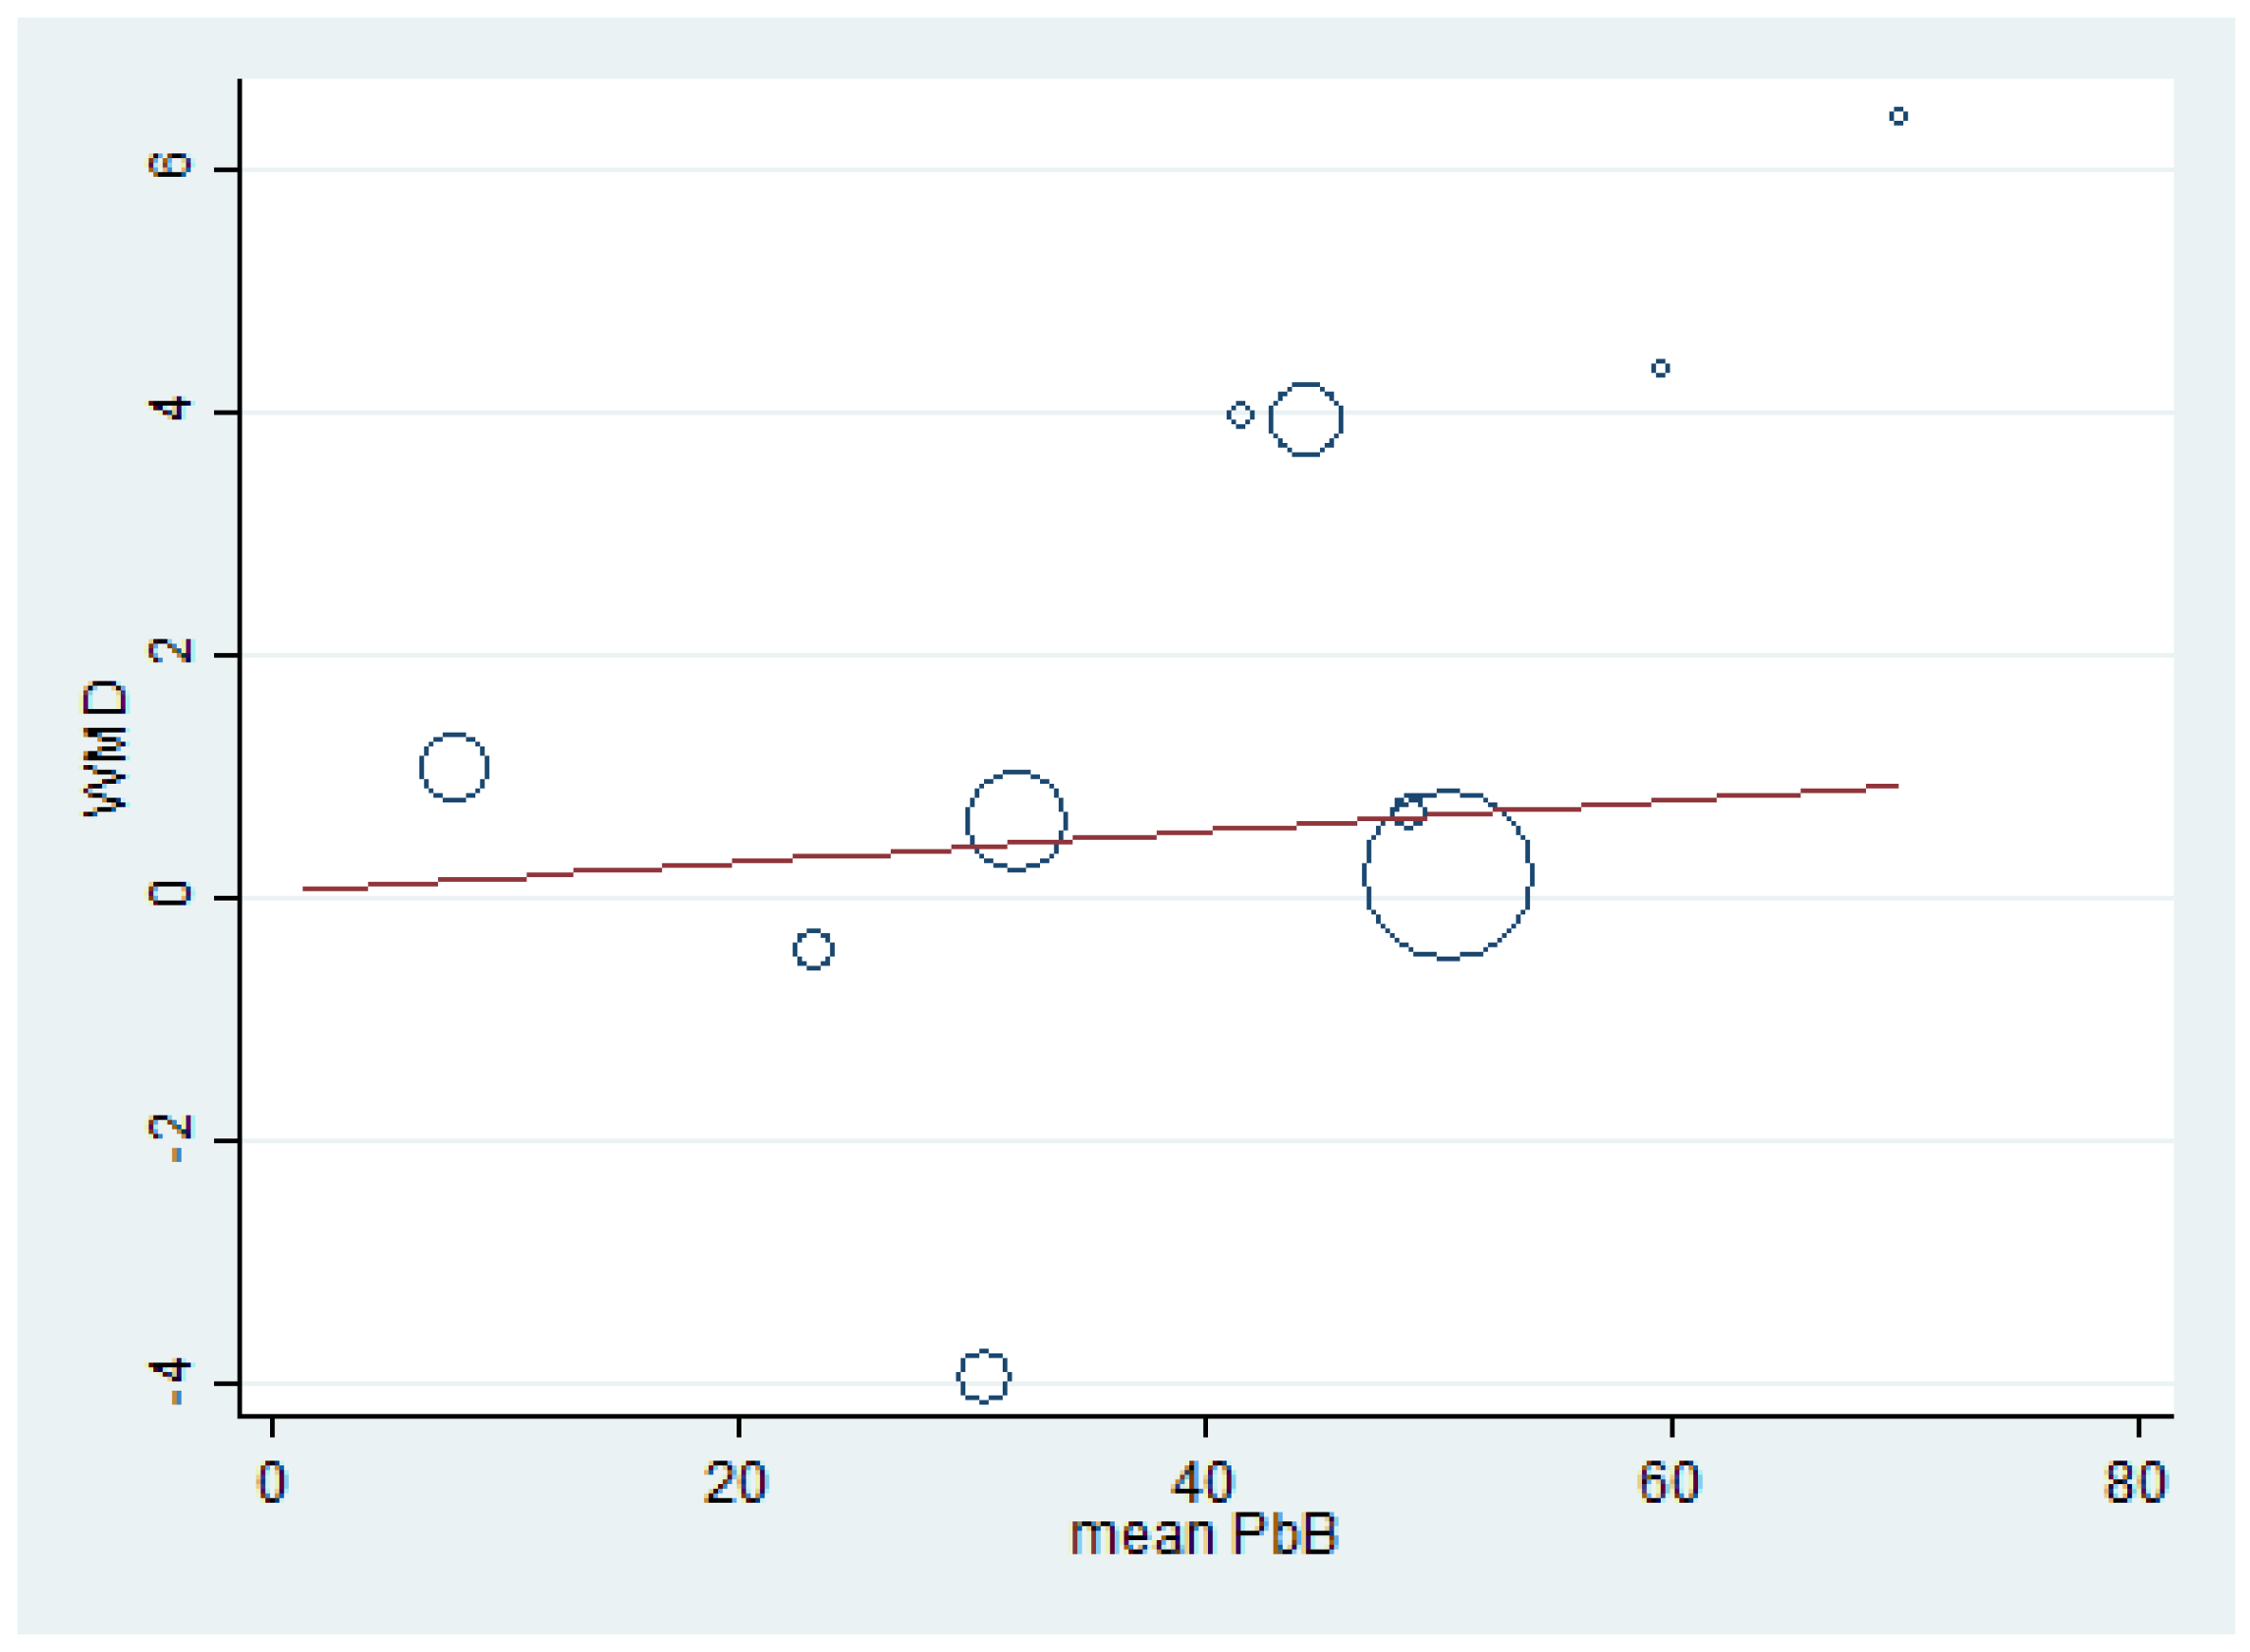
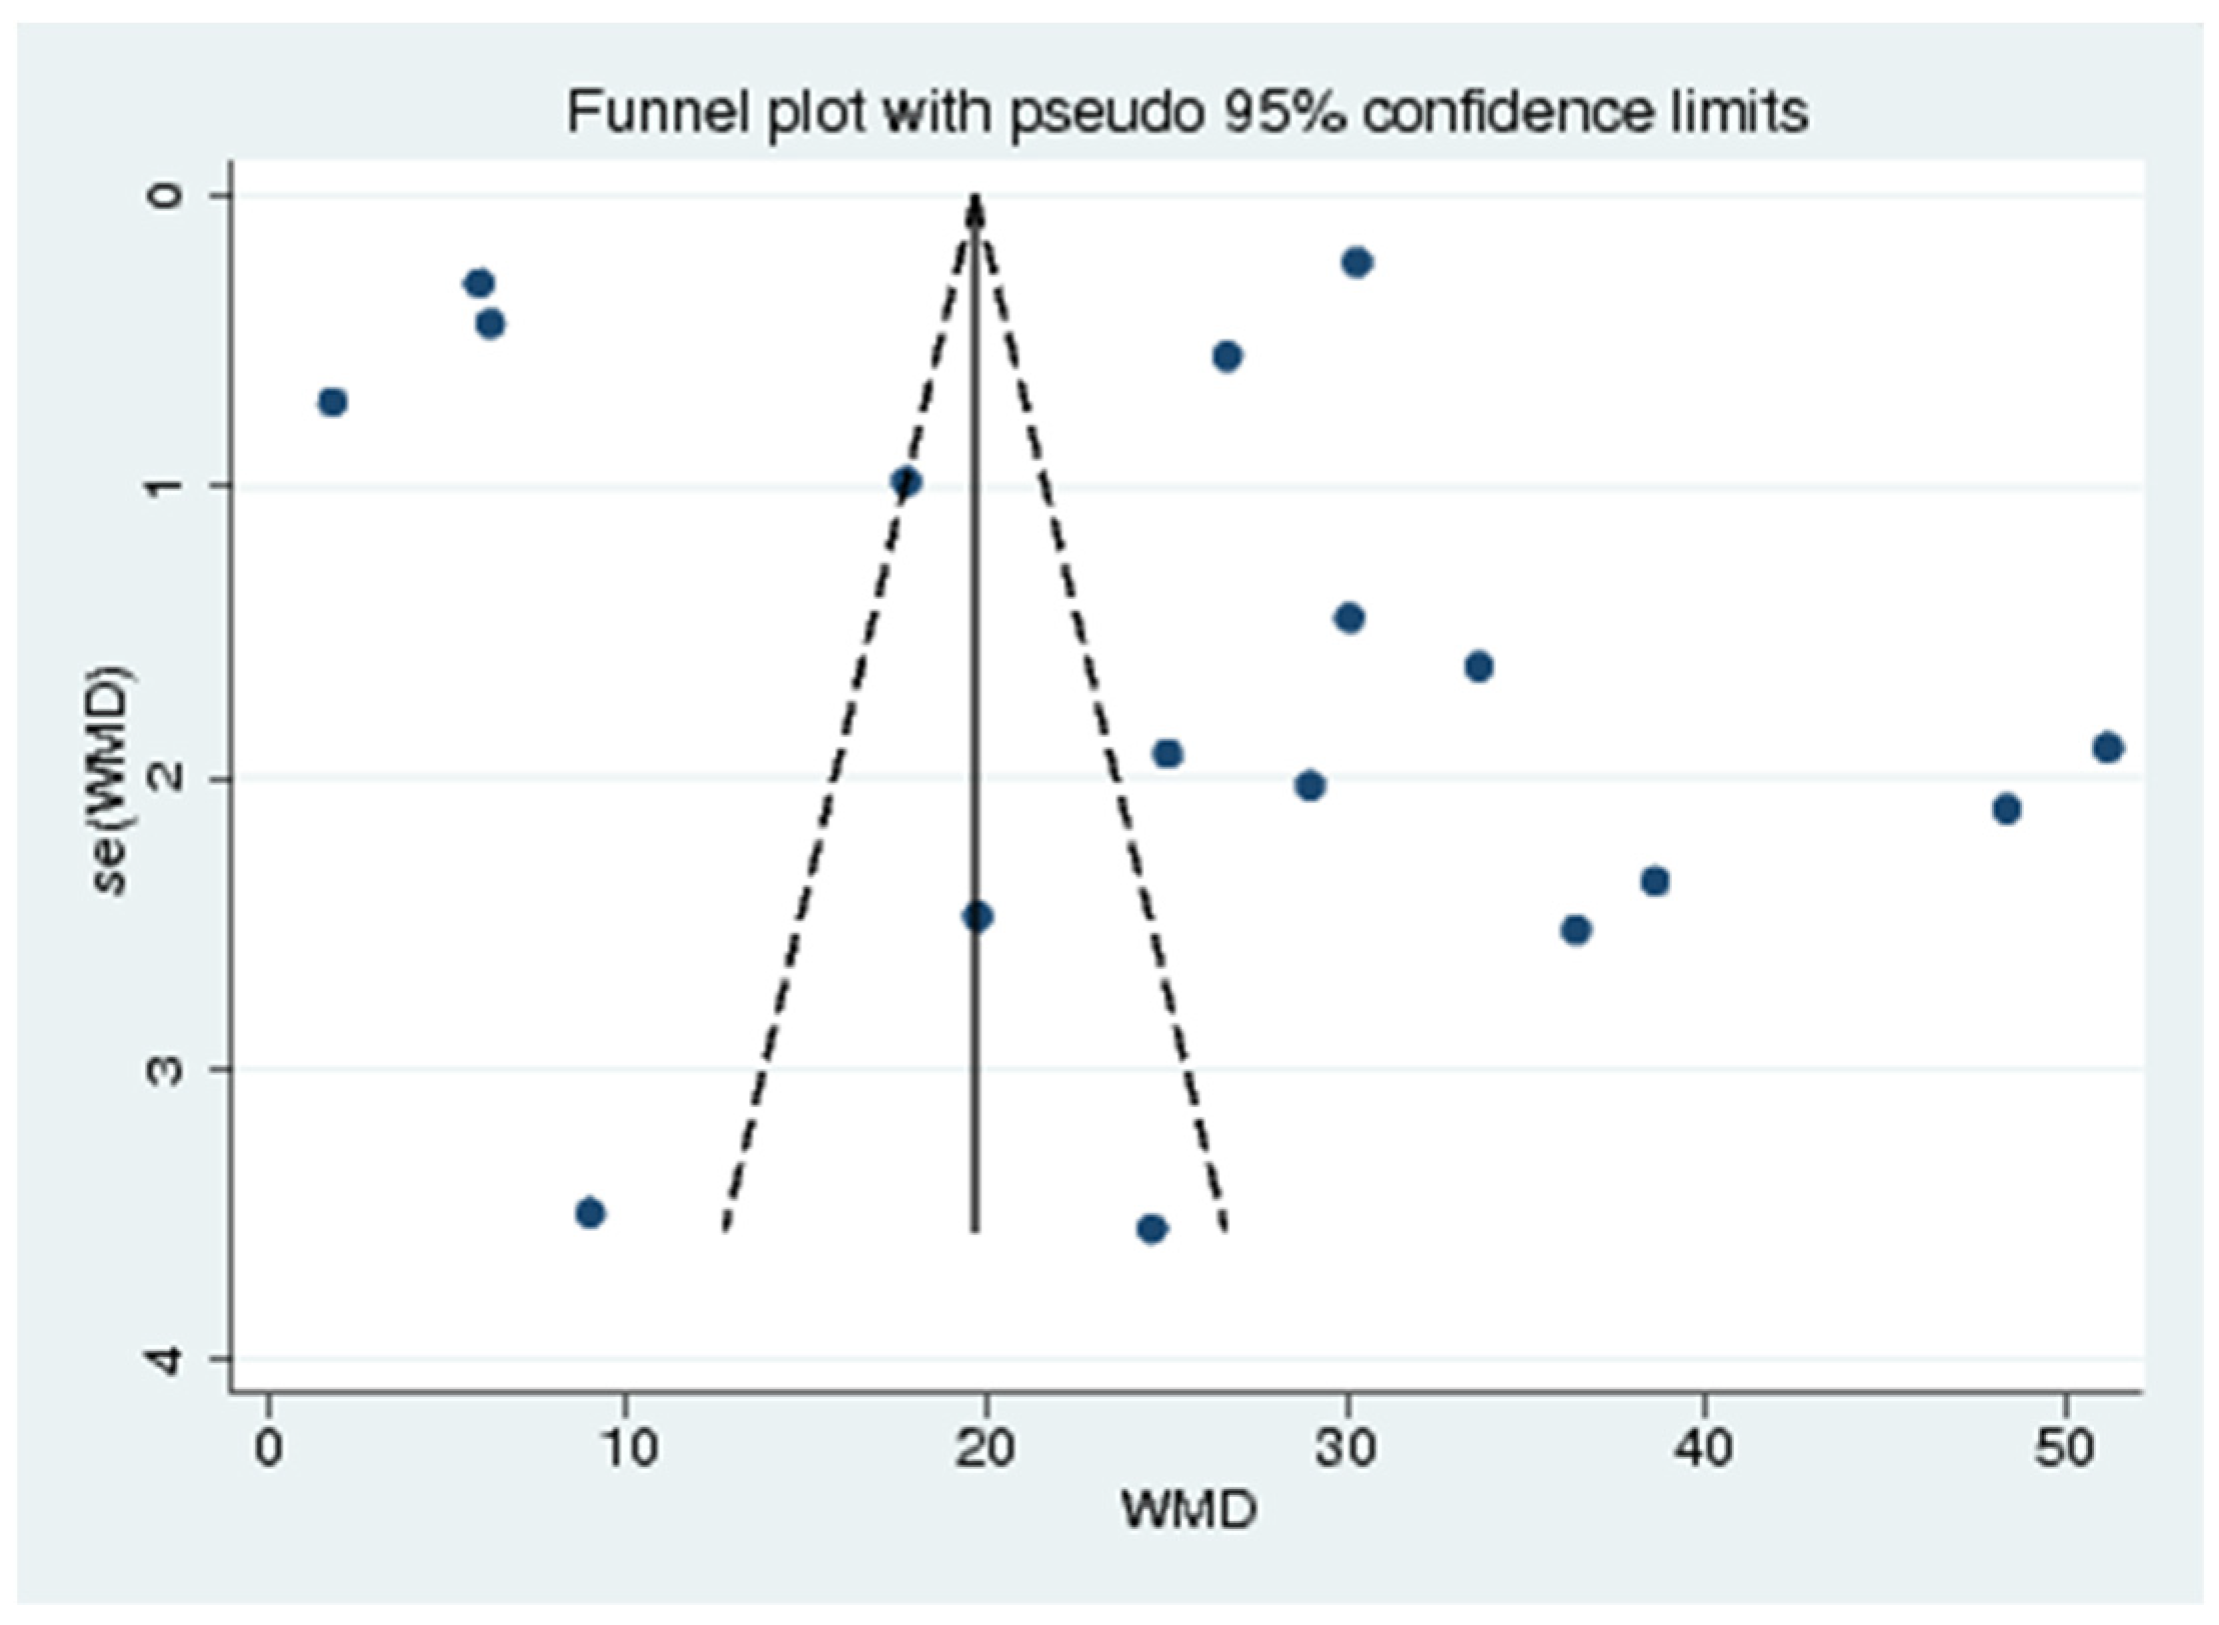
3.9. Publication Bias
4. Discussion
5. Limitations
6. Conclusions
Supplementary Materials
Author Contributions
Funding
Institutional Review Board Statement
Informed Consent Statement
Data Availability Statement
Acknowledgments
Conflicts of Interest
Abbreviation
| BLL | Blood lead level |
| BUN | Blood urea nitrogen |
| CI | Confidence Interval |
| CRCL | Creatinine clearance |
| eGFR | estimated Glomerular Filtration Rate |
| GF | Glomerular function |
| KNHANES | The Korea Nation Health and Nutrition Examination Survey |
| NS | Not specified |
| PbB | Blood lead |
| PVC | Polyvinyl chloride |
| Ref | Reference number |
| WMD | Weighted Mean Difference |
| mg/dL | milligrams per deciliter |
| μg/dL | micrograms per deciliter |
References
- Wani, A.L.; Ara, A.; Usmani, J.A. Lead toxicity: A review. Interdiscip. Toxicol. 2015, 8, 55–64. [Google Scholar] [CrossRef] [PubMed] [Green Version]
- Sun, Y.; Zhou, Z.; Zhu, G.; Lei, L.; Zhang, H.; Chang, X.; Jin, T. Estimation of Benchmark Dose for Bone Damage and Renal Dysfunction in a Chinese Male Population Occupationally Exposed to Lead. Ann. Occup. Hyg. 2008, 52, 527–533. [Google Scholar] [CrossRef] [Green Version]
- Harari, F.; Sallsten, G.; Christensson, A.; Petkovic, M.; Hedblad, B.; Forsgard, N.; Melander, O.; Nilsson, P.M.; Borné, Y.; Engström, G.; et al. Blood Lead Levels and Decreased Kidney Function in a Population-Based Cohort. Am. J. Kidney Dis. 2018, 72, 381–389. [Google Scholar] [CrossRef] [Green Version]
- Nakhaee, S.; Amirabadizadeh, A.; Brent, J.; Mehrpour, O. Impact of chronic lead exposure on liver and kidney function and haematologic parameters. Basic Clin. Pharmacol. Toxicol. 2019, 124, 621–628. [Google Scholar] [CrossRef] [PubMed]
- Tsoi, M.-F.; Cheung, C.-L.; Cheung, T.T.; Cheung, B.M.Y. Continual Decrease in Blood Lead Level in Americans: United States National Health Nutrition and Examination Survey 1999–2014. Am. J. Med. 2016, 129, 1213–1218. [Google Scholar] [CrossRef] [PubMed] [Green Version]
- Yimthiang, S.; Waeyang, D.; Kuraeiad, S. Screening for Elevated Blood Lead Levels and Related Risk Factors among Thai Children Residing in a Fishing Community. Toxics 2019, 7, 54. [Google Scholar] [CrossRef] [PubMed] [Green Version]
- Kshirsagar Mandakini, S.; Patil Jyotsna, A.; Patil Arun, J. Elevated blood lead level alters the liver and kidney function tests of spray painters. Pravara. Med. Rev. 2020, 12, 31–36. [Google Scholar]
- Vlasak, T.; Jordakieva, G.; Gnambs, T.; Augner, C.; Crevenna, R.; Winker, R.; Barth, A. Blood lead levels and cognitive functioning: A meta-analysis. Sci. Total Environ. 2019, 668, 678–684. [Google Scholar] [CrossRef] [PubMed]
- Landrigan, P.J. Current issues in the epidemiology and toxicology of occupational exposure to lead. Environ. Health Perspect. 1990, 89, 61–66. [Google Scholar] [CrossRef] [PubMed]
- Weaver, V.M.; Griswold, M.; Todd, A.C.; Jaar, B.G.; Ahn, K.-D.; Thompson, C.B.; Lee, B.-K. Longitudinal associations between lead dose and renal function in lead workers. Environ. Res. 2009, 109, 101–107. [Google Scholar] [CrossRef] [PubMed] [Green Version]
- Lai, L.-H.; Chou, S.-Y.; Wu, F.-Y.; Chen, J.J.-H.; Kuo, H.-W. Renal dysfunction and hyperuricemia with low blood lead levels and ethnicity in community-based study. Sci. Total Environ. 2008, 401, 39–43. [Google Scholar] [CrossRef] [PubMed]
- Pergande, M.; Jung, K.; Precht, S.; Fels, L.M.; Herbort, C.; Stolte, H. Changed excretion of urinary proteins and enzymes by chronic exposure to lead. Nephrol. Dial. Transplant. 1994, 9, 613–618. [Google Scholar] [CrossRef] [PubMed]
- Ehrlich, R.; Robins, T.G.; Jordaan, E.; Miller, S.; Mbuli, S.; Selby, P.B.; Wynchank, S.; Cantrell, A.C.; De Broe, M.; Dhaese, P.C.; et al. Lead absorption and renal dysfunction in a South African battery factory. Occup. Environ. Med. 1998, 55, 453–460. [Google Scholar] [CrossRef] [PubMed] [Green Version]
- Weaver, V.M.; Jaar, B.G.; Schwartz, B.S.; Todd, A.C.; Ahn, K.-D.; Lee, S.-S.; Wen, J.; Parsons, P.J.; Lee, B.-K. Associations among Lead Dose Biomarkers, Uric Acid, and Renal Function in Korean Lead Workers. Environ. Health Perspect. 2005, 113, 36–42. [Google Scholar] [CrossRef] [PubMed] [Green Version]
- Alasia, D.D.; Emem-Chioma, P.C.; Wokoma, F.S. Association of lead exposure, serum uric acid and parameters of renal function in Nigerian lead-exposed workers. Int. J. Occup. Environ. Med. 2010, 1, 182–190. [Google Scholar] [PubMed]
- de Pinto Almeida, A.R.; Martins Carvalho, F.; Galvão Spinola, A.; Rocha, H. Renal dysfunction in brazilian lead workers. Am. J. Nephrol. 1987, 7, 455–458. [Google Scholar] [CrossRef] [PubMed]
- Onuegbu, A.; Olisekodiaka, M.; Nwaba, E.; Adeyeye, A.; Akinola, F. Assessment of some renal indices in people occupationally exposed to lead. Toxicol. Ind. Health 2010, 27, 475–479. [Google Scholar] [CrossRef] [PubMed]
- Gounden, V.; Bhatt, H.; Jialal, I. Renal Function Tests. In StatPearls; EDN: Treasure Island, FL, USA, 2021. [Google Scholar]
- Wang, V.-S.; Lee, M.-T.; Chiou, J.-Y.; Guu, C.-F.; Wu, C.-C.; Wu, T.-N.; Lai, J.-S. Relationship between blood lead levels and renal function in lead battery workers. Int. Arch. Occup. Environ. Health 2002, 75, 569–575. [Google Scholar] [CrossRef] [PubMed]
- Roels, H.; Lauwerys, R.; Konings, J.; Buchet, J.-P.; Bernard, A.; Green, S.; Bradley, D.; Morgan, W.; Chettle, D. Renal function and hyperfiltration capacity in lead smelter workers with high bone lead. Occup. Environ. Med. 1994, 51, 505–512. [Google Scholar] [CrossRef] [PubMed] [Green Version]
- Azami, M.; Tardeh, Z.; Mansouri, A.; Soleymani, A.; Sayehmiri, K. Mean Blood Lead Level in Iranian Workers: A Systematic and Meta-Analysis. Iran. Red Crescent Med. J. 2018, 20. [Google Scholar] [CrossRef]
- Moher, D.; Liberati, A.; Tetzlaff, J.; Altman, D.G.; The PRISMA Group. Preferred reporting items for systematic reviews and meta-analyses: The PRISMA statement. PLoS Med. 2009, 6, e1000097. [Google Scholar] [CrossRef] [Green Version]
- International Prospective Register of Systematic Reviews. Available online: https://www.crd.york.ac.uk/prospero/ (accessed on 15 January 2021).
- The Newcastle-Ottawa Scale (NOS) for Assessing the Quality of Nonrandomised Studies in Meta-Analyses. Available online: http://www.ohri.ca/programs/clinical_epidemiology/oxford.asp (accessed on 20 January 2021).
- Lim, Y.C.; Chia, K.S.; Ong, H.Y.; Ng, V.; Chew, Y.L. Renal dysfunction in workers exposed to inorganic lead. Ann. Acad. Med. Singap. 2001, 30, 112–117. [Google Scholar]
- Hozo, S.P.; Djulbegovic, B.; Hozo, I. Estimating the mean and variance from the median, range, and the size of a sample. BMC Med Res. Methodol. 2005, 5, 13. [Google Scholar] [CrossRef] [PubMed] [Green Version]
- The Standard for Clinical Calculations & Quantitative Analysis in Medicine. Available online: http://www.scymed.com/ (accessed on 25 January 2021).
- Higgins, J.P.T.; Chandler, J.; Cumpston, M.; Li, T.; Page, M.J.; Welch, V.A. (Eds.) Cochrane Handbook for Systematic Reviews of Interventions version 6.2 (updated February 2021). In Cochrane; Wiley: Hoboken, NJ, USA, 2021. [Google Scholar]
- Buser, M.C.; Ingber, S.Z.; Raines, N.; Fowler, D.A.; Scinicariello, F. Urinary and blood cadmium and lead and kidney function: NHANES 2007–2012. Int. J. Hyg. Environ. Health 2016, 219, 261–267. [Google Scholar] [CrossRef] [PubMed] [Green Version]
- Chen, X.; Zhu, G.; Wang, Z.; Zhou, H.; He, P.; Liu, Y.; Jin, T. The association between lead and cadmium co-exposure and renal dysfunction. Ecotoxicol. Environ. Saf. 2019, 173, 429–435. [Google Scholar] [CrossRef] [PubMed]
- Chung, S.; Chung, J.H.; Kim, S.J.; Koh, E.S.; Yoon, H.E.; Park, C.W.; Chang, Y.S.; Shin, S.J. Erratum to: Blood lead and cadmium levels and renal function in Korean adults. Clin. Exp. Nephrol. 2014, 18, 735–736. [Google Scholar] [CrossRef] [Green Version]
- Dioka, C.E.; Orisakwe, O.E.; Adeniyi, F.A.; Meludu, S.C. Liver and Renal Function Tests in Artisans Occupationally Exposed to Lead in Mechanic Village in Nnewi, Nigeria. Int. J. Environ. Res. Public Health 2004, 1, 21–25. [Google Scholar] [CrossRef] [PubMed] [Green Version]
- Gennart, J.-P.; Bernard, A.; Lauwerys, R. Assessment of thyroid, testes, kidney and autonomic nervous system function in lead-exposed workers. Int. Arch. Occup. Environ. Health 1992, 64, 49–57. [Google Scholar] [CrossRef]
- Gerhardsson, L.; Börjesson, J.; Grubb, A.; Hultberg, B.; Mattsson, S.; Schütz, A.; Skerfving, S. In vivo XRF as a means to evaluate the risk of kidney effects in lead and cadmium exposed smelter workers. Appl. Radiat. Isot. 1998, 49, 711–712. [Google Scholar] [CrossRef]
- Gerhardsson, L.; Chettle, D.R.; Englyst, V.; Nordberg, G.F.; Nyhlin, H.; Scott, M.C.; Todd, A.C.; Vesterberg, O. Kidney effects in long term exposed lead smelter workers. Occup. Environ. Med. 1992, 49, 186–192. [Google Scholar] [CrossRef] [PubMed]
- Goswami, K.; Bhattacharya, B. Renal function in lead exposed urban population. Poll. Res. 2001, 20, 395–399. [Google Scholar]
- Hernández-Serrato, M.I.; Fortoul, T.I.; Rojas-Martínez, R.; Mendoza-Alvarado, L.R.; Canales-Treviño, L.; Bochichio-Riccardelli, T.; Ávila-Costa, M.R.; Olaiz-Fernández, G. Lead blood concentrations and renal function evaluation: Study in an exposed Mexican population. Environ. Res. 2006, 100, 227–231. [Google Scholar] [CrossRef] [PubMed]
- Jain, R.B. Lead and kidney: Concentrations, variabilities, and associations across the various stages of glomerular function. J. Trace Elements Med. Biol. 2019, 54, 36–43. [Google Scholar] [CrossRef] [PubMed]
- Jung, K.-Y.; Lee, S.-J.; Kim, J.-Y.; Hong, Y.-S.; Kim, S.-R.; Kim, D.; Song, J.-B.; Kim, N.-I. Renal Dysfunction Indicators in Lead Exposed Workers. J. Occup. Health 1998, 40, 103–109. [Google Scholar] [CrossRef] [Green Version]
- Kim, R.; Rotnitsky, A.; Sparrow, D.; Weiss, S.; Wager, C.; Hu, H. A longitudinal study of low-level lead exposure and impairment of renal function. The Normative Aging Study. JAMA 1996, 275, 1177–1181. [Google Scholar] [CrossRef] [PubMed]
- Kshirsagar, M.S.; Patil, A.J.; Patil, J. Impact of Occupational Lead Exposure on Liver and Kidney Function Tests on Silver Jewellery Workers. J. Clin. Diagn. Res. 2019, 13. [Google Scholar] [CrossRef]
- Lin, T.; Tai-Yi, J. Benchmark dose approach for renal dysfunction in workers exposed to lead. Environ. Toxicol. 2007, 22, 229–233. [Google Scholar] [CrossRef]
- Jialun, F.; Liu, X.; Deng, Q.; Duan, Y.; Dai, H.; Li, Y.; Xiaohui, L.; Ning, X.; Fan, J.; Zhou, L.; et al. Continuous Lead Exposure Increases Blood Pressure but Does Not Alter Kidney Function in Adults 20-44 Years of Age in a Lead-Polluted Region of China. Kidney Blood Press. Res. 2015, 40, 207–214. [Google Scholar] [CrossRef]
- Mujaj, B.; Yang, W.-Y.; Zhang, Z.-Y.; Wei, F.-F.; Thijs, L.; Verhamme, P.; Staessen, J. Renal function in relation to low-level environmental lead exposure. Nephrol. Dial. Transplant. 2018, 34, 941–946. [Google Scholar] [CrossRef]
- Muntner, P.; He, J.; Vupputuri, S.; Coresh, J.; Batuman, V. Blood lead and chronic kidney disease in the general United States population: Results from NHANES III. Kidney Int. 2003, 63, 1044–1050. [Google Scholar] [CrossRef] [Green Version]
- Navas-Acien, A.; Tellez-Plaza, M.; Guallar, E.; Muntner, P.; Silbergeld, E.; Jaar, B.; Weaver, V. Blood Cadmium and Lead and Chronic Kidney Disease in US Adults: A Joint Analysis. Am. J. Epidemiol. 2009, 170, 1156–1164. [Google Scholar] [CrossRef] [PubMed] [Green Version]
- Oktem, F.; Arslan, M.K.; Dündar, B.; Delibas, N.; Gültepe, M.; Ilhan, I.E. Renal effects and erythrocyte oxidative stress in long-term low-level lead-exposed adolescent workers in auto repair workshops. Arch. Toxicol. 2004, 78, 681–687. [Google Scholar] [CrossRef] [PubMed]
- Omae, K.; Sakurai, H.; Higashi, T.; Muto, T.; Ichikawa, M.; Sasaki, N. No adverse effects of lead on renal function in lead-exposed workers. Ind. Health 1990, 28, 77–83. [Google Scholar] [CrossRef] [PubMed] [Green Version]
- Patil, A.J.; Bhagwat, V.R.; Patil, J.; Dongre, N.N.; Ambekar, J.G.; Das, K.K. Occupational lead exposure in battery manufacturing workers, silver jewelry workers, and spray painters in western Maharashtra (India): Effect on liver and kidney function. J. Basic Clin. Physiol. Pharmacol. 2007, 18, 87–100. [Google Scholar] [CrossRef] [PubMed]
- Payton, M.; Hu, H.; Sparrow, D.; Weiss, S.T. Low-level Lead Exposure and Renal Function in the Normative Aging Study. Am. J. Epidemiol. 1994, 140, 821–829. [Google Scholar] [CrossRef] [PubMed]
- Reilly, R.; Spalding, S.; Walsh, B.; Wainer, J.; Pickens, S.; Royster, M.; Villanacci, J.; Little, B.B. Chronic Environmental and Occupational Lead Exposure and Kidney Function among African Americans: Dallas Lead Project II. Int. J. Environ. Res. Public Health 2018, 15, 2875. [Google Scholar] [CrossRef] [PubMed] [Green Version]
- Satarug, S.; Nishijo, M.; Ujjin, P.; Vanavanitkun, Y.; Baker, J.R.; Moore, M.R. Evidence for Concurrent Effects of Exposure to Environmental Cadmium and Lead on Hepatic CYP2A6 Phenotype and Renal Function Biomarkers in Nonsmokers. Environ. Health Perspect. 2004, 112, 1512–1518. [Google Scholar] [CrossRef] [PubMed] [Green Version]
- Staessen, J.; Yeoman, W.B.; Fletcher, A.; Markowe, H.L.; Marmot, M.G.; Rose, G.; Semmence, A.; Shipley, M.J.; Bulpitt, C.J. Blood lead concentration, renal function, and blood pressure in London civil servants. Occup. Environ. Med. 1990, 47, 442–447. [Google Scholar] [CrossRef] [PubMed] [Green Version]
- Staessen, J.A.; Lauwerys, R.R.; Buchet, J.-P.; Bulpitt, C.J.; Rondia, D.; Vanrenterghem, Y.; Amery, A. Impairment of Renal Function with Increasing Blood Lead Concentrations in the General Population. N. Engl. J. Med. 1992, 327, 151–156. [Google Scholar] [CrossRef]
- Tsaih, S.-W.; Korrick, S.; Schwartz, J.; Amarasiriwardena, C.; Aro, A.; Sparrow, D.; Hu, H. Lead, Diabetes, Hypertension, and Renal Function: The Normative Aging Study. Environ. Health Perspect. 2004, 112, 1178–1182. [Google Scholar] [CrossRef]
- Verschoor, M.; Wibowo, A.; Herber, R.; Van Hemmen, J.; Zielhuis, R. Influence of occupational low-level lead exposure on renal parameters. Am. J. Ind. Med. 1987, 12, 341–351. [Google Scholar] [CrossRef]
- Wang, X.; Liang, H.; Wang, Y.; Cai, C.; Li, J.; Li, X.; Wang, M.; Chen, M.; Xu, X.; Tan, H. Risk factors of renal dysfunction and their interaction in level-low lead exposure paint workers. BMC Public Health 2018, 18, 526. [Google Scholar] [CrossRef] [PubMed] [Green Version]
- Weaver, V.M.; Kim, N.-S.; Jaar, B.G.; Schwartz, B.S.; Parsons, P.J.; Steuerwald, A.J.; Todd, A.C.; Simon, D.; Lee, B.-K. Associations of low-level urine cadmium with kidney function in lead workers. Occup. Environ. Med. 2010, 68, 250–256. [Google Scholar] [CrossRef] [Green Version]
- Weaver, V.M.; Lee, B.-K.; Ahn, K.-D.; Lee, G.-S.; Todd, A.C.; Stewart, W.F.; Wen, J.; Simon, D.J.; Parsons, P.J.; Schwartz, B.S. Associations of lead biomarkers with renal function in Korean lead workers. Occup. Environ. Med. 2003, 60, 551–562. [Google Scholar] [CrossRef] [PubMed]
- Weaver, V.M.; Lee, B.-K.; Todd, A.C.; Jaar, B.G.; Ahn, K.-D.; Wen, J.; Shi, W.; Parsons, P.J.; Schwartz, B.S. Associations of Patella Lead and Other Lead Biomarkers With Renal Function in Lead Workers. J. Occup. Environ. Med. 2005, 47, 235–243. [Google Scholar] [CrossRef] [PubMed] [Green Version]
- Alasia, D.; Emem-Chioma, P.; Wokoma, S. Occupational and Environmental Lead Exposure in Port Harcourt, Nigeria: Analysis of its association with renal function indices. Niger. J. Med. 2010, 19, 407–414. [Google Scholar] [CrossRef] [PubMed]
- Hsiao, C.-Y.; Wu, H.-D.I.; Lai, J.-S.; Kuo, H.-W. A longitudinal study of the effects of long-term exposure to lead among lead battery factory workers in Taiwan (1989–1999). Sci. Total Environ. 2001, 279, 151–158. [Google Scholar] [CrossRef]
- Falq, G.; Zeghnoun, A.; Pascal, M.; Vernay, M.; Le Strat, Y.; Garnier, R.; Olichon, D.; Bretin, P.; Castetbon, K.; Fréry, N. Blood lead levels in the adult population living in France the French Nutrition and Health Survey (ENNS 2006–2007). Environ. Int. 2011, 37, 565–571. [Google Scholar] [CrossRef] [PubMed]
- Bjermo, H.; Sand, S.; Nälsén, C.; Lundh, T.; Barbieri, H.E.; Pearson, M.; Lindroos, A.K.; Jönsson, B.A.; Barregård, L.; Darnerud, P.O. Lead, mercury, and cadmium in blood and their relation to diet among Swedish adults. Food Chem. Toxicol. 2013, 57, 161–169. [Google Scholar] [CrossRef] [PubMed]
- Endo, G.; Horiguchi, S.; Kiyota, I. Urinary N-acetyl-beta-d-glucosaminidase activity in lead-exposed workers. J. Appl. Toxicol. 1990, 10, 235–238. [Google Scholar] [CrossRef] [PubMed]
- Campbell, B.C.; Beattie, A.D.; Moore, M.R.; Goldberg, A.; Reid, A.G. Renal insufficiency associated with excessive lead exposure. BMJ 1977, 1, 482–485. [Google Scholar] [CrossRef] [PubMed] [Green Version]
- Maiuolo, J.; Oppedisano, F.; Gratteri, S.; Muscoli, C.; Mollace, V. Regulation of uric acid metabolism and excretion. Int. J. Cardiol. 2016, 213, 8–14. [Google Scholar] [CrossRef] [PubMed] [Green Version]
- Loghman-Adham, M. Renal effects of environmental and occupational lead exposure. Environ. Health Perspect. 1997, 105, 928–938. [Google Scholar] [CrossRef] [PubMed]
- Lead. Available online: https://www.osha.gov/lead/health-effects (accessed on 1 February 2021).


| No. (Ref) | Author, Year | Study Area (Years of the Survey), Exposed Level | Study Design | Participants (Exposure and Control Groups) | Lead Exposure Group | Non-Exposed Group | ||||||||||
|---|---|---|---|---|---|---|---|---|---|---|---|---|---|---|---|---|
| Mean/ Median Age, Male (%) | BLL Levels (μg/dL), Duration of Exposure (Years) | BUN (mg/dL) | Creatinine (mg/dL), Creatinine Clearance (mL/min/1.72 m2) | Uric Acid (mg/dL) | Renal Insufficiency (n, %) | Age, Male (%) | BLL Levels (μg/dL), Duration of Exposure (Years) | BUN (mg/dL) | Creatinine (mg/dL), Creatinine Clearance (mL/min/1.72 m2) | Uric Acid (mg/dL) | Renal Insufficiency (n, %) | |||||
| 1. [15] | Alasia et al., 2010 | Nigeria | Cross-sectional study | Study group (190); welding and metal (42), paint and pigment (38), radiator repairer (37), battery workers (37), petrol (36) Control group (80); hospital workers (80) | NS, 151/190 (79.5%) | 50.37 ± 24.58, 11.9 ± 9.3 | 8.6 ± 2.3 | 1.0 ± 0.2, 98.9 ± 21.3 | 4.6 ± 1.2 | 58/80 (73) | 41.40 ± 26.9, 8.0 ± 7.3 | 7.6 ± 2.4 | 0.9 ± 0.2, 108.2 ± 25.2 | 3.9 ± 1.1 | ||
| 2. [29] | Buser et al., 2016 | USA (2007–2008, 2009–2010, and 2011–2012) | Cross-sectional study | NHANES (4875) | NS, 2481/4875 (50.9%) | 1.58 (1.49–1.67) or 1.58 ± 0.21 | 0.85 ± 0.00 (4785), 91.95 ± 0.58 | |||||||||
| 3. [30] | Chen et al., 2019 | China | Cross-sectional study | Polluted area (174), non-exposed area (157) | Mean 58.7 (26–80), 52/164 (31.7%) | 13.1 (8.36–20.6) or 13.8 ± 3.53 | 0.79 (0.7–0.95) or 0.81 ± 0.22, 94.7 (79.0–107.9) or 94.1 ± 8.34 | 56 (25–80), 59/157 | 7.44 (5.44–11.3) or 7.91 ± 1.71 | 0.77 (0.69–0.88) or 0.78 ± 0.21, 102.2 (91.2–112.7) or 102.1 ± 6.21 | ||||||
| 4. [31] | Chung et al., 2013 | The Republic of Korea (2007–2009) | Cross-sectional study | The Korea National Health and Nutrition Examination Survey (KNHANES) nationally representative survey (2005) | Mean 46 (20–87), male 49.8% | 2.5 eGFR < 60 (83) 2.92 ± 0.13, eGFR ≥ 60 (1922) 2.53 ± 0.03 | GFR: 90.0 ± 0.7 | |||||||||
| 5. [16] | de Pinto Almeida et al., 1987 | Brazil | Cross-sectional study | Lead workers (52), reference (44) | 44.9 ±9.54, NS | 64.1 ±16.3 | 1.23 ± 0.34 | 6.6 ± 1.7 | 17/52 | 43.4 ± 8.9 | 25.5 ± 4.4 | 1.10 ± 0.20 | 4.7 ± 1.2 | 1/44 | ||
| 6. [32] | Dioka et al., 2004 | Nigeria | Cross-sectional study | Exposed subjects (25); auto mechanics (18), battery chargers (5), welders (2) unexposed subjects (25); graduate students | 39 ± 8.47, male 50/50 (100%) | 59.6 ± 15.9 | 58.8 ± 13.6 | 1.12 ± 0.2 | 4.04 ± 1.39 | Age matched | 35 ± 7.9 | 55.4 ± 6.79 | 1.15 ± 0.2 | 2.58 ± 1.19 | ||
| 7. [13] | Ehrlich et al., 1998 | South Africa | Cross-sectional study | Battery making workforce (n = 382) | Mean 41.2 (8.3), NS | 53.5 ± 12.7, 11.6 ± 6.8 | 5.6 ± 1.5 | 1.13 ± 0.18 | BLL 23–50 µg/dL (160), 51–60 (115), 61–110 (101) | |||||||
| 8. [33] | Gennart et al., 1992 | Belgium | Cross-sectional study | Exposed workers (98); lead acid battery factory control workers (85); the finishing department of the same factory, the maintenance department, the warehouse of a hospital and a chemical factory | 37.7 ± 8.3, male 183/183 (100%) | 51 ± 8, 10.6 ± 8.1 | 1.07 ± 1.16, 107 ± 1.22 | 38.8 ± 8.7 | 20.9 ± 11.1 | 1.07 ± 1.15, 110 ± 1.23 | ||||||
| 9. [34] | Gerhardsson et al., 1998 | Sweden | Cross-sectional study | Smelter workers (22); active workers (11), retired workers (11) referents (11); nearby machine-shop | NS, 22/22 (100%) | 25.3 ± 11.4 Active workers 31.1 (7.67–49.7) or 29.8 ± 12.9, Retired workers 19.3 (11.2–33.2) or 20.7 ± 7.67 | 4.14 (2.07–7.05) or 4.35 ± 1.45 | |||||||||
| 10. [35] | Gerhardsson et al., 1992 | Sweden | Cross-sectional study | Smelter workers (100); active workers (70), retired workers (30) referents (41); active truck assembly workers (31), retired truck assembly workers (10) | Active workers 37.4 ± 12–6), NS Retired workers 67.9 ± 47, NS | 23.7 ± 13.5 Active workers 31.91 (4.97–47.45) or 29.1 ± 12.3, Retired workers 9.95 (3.32–20.93) or 11 ± 5.1 Duration of job: 19.8 ± 12.2 Active workers 14.3 ± 9.7, Retired workers (32.6 ± 6.3) | 1.02 ± 0.26 Active workers 1.02 (0.75–1.32) or 1.03 ± 0.26, Retired workers 1.05 (0.71–1.23) or 1.01 ± 0.25 CRCL 102.4 ± 43.2; Active workers 105 (26–180) or 104 ± 44.5, Retired workers 87 (40–180) or 98.5 ± 40.4 | 5.54 ± 3.03 Active workers 4.14 (1.66 -12.4) or 5.59 ± 3.12, Retired workers 3.52 (2.28–12.2) or 5.38 ± 2.88 | 1.02 ± 0.22 Active workers 1.0 (0.84–1.15) or 1 ± 0.22, Retired workers 1.04 (0.89–1.32) or 1.07 ± 0.24 CRCL: Active workers 105 (26–180) µmol/dL, Retired workers 87 (40–180) | |||||||
| 11. [36] | Goswami et al., 2001 | India | Cross-sectional study | 372 Battery (63%), pigments (12.8%), rolled/extruded (7.7%), cable sheeting (4.5%), gas add (2.2%), others (9.9%) | 36.2 ± 7.8, 372/372 (100%) | 21.2 ± 13.9 Group A (185): 12.6 ± 3.9, Group B (63): 17.9 ± 2.1, Group C (99): 29.8 ± 9.6, Group D (25): 58.7 ± 11.3 | Group A: 13 ± 8, Group B: 26 ± 7, Group C: 35 ± 13, Group D: 51 ± 12 | 1.1 ± 0.89 Group A: 0.9 ± 0.6, Group B: 1.2 ± 0.9, Group C: 1.3 ± 1.1, Group D: 1.5 ± 1.3 eGFR Group A: 141 ± 16, Group B: 86 ± 22, Group C: 55 ± 24, Group D: 33 ± 28 | 25 with advanced renal diseases | |||||||
| 12. [3] | Harar et al., 2018 | Sweden (2007–2012) | Cohort study | 4341 individuals enrolled and 2567 individuals subsequently followed up | Based line 57 ± 5.9, 1729/ 4341 (39.8%) | 2.5 (0.15–25.8) or 7.74 ± 7.41 | eGFR: based line (4272); 76 ± 14, followed up (2735); 70 ± 15 | 185 chronic kidney diseases | ||||||||
| 13. [37] | Hernandez-Serrato et al., 2006 | Mexico | Cross-sectional study | Exposed group (413): glazed pottery used, exposure occupation | 37.27 ± 16.3, 156/413 (37.8%) | 43.57 ± 14.5 | 33.17 ± 11.7 | 0.97 ± 0.23 | 6.47 ± 1.90 | BLL ≥ 40 mg/dL (8/244) <40 mg/dL (4/169) | ||||||
| 14. [38] | Jain RB, 2019 | USA (2003–2014) | Retrospective study | The data from National Health and Nutritional Examination Survey (NHANES): 9822 GF-1: 5710 GF-2: 3263 GF-3A: 563 GF-3B/4: 286 | ≥ 20, 5044/ 9822 (51.4%) | 1.24 ± 0.32 Glomerular function (GF) GF-1: 1.05 (1.02–1.09) or 1.05 ± 0.21, GF-2: 1.42 (1.37–1.47) or 1.42 ± 0.2, GF-3A: 1.74 (1.63–1.87) or 1.75 ± 0.22, GF-3B/4: 1.87 (1.70–2.05) or 1.87 ± 0.23 | ||||||||||
| 15. [39] | Jung et al., 1998 | Republic of Korea | Cross-sectional study | Lead exposed workers (75): secondary lead smelter industry (27), plastic stabilizer industry (18), radiator manufacturing industry (30) control group (64): male office workers | 41.5 ± 7.67, 75/75 (100%) Highly exposed (21): 43.6 ± 8.3, Moderately exposed (20): 42.3 ± 8.6, Slightly exposed (34): 39.7 ± 6.4 | 44.3 ± 21.8 Highly exposed: 74.6 ± 7.8, moderately exposed: 46.5 ± 5.9, slightly exposed: 24.3 ± 2.7 Duration of employed: 8.27 ± 4.29 Highly exposed: 8.5 ± 3.8, moderately exposed: 8.3 ± 6.2, slightly exposed: 8.1 ± 3.2 | 15.8 ± 4.54 Highly exposed: 18 ± 5.5, moderately exposed: 15.6 ± 3.9, slightly exposed: 14.6 ± 3.8 | 0.86 ± 0.19 Highly exposed: 0.9 ± 0.2, moderately exposed: 0.8 ± 0.1, slightly exposed: 0.8 ± 0.2 | 5.41 ± 1.43 Highly exposed: 6 ± 1.5, moderately exposed: 5.1 ± 1.1, slightly exposed: 5.2 ± 1.5 | Highly exposed (2) | 44.2 ± 8.6 (64) | 7.9 ± 1.4, duration of employed: 8.1 ± 2.4 | 13 ± 4 | 0.9 ± 0.2 | 5.6 ± 1.5 | 1 |
| 16. [40] | Kim et al., 1996 | USA (1979–1992) | Retrospective study | 459 men randomly selected from the Normative Aging Study | 56.9 ± 8.3, 459/459 (100%) | 9.9 ± 6.1 | 1.22 (0.9–1.8) or 1.29 ± 0.33 | |||||||||
| 17. [7] | Kshirsagar et al., 2020 | India | Cross-sectional study | Spray painters (42), normal healthy subjects (50) | Range 20–50, NS | 30.5 ± 12.2 | 20.5 ± 4.78 | 1.21 ± 0.26 | 6.6 ± 2 | 20–50 | 5.46 ± 2.58 | 20.5 ± 4.78 | 0.98 ± 0.17 | 5.41 ± 1.03 | ||
| 18. [41] | Kshirsagar et al., 2019 | India (2018) | Cross-sectional study | Silver jewelry workers (42) control group (50) | Range 20–60, NS | 23.23 ± 5.91 | 22.9 ± 5.93 | 1.12 ± 0.17 | 6.39 ± 1.18 | 20–60 | 5.46 ± 2.58 | 20.5 ± 4.78 | 0.98 ± 0.17 | 5.41 ± 1.03 | ||
| 19. [11] | Lai et al., 2008 | Taiwan | Cross-sectional study | 2565 residents: aboriginals (1318), nonaboriginals (1247) | > 40, NS | 5.3 ± 1.2 Male (1008): 5.3 ± 1.2, 5.6 ± 1.4), female (1557): 5.3 ± 1.1, 5.4 ± 1.2 | Male (15.4 ± 4.3, 15.5 ± 4.6), female (14.9 ± 4.5, 15.7 ± 5.6) | 1.1 ± 0.28 Male (1.2 ± 0.3, 1.1 ± 0.4), female (1.0 ± 0.2, 1.0 ± 0.5) | Male (6.9 ± 1.8, 8.6 ± 2.1), female (5.8 ± 1.8, 7.0 ± 1.9) | Aboriginals (153), Nonaboriginals (87) | ||||||
| 20. [25] | Lim et al., 2001 | Singapore | Cross-sectional study | Workers from a factory producing polyvinyl chloride (PVC) stabilizers using lead ingots as raw materials (55) | 35.73 ± 9.59, 55/55 (100%) | 24.1 ± 9.6 <20 μg/dL (18), 20–30 μg/dL (23), > 30 μg/dL (14) | CRCL: (120.9 ± 14.9) | 2 participants with CRCL < 90 | ||||||||
| 21. [42] | Lin et al., 2007 | China | Cross-sectional study | Exposed group (135): one storage battery plant control group (143): mechanics | 28.7 ± 6.6, NS | 42.2 ± 1.86, 5.8 ± 4.4 | 27.0 ± 8.5 | 11.9 ± 1.96 | ||||||||
| 22. [43] | Lu et al., 2015 | China (2013) | Cross-sectional study | Participants who live in a region of China with heavy metal pollution (1447) | 46.68 ± 15.1, NS | 15.2 ± 15.1 | 4.47 ± 3.49 | CRCL: 76.78 ± 70.44 | BLL 0–100 µg/L (669), ≥ 100 µg/L (778) | |||||||
| 23. [44] | Mujaj et al., 2019 | USA (2015–2017) | Cross-sectional study | Newly hired workers at s at battery manufacturing and lead recycling plants in the USA (447) | BLL <3.0 (147): 28.8 ± 9.5), BLL 3.1–6.3 (152): 30.4 ± 11.4), BLL ≥ 6.3 (148): 27.3 ± 5.3 Male %: NS | 5.6 ± 3.62 BLL < 3.0: 1.66 (1.3–2.5) or 1.78 ± 0.4, 3.1–6.3: 4.63 (3.9–5.7) or 4.72 ± 0.56, ≥ 6.3: 10.48 (7.9–12.25) or 10.3 ± 1.27 | BLL < 3.0 µg/dL (0.97 ± 0.12), 3.1–6.3 µg/dL (0.99 ± 0.14), ≥6.3 µg/dL (0.96 ± 0.13) eGFR: BLL <3.0 µg/dL (105.4 ± 14.5), 3.1–6.3 µg/dL (102.6 ± 16.0), ≥ 6.3 µg/dL (107.7 ± 14.8) | BLL <3.0 µg/dL (147), 3.1–6.3 µg/dL (152), ≥ 6.3 µg/dL (148) | ||||||||
| 24. [45] | Muntner et al., 2003 | USA (1988–1994) | Retrospective study | Normotension by the National Center for Health statistics (10,398) | ≥20, 4991/ 10,398 (48%) | 3.30 ± 0.10 | 1.05 ± 0.004 eGFR: 115 ± 0.7 | 0.7–1.6 µg/dL (114), 1.7–2.8 (166), 2.9–4.6 µg/dL (229), 4.7–52.9 µg/dL (270) CKD (114) | ||||||||
| 25. [4] | Nakhaee et al., 2018 | Iran (2017) | Case-cohort study | Exposed group: healthy adults with chronic lead exposure (BLL > 10 μg/dL) (100), healthy individuals with BLL < 10 μg/dL (100) | 45.8 ± 11.8, 184/200 (92%) | All group: 27.77 ± 39.45 BLL > 10 μg/dL (51.36 ± 44.72), BLL < 10 μg/dL (4.17 ± 1.97) | BLL > 10 μg/dL (34.0, 27.0–221.0), BLL < 10 μg/dL (30.0, 27.0–36.0) | BLL > 10 μg/dL (0.9, 0.8–1.0), BLL < 10 μg/dL (0.8, 0.7–0.9) | ||||||||
| 26. [46] | Navas-Acien et al., 2009 | USA (1999–2006) | Retrospective study | National Health and Nutrition Examination Survey (14,778): reduced eGFR (1668), normal GFR (13,110) | Reduced eGFR: 67.6 ± 0.5, 640/ 1668 (38.4%) Normal GFR: 44.7 ± 0.3, 6660/ 13,110 (50.8%) | 1.6 ± 0.27 Reduced eGFR (<60): 2.06 (1.98–2.15) or 2.06 ± 0.21, normal GFR: 1.54 (1.50–1.57) or 1.54 ± 0.21 BLL: < 1.1 (147), 1.1–1.6 (274), 0.6–2.4 (468), > 2.4 (779) | ||||||||||
| 27. [47] | Oktem et al., 2004 | Turkey | Cross-sectional study | Auto repairers (79), healthy control (71) | 17.3 ± 1.0, NS | 7.79 ± 3.81 BLL; 3.4–4.9 µg/dL (14): 4.11 ± 0.43, 5–9.9 µg/dL (51): 7.08 ± 1.38, 10–25 µg/dL (14): 14.04 ± 4.59 | 12.8 ± 2.3 BLL; 3.4–4.9 µg/dL (14): 12.5 ± 2.5, 5–9.9 µg/dL (51): 12.9 ± 2.2, 10–25 µg/dL (14): 13.1 ± 2.6 | 0.82 ± 0.08 BLL; 3.4–4.9 µg/dL (14): 0.83 ± 0.09, 5–9.9 µg/dL (51): 0.81 ± 0.08, 10–25 µg/dL (14): 0.84 ± 0.10 GFR: 147 ± 16.1 BLL; 3.4–4.9 µg/dL (14): 147 ± 17.9, 5–9.9 µg/dL (51): 149 ± 15.6, 10–25 µg/dL (14): 139 ± 14.5 | 5.6 ± 1.1 BLL; 3.4–4.9 µg/dL (14): 5.7 ± 0.9, 5–9.9 µg/dL (51): 5.5 ± 1.1, 10–25 µg/dL (14): 6.0 ± 1.1 GFR: 147 ± 16.1 | 17.0 ± 1.1 | 1.60 ± 0.80 | 12.1 ± 2.3 | 0.83 ± 0.12 GFR: 146 ± 18.5 | 5.9 ± 1.4 | ||
| 28. [48] | Omae et al., 1990 | Japan (1985) | Cross-sectional study | Lead exposed workers (165): duration of exposed > 10 years (20), duration of exposed < 10 (134) | 18.4–57.3, NS | 36.5 (6–73) or 36.5 ± 19.3 0–19 (21), 20–29 (39), 30–39 (34), 40–49 (36), 50–59 (25), ≥ 60 (10) Duration of exposed: > 10 years: 43.7 (23–73), Duration of exposed < 10: 36.2 (6–73) | 0–19 (1 ± 1.13), 20–29 (0.96 ± 1.11), 30–39 (0.96 ± 1.14), 40–49 (0.95 ± 1.13), 50–59 (0.93 ± 1.10), ≥ 60 (0.97 ± 1.12) CRCL: 0–19 (99.3 ± 1.12), 20–29 (105.4 ± 1.13), 30–39 (104.5 ± 1.11), 40–49 (105.3 ± 1.14), 50–59 (110.1 ± 1.12), ≥ 60 (102.2 ± 1.18) | |||||||||
| 29. [17] | Onuegbu et al., 2011 | Nigeria | Cross-sectional study | Exposed workers (53): automobile mechanics (23), battery repair workers (11), petrol station attendants (19) Control (42) | 30.8 ± 7.8, 53/53 (100%) | 69.7 ± 13.2 automobile mechanics (68.8 ± 14.8), battery repair workers (75.5 ± 10.0), petrol station attendants (67.4 ± 12.4) | 65 ± 14.8 automobile mechanics (69 ± 14.7), battery repair workers (55.4 ± 13.6), petrol station attendants (65.6 ± 13.6) | 1.1 ± 0.32 automobile mechanics (1.09 ± 0.04), battery repair workers (1 ± 0.17), petrol station attendants (1.18 ± 0.32) | 30.1 ± 1.2, 42/42 | 18.5 ± 3.6 | 53.2 ± 13.6 | 1.01 ± 0.15 | ||||
| 30. [49] | Patil et al., 2007 | India | Cross-sectional study | All exposed group (90) Battery manufacturing industries (30), silver jewelry (30) workers, spray painters (30) control group (35) | 20–40 years, 90/90 (100%) | 41.5 ± 18.1 Battery manufacturing industries (53.6 ± 17, silver jewelry (48.6 ± 7.39) workers, spray painters (22.3 ± 8.87) | 25.7 ± 9.59 Battery manufacturing industries (30.4 ± 11), silver jewelry (20 ± 5.84) workers, spray painters (26.7 ± 8.34) | 0.85 ± 0.19 Battery manufacturing industries (0.83 ± 0.15), silver jewelry (0.83±0.20) workers, spray painters (0.88±0.22) | 4.96 ± 1.26 Battery manufacturing industries (5.92 ± 0.95), silver jewelry (4.07 ± 1.01) workers, spray painters (4.90±1.10) | 20–40 years, 35/35 | 12.52 ±4.08 | 25.12 ±5.73 | 0.81 ± 0.11 | 5.57 ± 0.97 | ||
| 31. [50] | Payton et al., 1994 | USA (1988–1991) | Cross-sectional study | Men participating in the Normative Aging Study (744) | 64 ± 7.4, NS | 8.9 ± 3.9 | 1.3 ± 0.2 CRCL: 88.2 ± 22, eGFR: 71 ± 18.4 | |||||||||
| 32. [51] | Reilly et al., 2018 | USA | Cross-sectional study | Smelter-working resident (52) control residents (290) | 55.8 ± 10.5, NS | 4.5 ± 5 Duration of residence (14.1 ± 12.2) | 1.3 ± 0.67 eGFR: 85.2 ± 26.5 | 43 ± 14.1 | 2.7 ± 2.5 Duration of residence (11.5 ± 11.9) | 1.2 ± 0.66 eGFR: 96 ± 24.2 | ||||||
| 33. [20] | Roels et al., 1994 | Belgium | Cross-sectional study | Workforce of a large lead smelter (47) control group (55): the same workplace but never directly occupationally exposed to lead | 42.3 ± 8.1, NS | 46.6 (34.2–67.9) or 48.8 ± 9.74, 15.9 ± 6.8 | 29.7 (15.9–50.3) or 31.4 ± 9.93 | 0.91 (0.69–1.07) or 0.9 ± 0.23, 123.5 (97–177) or 130.3 ± 23.1 | 5.1 (3.3–8.2) or 5.43 ± 1.44 | 43.0 ± 9.1 | 13.9 (6.3–26.1) or 15.1 ± 5.73 | 32.4 (23.3–48.6) or 34.2 ± 7.31 | 0.97 (0.78–1.28) or 1 ± 0.25, 114.2 (81–156) or 116.4 ± 21.66 | 5.4 (3.8–8.1) or 5.68 ± 1.27 | ||
| 34. [52] | Satarug et al., 2004 | Thailand | Cross-sectional study | Students, factory workers, teachers, and laborers (118) | 37.5 ± 8.8, 53/118 (44.9%) | 3.54 ± 3.99 Male (53): 4.2 ± 5.4, female (65): 3.0 ± 2.2 | Male 12.6 ± 3.4, female 11.0 ± 2.5 | Male 0.94 ± 0.12, female 0.66 ± 0.10 | ||||||||
| 35. [53] | Staessen et al., 1990 | United Kingdom (1982) | Cross-sectional study | Civil servants (531) | 47.7 ± 5.77, 398/531 (75%) | 5.72 ± 2.1 Male (398): 6.0 ± 2.1, female (133): 4.9 ± 1.9 | Male 9.7 ± 2.6, female 7.8 ± 1.1 | |||||||||
| 36. [54] | Staessen et al., 1992 | Belgium (1985–1989) | Prospective population-based Study | Exposed group (2327): the Malmo Diet and Cancer Study (MDCS-CC), prospective population-based study (MDCS) | 48 ± 16, 965/ 2327 (41.5%) | 21.4 ± 18.1 Male 11.4 (2.3–72.5) or 24.4 ± 20.3, female 7.5 (1.7–60.3) or 19.3 ± 16.9 | Male 1.24 (0.7–4.64, female 1.05 (0.58–2.71) CRCL: Male 93 ± 30, female 480 ± 25 | |||||||||
| 37. [55] | Tsaih et al., 2004 | USA | Cohort study | The Normative Aging Study (NAS) | Baseline (448): 66 ± 6.6, NS | Baseline (427): 6.5 ± 4.2, follow-up 4.5 ± 2.5 | Baseline (448): 1.1 ± 0.4, follow-up 1.25 ± 0.2 | |||||||||
| 38. [56] | Verschoor et al., 1987 | Netherlands | Cross-sectional study | 155 lead workers (155): lead battery plants 1 (36), lead battery plants 2 (52), lead battery plants 3 (9), plastic stabilizer production plant (58) control workers (126): nonlead plants, insulation materials (60), production of drainpipes (56), plant producing concrete (10) | 30–51, NS | Exposed group (148): 47.5 (33.8–66.5) or 48.8 ± 9.45 B plant 1: 50.15 (37.5–66.7), B plant 2: 45.4 (24.7–66.9), B plant 3: 65.9 (46.2–94.3), stab plant: 45.6 (34.2–60.7) BLL < 20.7 µmol/L (125), BLL 20.7–62.2 (113), BLL > 62.2 (27) | 56.6 ± 14.1 BLL < 20.7 (56.6 ± 14.7), BLL 20.7–62.2 (56.6 ± 13.6), BLL > 62.2 (56.6 ± 13.6) | 0.96 ± 0.16 BLL < 20.7 (125): 0.96 ± 0.16, BLL 20.7–62.2 (113): 0.96 ± 0.15, BLL > 62.2 (27): 0.92 ± 0.16 Relative CRCL: 0.17 ± 0.09 | 6.34 ± 1.4 BLL < 20.7 (6.29 ± 1.34), BLL 20.7–62.2 (6.42 ± 1.38), BLL > 62.2 (6.27 ± 1.78) Relative CRCL: 0.17 ± 0.09 | 30–51 years | 0.40 (0.27–0.58) or 0.4 ± 0.22 | Relative CRCL: 0.17 ± 0.08 | ||||
| 39. [19] | Wang et al., 2002 | Taiwan | Cross-sectional study | Lead battery workers (229) | 40 ± 14.7, 120/229 (52.4%) | 58.6 ± 25.4 Male: 67.7 ± 28.2, female: 48.6 ± 17.0 BLL < 60 µg/dL (134), BLL > 60 µg/dL (95) Work duration: 8.24 ± 8.25 Male: 4.6 (0.2–35) or 11.1 ± 10.1, female: 2.7 (0.2–17) or 5.65 ± 4.87 | BLL < 60 (14.37 ± 0.35), BLL > 60 (16.65 ± 0.43) | BLL < 60 (1.04 ± 0.01)), BLL > 60 (1.05 ± 0.02) Abnormal creatinine BLL < 60 (18), BLL > 60 (23) | BLL < 60 (5.66 ± 0.12), BLL > 60 (6.09 ± 0.15) | |||||||
| 40. [57] | Wang et al., 2018 | China (2012) | Cross-sectional study | Lead exposure paint workers | 31.7 ± 7.74, 706/747 (94.5%) | 9.0 ± 6.0 (70) BLL positive (70) | Renal dysfunction (93), BLL positive and renal dysfunction (19/70), BLL negative and renal dysfunction (74/751) | |||||||||
| 41. [58] | Weaver et al., 2011 | Republic of Korea (2004–2005) | Cohort study | Current and former workers employed at 26 lead-using facilities (712) | 47.6 ± 7.9, 563/712 (79%) | 23.1 ± 14.1 Duration of exposed: 13.1 ± 7.3 | 0.87 ± 0.15 eGFR: 97.4 ± 19.2 CRCL: 111.1 ± 30.7 | |||||||||
| 42. [59] | Weaver et al., 2003 | Republic of Korea (1997–1999) | Cohort study | Current and former lead workers (803): lead battery, lead oxide, lead crystal, radiator manufacture, and secondary lead smelting controls (135) | 40.4 ± 10.1, 639/803 (79.6%) | 32.0 ± 15.0 Duration of job: 8.2 ± 6.5 | 14.4 ± 3.7 | 0.90 ± 0.16 CRCL: 94.7 ± 20.7 | 34.5 ± 9.1, 124/135 | 5.3 ± 1.8 | 13.1 ± 2.9 | 0.91 ± 0.10 CRCL: 108.4 ± 19.4 | ||||
| 43. [60] | Weaver et al., 2005 | Republic of Korea (1999–2001) | Cohort study | Workers from 26 plants that produced lead batteries, lead oxide, lead crystal, or radiators or secondary lead smelters (652) | 43.3 ± 9.8, 503/652 (77.2%) | 30.9 ± 16.7 | 14.4 ± 3.9 | 0.87 ± 0.15 | 109.2 ± 34.8 | |||||||
| High mean BLL (>30 µg/dL) | Sources of contamination: welding and metal, paint and pigment, radiator repair, petrol, auto mechanic, battery makers and chargers, glazed pottery, plastic stabilizer industry, radiator manufacturing industry, storage battery plant, automobile mechanic, petrol station, silver jewelry, lead battery plants, production plant, lead oxide, and lead crystal |
| Moderate mean BLL (20–30 µg/dL) | Sources of contamination: smelting, batteries, pigment, extruded materials, cable sheeting, gas add, silver jewelry, PVC-producing factory, stabilizers using lead ingots, lead-using facilities |
| Low mean BLL (<20 µg/dL) | Sources of contamination: polluted areas, heavy metal pollution, battery manufacturing and lead recycling plants, auto repair, smelting factory |
Publisher’s Note: MDPI stays neutral with regard to jurisdictional claims in published maps and institutional affiliations. |
© 2021 by the authors. Licensee MDPI, Basel, Switzerland. This article is an open access article distributed under the terms and conditions of the Creative Commons Attribution (CC BY) license (https://creativecommons.org/licenses/by/4.0/).
Share and Cite
Kuraeiad, S.; Kotepui, M. Blood Lead Level and Renal Impairment among Adults: A Meta-Analysis. Int. J. Environ. Res. Public Health 2021, 18, 4174. https://doi.org/10.3390/ijerph18084174
Kuraeiad S, Kotepui M. Blood Lead Level and Renal Impairment among Adults: A Meta-Analysis. International Journal of Environmental Research and Public Health. 2021; 18(8):4174. https://doi.org/10.3390/ijerph18084174
Chicago/Turabian StyleKuraeiad, Saruda, and Manas Kotepui. 2021. "Blood Lead Level and Renal Impairment among Adults: A Meta-Analysis" International Journal of Environmental Research and Public Health 18, no. 8: 4174. https://doi.org/10.3390/ijerph18084174