
Exercise Thermal Sensation: Physiological Response to Dynamic–Static Steps at Moderate Exercise


Abstract
:1. Introduction
2. Methods
2.1. Subjects
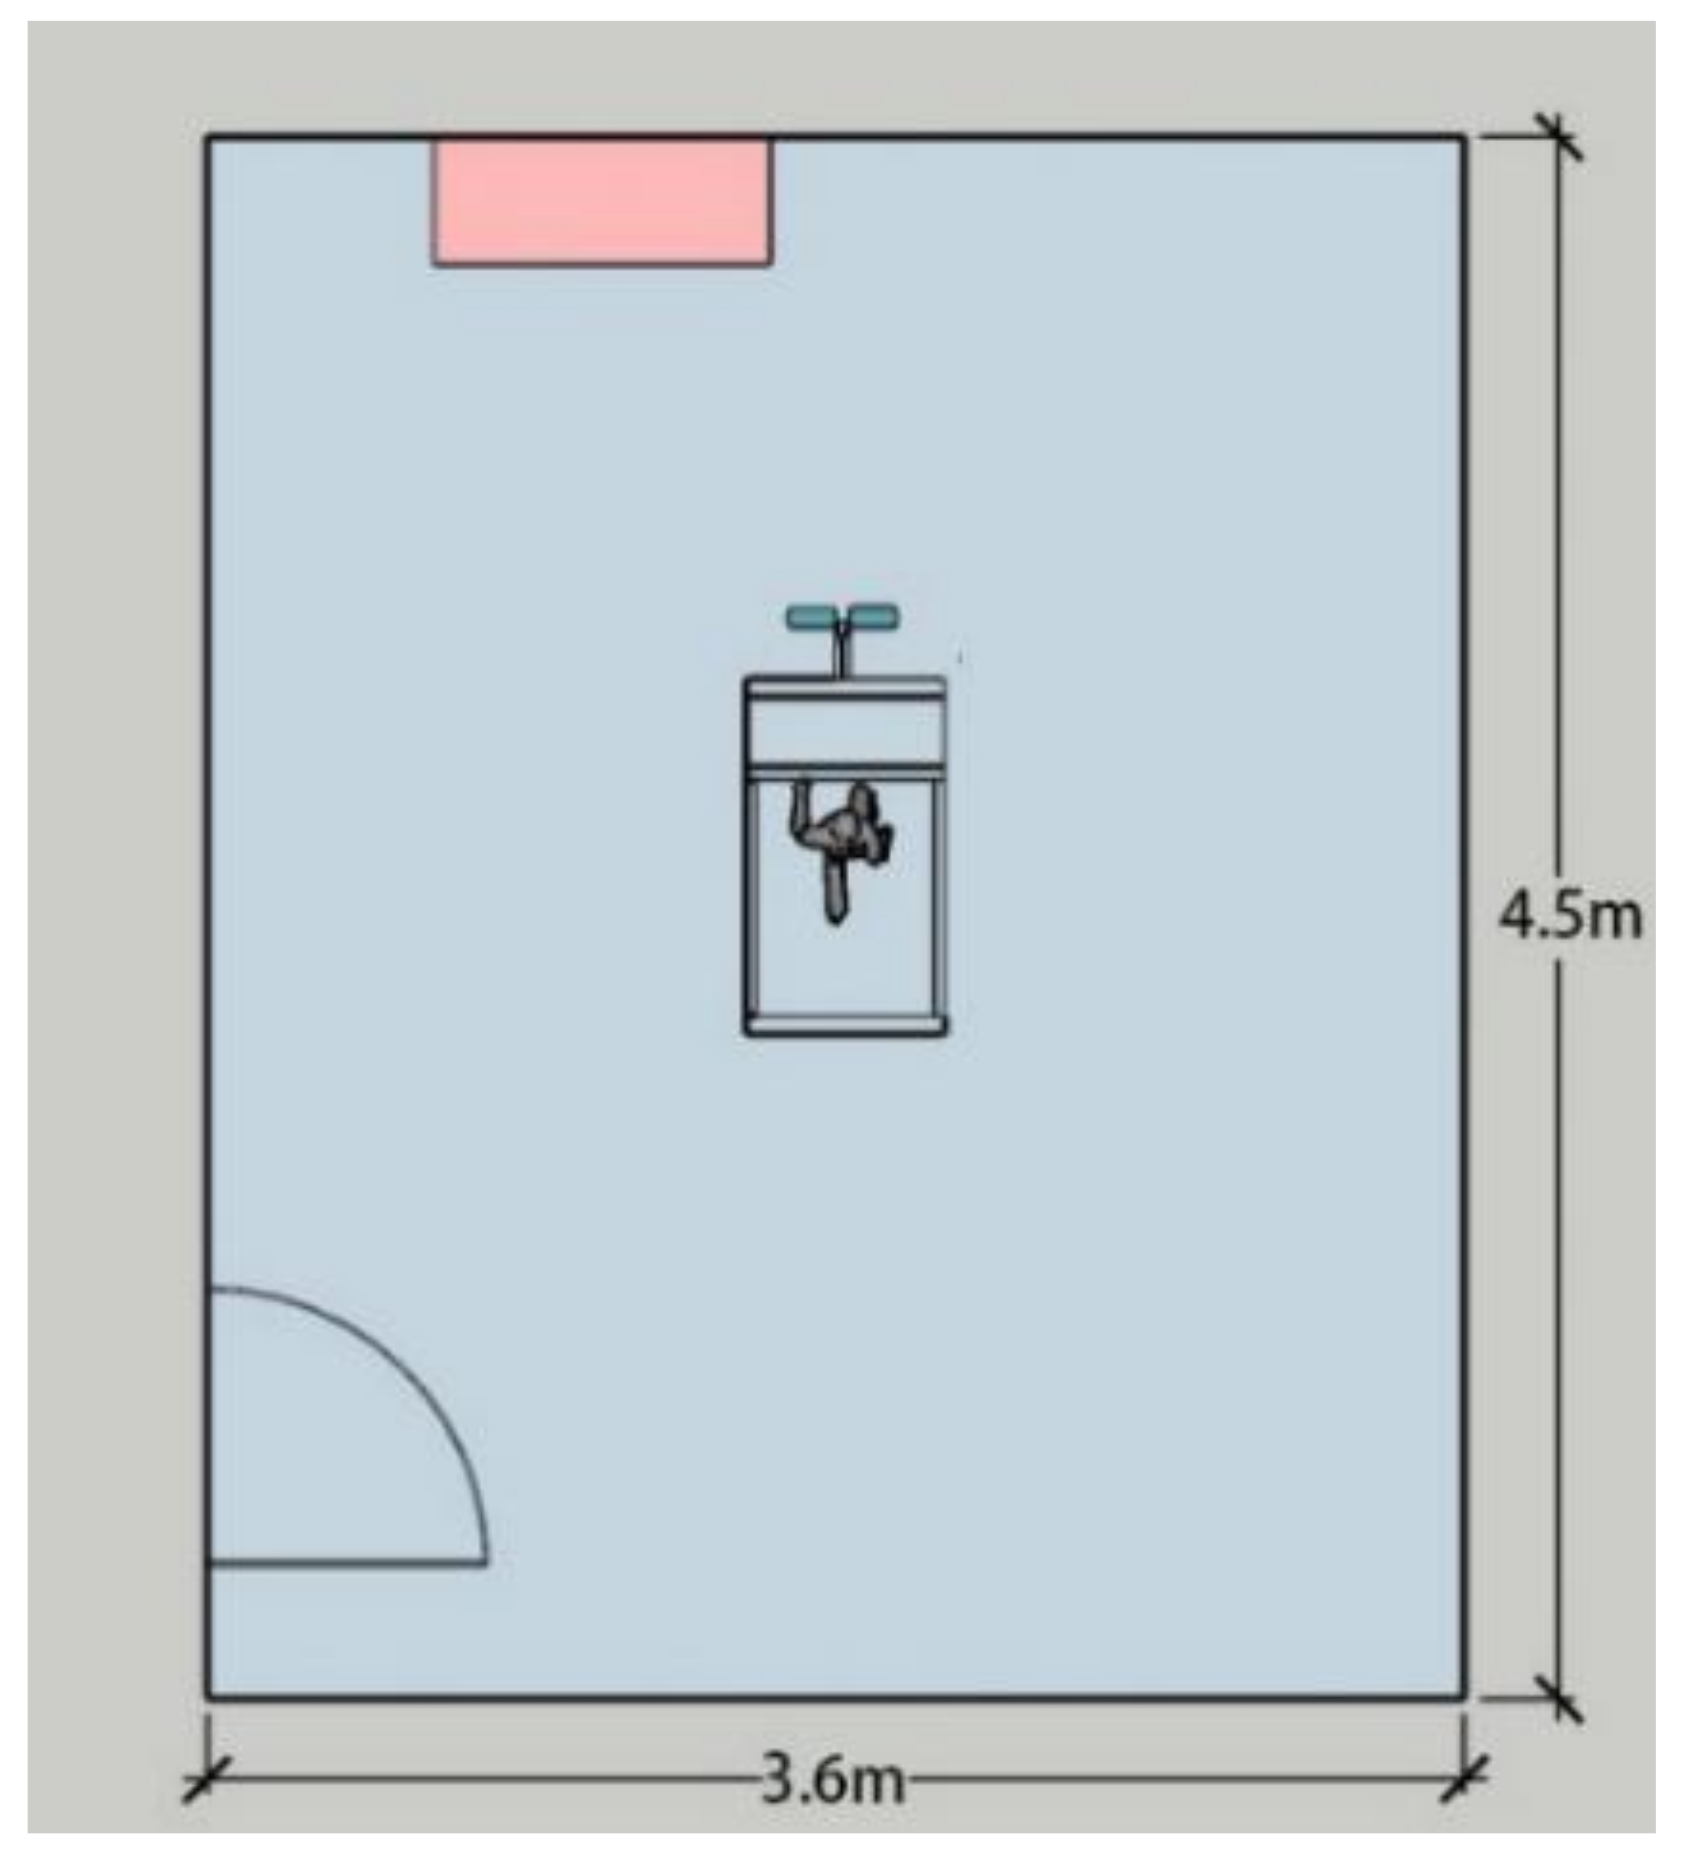
2.2. Experimental Environment
2.3. Experimental Measurements
2.3.1. Measurement of Physiological Parameters
Skin and Oral Temperatures
HR and HRV
Electrodermal Activity (EDA)
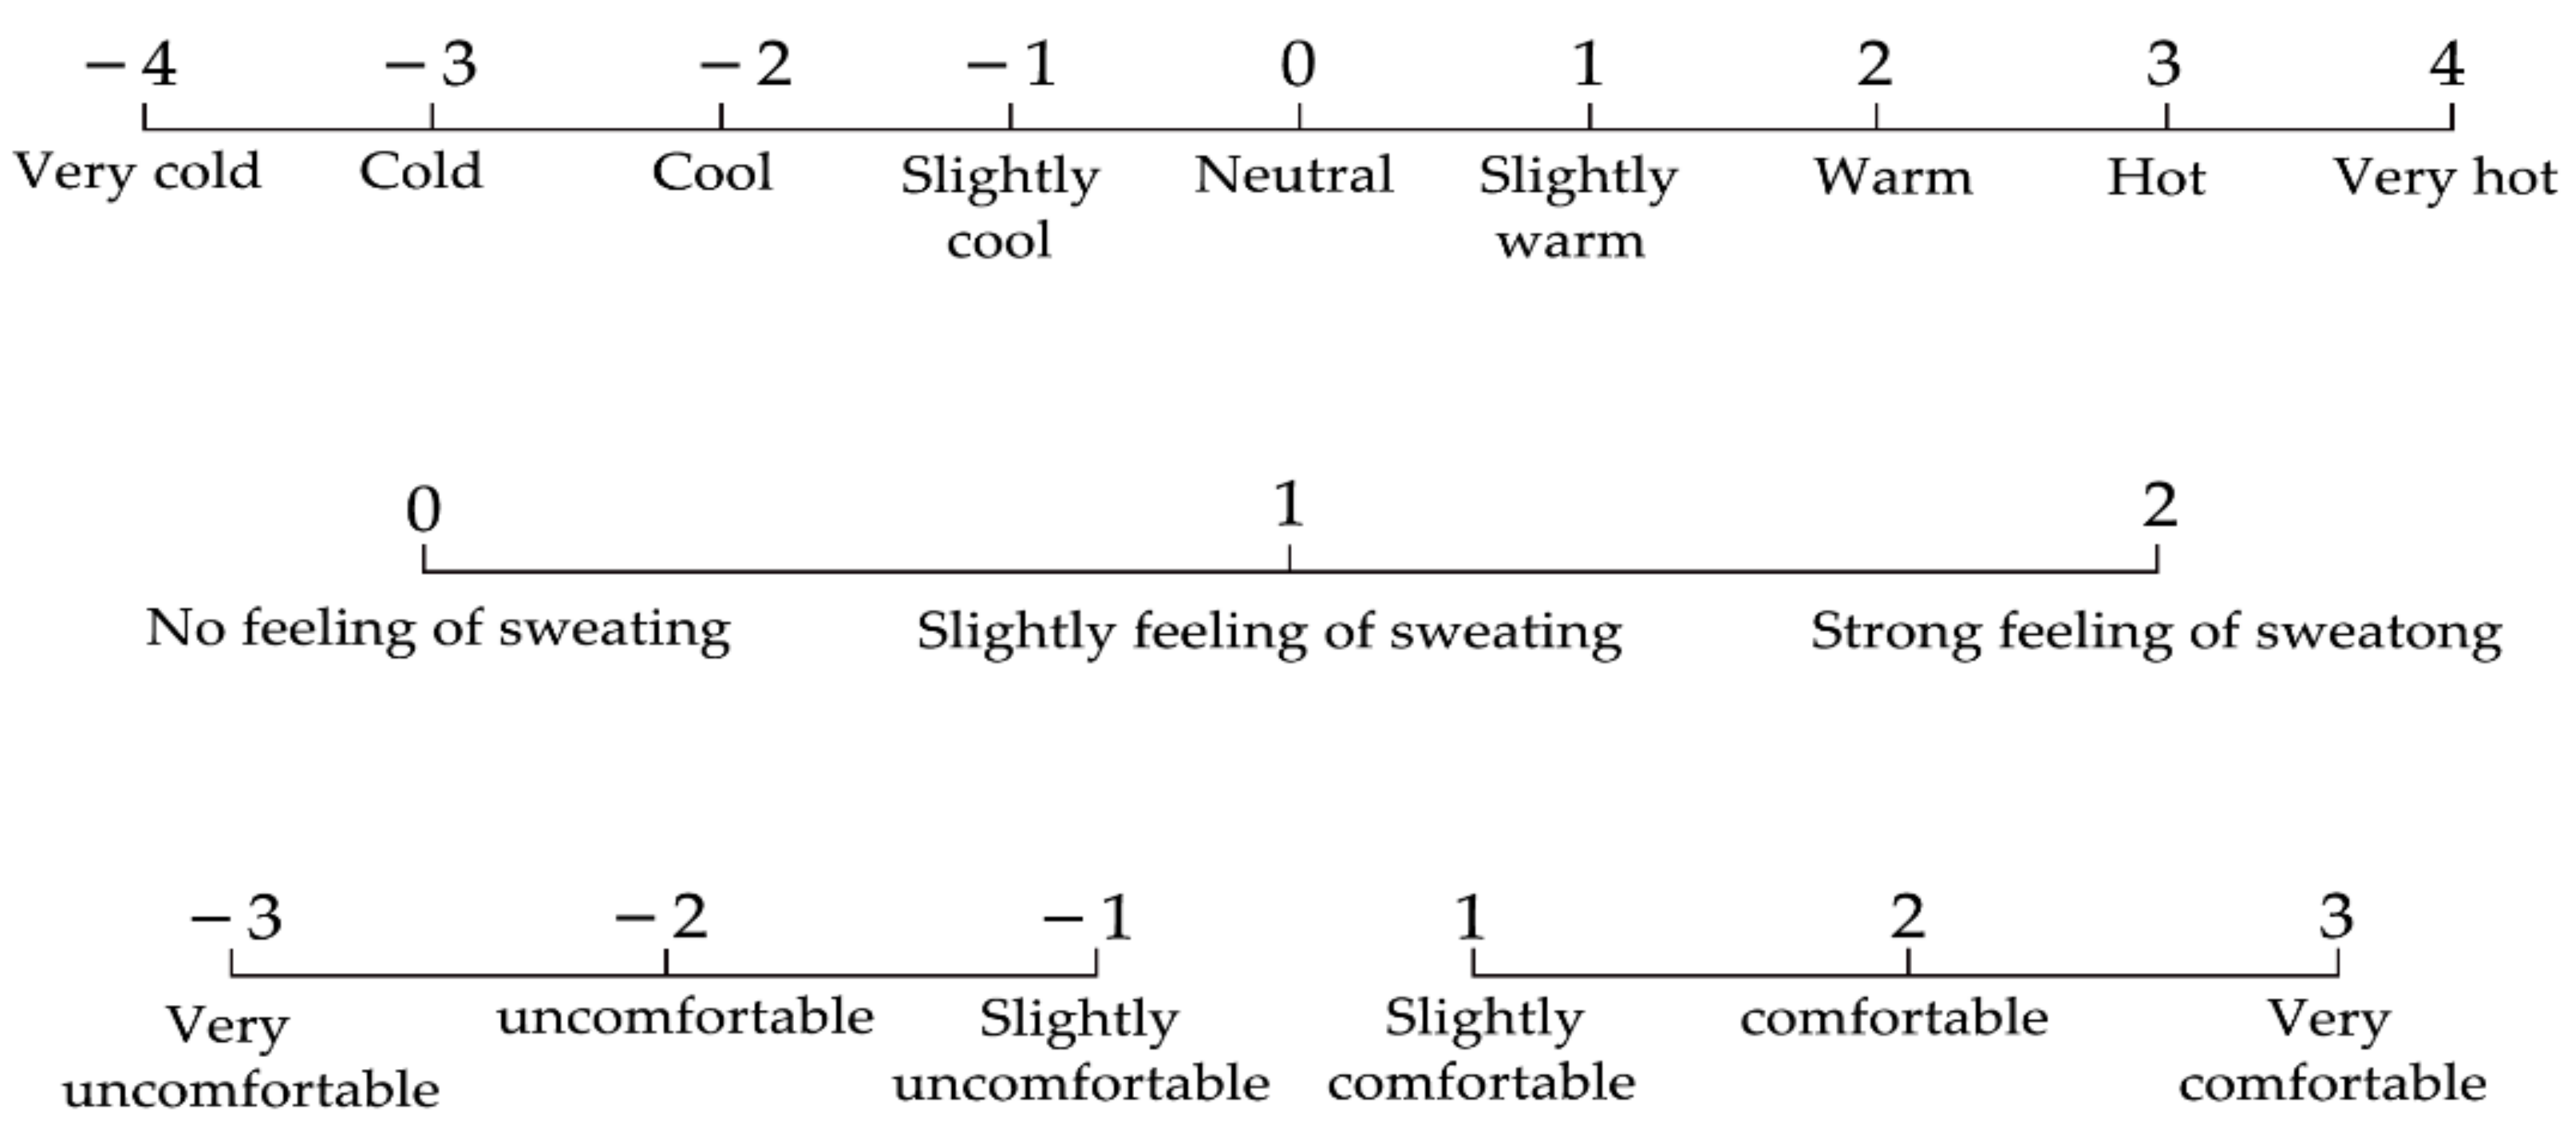
2.3.2. Subjective Selection
2.4. Experimental Procedure
 ). The 12 thermal comfort questionnaire times (violet
  ) were at the 13th, 17th, 21st, 25th, 29th, 33rd, 35th, 37th, 40th, 43rd, 46th, and 49th minute. The exercise was stopped at the 35th minute. The questionnaire of thermal sensation and thermal comfort was commenced 10 s after the exercise to study the immediate subjective changes in the human body.
2.5. Data Processing
3. Experiment Results
3.1. The Impact of Dynamic–Static Step Changes on Physiological Parameters in Exercise
3.1.1. Skin and Oral Temperature
3.1.2. HR and HRV
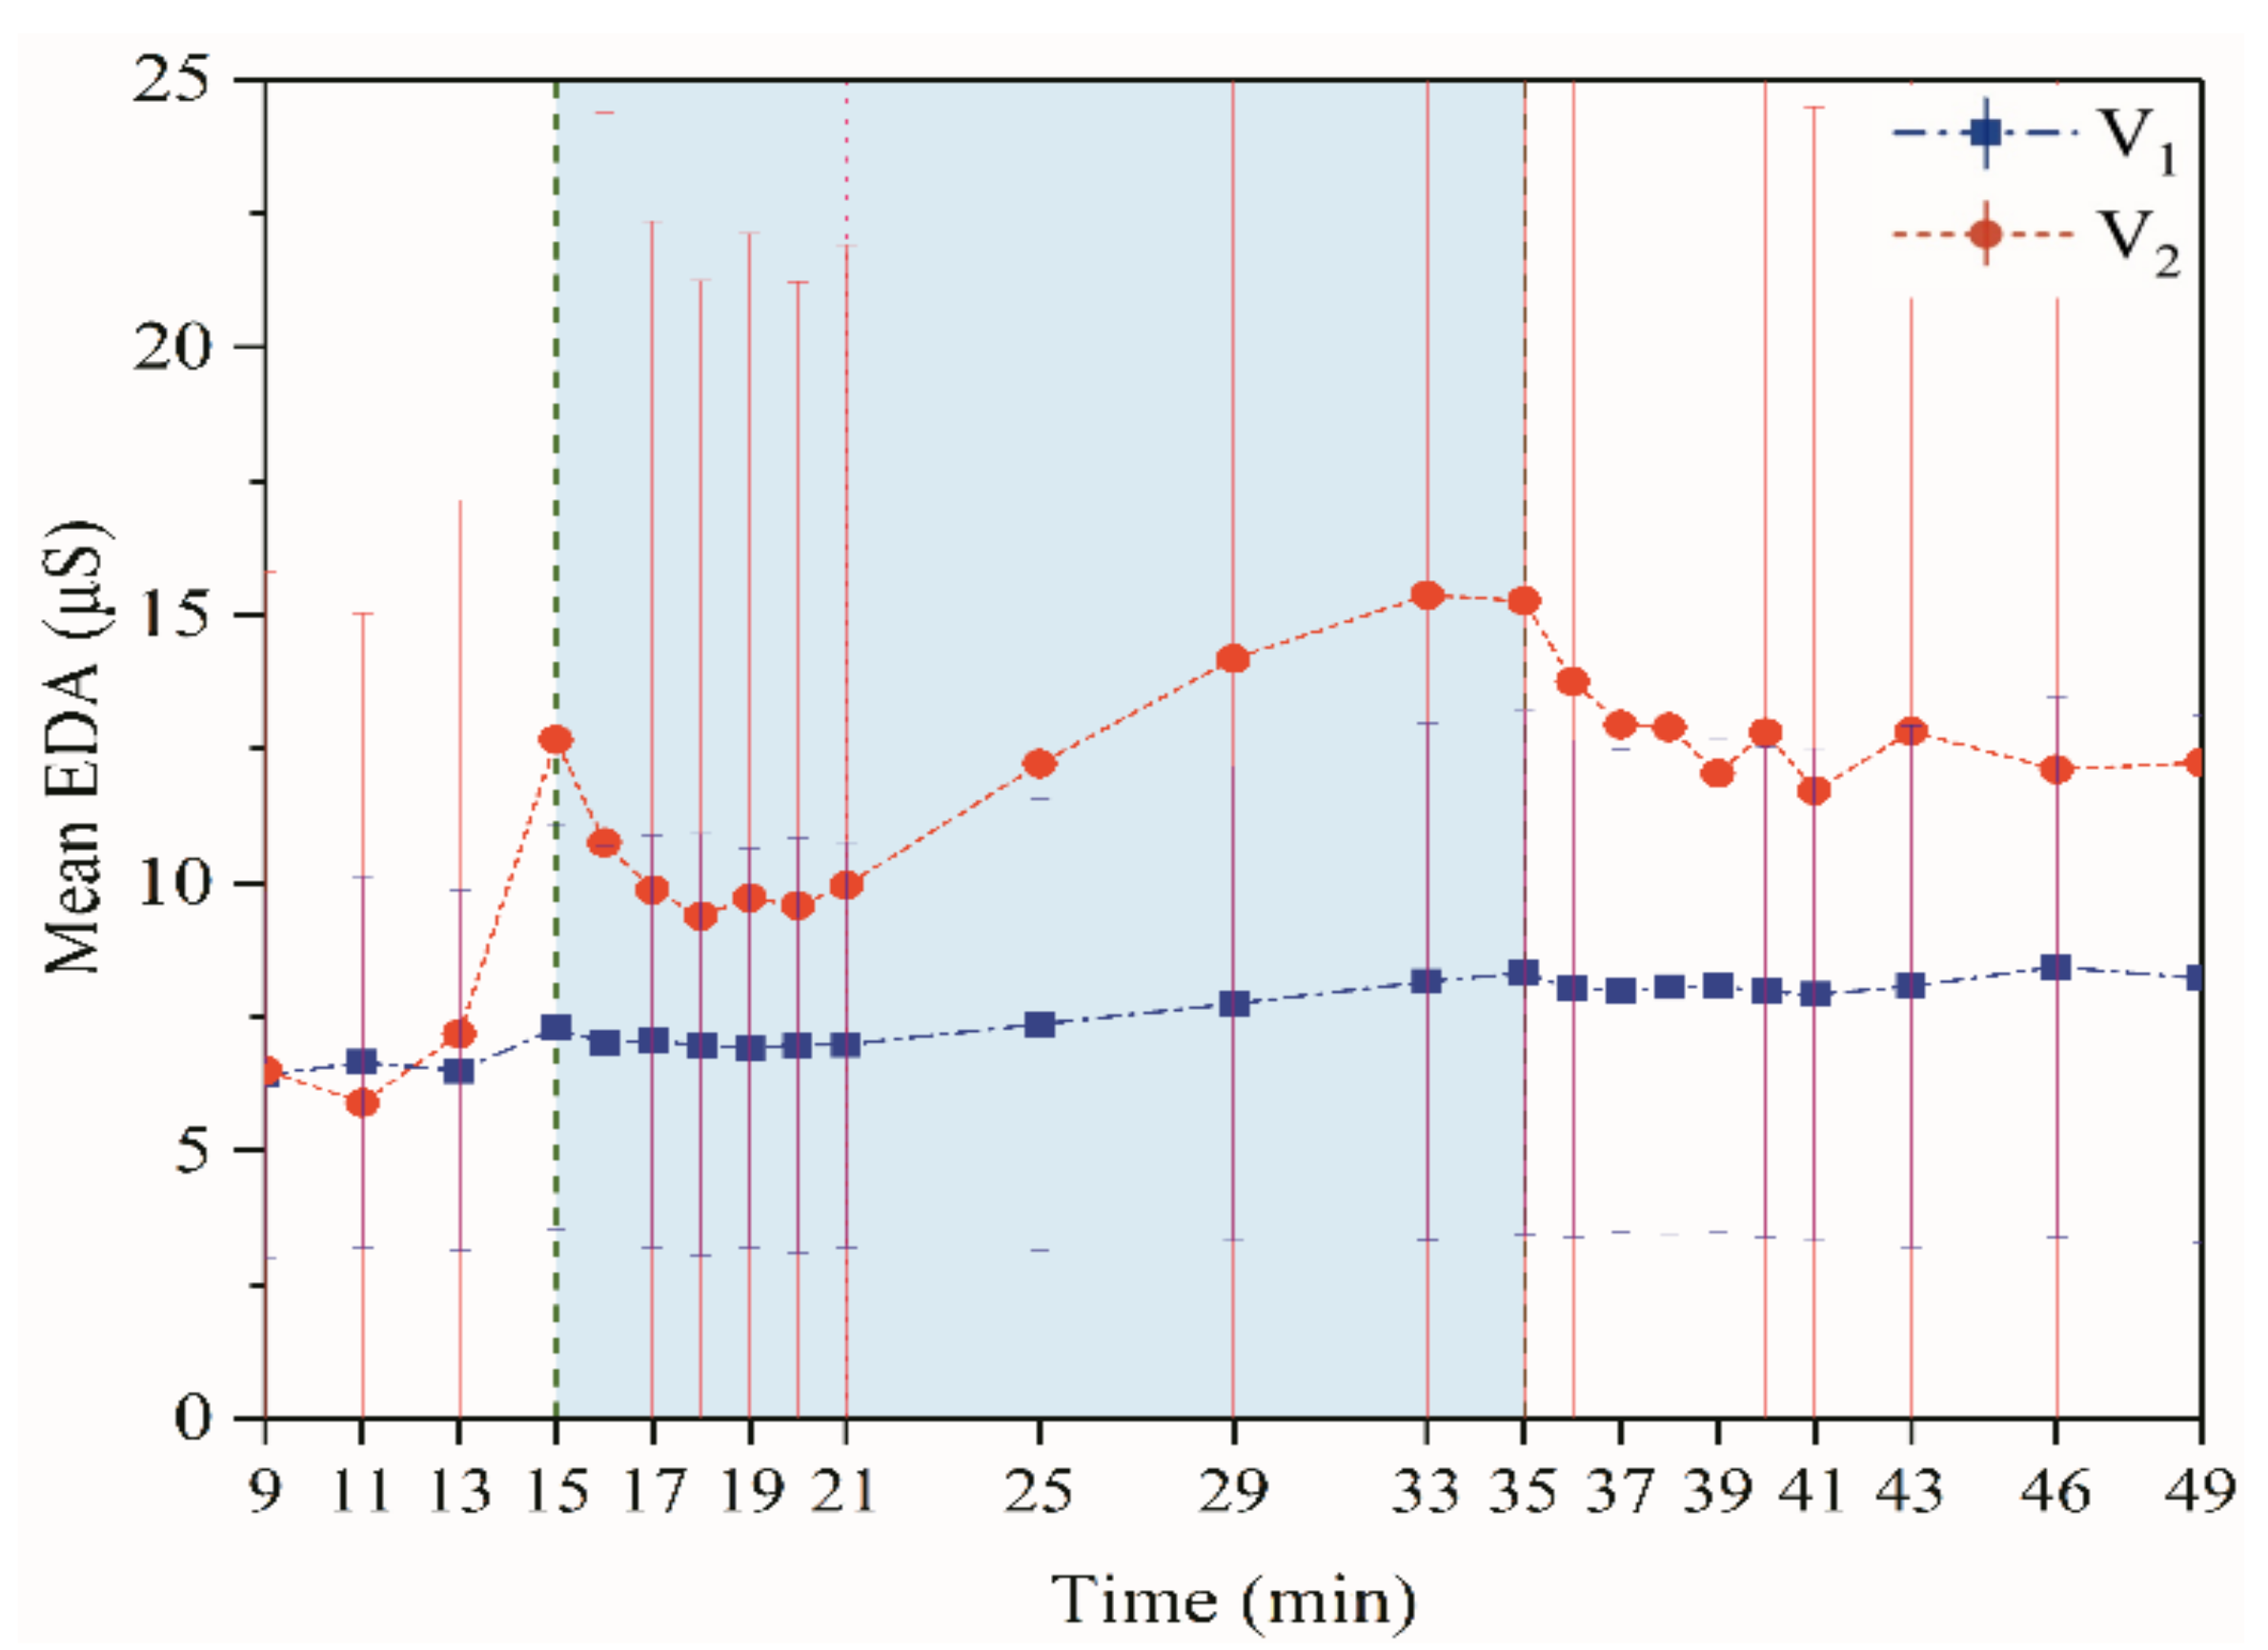
3.1.3. Electrodermal Activity
3.2. The Impact of Dynamic–Static Step Changes on Subjective Sensation in Exercise
3.2.1. Thermal Sensation, Thermal Comfort and SFI
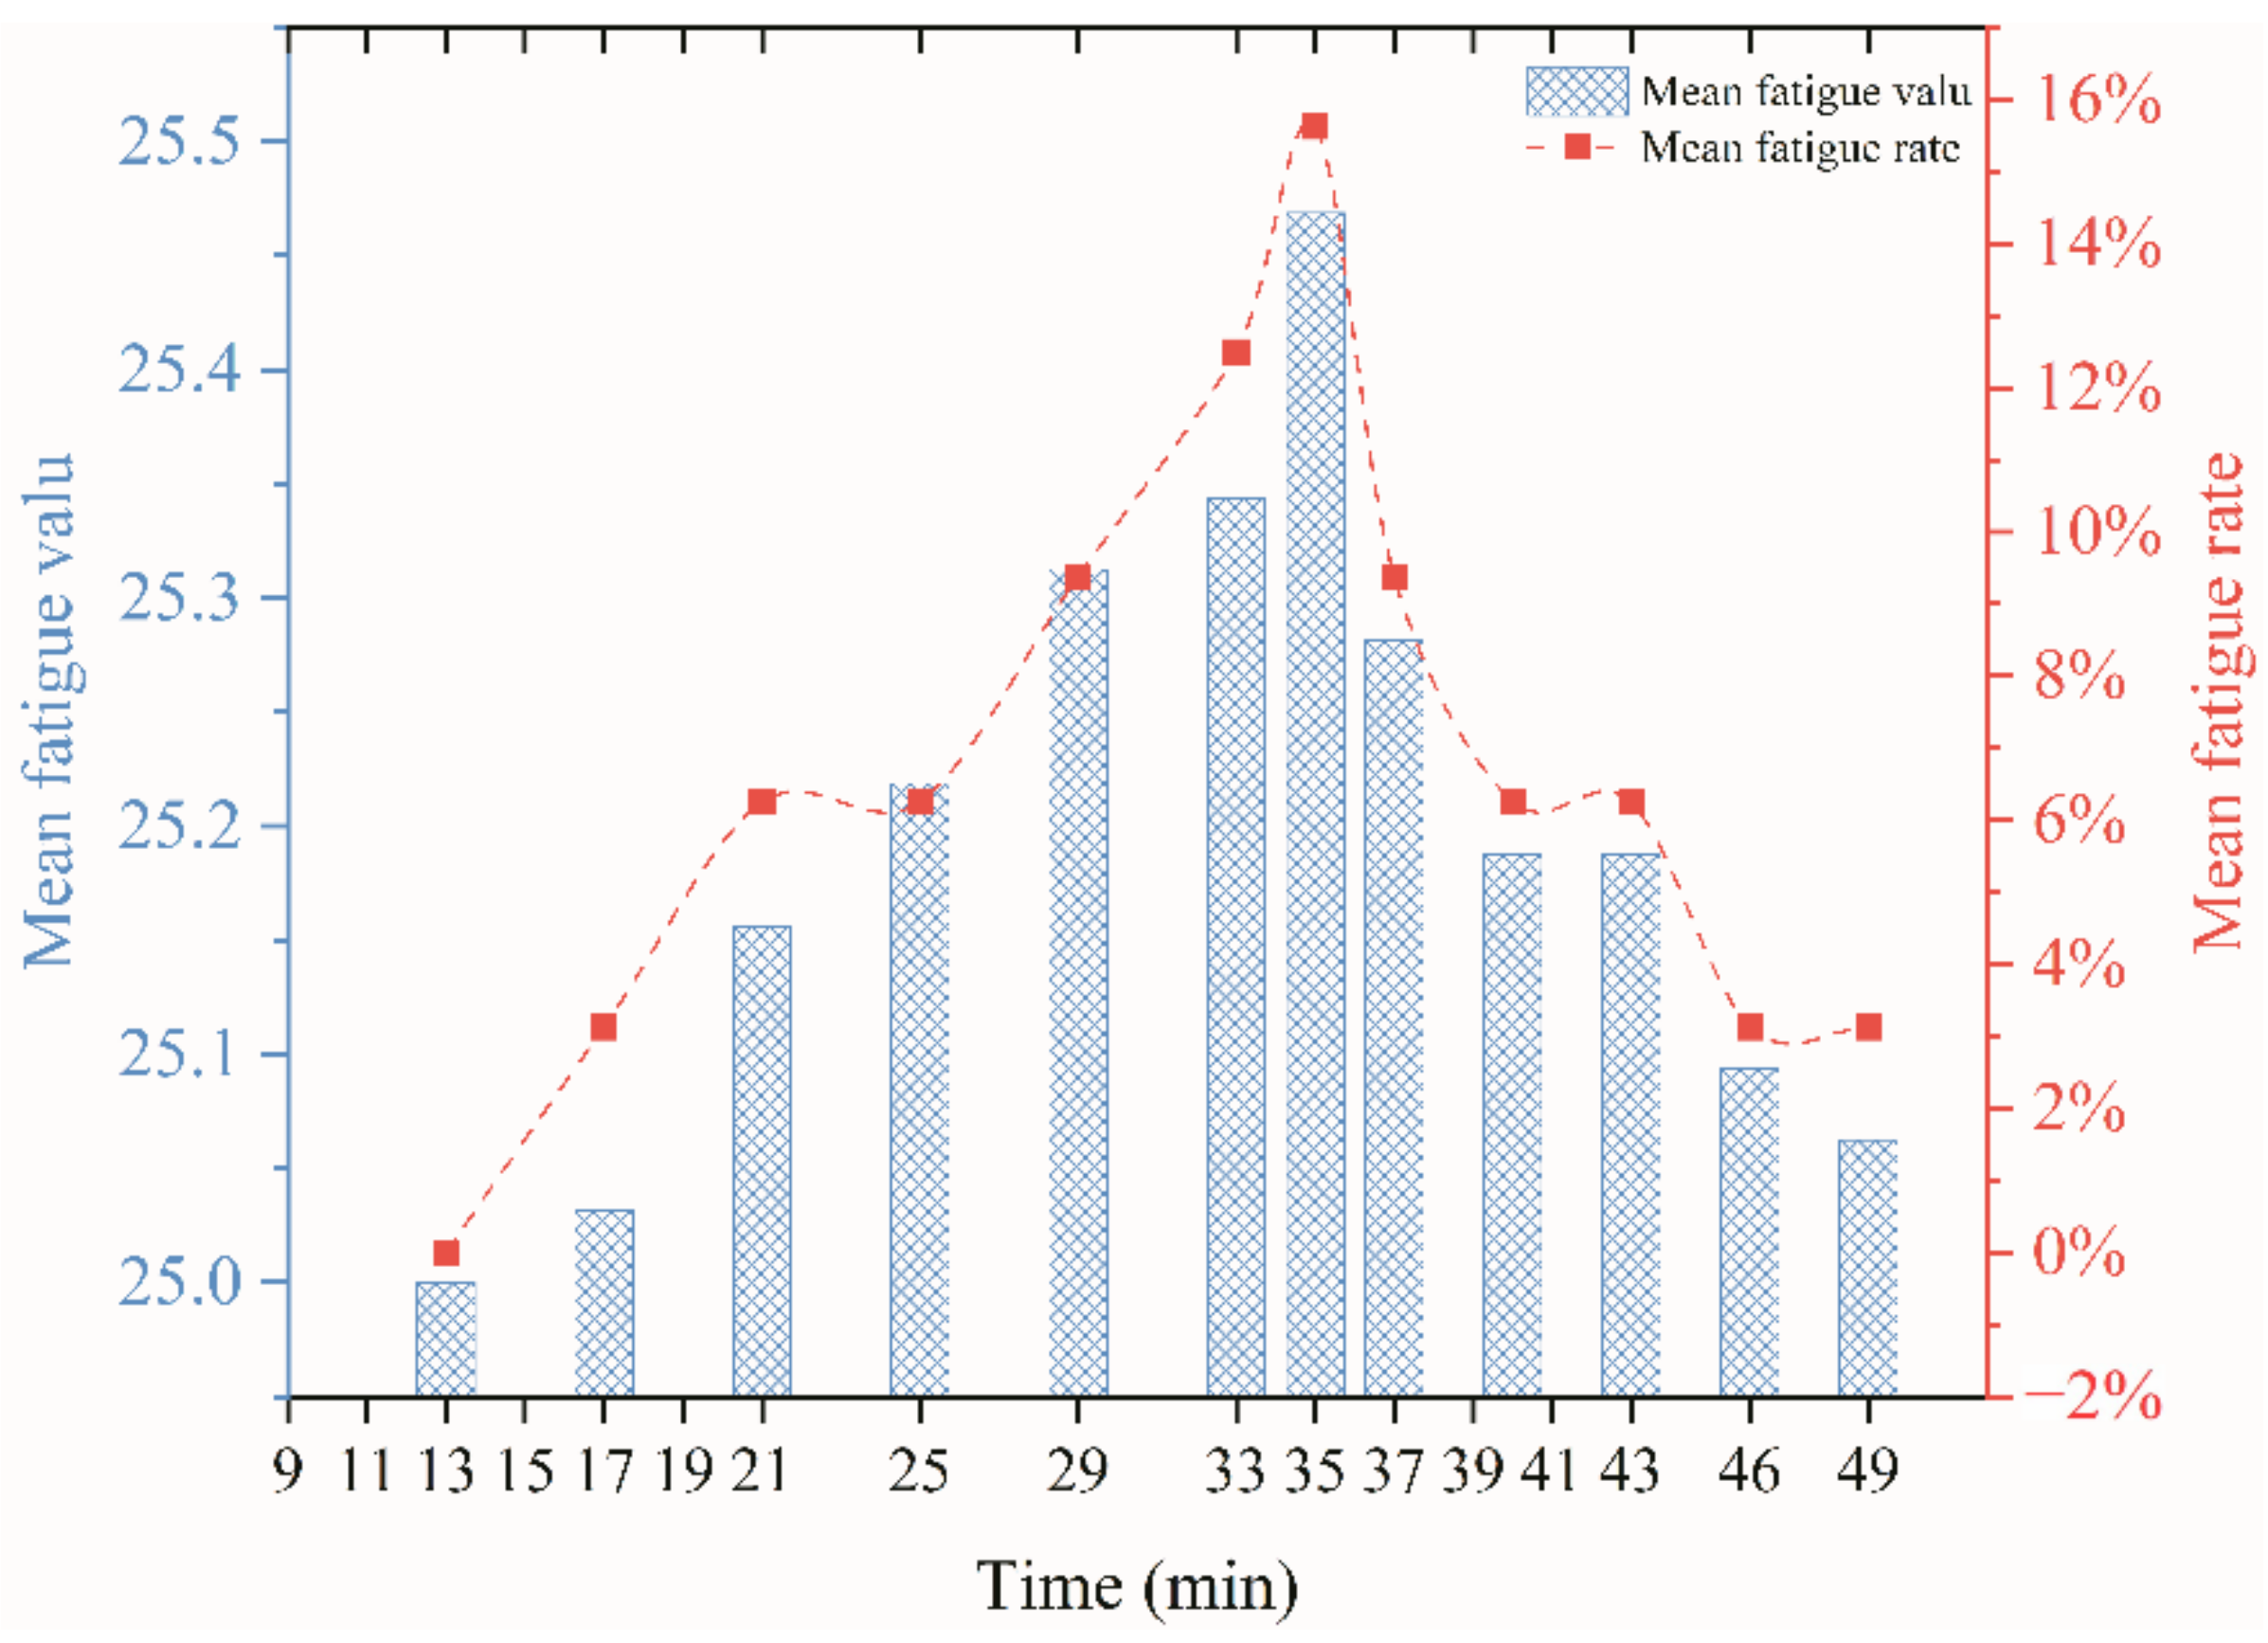
3.2.2. Fatigue Index
4. The Mathematical Relationships between Physiological Indicators and Subjective Perceptions in Dynamic-Static Step Processes
4.1. Stepwise Regression Analysis between Physiological Indicators and TSV
4.2. Stepwise Regression Analysis between Physiological Indicators and TC
4.3. Average Change and Rate of Change of Physiological Parameters
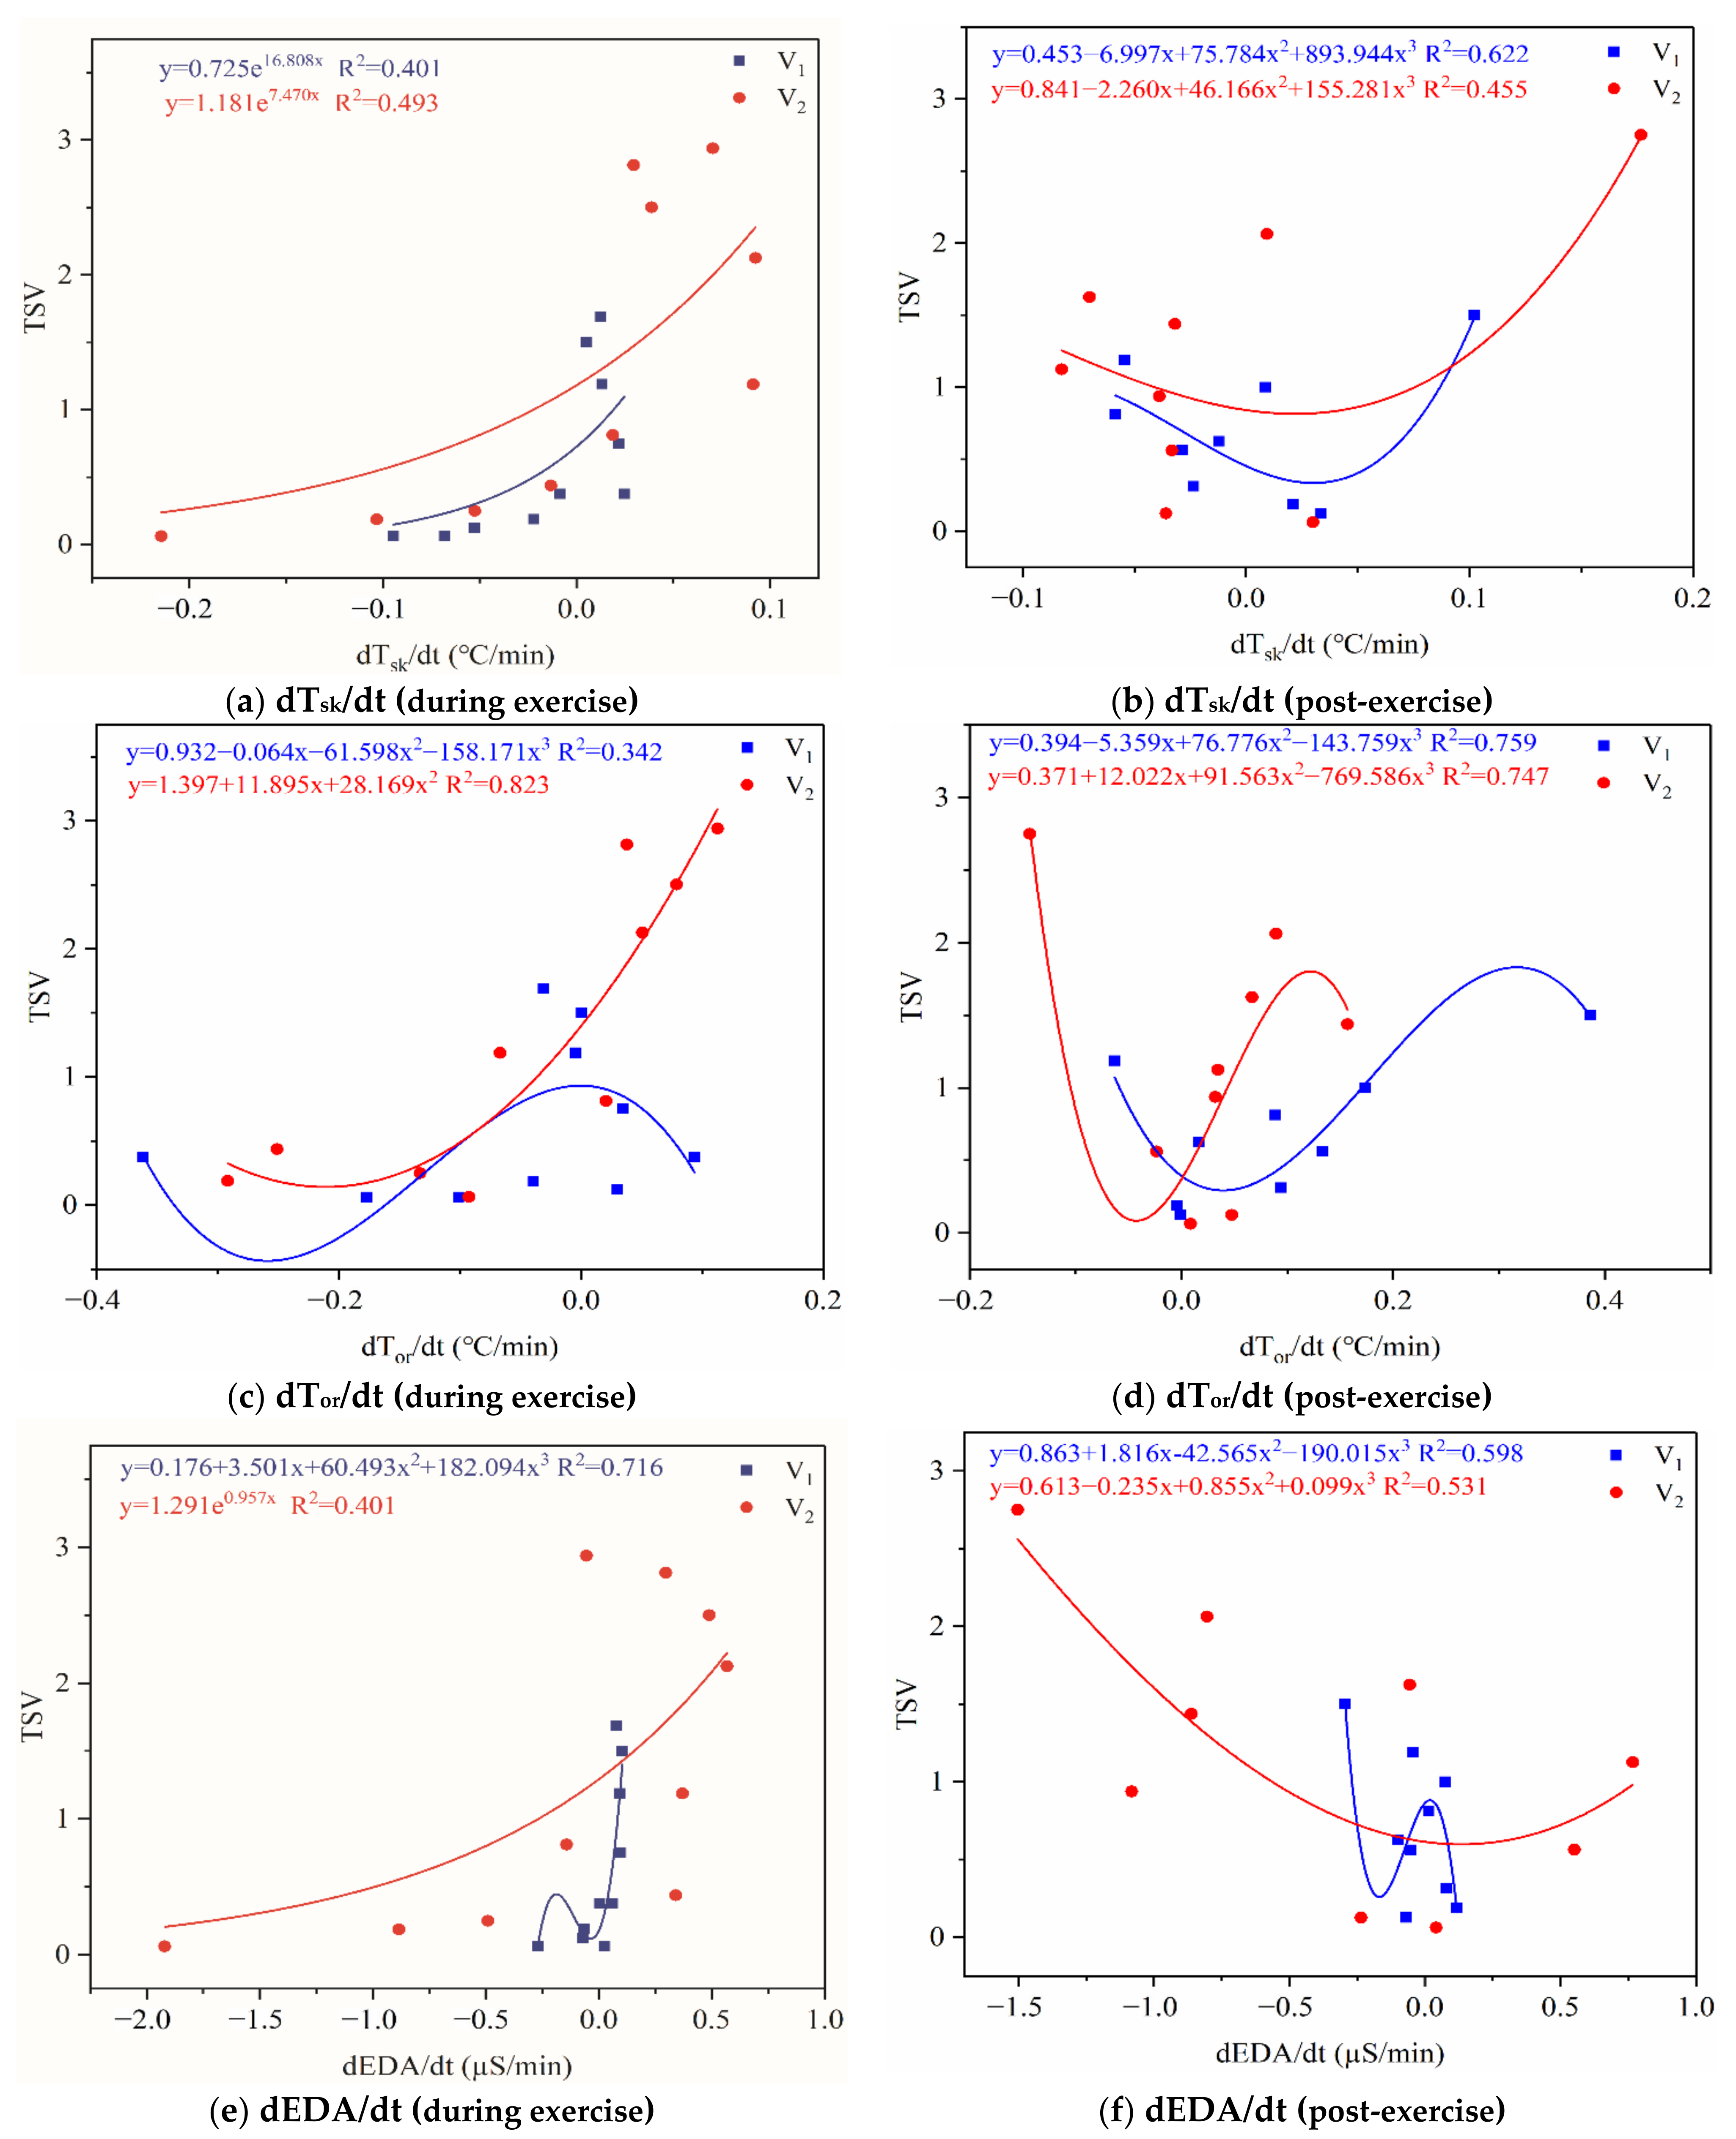
4.4. Stepwise Regression Analysis of TSV Using Average Change and Rate of Change of Physiological Parameters
4.5. Correlation among Subjective Perceptions
5. Discussion
5.1. Physiological Indicators around the Dynamic–Static Steps
5.2. The Relationship between HRV Indicators and Exercise Thermal Sensation (Comfort)
- 1.
- Overall, RMSSD and SDNN distribution trends were similar, with a higher proportion of HS in the during exercise (DE) phase than LS. It indicates that the cardiac load increases during exercise, and the autonomic nervous system were transformed from a state of mutual equilibrium between the sympathetic and vagus nerves at rest to a direction where the sympathetic nerves were dominant [43]. It indicates that the human body was in a state of “excitement”. In particular, in the V2 experiment, the proportion of HS was as high as 84.1%, suggesting that increasing exercise intensity has a more significant impact on HRV [44].
- 2.
- For time-domain indicators, MS accounts for the highest proportion except for the IE phase of the V2 experiment. Under normal conditions, the SDNN and RMSSD values for Chinese were about 3–5 (expressed in natural logarithm transformed values) [45]. The experimental results showed that the time domain indicators returned to standard values after the exercise.
- 3.
- SDNN indicators reflect the overall HRV situation. Table 8 shows that both HS and LS decreased, and MS increased after the exercise, indicating a gradual return of HRV to the standard range.
- 4.
- As can be seen from the force-directed graph, LS was more likely to be found in the low thermal sensation area. For HS and MS, no significant distribution patterns were observed at the corresponding individual thermal sensation nodes. It also explains, to some extent, the absence of time-domain indicators as an independent variable in the stepwise regression analysis.
- 5.
- For the frequency domain indicator (LF/HF), there was almost no LS distribution in the region of the highest thermal sensation node during exercise. It indicates that sympathetic activity was dominant, and the body was in a state of excitement, tension, or discomfort. After exercise, the proportion of LS in the high thermal sensation area increased rapidly, indicating that HF increased, and parasympathetic nerves were activated after exercise, which was consistent with the results of previous studies [44,46]. Parasympathetic nerves were activated, indicating that the “ excitement “ state began to be inhibited, and comfort began to increase. However, as a whole, we still do not observe a more pronounced regular change in the distribution of each value segment in LF/HF with increasing thermal sensation. It may be related to the fact that the body was in exercise and the heart functions were in a complex state.
5.3. Thermal Alliesthesia
5.4. Limitations
- 1.
- The equations derived from the stepwise regression algorithm can predict thermal sensation and comfort. However, the results obtained using the equations were continuous values, and the answer for each subject is a discrete quantity. Therefore, in follow-up research, we will try to establish a valid threshold range for the results obtained. If the continuous value obtained by the regression equation belongs in this threshold range, the continuous quantity can be converted into an amount discrete that conforms to the ASHRAE thermal sensory scale, making a more accurate prediction of thermal sensation while exercising.
- 2.
- However, thermal comfort is a complex topic. The results of this experiment were done at a limited intensity of exercise, and the number of subjects was not large. The common exercise intensities were chosen only as a case study for this work. This work’s results were obtained only under this experiment conditions. Different exercise intensities and times, different temperatures and humidity, and different air velocities can significantly affect physiological parameters and thermal sensations, making significant differences in the results. These results may be valid only for this test case. The authors will add more experimental procedures in future studies to obtain more experimental data.
6. Conclusions
Author Contributions
Funding
Institutional Review Board Statement
Informed Consent Statement
Data Availability Statement
Acknowledgments
Conflicts of Interest
Nomenclature
| Tsk | mean skin temperature, °C |
| Tor | oral temperature, °C |
| HR | heart rate beats per minute (BPM) |
| BMI | body mass index |
| R-R | beat intervals, ms |
| SDNN | Standard deviation of the NN (R-R) intervals recommended parameters for time-domain measures, the standard deviation of normal sinus R-R interval(take the natural logarithm) |
| RMSSD | Root mean square of the successive differences; recommended parameters for time-domain tests; the square root of the mean of the sum of the squares of differences between adjacent; beat intervals (take the natural logarithm) |
| LF | power (0.04–0.15 Hz) in normalized units; LF/(TP-VLF) × 100, n.u. |
| HF | power (0.15–0.4 Hz) in normalized units; HF/(TP-VLF) × 100, n.u. |
| LF/HF | ratio LF/HF, |
| EDA | electrodermal activity, μS |
| SFI | the sweat feeling index |
| M | rate of metabolic heat production, W/m2 |
| W | rate of mechanical work accomplished, W/m2 |
| C | rate of convective heat, W/m2 |
| R | rate of radiant heat, W/m2 |
| Esk | total evaporative heat loss from skin (including natural diffusion Edif and regulative sweating Esw), W/m2 |
| Cres | rate of convective heat loss from respiration, W/m2 |
| Eres | rate of evaporative heat loss from respiration, W/m2 |
| S | rate of heat storage in the body, W/m2 |
| SHL | sensible heat loss |
| LHL | latent heat loss |
References
- Zhang, G.; Moschandreas, D.J.; Zheng, C.; Zhang, Q.; Yang, W. Thermal Comfort Investigation of Naturally Ventilated Classrooms in a Subtropical Region. J. Int. Soc. Built Environ. 2007, 16, 148–158. [Google Scholar]
- Wan, M.P.; Chao, C.Y. Experimental Study of Thermal Comfort in an Office Environment with an Underfloor Ventilation System. J. Int. Soc. Built Environ. 2002, 11, 250–256. [Google Scholar] [CrossRef]
- Chan, L.S. Effect of Air Supply Temperature on the Performance of Displacement Ventilation (Part I)–Thermal Comfort. Indoor Built Environ. 2005, 14, 103–115. [Google Scholar]
- Choi, J.-H.; Loftness, V. Investigation of human body skin temperatures as a bio-signal to indicate overall thermal sensations. Build. Environ. 2012, 58, 258–269. [Google Scholar] [CrossRef]
- Xiong, J.; Zhou, X.; Lian, Z.; You, J.; Lin, Y. Thermal perception and skin temperature in different transient thermal environments in summer. Energy Build. 2016, 128, 155–163. [Google Scholar] [CrossRef]
- Luo, M.; Zhou, X.; Zhu, Y.; Sundell, J. Revisiting an overlooked parameter in thermal comfort studies, the metabolic rate. Energy Build. 2016, 118, 152–159. [Google Scholar] [CrossRef]
- Li, W.; Zhang, J.; Zhao, T.; Liang, R. Experimental research of online monitoring and evaluation method of human thermal sensation in different active states based on wristband device. Energy Build. 2018, 173, 613–622. [Google Scholar] [CrossRef]
- Choi, J.-H.; Loftness, V.; Lee, D.-W. Investigation of the possibility of the use of heart rate as a human factor for thermal sensation models. Build. Environ. 2012, 50, 165–175. [Google Scholar] [CrossRef]
- Wang, H.; Hu, S. Experimental study on thermal sensation of people in moderate activities. Build. Environ. 2016, 100, 127–134. [Google Scholar] [CrossRef]
- Fanger, P.O. Thermal Comfort: Analysis and Applications in Environmental Engineering; Mcgraw Hill: New York, NY, USA, 1970. [Google Scholar]
- Tan, D.; Liu, H.; Wu, Y. The Response of Human Thermal Perception and Skin Temperature to Step-Changed Activity Level. Int. J. Environ. Sci. Dev. 2017, 8, 425–429. [Google Scholar] [CrossRef] [Green Version]
- Gagge, A.; Stolwijk, J.; Saltin, B. Comfort and thermal sensations and associated physiological responses during exercise at various ambient temperatures. Environ. Res. 1969, 2, 209–229. [Google Scholar] [CrossRef]
- WHO. Obesity: Preventing and Managing the Global Epidemic; WHO: Geneva, Switzerland, 2000. [Google Scholar]
- Yu, C.-Y.; Lo, Y.-H.; Chiou, W.-K. The 3D scanner for measuring body surface area: A simplified calculation in the Chinese adult. Appl. Ergon. 2003, 34, 273–278. [Google Scholar] [CrossRef]
- ISO. Ergonomics of the Thermal Environment—Estimation of Thermal Insulation and Water Vapour Resistance of a Clothing Ensemble; ISO: Geneva, Switzerland, 2007; Available online: https://www.iso.org/standard/39257.html (accessed on 20 May 2020).
- Yao, Y.; Lian, Z.; Liu, W.; Shen, Q. Experimental study on physiological responses and thermal comfort under various ambient temperatures. Physiol. Behav. 2008, 93, 310–321. [Google Scholar] [CrossRef] [PubMed]
- Xiong, J.; Lian, Z.; Zhou, X.; You, J.; Lin, Y. Potential indicators for the effect of temperature steps on human health and thermal comfort. Energy Build. 2016, 113, 87–98. [Google Scholar] [CrossRef]
- Zhang, Y.; Zhou, X.; Zheng, Z.; Oladokun, M.O.; Fang, Z. Experimental investigation into the effects of different metabolic rates of body movement on thermal comfort. Build. Environ. 2020, 168, 106489. [Google Scholar] [CrossRef]
- Zhai, Y.; Zhao, S.; Yang, L.; Wei, N.; Xu, Q.; Zhang, H.; Arens, E. Transient human thermophysiological and comfort responses indoors after simulated summer commutes. Build. Environ. 2019, 157, 257–267. [Google Scholar] [CrossRef] [Green Version]
- Gao, S.; Zhai, Y.; Yang, L.; Zhang, H.; Gao, Y. Preferred temperature with standing and treadmill workstations. Build. Environ. 2018, 138, 63–73. [Google Scholar] [CrossRef] [Green Version]
- Chappuis, P.; Pittet, P.; Jéquier, E. Heat storage regulation in exercise during thermal transients. J. Appl. Physiol. 1976, 40, 384–392. [Google Scholar] [CrossRef]
- Malik, M.; Bigger, J.T.; Camm, A.J.; Kleiger, R.E.; Malliani, A.; Moss, A.J.; Schwartz, P.J. Heart rate variability: Standards of measurement, physiological interpretation, and clinical use. Eur. Hear. J. 1996, 17, 354–381. [Google Scholar] [CrossRef] [Green Version]
- Liu, W.; Lian, Z.; Liu, Y. Heart rate variability at different thermal comfort levels. Graefe’s Arch. Clin. Exp. Ophthalmol. 2008, 103, 361–366. [Google Scholar] [CrossRef]
- Malliani, A.; Pagani, M.; Lombardi, F.; Cerutti, S. Cardiovascular neural regulation explored in the frequency domain. Circulation 1991, 84, 482–492. [Google Scholar] [CrossRef] [PubMed] [Green Version]
- Poh, M.-Z.; Swenson, N.C.; Picard, R.W. A Wearable Sensor for Unobtrusive, Long-Term Assessment of Electrodermal Activity. IEEE Trans. Biomed. Eng. 2010, 57, 1243–1252. [Google Scholar]
- Kappeler-Setz, C.; Gravenhorst, F.; Schumm, J.; Arnrich, B.; Tröster, G. Towards long term monitoring of electrodermal activity in daily life. Pers. Ubiquitous Comput. 2011, 17, 261–271. [Google Scholar] [CrossRef] [Green Version]
- Benedek, M.; Kaernbach, C. A continuous measure of phasic electrodermal activity. J. Neurosci. Methods 2010, 190, 80–91. [Google Scholar] [CrossRef] [Green Version]
- Zolfaghari, A.; Maerefat, M. A new predictive index for evaluating both thermal sensation and thermal response of the human body. Build. Environ. 2011, 46, 855–862. [Google Scholar] [CrossRef]
- Dong, G. Application Study on Japanese "Subjective Fatigue Symptoms"(2002 Version) In a Chinese Manufacturer. J. Ergon. 2009, 60, 26–28. [Google Scholar]
- ASHRAE Standard 55-2017. Thermal Environmental Conditions for Human Occupancy; American Society of Heating, Refrigerating, and Air-Conditioning: Atlanta, GA, USA, 2017. [Google Scholar]
- Zhai, Y.; Li, M.; Gao, S.; Yang, L.; Zhang, H.; Arens, E.; Gao, Y. Indirect calorimetry on the metabolic rate of sitting, standing and walking office activities. Build. Environ. 2018, 145, 77–84. [Google Scholar] [CrossRef]
- Spring, J.N.; Bourdillon, N.; Barral, J. Resting EEG Microstates and Autonomic Heart Rate Variability Do Not Return to Baseline One Hour After a Submaximal Exercise. Front. Neurosci. 2018, 12, 460. [Google Scholar] [CrossRef]
- Marães, V.; Carreiro, D.; Barbosa, N. Study of heart rate variability of university trained at rest and exercise. 2013 Pan Am. Health Care Exch. 2013, 1–5. [Google Scholar] [CrossRef]
- Epstein, S.U.M.D. Integration of the cognitive and the psychodynamic unconscious. Am. Psychol. 1994, 8, 709–724. [Google Scholar] [CrossRef]
- Cabanac, M. Physiological Role of Pleasure. Science 1971, 173, 1103–1107. [Google Scholar] [CrossRef] [PubMed]
- Ji, W.; Luo, M.; Cao, B.; Zhu, Y.; Geng, Y.; Lin, B. A new method to study human metabolic rate changes and thermal comfort in physical exercise by CO2 measurement in an airtight chamber. Energy Build. 2018, 177, 402–412. [Google Scholar] [CrossRef]
- Johnson, J.M. Exercise and the cutaneous circulation. Exerc. Sport Sci. Rev. 1992, 20, 59–97. [Google Scholar] [PubMed]
- Kenney, W.L.; Johnson, J.M. Control of skin blood flow during exercise. Med. Sci. Sports Exerc. 1992, 24, 303–312. [Google Scholar] [CrossRef] [PubMed]
- Äikäs, E.K.; Piironen, P.; Ruosteenoja, R. Intramuscular, Rectal and Oesophageal Temperature During Exercise. Acta Physiol. Scand. 1962, 54, 366–370. [Google Scholar]
- Jéquier, E.; Morbidelli, M.; Dolivo, M.; Vannotti, A. Study by direct calorimetry of thermal regulation during muscle work in man. J. Physiol. 1970, 62, 172. [Google Scholar]
- Shaw, E.W. Thermal Comfort: Analysis and applications in environmental engineering, by P. O. Fanger. 244 pp. Danish Technical Press. Copenhagen, Denmark, 1970. Danish Kr. 76, 50. R. Soc. Health J. 1972, 92, 164. [Google Scholar] [CrossRef]
- Xiong, J.; Lian, Z.; Zhang, H. Physiological response to typical temperature step-changes in winter of China. Energy Build. 2017, 138, 687–694. [Google Scholar] [CrossRef]
- Lucini, D.; Pagani, M.; Mela, G.S.; Malliani, A. Sympathetic Restraint of Baroreflex Control of Heart Period in Normotensive and Hypertensive Subjects. Clin. Sci. 1994, 86, 547–556. [Google Scholar] [CrossRef]
- Michael, S.; Jay, O.; Halaki, M.; Graham, K.; Davis, G.M. Submaximal exercise intensity modulates acute post-exercise heart rate variability. Graefe’s Arch. Clin. Exp. Ophthalmol. 2016, 116, 697–706. [Google Scholar] [CrossRef]
- H.R.V.C.O.S. Group. Multicenter study of HRV’s normal field and its reproducibility. Chin. J. Card. Arrhythm. 2000, 3, 6–11. [Google Scholar]
- Martinmäki, K.; Rusko, H. Time-frequency analysis of heart rate variability during immediate recovery from low and high intensity exercise. Graefe’s Arch. Clin. Exp. Ophthalmol. 2007, 102, 353–360. [Google Scholar] [CrossRef] [PubMed]
- De Dear, R. Revisiting an old hypothesis of human thermal perception: Alliesthesia. Build. Res. Inf. 2011, 39, 108–117. [Google Scholar] [CrossRef]
- Thomas, P.; de Dear, R. Thermal pleasure in built environments: Physiology of alliesthesia. Build. Res. Inf. 2015, 43, 288–301. [Google Scholar]


| Gender | No. | Age (Years) | Height (cm) | Weight (kg) | BMI (kg/cm2) |
|---|---|---|---|---|---|
| Male | 9 | 20.5 ± 2.5 | 175.1 ± 11.9 | 66.3 ± 15.7 | 21.6 ± 3.8 |
| Female | 7 | 20 ± 1 | 165.6 ± 6.4 | 59.7 ± 11.3 | 21.8 ± 5.3 |
| All | 16 | 20 ± 3 | 170.9 ± 12.1 | 63.4 ± 18.6 | 21.7 ± 5.4 |
| Instrument | Parameter | Measuring Range | Accuracy | Wearing Style |
|---|---|---|---|---|
| Wireless skin temperature sensor | Tsk(°C) | 10–60 °C | ±0.1 °C |  |
| Wireless skin electrodermal activity sensor | EDA(Μs) | 0–30 μS | ±0.3 μS |  |
| PPG Ear Tip Pulse Sensor | ECG(HR, HRV) | 25~240 bpm | ±1 bpm |  |
| V1 | Step 1 | Step 2 | Step 3 | V2 | Step 1 | Step 2 | Step 3 | ||||||
|---|---|---|---|---|---|---|---|---|---|---|---|---|---|
| Coef. | p | Coef. | p | Coef. | p | Coef. | p | Coef. | p | Coef. | p | ||
| EDA | 0.64 | 0.004 | 1.013 | 0.000 | 0.846 | 0.000 | EDA | 0.409 | 0.000 | 0.582 | 0.000 | 0.325 | 0.000 |
| Tor | −1.277 | 0.000 | −1.299 | 0.000 | Tor | −1.459 | 0.001 | −2.446 | 0.000 | ||||
| Tsk | 1.711 | 0.026 | Tsk | 2.189 | 0.000 | ||||||||
| R-sq | 38.1% | 86.2% | 90.0% | R-sq | 52.2% | 77.0% | 92.5% | ||||||
| △R-sq | 48.1% | 3.8% | △R-sq | 24.8% | 15.5% | ||||||||
| V1 | Step 1 | Step 2 | V2 | Step 1 | Step 2 | Step 3 | |||||
|---|---|---|---|---|---|---|---|---|---|---|---|
| Coef. | p | Coef. | p | Coef. | p | Coef. | p | Coef. | p | ||
| Tor | 0.862 | 0.008 | 0.967 | 0.000 | EDA | −0.376 | 0.020 | −0.489 | 0.002 | −0.229 | 0.044 |
| Tsk | −3.801 | 0.007 | Tor | 1.377 | 0.016 | 2.438 | 0.000 | ||||
| Tsk | −2.700 | 0.005 | |||||||||
| R-sq | 51.8% | 79.7% | R-sq | 43.2% | 71.1% | 89.9% | |||||
| △R-sq | 27.9% | △R-sq | 27.9% | 18.8% | |||||||
| V1 DE | Step 1 | Step 2 | V1 PE | Step 1 | Step 2 | ||||
|---|---|---|---|---|---|---|---|---|---|
| Coef. | p | Coef. | p | Coef. | p | Coef. | p | ||
| EDA | 1.124 | 0.000 | 0.995 | 0.000 | ∆Tor | −1.946 | 0.000 | −1.748 | 0.000 |
| dTsk/dt | 3.536 | 0.001 | dTor/dt | 1.025 | 0.002 | ||||
| R-sq | 94.4% | 99% | R-sq | 91% | 98.4% | ||||
| V2 DE | Step 1 | Step 2 | V2 PE | Step 1 | |||
|---|---|---|---|---|---|---|---|
| Coef. | p | Coef. | p | Coef. | p | ||
| ∆Tsk | 3.171 | 0.000 | 4.255 | 0.000 | ∆Tor | −0.475 | 0.000 |
| ∆Tor | 1.696 | 0.000 | |||||
| R-sq | 88.2% | 98.9% | R-sq | 92.1% | |||
| TC | SFI | |||
|---|---|---|---|---|
| V1 | V2 | V1 | V2 | |
| TSV | −0.530 ** | −0.719 ** | 0.208 ** | 0.682 ** |
| TC | −0.302 ** | −0.528 ** | ||
| V1 | V2 | |||||||||||
|---|---|---|---|---|---|---|---|---|---|---|---|---|
| During Exercise | Post-Exercise | During Exercise | Post-Exercise | |||||||||
| Range of values | >5 (HS) | 3~5 (MS) | 2~3 (LS) | >5 (HS) | 3~5 (MS) | 2~3 (LS) | >5 (HS) | 3~5 (MS) | 2~3 (LS) | >5 (HS) | 3~5 (MS) | 2~3 (LS) |
| Propo -rtion | 38.3% | 57.9% | 3.8% | 21.5% | 72.0% | 6.5% | 84.1% | 14.3% | 1.6% | 35.9% | 53.0% | 11.1% |
| RMSSD |  |  |  |  | ||||||||
| Propo -rtion | 28.3% | 58% | 13.7% | 17.9% | 73.2% | 8.9% | 69.7% | 21.2% | 9.1% | 31.9% | 61.2% | 6.9% |
| SDNN |  |  |  |  | ||||||||
| Range of values | >3 (HS) | 1~3 (MS) | 0~1 (LS) | >3 (HS) | 1~3 (MS) | 0~1 (LS) | >3 (HS) | 1~3 (MS) | 0~1 (LS) | >3 (HS) | 1~3 (MS) | 0~1 (LS) |
| Propo -rtion | 12.8% | 35.2% | 52% | 13.92% | 33.04% | 53.04% | 13.34% | 36.19% | 50.47% | 23.64% | 43.64% | 32.72% |
| LF/HF |  |  |  |  | ||||||||
Publisher’s Note: MDPI stays neutral with regard to jurisdictional claims in published maps and institutional affiliations. |
© 2021 by the authors. Licensee MDPI, Basel, Switzerland. This article is an open access article distributed under the terms and conditions of the Creative Commons Attribution (CC BY) license (https://creativecommons.org/licenses/by/4.0/).
Share and Cite
Xu, Q.; Chen, L.; Chen, H.; Julien Dewancker, B. Exercise Thermal Sensation: Physiological Response to Dynamic–Static Steps at Moderate Exercise. Int. J. Environ. Res. Public Health 2021, 18, 4239. https://doi.org/10.3390/ijerph18084239
Xu Q, Chen L, Chen H, Julien Dewancker B. Exercise Thermal Sensation: Physiological Response to Dynamic–Static Steps at Moderate Exercise. International Journal of Environmental Research and Public Health. 2021; 18(8):4239. https://doi.org/10.3390/ijerph18084239
Chicago/Turabian StyleXu, Qinghao, Lin Chen, Hao Chen, and Bart Julien Dewancker. 2021. "Exercise Thermal Sensation: Physiological Response to Dynamic–Static Steps at Moderate Exercise" International Journal of Environmental Research and Public Health 18, no. 8: 4239. https://doi.org/10.3390/ijerph18084239