
Effects of Body Mass Index and Pay-for-Performance Program on Risk of Death in Patients with Type 2 Diabetes: A Nationwide Cohort Study

Abstract
:1. Introduction
2. Materials and Methods
2.1. Data Sources and Participants
2.2. Variables Description
2.3. Statistical Analysis
3. Results
3.1. Essential Characteristics of Patients with Type 2 Diabetes and Mortality Rate per 1000 Person-Years
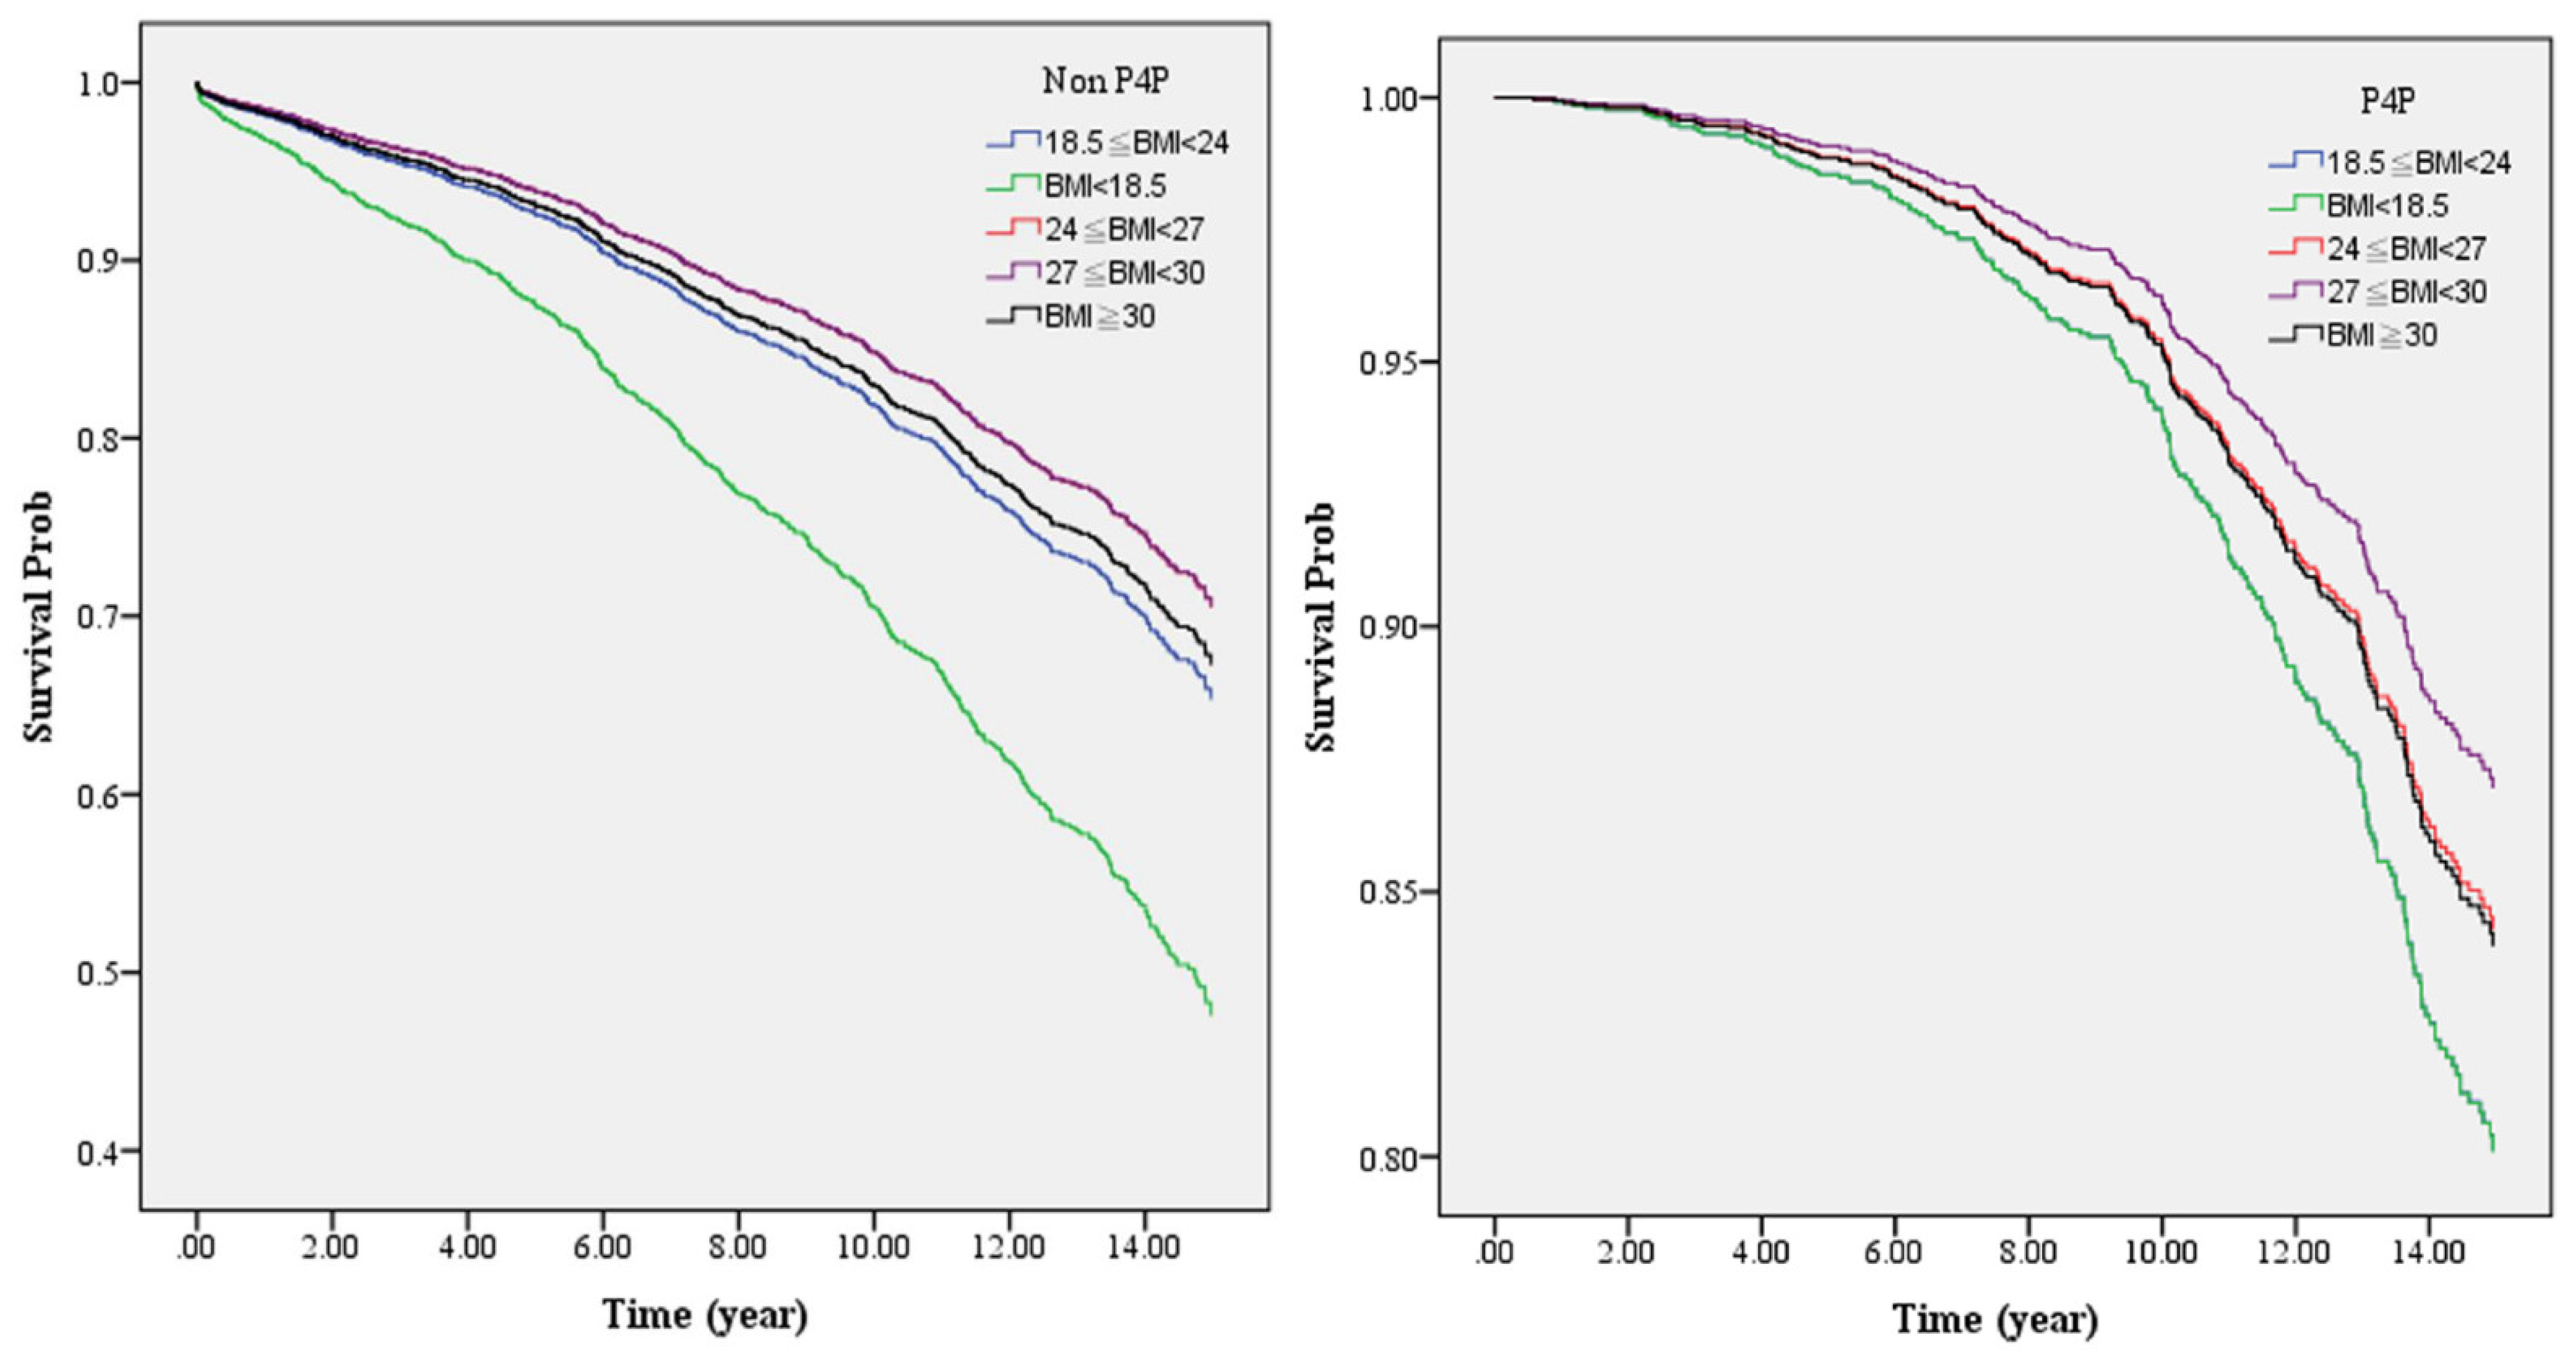
3.2. Comparison of Mortality Rate per 1000 Person-Years in DM Patients with Different BMIs in P4P or Non-P4P Program
3.3. The Effects of BMI and P4P on the Risk of Death in Patients with Type 2 Diabetes and Related Factors
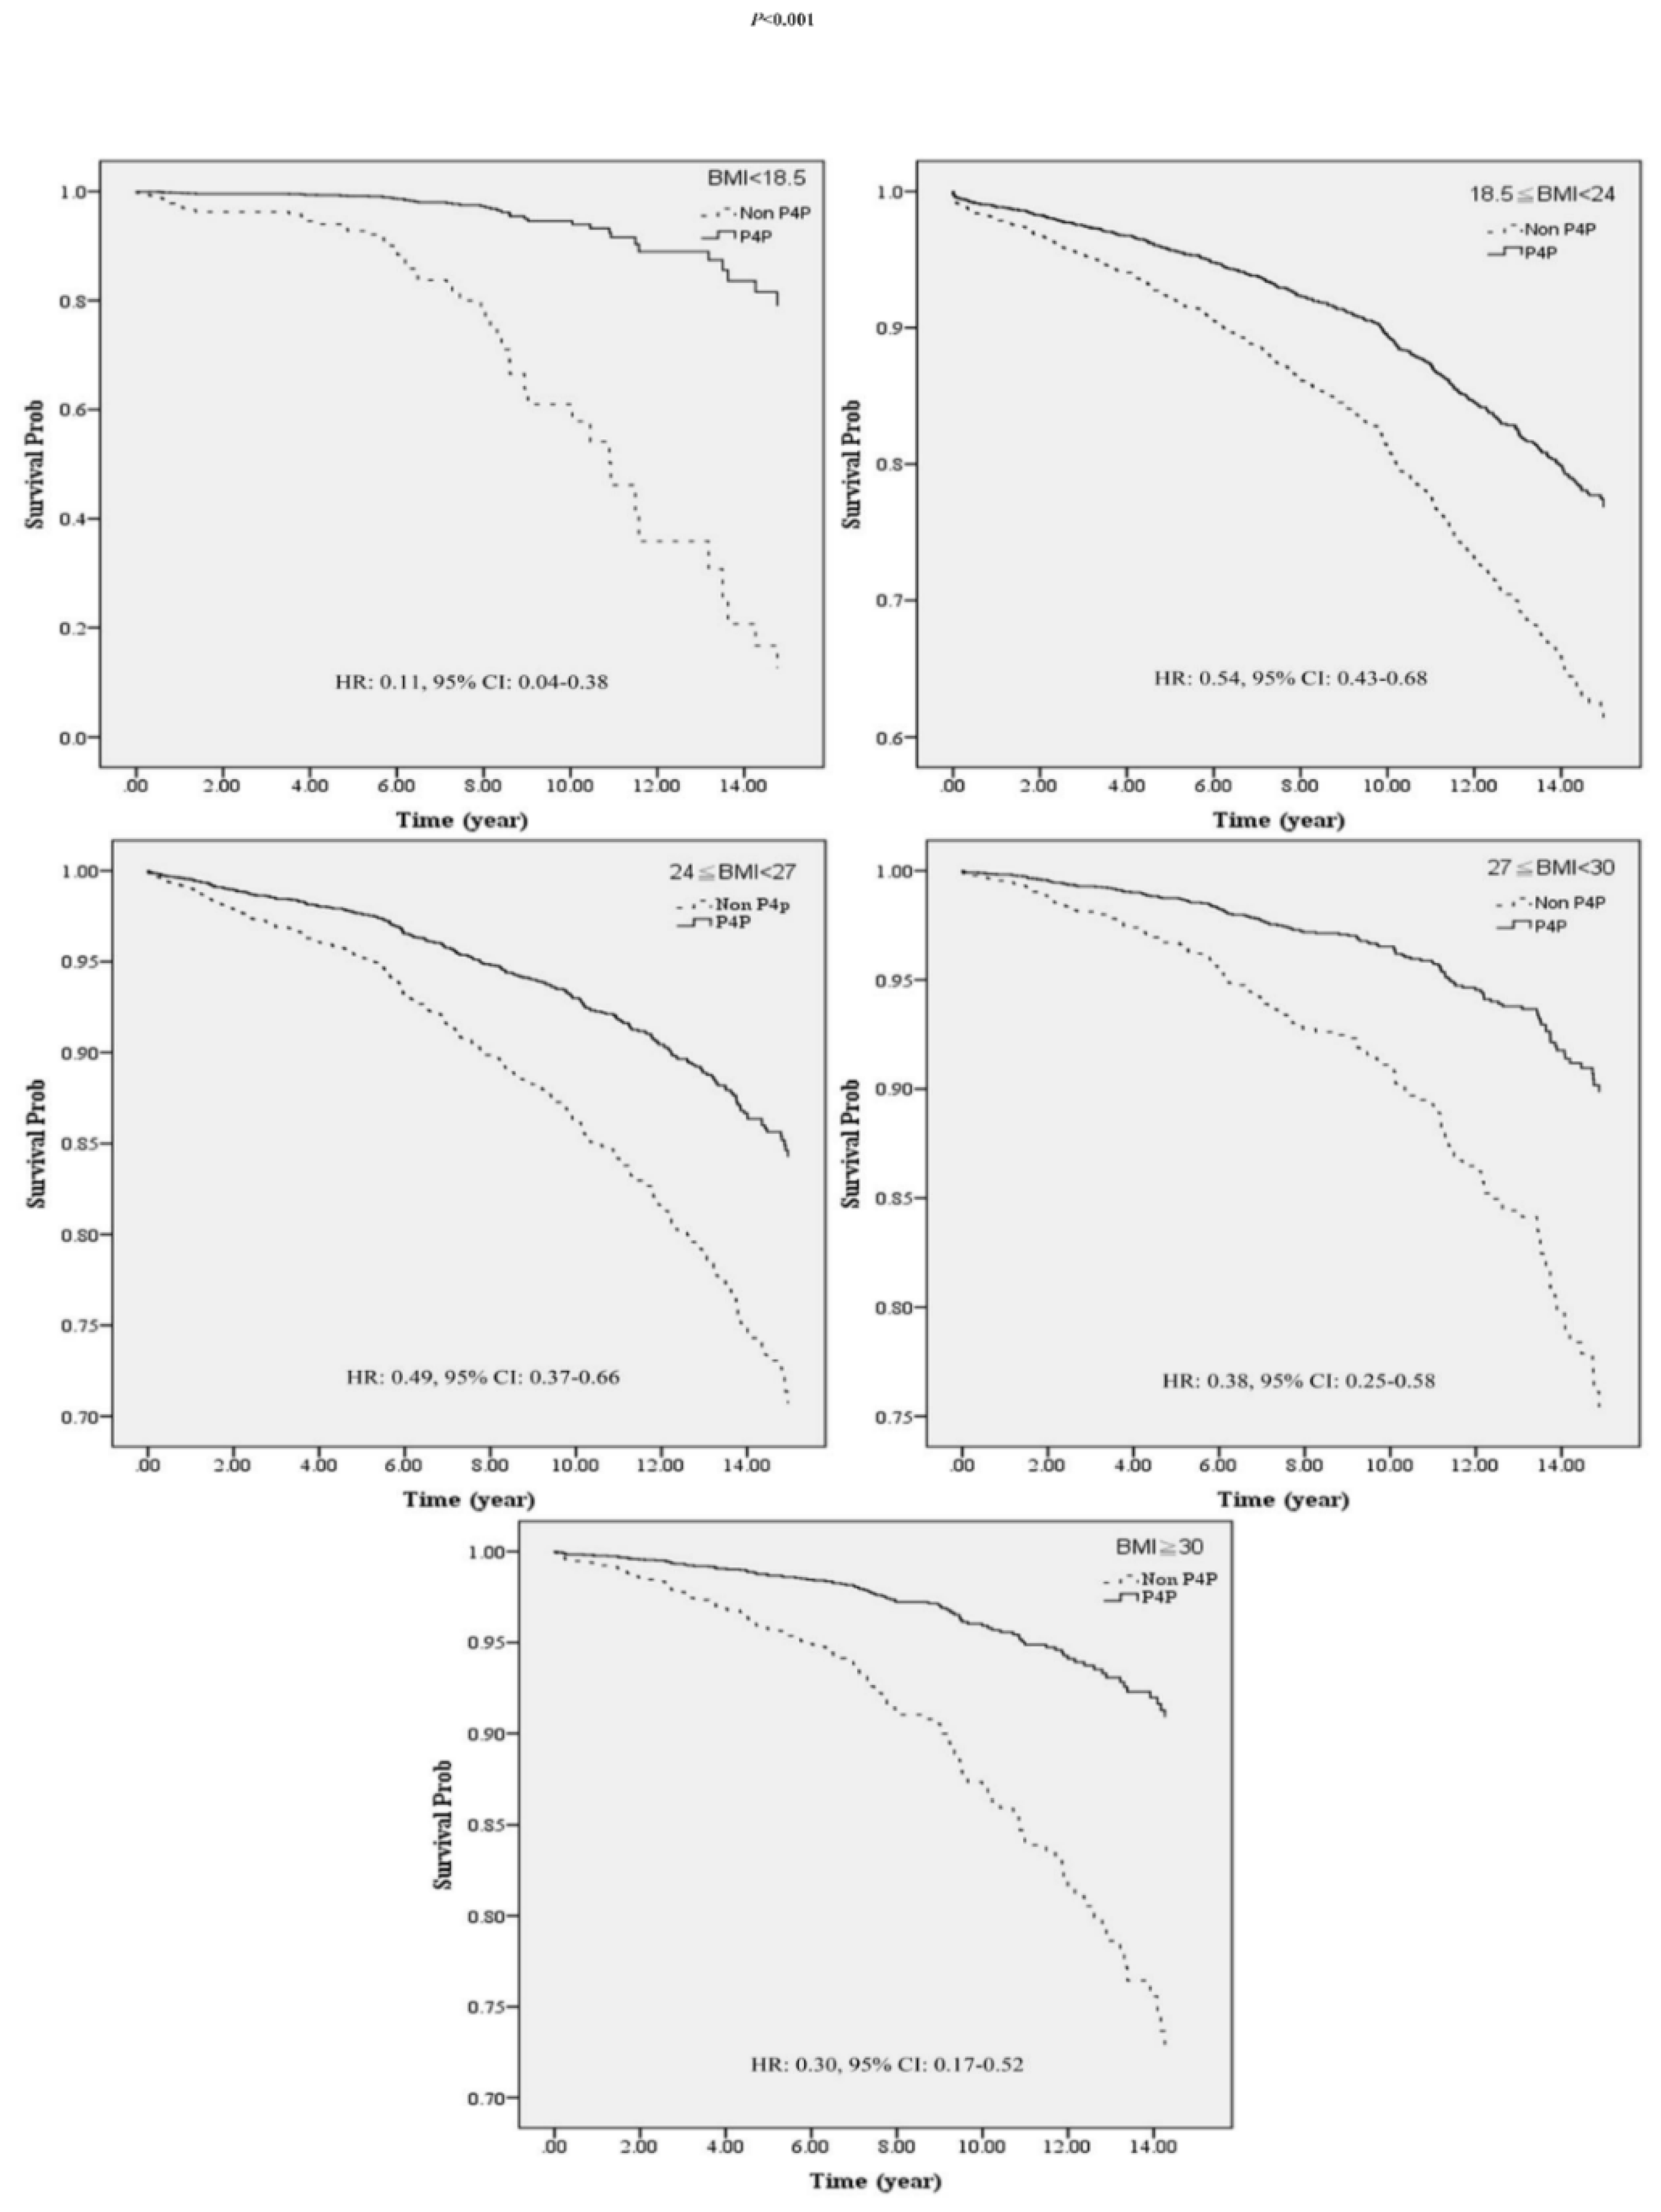
3.4. Comparing the Effects of P4P on Death Risk in Patients with Type 2 Diabetes at Different BMI Levels by Stratified Analysis
4. Discussion
5. Limitations
6. Conclusions
Author Contributions
Funding
Institutional Review Board Statement
Informed Consent Statement
Data Availability Statement
Acknowledgments
Conflicts of Interest
References
- International Diabetes Federation (IDF). About Diabetes. January 2019. Available online: https://www.diabetesatlas.org/en/ (accessed on 10 March 2021).
- Di Angelantonio, E.; Kaptoge, S.; Wormser, D.; Willeit, P.; Butterworth, A.S.; Bansal, N.; O’Keeffe, L.M.; Gao, P.; Wood, A.M.; Burgess, S. Association of cardiometabolic multimorbidity with mortality. JAMA 2015, 314, 52–60. [Google Scholar] [CrossRef]
- Huo, L.; Shaw, J.E.; Wong, E.; Harding, J.L.; Peeters, A.; Magliano, D.J. Burden of diabetes in Australia: Life expectancy and disability-free life expectancy in adults with diabetes. Diabetologia 2016, 59, 1437–1445. [Google Scholar] [CrossRef] [PubMed] [Green Version]
- Wang, C.H.; Tsai, A.C. A comparison of the abilities of Body Mass Index and waist circumference to predict the risk of diabetes in mid-and old-age Taiwanese. Taiwan Gong Gong Wei Sheng Za Zhi 2013, 32, 76. [Google Scholar]
- Hsu, W.C.; Araneta, M.R.G.; Kanaya, A.M.; Chiang, J.L.; Fujimoto, W. BMI Cut Points to Identify At-Risk Asian Americans for Type 2 Diabetes Screening. Diabetes Care 2015, 38, 150–158. [Google Scholar] [CrossRef] [Green Version]
- Wen, C.P.; Cheng, T.Y.D.; Tsai, S.P.; Chan, H.T.; Hsu, H.L.; Hsu, C.C.; Eriksen, M.P. Are Asians at greater mortality risks for being overweight than Caucasians? Redefining obesity for Asians. Public Heal. Nutr. 2008, 12, 497–506. [Google Scholar] [CrossRef] [PubMed] [Green Version]
- Berrington de Gonzalez, A.; Hartge, P.; Cerhan, J.R.; Flint, A.J.; Hannan, L.; MacInnis, R.J.; Moore, S.C.; Tobias, G.S.; Anton-Culver, H.; Freeman, L.B. Body-mass index and mortality among 1.46 million white adults. N. Engl. J. Med. 2010, 363, 2211–2219. [Google Scholar] [CrossRef] [Green Version]
- Compher, C.; Higashiguchi, T.; Yu, J.; Jensen, G.L. Does Low Body Mass Index Predict the Hospital Mortality of Adult Western or Asian Patients? J. Parenter. Enter. Nutr. 2017, 42, 467–472. [Google Scholar] [CrossRef] [PubMed]
- Bhaskaran, K.; Dos-Santos-Silva, I.; Leon, D.; Douglas, I.J.; Smeeth, L. Association of BMI with overall and cause-specific mortality: A population-based cohort study of 3·6 million adults in the UK. Lancet Diabetes Endocrinol. 2018, 6, 944–953. [Google Scholar] [CrossRef] [Green Version]
- Zaccardi, F.; Dhalwani, N.N.; Papamargaritis, D.; Webb, D.R.; Murphy, G.J.; Davies, M.J.; Khunti, K. Nonlinear association of BMI with all-cause and cardiovascular mortality in type 2 diabetes mellitus: A systematic review and meta-analysis of 414,587 participants in prospective studies. Diabetologia 2017, 60, 240–248. [Google Scholar] [CrossRef] [Green Version]
- Kwon, Y.; Kim, H.J.; Park, S.; Park, Y.-G.; Cho, K.-H. Body Mass Index-Related Mortality in Patients with Type 2 Diabetes and Heterogeneity in Obesity Paradox Studies: A Dose-Response Meta-Analysis. PLoS ONE 2017, 12, e0168247. [Google Scholar] [CrossRef] [Green Version]
- Edqvist, J.; Rawshani, A.; Adiels, M.; Björck, L.; Lind, M.; Svensson, A.-M.; Gudbjörnsdottir, S.; Sattar, N.; Rosengren, A. BMI and Mortality in Patients with New-Onset Type 2 Diabetes: A Comparison with Age- and Sex-Matched Control Subjects from the General Population. Diabetes Care 2018, 41, 485–493. [Google Scholar] [CrossRef] [Green Version]
- National Health Insurance Administration, Ministry of Health and Welfare. Diabetic Program. 2018. Available online: https://www.nhi.gov.tw/Default.aspx (accessed on 18 March 2020).
- Chen, Y.-C.; Lee, C.T.-C.; Lin, B.J.; Chang, Y.-Y.; Shi, H.-Y. Impact of pay-for-performance on mortality in diabetes patients in Taiwan: A population-based study. Medicine 2016, 95, e4197. [Google Scholar] [CrossRef]
- Mendelson, A.; Kondo, K.; Damberg, C.; Low, A.; Motúapuaka, M.; Freeman, M.; O’neil, M.; Relevo, R.; Kansagara, D. The Effects of Pay-for-Performance Programs on Health, Health Care Use, and Processes of Care A Systematic Review Effects of P4P Programs on Health, Health Care Use, and Processes of Care. Ann. Intern. Med. 2017, 166, 341–353. [Google Scholar] [CrossRef] [Green Version]
- Durham, C.C.; Bartol, K.M. Pay for performance. Handb. Princ. Organ. Behav. 2000, 1, 150–165. [Google Scholar]
- Tan, E.C.-H.; Pwu, R.-F.; Chen, D.-R.; Yang, M.-C. Is a diabetes pay-for-performance program cost-effective under the National Health Insurance in Taiwan? Qual. Life Res. 2013, 23, 687–696. [Google Scholar] [CrossRef]
- National Health Interview Survey. July 2016. Available online: http://nhis.nhri.org.tw/2005nhis.html (accessed on 15 July 2020).
- 2016–2017 Annual Report of National Health Insurance. A New National Health Insurance Era-moving toward Holistic Care in Keeping Taiwan Healthy. 2018. Available online: https://www.nhi.gov.tw/Resource/webdata/13767_1_National%20Health%20Insurance%20in%20Taiwan%202016-2017(bilingual).pdf (accessed on 15 June 2020).
- Cheng, T.-M. Taiwan’s New National Health Insurance Program: Genesis and Experience So Far. Health Aff. 2003, 22, 61–76. [Google Scholar] [CrossRef] [Green Version]
- Lu, J.-F.R.; Hsiao, W.C. Does universal health insurance make health care unaffordable? Lessons from Taiwan. Health Aff. 2003, 22, 77–88. [Google Scholar] [CrossRef]
- Tsai, W.-C.; Kung, P.-T.; Wang, Y.-H.; Huang, K.-H.; Liu, S.-A. Influence of time interval from diagnosis to treatment on survival for oral cavity cancer: A nationwide cohort study. PLoS ONE 2017, 12, e0175148. [Google Scholar] [CrossRef] [PubMed]
- Pan, C.-C.; Huang, H.-L.; Chen, M.-C.; Kung, C.-Y.; Kung, P.-T.; Chou, W.-Y.; Tsai, W.-C. Lower risk of end stage renal disease in diabetic nurse. Biomedicine 2017, 7, 25. [Google Scholar] [CrossRef] [PubMed] [Green Version]
- Chan, F.K.; Hsu, C.C.; Lin, H.J.; Wang, J.J.; Su, S.B.; Huang, C.C.; Weng, S.F. Physicians as well as nonphysician health care professionals in Taiwan have higher risk for lumbar herniated intervertebral disc than general population. Medicine 2018, 97, e9561. [Google Scholar] [CrossRef] [PubMed]
- Lee, I.-T.; Hsu, C.-C.; Sheu, W.H.-H.; Su, S.-L.; Wu, Y.-L.; Lin, S.-Y. Pay-for-performance for shared care of diabetes in Taiwan. J. Formos. Med Assoc. 2019, 118, S122–S129. [Google Scholar] [CrossRef] [PubMed]
- Yu, N.-C.; Su, H.-Y.; Chiou, S.-T.; Yeh, M.C.; Yeh, S.-W.; Tzeng, M.-S.; Sheu, W.H.-H. Trends of ABC control 2006–2011: A National Survey of Diabetes Health Promotion Institutes in Taiwan. Diabetes Res. Clin. Pract. 2013, 99, 112–119. [Google Scholar] [CrossRef]
- Lee, T.-T.; Cheng, S.-H.; Chen, C.-C.; Lai, M.-S. A pay-for-performance program for diabetes care in Taiwan: A preliminary assessment. Am. J. Manag. Care 2010, 16, 65–69. [Google Scholar] [PubMed]
- Gupta, N.; Ayles, H.M. Effects of pay-for-performance for primary care physicians on diabetes outcomes in single-payer health systems: A systematic review. Eur. J. Health Econ. 2019, 20, 1303–1315. [Google Scholar] [CrossRef]
- Hsieh, H.-M.; Lin, T.-H.; Lee, I.-C.; Huang, C.-J.; Shin, S.-J.; Chiu, H.-C. The association between participation in a pay-for-performance program and macrovascular complications in patients with type 2 diabetes in Taiwan: A nationwide population-based cohort study. Prev. Med. 2016, 85, 53–59. [Google Scholar] [CrossRef]
- Health Promotion Administration, Ministry of Health and Welfare. Health 99 Education Resource. 2017. Available online: http://health99.hpa.gov.tw/en/ (accessed on 13 April 2020).
- Chang, C.H.; Shau, W.Y.; Jiang, Y.D.; Li, H.Y.; Chang, T.J.; Sheu, W.; Kwok, C.F.; Ho, L.T.; Chuang, L.M. Type 2 diabetes prevalence and incidence among adults in Taiwan during 1999–2004: A national health insurance data set study. Diabet. Med. 2010, 27, 636–643. [Google Scholar] [CrossRef]
- Kung, F.-P.; Tsai, C.-F.; Lu, C.-L.; Huang, L.-C.; Lu, C.-H. Diabetes pay-for-performance program can reduce all-cause mortality in patients with newly diagnosed type 2 diabetes mellitus. Medicine 2020, 99, e19139. [Google Scholar] [CrossRef] [PubMed]
- Liu, C.-Y.; Hung, Y.; Chuang, Y.; Chen, Y.; Weng, W.; Liu, J.; Liang, K. Incorporating development stratification of Taiwan townships into sampling design of large scale health interview survey. J. Health Manag. 2006, 4, 1–22. [Google Scholar]
- Deyo, R.A.; Cherkin, D.C.; Ciol, M.A. Adapting a clinical comorbidity index for use with ICD-9-CM administrative databases. J. Clin. Epidemiol. 1992, 45, 613–619. [Google Scholar] [CrossRef]
- Young, B.A.; Lin, E.; Von Korff, M.; Simon, G.; Ciechanowski, P.; Ludman, E.J.; Everson-Stewart, S.; Kinder, L.; Oliver, M.; Boyko, E.J.; et al. Diabetes complications severity index and risk of mortality, hospitalization, and healthcare utilization. Am. J. Manag. Care 2008, 14, 15–23. [Google Scholar]
- Wen, C.-P.; Wai, J.P.-M.; Chan, H.-T.; Chan, Y.-C.; Chiang, P.-H.; Cheng, T.-Y. Evaluating the physical activity policy in Taiwan: Comparison of the prevalence of physical activity between Taiwan and the US. Taiwan J. Public Health 2007, 26, 386–399. [Google Scholar]
- Pan, C.-C.; Kung, P.-T.; Chiu, L.-T.; Liao, Y.P.; Tsai, W.-C. Patients with diabetes in pay-for-performance programs have better physician continuity of care and survival. Am. J. Manag. Care 2017, 23.2, e57–e66. [Google Scholar]
- Wu, Y.-F.; Chen, M.-Y.; Chen, T.-H.; Wang, P.-C.; Peng, Y.-S.; Lin, M.-S. The effect of pay-for-performance program on infection events and mortality rate in diabetic patients: A nationwide population-based cohort study. BMC Health Serv. Res. 2021, 21, 1–10. [Google Scholar] [CrossRef] [PubMed]
- Tobias, D.K.; Pan, A.; Jackson, C.L.; O’Reilly, E.J.; Ding, E.L.; Willett, W.C.; Manson, J.E.; Hu, F.B. Body-Mass Index and Mortality among Adults with Incident Type 2 Diabetes. N. Engl. J. Med. 2014, 370, 233–244. [Google Scholar] [CrossRef] [PubMed] [Green Version]
- Vestberg, D.; Rosengren, A.; Eeg-Olofsson, K.; Miftaraj, M.; Franzen, S.; Svensson, A.-M.; Lind, M. Body mass index as a risk factor for coronary events and mortality in patients with type 1 diabetes. Open Hear. 2018, 5, e000727. [Google Scholar] [CrossRef] [Green Version]
- Liu, X.-M.; Liu, Y.-J.; Zhan, J.; He, Q.-Q. Overweight, Obesity and Risk of All-Cause and Cardiovascular Mortality in Patients with Type 2 Diabetes Mellitus: A Dose–Response Meta-Analysis of Prospective Cohort Studies; Springer: Berlin/Heidelberg, Germany, 2015. [Google Scholar]
- Huang, H.-L.; Pan, C.-C.; Hsiao, Y.-F.; Chen, M.-C.; Kung, C.-Y.; Kung, P.-T.; Tsai, W.-C. Associations of body mass index and diabetes with hip fracture risk: A nationwide cohort study. BMC Public Health 2018, 18, 1325. [Google Scholar] [CrossRef]


| Variable | Total | % | non-P4P | P4P | p-Value | ||
|---|---|---|---|---|---|---|---|
| n | % | n | % | ||||
| Total | 6354 | 100.00 | 4408 | 69.37 | 1946 | 30.63 | |
| BMI | <0.001 | ||||||
| BMI < 18.5 | 133 | 2.09 | 108 | 2.45 | 25 | 1.28 | |
| 18.5 ≤ BMI < 24 | 2064 | 32.48 | 1483 | 33.64 | 581 | 29.86 | |
| 24 ≤ BMI < 27 | 2064 | 32.48 | 1421 | 32.24 | 643 | 33.04 | |
| 27 ≤ BMI < 30 | 1240 | 19.52 | 834 | 18.92 | 406 | 20.86 | |
| BMI ≥ 30 | 853 | 13.42 | 562 | 12.75 | 291 | 14.95 | |
| P4P | |||||||
| No | 4408 | 69.37 | - | - | - | - | |
| Yes | 1946 | 30.63 | - | - | - | - | |
| Survival | <0.001 | ||||||
| No | 5192 | 81.71 | 3474 | 78.81 | 1718 | 88.28 | |
| Yes | 1162 | 18.29 | 934 | 21.19 | 228 | 11.72 | |
| Sex | 0.236 | ||||||
| Male | 3328 | 52.38 | 2331 | 52.88 | 997 | 51.23 | |
| Female | 3026 | 47.62 | 2077 | 47.12 | 949 | 48.77 | |
| Age | <0.001 | ||||||
| 20–44 | 1020 | 16.05 | 684 | 15.52 | 336 | 17.27 | |
| 45–54 | 1619 | 25.48 | 1043 | 23.66 | 576 | 29.60 | |
| 55–64 | 1760 | 27.70 | 1163 | 26.38 | 597 | 30.68 | |
| 65–74 | 1228 | 19.33 | 901 | 20.44 | 327 | 16.80 | |
| ≥75 | 727 | 11.44 | 617 | 14.00 | 110 | 5.65 | |
| Education Level | 0.041 | ||||||
| None or Literate | 917 | 14.43 | 673 | 15.27 | 244 | 12.54 | |
| Elementary | 2299 | 36.18 | 1561 | 35.41 | 738 | 37.92 | |
| Junior | 998 | 15.71 | 684 | 15.52 | 314 | 16.14 | |
| Senior | 1276 | 20.08 | 894 | 20.28 | 382 | 19.63 | |
| College or above | 846 | 13.31 | 586 | 13.29 | 260 | 13.36 | |
| Missing | 18 | 0.28 | |||||
| Marital Status | 0.001 | ||||||
| Married | 4715 | 74.21 | 3218 | 73.00 | 1497 | 76.93 | |
| Divorced | 266 | 4.19 | 177 | 4.02 | 89 | 4.57 | |
| Widowed | 704 | 11.08 | 517 | 11.73 | 187 | 9.61 | |
| Never married | 661 | 10.40 | 491 | 11.14 | 170 | 8.74 | |
| Missing | 8 | 0.13 | |||||
| Urbanization of Residence Area | 0.006 | ||||||
| Level 1 | 1326 | 20.87 | 962 | 21.82 | 364 | 18.71 | |
| Level 2 | 1929 | 30.36 | 1309 | 29.70 | 620 | 31.86 | |
| Level 3 | 940 | 14.79 | 658 | 14.93 | 282 | 14.49 | |
| Level 5 | 1237 | 19.47 | 830 | 18.83 | 407 | 20.91 | |
| Level 4 | 199 | 3.13 | 154 | 3.49 | 45 | 2.31 | |
| Level 6 | 420 | 6.61 | 284 | 6.44 | 136 | 6.99 | |
| Level 7 | 303 | 4.77 | 211 | 4.79 | 92 | 4.73 | |
| Monthly Salary (NTD) | 0.042 | ||||||
| ≤17,280 | 1403 | 22.08 | 1018 | 23.09 | 385 | 19.78 | |
| 17,281–22,800 | 2879 | 45.31 | 1979 | 44.90 | 900 | 46.25 | |
| 22,801–28,800 | 417 | 6.56 | 273 | 6.19 | 144 | 7.40 | |
| 28,801–36,300 | 502 | 7.90 | 339 | 7.69 | 163 | 8.38 | |
| 36,301–45,800 | 546 | 8.59 | 373 | 8.46 | 173 | 8.89 | |
| ≥45,801 | 607 | 9.55 | 426 | 9.66 | 181 | 9.30 | |
| CCI | 0.013 | ||||||
| 0 | 3550 | 55.87 | 2425 | 55.01 | 1125 | 57.81 | |
| 1 | 1354 | 21.31 | 969 | 21.98 | 385 | 19.78 | |
| 2 | 819 | 12.89 | 552 | 12.52 | 267 | 13.72 | |
| ≥3 | 631 | 9.93 | 462 | 10.48 | 169 | 8.68 | |
| DCSI | <0.001 | ||||||
| 0 | 4942 | 77.78 | 3458 | 78.45 | 1484 | 76.26 | |
| 1 | 706 | 11.11 | 420 | 9.53 | 286 | 14.70 | |
| 2 | 547 | 8.61 | 409 | 9.28 | 138 | 7.09 | |
| ≥3 | 159 | 2.50 | 121 | 2.75 | 38 | 1.95 | |
| Smoking | 0.211 | ||||||
| Never | 4526 | 71.23 | 3110 | 70.55 | 1416 | 72.76 | |
| Everyday | 1525 | 24.00 | 1083 | 24.57 | 442 | 22.71 | |
| Quit | 297 | 4.67 | 210 | 4.76 | 87 | 4.47 | |
| Missing | 6 | 0.09 | |||||
| Drinking | 0.013 | ||||||
| Never | 4618 | 72.68 | 3216 | 72.96 | 1402 | 72.05 | |
| Once a week | 880 | 13.85 | 577 | 13.09 | 303 | 15.57 | |
| Almost every day | 843 | 13.27 | 606 | 13.75 | 237 | 12.18 | |
| Missing | 13 | 0.20 | |||||
| Weekly Energy Expenditure in Exercise | 0.044 | ||||||
| No exercise | 2997 | 47.17 | 2123 | 48.16 | 874 | 44.91 | |
| <500 kcal | 1193 | 18.78 | 819 | 18.58 | 374 | 19.22 | |
| ≥500 kcal | 2156 | 33.93 | 1459 | 33.10 | 697 | 35.82 | |
| Missing | 8 | 0.13 | |||||
| Primary Health Care Organizations | <0.001 | ||||||
| Medical center | 1242 | 19.55 | 909 | 20.62 | 333 | 17.11 | |
| Regional hospital | 1946 | 30.63 | 1223 | 27.75 | 723 | 37.15 | |
| District hospital | 1274 | 20.05 | 887 | 20.12 | 387 | 19.89 | |
| Community clinic | 1892 | 29.78 | 1389 | 31.51 | 503 | 25.85 | |
| Variable | Total | Death (N) | Total Person-Years | Incidence/1000 Person-Years | p-Value # |
|---|---|---|---|---|---|
| Total | 6354 | 1162 | 51,233.56 | 22.68 | - |
| BMI | |||||
| BMI < 18.5 | 133 | 60 | 982.83 | 61.05 | <0.001 |
| 18.5 ≤ BMI < 24 | 2064 | 512 | 17,090.74 | 29.96 | - |
| 24 ≤ BMI < 27 | 2064 | 319 | 16,610.69 | 19.20 | <0.001 |
| 27 ≤ BMI < 30 | 1240 | 159 | 9947.51 | 15.98 | <0.001 |
| BMI ≥ 30 | 853 | 112 | 6601.78 | 16.97 | <0.001 |
| P4P | |||||
| No | 4408 | 934 | 32,503.77 | 28.74 | - |
| Yes | 1946 | 228 | 18,729.79 | 12.17 | <0.001 |
| Sex | |||||
| Male | 3328 | 686 | 25,940.12 | 26.45 | - |
| Female | 3026 | 476 | 25,293.43 | 18.82 | <0.001 |
| Age | |||||
| 20–44 | 1020 | 69 | 8430.75 | 8.18 | - |
| 45–54 | 1619 | 144 | 13,703.10 | 10.51 | 0.088 |
| 55–64 | 1760 | 230 | 14,817.12 | 15.52 | <0.001 |
| 65–74 | 1228 | 362 | 9906.48 | 36.54 | <0.001 |
| ≥75 | 727 | 357 | 4376.11 | 81.58 | <0.001 |
| Education Level | |||||
| None or Literate | 917 | 313 | 8001.55 | 39.12 | - |
| Elementary | 2299 | 496 | 19,195.10 | 25.84 | <0.001 |
| Junior | 998 | 126 | 7814.75 | 16.12 | <0.001 |
| Senior | 1276 | 139 | 9586.19 | 14.50 | <0.001 |
| College or above | 846 | 78 | 6523.90 | 11.96 | <0.001 |
| Missing | 18 | ||||
| Marital Status | |||||
| Married | 4715 | 758 | 38,788.19 | 19.54 | - |
| Divorced | 266 | 40 | 1946.93 | 20.55 | 0.758 |
| Widowed | 704 | 203 | 5935.65 | 34.20 | <0.001 |
| Never married | 661 | 159 | 4509.52 | 35.26 | <0.001 |
| Missing | 8 | ||||
| Urbanization of Residence Area | |||||
| Level 1 | 1326 | 221 | 10,999.86 | 20.09 | - |
| Level 2 | 1929 | 309 | 15,803.21 | 19.55 | 0.004 |
| Level 3 | 940 | 171 | 7619.56 | 22.44 | 0.001 |
| Level 5 | 1237 | 253 | 9580.61 | 26.41 | 0.047 |
| Level 4 | 199 | 43 | 1495.23 | 28.76 | 0.384 |
| Level 6 | 420 | 92 | 3272.64 | 28.11 | 0.874 |
| Level 7 | 303 | 73 | 2462.44 | 29.65 | 0.735 |
| Monthly Salary (NTD) | |||||
| ≤17,280 | 1403 | 340 | 11,247.83 | 30.23 | - |
| 17,281–22,800 | 2879 | 572 | 24,138.51 | 23.70 | <0.001 |
| 22,801–28,800 | 417 | 45 | 3301.53 | 13.63 | <0.001 |
| 28,801–36,300 | 502 | 58 | 3768.27 | 15.39 | <0.001 |
| 36,301–45,800 | 546 | 67 | 4045.07 | 16.56 | <0.001 |
| ≥45,801 | 607 | 80 | 4732.34 | 16.90 | <0.001 |
| CCI | |||||
| 0 | 3550 | 406 | 28,926.31 | 14.04 | - |
| 1 | 1354 | 266 | 10,878.79 | 24.45 | <0.001 |
| 2 | 819 | 200 | 6834.13 | 29.26 | <0.001 |
| ≥3 | 631 | 290 | 4594.32 | 63.12 | <0.001 |
| DCSI | |||||
| 0 | 4942 | 760 | 39,569.14 | 19.21 | - |
| 1 | 706 | 135 | 6396.50 | 21.11 | 0.313 |
| 2 | 547 | 191 | 4029.83 | 47.40 | <0.001 |
| ≥3 | 159 | 76 | 1238.08 | 61.39 | <0.001 |
| Smoking | |||||
| Never | 4526 | 747 | 37,833.21 | 19.74 | - |
| Everyday | 1525 | 303 | 10,946.25 | 27.68 | <0.001 |
| Quit | 297 | 111 | 2426.88 | 45.74 | <0.001 |
| Missing | 6 | ||||
| Drinking | |||||
| Never | 4618 | 932 | 38,379.95 | 24.28 | - |
| Once a week | 880 | 104 | 6776.01 | 15.35 | <0.001 |
| Almost everyday | 843 | 125 | 5979.73 | 20.90 | 0.116 |
| Missing | 13 | ||||
| Weekly Energy Expenditure in Exercise | |||||
| No exercise | 2997 | 615 | 22,852.01 | 26.91 | - |
| <500 kcal | 1193 | 199 | 9958.23 | 19.98 | <0.001 |
| ≥500 kcal | 2156 | 346 | 18,376.51 | 18.83 | <0.001 |
| Missing | 8 | ||||
| Primary Healthcare Organizations | |||||
| Medical center | 1242 | 280 | 10,397.39 | 26.93 | - |
| Regional hospital | 1946 | 408 | 16,027.29 | 25.46 | 0.469 |
| District hospital | 1274 | 265 | 10,196.84 | 25.99 | 0.678 |
| Community clinic | 1892 | 209 | 14,612.03 | 14.30 | <0.001 |
| Non-P4P | P4P | ||||||||
|---|---|---|---|---|---|---|---|---|---|
| Variable | Total | Death (N) | Total Person-Years | Incidence/ 1000 Person-Years | Total | Death (N) | Total Person-Years | Incidence/ 1000 Person-Years | p-Value # |
| Total | 4408 | 934 | 32,503.77 | 28.74 | 1946 | 228 | 18,729.79 | 12.17 | <0.001 |
| BMI | |||||||||
| BMI < 18.5 | 108 | 52 | 696.91 | 74.62 | 25 | 8 | 285.92 | 27.98 | 0.010 |
| 18.5 ≤ BMI < 24 | 1483 | 411 | 11,189.29 | 36.73 | 581 | 101 | 5901.45 | 17.11 | <0.001 |
| 24 ≤ BMI < 27 | 1421 | 252 | 10,435.89 | 24.15 | 643 | 67 | 6174.80 | 10.85 | <0.001 |
| 27 ≤ BMI < 30 | 834 | 126 | 6148.21 | 20.49 | 406 | 33 | 3799.30 | 8.69 | <0.001 |
| BMI ≥ 30 | 562 | 93 | 4033.47 | 23.06 | 291 | 19 | 2568.32 | 7.40 | <0.001 |
| Sex | |||||||||
| Male | 2331 | 556 | 16,693.68 | 33.31 | 997 | 130 | 9246.44 | 14.06 | <0.001 |
| Female | 2077 | 378 | 15,810.08 | 23.91 | 949 | 98 | 9483.35 | 10.33 | <0.001 |
| Age | |||||||||
| 20–44 | 684 | 57 | 5385.08 | 10.58 | 336 | 12 | 3045.67 | 3.94 | 0.002 |
| 45–54 | 1043 | 111 | 8048.34 | 13.79 | 576 | 33 | 5654.76 | 5.84 | <0.001 |
| 55–64 | 1163 | 155 | 8901.86 | 17.41 | 597 | 75 | 5915.26 | 12.68 | 0.024 |
| 65–74 | 901 | 286 | 6646.42 | 43.03 | 327 | 76 | 3260.07 | 23.31 | <0.001 |
| ≥75 | 617 | 325 | 3522.07 | 92.28 | 110 | 32 | 854.04 | 37.47 | <0.001 |
| CCI | |||||||||
| 0 | 2425 | 317 | 18,291.86 | 17.33 | 1125 | 89 | 10,634.45 | 8.37 | <0.001 |
| 1 | 969 | 219 | 7157.38 | 30.60 | 385 | 47 | 3721.41 | 12.63 | <0.001 |
| 2 | 552 | 153 | 4150.19 | 36.87 | 267 | 47 | 2683.95 | 17.51 | <0.001 |
| ≥3 | 462 | 245 | 2904.34 | 84.36 | 169 | 45 | 1689.98 | 26.63 | <0.001 |
| DCSI | |||||||||
| 0 | 3458 | 600 | 25,386.28 | 23.63 | 1484 | 160 | 14,182.85 | 11.28 | <0.001 |
| 1 | 420 | 100 | 3513.65 | 28.46 | 286 | 35 | 2882.86 | 12.14 | <0.001 |
| 2 | 409 | 168 | 2772.19 | 60.60 | 138 | 23 | 1257.64 | 18.29 | <0.001 |
| ≥3 | 121 | 66 | 831.65 | 79.36 | 38 | 10 | 406.44 | 24.60 | 0.001 |
| Weekly Energy Expenditure in Exercise | |||||||||
| No exercise | 2123 | 519 | 14,926.12 | 34.77 | 874 | 96 | 7925.88 | 12.11 | <0.001 |
| <500 kcal | 819 | 152 | 6212.30 | 24.47 | 374 | 47 | 3745.92 | 12.55 | <0.001 |
| ≥500 kcal | 1459 | 261 | 11,320.28 | 23.06 | 697 | 85 | 7056.22 | 12.05 | <0.001 |
| missing | 7 | 1 | |||||||
| Variable | Unadjusted Model | Adjusted Model | ||||||
|---|---|---|---|---|---|---|---|---|
| HR | 95% CI | p-Value | HR | 95% CI | p-Value | |||
| BMI | ||||||||
| BMI < 18.5 | 2.12 | 1.62 | 2.77 | <0.001 | 1.86 | 1.37 | 2.53 | <0.001 |
| 18.5 ≤ BMI < 24 | 1.00 | - | - | - | 1.00 | - | - | - |
| 24 ≤ BMI < 27 | 0.66 | 0.57 | 0.76 | <0.001 | 0.83 | 0.71 | 0.97 | 0.023 |
| 27 ≤ BMI < 30 | 0.54 | 0.46 | 0.65 | <0.001 | 0.83 | 0.68 | 1.02 | 0.070 |
| BMI ≥ 30 | 0.59 | 0.48 | 0.73 | <0.001 | 0.95 | 0.75 | 1.20 | 0.668 |
| P4P | ||||||||
| No | 1.00 | - | - | - | 1.00 | - | - | - |
| Yes | 0.39 | 0.34 | 0.45 | <0.001 | 0.55 | 0.44 | 0.69 | <0.001 |
| P4P*BMI | ||||||||
| P4P*(BMI < 18.5) | 0.86 | 0.41 | 1.82 | 0.699 | ||||
| P4P*(18.5 ≤ BMI < 24) | 1.00 | - | - | - | ||||
| P4P*(24 ≤ BMI < 27) | 0.39 | 0.30 | 0.49 | <0.001 | ||||
| P4P*(27 ≤ BMI < 30) | 0.30 | 0.21 | 0.43 | <0.001 | ||||
| P4P*(BMI ≥ 30) | 0.27 | 0.17 | 0.43 | <0.001 | ||||
| Sex | ||||||||
| Male | 1.00 | - | - | - | 1.00 | - | - | - |
| Female | 0.69 | 0.62 | 0.78 | <0.001 | 0.67 | 0.57 | 0.78 | <0.001 |
| Age | ||||||||
| 20–44 | 1.00 | - | - | - | 1.00 | - | - | - |
| 45–54 | 1.26 | 0.95 | 1.68 | 0.110 | 1.32 | 0.98 | 1.78 | 0.067 |
| 55–64 | 1.84 | 1.40 | 2.40 | <0.001 | 1.71 | 1.28 | 2.29 | <0.001 |
| 65–74 | 4.41 | 3.41 | 5.71 | <0.001 | 3.30 | 2.48 | 4.38 | <0.001 |
| ≥75 | 11.01 | 8.50 | 14.26 | <0.001 | 6.32 | 4.72 | 8.45 | <0.001 |
| CCI | ||||||||
| 0 | 1.00 | - | - | - | 1.00 | - | - | - |
| 1 | 1.74 | 1.49 | 2.03 | <0.001 | 1.33 | 1.13 | 1.56 | <0.001 |
| 2 | 2.02 | 1.71 | 2.40 | <0.001 | 1.52 | 1.27 | 1.82 | <0.001 |
| ≥3 | 4.43 | 3.81 | 5.16 | <0.001 | 2.43 | 2.04 | 2.88 | <0.001 |
| DCSI | ||||||||
| 0 | 1.00 | - | - | - | 1.00 | - | - | - |
| 1 | 1.05 | 0.87 | 1.26 | 0.637 | 0.84 | 0.69 | 1.01 | 0.065 |
| 2 | 2.48 | 2.12 | 2.91 | <0.001 | 1.21 | 1.02 | 1.44 | 0.031 |
| ≥3 | 3.07 | 2.43 | 3.89 | <0.001 | 1.20 | 0.93 | 1.55 | 0.167 |
| Weekly Energy Expenditure in Exercise | ||||||||
| No exercise | 1.00 | - | - | - | 1.00 | - | - | - |
| <500 kcal | 0.72 | 0.61 | 0.84 | <0.001 | 0.85 | 0.73 | 1.01 | 0.059 |
| ≥500 kcal | 0.68 | 0.60 | 0.78 | <0.001 | 0.82 | 0.72 | 0.95 | 0.006 |
| Non-P4P | P4P | Adj. HR | 95% CI | p-Value | ||||||
|---|---|---|---|---|---|---|---|---|---|---|
| N | Death | N | Death | (P4P vs. Non-P4P) | ||||||
| Variable | n | % | n | % | ||||||
| Total | 4408 | 934 | 21.19 | 1946 | 228 | 11.72 | ||||
| BMI | ||||||||||
| BMI < 18.5 | 108 | 52 | 48.15 | 25 | 8 | 32.00 | 0.11 | 0.04 | 0.38 | <0.001 |
| 18.5 ≤ BMI < 24 | 1483 | 411 | 27.71 | 581 | 101 | 17.38 | 0.54 | 0.43 | 0.68 | <0.001 |
| 24 ≤ BMI < 27 | 1421 | 252 | 17.73 | 643 | 67 | 10.42 | 0.49 | 0.37 | 0.66 | <0.001 |
| 27 ≤ BMI < 30 | 834 | 126 | 15.11 | 406 | 33 | 8.13 | 0.38 | 0.25 | 0.58 | <0.001 |
| BMI ≥ 30 | 562 | 93 | 16.55 | 291 | 19 | 6.53 | 0.30 | 0.17 | 0.52 | <0.001 |
Publisher’s Note: MDPI stays neutral with regard to jurisdictional claims in published maps and institutional affiliations. |
© 2021 by the authors. Licensee MDPI, Basel, Switzerland. This article is an open access article distributed under the terms and conditions of the Creative Commons Attribution (CC BY) license (https://creativecommons.org/licenses/by/4.0/).
Share and Cite
Huang, H.-L.; Kung, C.-Y.; Wang, S.-M.; Kung, P.-T.; Lin, Y.-H.; Chiu, L.-T.; Tsai, W.-C. Effects of Body Mass Index and Pay-for-Performance Program on Risk of Death in Patients with Type 2 Diabetes: A Nationwide Cohort Study. Int. J. Environ. Res. Public Health 2021, 18, 4648. https://doi.org/10.3390/ijerph18094648
Huang H-L, Kung C-Y, Wang S-M, Kung P-T, Lin Y-H, Chiu L-T, Tsai W-C. Effects of Body Mass Index and Pay-for-Performance Program on Risk of Death in Patients with Type 2 Diabetes: A Nationwide Cohort Study. International Journal of Environmental Research and Public Health. 2021; 18(9):4648. https://doi.org/10.3390/ijerph18094648
Chicago/Turabian StyleHuang, Hsiu-Ling, Chuan-Yu Kung, Shun-Mu Wang, Pei-Tseng Kung, Yen-Hsiung Lin, Li-Ting Chiu, and Wen-Chen Tsai. 2021. "Effects of Body Mass Index and Pay-for-Performance Program on Risk of Death in Patients with Type 2 Diabetes: A Nationwide Cohort Study" International Journal of Environmental Research and Public Health 18, no. 9: 4648. https://doi.org/10.3390/ijerph18094648