Abstract
Both color and structure make important contributions to human visual perception, as well as the evaluation of landscape quality and landscape aesthetics. The EEG equipment liveamp32 was used to record the EEG signals of humans when viewing landscape images, structure images with filtered color, and color images with a filtered structure. The results show that the SVM classifier was the most suitable classifier for landscape classification based on EEG features. The classification accuracy of the landscape picture recognition was up to 98.3% when using beta waves, while the accuracy of the color recognition was 97.5%, and that of the structure recognition was 93.9% when using gamma waves. Secondly, color and structure played a major role in determining the alpha and gamma wave responses, respectively, for all the landscape types, including forest, desert, and water. Furthermore, structure only played a decisive role in forest, while color played a major role in desert and water when using beta waves. Lastly, statistically significant differences between landscape groups and scenario groups with regard to alpha, beta, and gamma rhythms in brain waves were confirmed. The reasonable usage and layout of structure and color will have a very important guiding value for landscape aesthetics in future landscape design and landscape planning.
1. Introduction
The measurement of brain activity is an objective way of assessing the physiological perception of engagement with the landscape, environment, or other objects [1,2,3]. Brain imaging is helpful to measure the effects of unconscious stimuli [4,5]. Research has discussed the interplay between landscape types and the physiological response of human beings. Recent laboratory-based neuroimaging studies indicated that various environments may be associated with characteristic patterns of brain activity [6,7]. EEG frequency features have commonly been used in EEG signals. Generally, high-amplitude signals in the low-frequency range are observed when the subjects are in a calm state, whereas high-amplitude signals in the high-frequency range are obvious in a stimulated state [8,9]. EEG features (frequency-domain features, time-domain features, and spatial-domain features) in EEG signals represent the brain region activities. Thus far, there have been many studies using EEG technology and machine learning for recognition with good classification accuracy, e.g., emotion recognition [10,11,12,13], object structure recognition [14,15], color recognition [16], and landscape and animal image recognition [17]. Some studies have gradually applied EEG technology to different fields, including environmental perception and landscape assessment [6,18,19,20], while others have also explored the impact of specific environmental characteristics on the natural environment [21,22,23].
Color is a basic aspect of human perception. It is known that color also affects human spirit and emotion. Moods and behaviors can be changed by colors [24]. Color signals improved the survival of early humans [25,26]. Differences in human color perception according to physical and psychological experiments have been discussed [27]. British color planning expert Lancaster proposed the concept of “color landscape”. Expressing that a localized or personalized landscape can be achieved by controlling the color of elements in the environment [28]. On the other hand, object recognition has revealed the role of structure information in higher-level vision [29,30]. Data from behavioral studies and neuropsychological studies have suggested that color (as surface features) contributes to structural object recognition [31,32]. At the same time, color information plays an important role in the visual recognition of natural objects [33].
The quantitative analysis of color is important for a scientific evaluation of landscape aesthetic quality and forest landscape management [34]. Landscape type also plays a decisive role in the visual aesthetic quality of the local landscape. The complexity of landscape structure will affect people’s evaluation of landscape aesthetic quality to a certain extent. For example, the structure of the forest community and the spatial distribution of population affect the landscape aesthetic quality [34,35].
In this paper, we aimed to analyze the role of color and structure in landscape recognition by using the objective quantitative index of EEG features. We mainly focused on color and structure because they play important roles in landscape evaluation and recognition, as well as affect people’s spirit and emotion. EEG signals have been not only used as a tool to supplement surveys or expert opinion commonly utilized in the landscape evaluation field [19], but also supported by functional magnetic resonance imaging (fMRI) [36] and near-infrared studies [37,38]. Therefore, research on the role of color and structure as a function of EEG features in landscape recognition can provide a necessary basis for landscape perception and landscape recognition in landscape evaluation. This study will provide a method and guidance for use in summarizing the weight of color and structure in landscape classification.
Many previous studies have shown that color and structure play an important role in environmental assessment and landscape recognition, especially in human perception of the environment or landscape [21,22,23,25,26,27,34,35]. However, the influence of color or structure on landscape recognition is not clear as a function of the objective index of EEG features. Three hypotheses are proposed to explore the role of color and structure in landscape recognition:
- (1).
- The recognition accuracy of different colors, structures, and landscape types varies, whereas the classification accuracy for different scenarios in different landscapes is similar;
- (2).
- Color and structure play different roles in different landscape types;
- (3).
- The distribution of brain regions is different in different scenarios and landscape types.
2. Materials and Methods
We selected the experimental images (Figure 1) for this study through consultation with several experts.
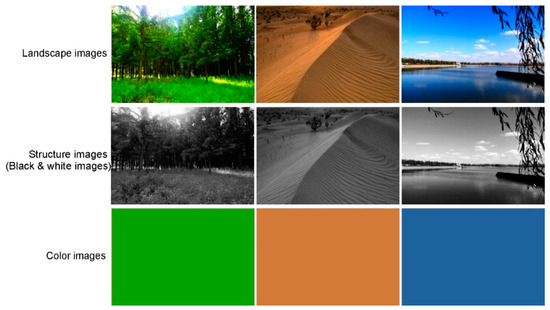
Figure 1.
Examples of experimental images.
2.1. Materials
Firstly, five photographs were selected to represent each type of common natural setting, including forest, desert, and water. Then, 10 people with more than 5 years of experience in landscape design were asked to rate each photo on a scale of 1–5. The highest-scoring photographs were chosen according to the cumulative scores. The landscape images were color-filtered to form structure landscape images (i.e., black and white landscape images) and then structure-filtered to form corresponding color images. Accordingly, we obtained three groups of images (landscape images, structure images, and color images) for this experiment. In Adobe Photoshop CS4, the color-finder tool takes an RGB value of 10 points in the landscape images and takes the average value. This process was repeated three times to get the average RGB value; then, the color images were quarried. The structured images were grayscale-converted from landscape images to black and white using Adobe Photoshop CS4 with the default RGB values (best for color comparison) and no special retention of brightness or shadow. Secondly, each participant’s EEG signals were collected and evaluated. Lastly, EEG results were analyzed to assess the perception of participants in different scenarios (landscape images, structure images, and color images) and different landscape types (forest, desert, and water). The role of color and structure in landscape recognition was concluded on the basis of EEG features.
In the laboratory, the room was completely closed and without noise. A 15 inch display device was put in front of the subjects. There were nine different images, each of which remained on screen for about 20 s (20 repeats for each image, with 2 s of stimulation each). After a series of images, the volunteers had a rest.
2.2. Subjects
A total of 20 volunteers aged between 25 and 55, nine women and 11 men, participated in the experimental procedure. The participants had varied employment situations, such as university staff, social workers of various industries, and university graduates. We described the purpose of the experiment before beginning, and participants were asked to be right-handed, with no color blindness, and in good physical health, without any history of mental disorder. If they met the requirements and agreed to continue the experiment, they then signed an informed consent form before testing. The study was approved by the school’s ethics committee.
2.3. Method
In this study, the Active System produced by Brain Products (LiveAmp, Brain Products GmbH, Gilching, Germany) with 32 channels was used to obtain the signals of the brain activity (Figure 2). The original EEG data were analyzed by the EEGlab, which is a toolbox for processing continuous EEG signals. The EEG signals were detrended using the average of left and right mastoids as a reference. Then, eye electrical, electromyography, electrocardiography, power frequency interference, and other disturbance artefacts were removed by independent component analysis (ICA) [39,40,41]. Next, the EEG signals were segmented into contiguous 2 s windows, and any segments which retained artefacts were rejected [42]. The experiment used the international 10–20 system and a 32-channel electrode cap. Therefore, a total of 1800 (9 × 20 × 10) data samples were generated. Then, 250 Hz downsampling and 0.5–50 Hz filtering were performed to obtain the preprocessed EEG datasets. Fast Fourier transform was used to extract frequency band information. The frequency-domain features were extracted to obtain the logarithmic frequency energy values of the waves in five frequency bands: delta (1–4 Hz), theta (4–8 Hz), alpha (8–13 Hz), beta (13–30 Hz), and gamma (>30 Hz) [43].
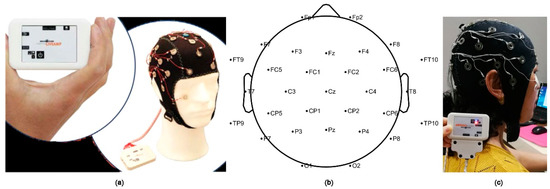
Figure 2.
(a) Brain Products (LiveAmp) device with 32 channels used in the experiment; (b) electrode distribution in brain region; (c) example of a volunteer.
The absolute EEG value for various types of pictures show that the natural landscape play a certain role in recovery from stress, whereby alpha waves (8–13 Hz) and beta waves (13–30 Hz) are the most suitable indicators [3]. Gamma waves (>30 Hz) are associated with meditation and happiness [44], as well as high-level information processing [45,46]. Another study also found a correlation between relaxation therapy and alpha waves [21]. As delta and theta waves are mainly presented during sleep, alpha, beta, and gamma waves were mainly used in this study for different landscapes and scenarios.
The EEG data were randomly divided into training (70%) and test (30%) data. For our purposes, we used 10-fold cross-validation to train and test extracted features for all classifiers. For KNN, we used k = 5 as a baseline for comparison with other classifiers. For random forest, we used a total of 500 trees. We used LIBSVM software [47] to implement the SVM classifier and employ the linear kernel.
2.4. Statistical Analysis
Firstly, machine learning (K-nearest neighbor, random forest classifier, and support vector machine) was used to classify different landscape types, colors, and structures as a function of brain waves after the pretreatment of EEG signals; then, the recognition accuracy in different situations was obtained. Secondly, the relative weights of structure and color in landscape recognition were calculated, and the method approximated the average increase in R2 upon adding predictive variables to all possible submodules [48,49,50], followed by using the reweights function in R software [51]. Lastly, variance analysis was used to test differences between groups with the same sample size. The Tukey HSD test was carried out for a binary comparison between different scenarios and different landscape types. The significant differences in different scenarios and using different landscape types were identified. All the statistical analyses were performed using R and Matlab. Graphs were completed in Matlab and Excel, and graph combination was completed in CorelDRAW2018.
3. Results
3.1. Recognition Accuracy of Landscape, Structure, and Color Based on Brain Waves
The classification accuracy of the three different classifiers for landscape, structure, and color are displayed in Figure 3 as a function of alpha, beta, and gamma waves. SVM was the classifier with the highest recognition accuracy for colors, structures, and landscapes using alpha, beta, and gamma waves, followed by RF and KNN (Figure 3). Using the SVM classifier, the trend of recognition accuracy was gamma > beta > alpha, while similar trends were confirmed using both the RF classifier and the KNN classifier. The accuracy of landscape image classification was higher than that of structure and color image classification using alpha, beta, and gamma waves in RF and SVM. Using the SVM classifier, the accuracy of landscape image recognition was up to 98.3% using beta waves, while the recognition accuracy of colors corresponding to the landscape was 97.5% using gamma waves, and that of structures was 93.9% using gamma waves. Using the RF classifier, the accuracies of landscape, structure, and color were 98.6%, 95.8%, and 93.9%, respectively, using gamma waves.
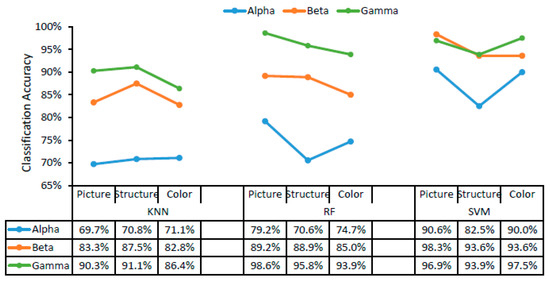
Figure 3.
The accuracy of color, structure, and landscape image classification as a function of brain waves. KNN, K-nearest neighbor; RF, random forest; SVM, support vector machine.
The classification accuracy of the three different classifiers for three different scenarios (forest, desert, and water landscapes) are displayed in Figure 4 as a function of alpha, beta, and gamma rhythms in brain waves. The classifier with the highest recognition accuracy for landscape color images (with structure filtered out), landscape structure images (with color filtered out), and raw landscape images was SVM using alpha, beta, and gamma waves in all cases (Figure 4). Using the SVM classifier, the accuracy of different scenarios was higher, exceeding 90% for alpha, beta, and gamma waves with all landscape types. The classification accuracy for the three different scenarios was 91.7–92.2% using alpha waves, 96.1–97.8% using beta waves, and 94.7–99.2% using gamma waves. There was little difference in classification accuracy across the three landscape types. The high recognition accuracy for the different scenarios indicated that color and structure both play an important role in landscape recognition.
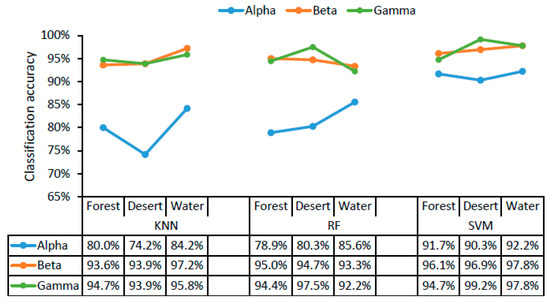
Figure 4.
The accuracy of classifying landscape types (forest, desert, and water). KNN, K-nearest neighbor; RF, random forest; SVM, support vector machine.
According to the results in Figure 3 and Figure 4, SVM was the most suitable classifier in this study, with accuracies exceeding 82.5% in all cases, which were relatively higher than those obtained using KNN and RF with alpha, beta, and gamma waves. In addition, the goodness of fit, specificity, and sensitivity of different classifiers for different landscape types and different scenarios (Appendix A) were calculated when choosing the most suitable classifier.
3.2. Weight and Brain Distribution of Structure and Color in Landscape Recognition
According to the average values of the whole brain, color played a major role in stimulating alpha waves, whereas structure played a major role in stimulating gamma waves for all landscape types (forest, desert, and water). In addition, structure played a major role in forest recognition, whereas color played a major role in desert and water recognition using beta waves. Here, a major role was defined as a weight in landscape recognition greater than 50% (Figure 5). The above findings may be due to the structure of the forest being the most complex among the three landscapes, while the structure of other landscapes is relatively simple.
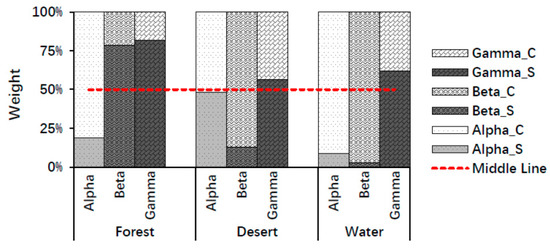
Figure 5.
The weights of structure and color in landscape image recognition using mean values of the whole brain. Alpha_S, Beta_S, and Gamma_S indicate structure weights using alpha, beta, and gamma waves; Alpha_C, Beta_C, and Gamma_C indicate color weights using alpha, beta, gamma waves.
The weights of structure and color in landscape image recognition using alpha, beta, and gamma rhythms in brain waves of the whole brain are presented in Figure 6.
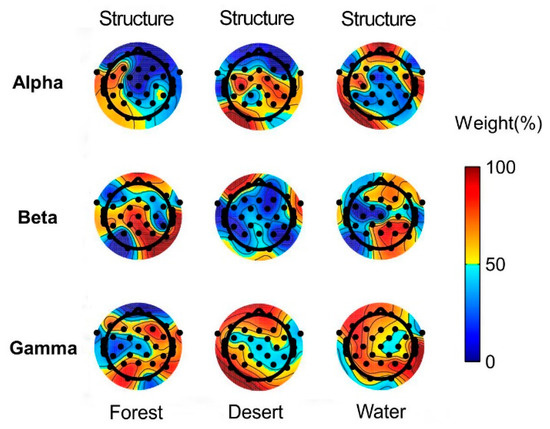
Figure 6.
The weights of structure and color in landscape image recognition for different landscape types using alpha, beta, and gamma waves. Predominantly orange electrodes represent the dominance of structure, whereas predominantly blue electrodes represent the dominance of color in different landscapes.
3.3. Analysis of Different Landscapes and Scenarios Based on EEG Features
Table 1 shows the results of two-way ANOVA, suggesting a significant difference in the human perception of scenario and landscape type. The group differences according to scenario were found to be significant for alpha, beta, and gamma waves (p < 0.01), while the differences according to landscape type were also significant for beta waves (p < 0.00). However, differences according to landscape type were not significant for alpha and gamma waves (p = 0.26 and 0.55, respectively). Moreover, the interaction effect between scenario and landscape type was significant. Since the interaction effect between two factors was verified by the above analysis, we performed a Tukey HSD test to determine which electrode underlying each factor affects human perception.

Table 1.
Results of ANOVA.
For different scenarios, there were significant differences among landscape groups, structure groups, and color groups, which were reflected in multiple electrodes of the whole brain (Figure 7a). Furthermore, differences between each group were also reflected (Figure 7b–d). A significant difference between forest and desert was mainly reflected in most electrodes for beta waves in landscape and structure, as well as for beta and gamma waves in color (Figure 7b). A significant difference between forest and water was mainly shown for alpha waves in landscape and structure, as well as for beta waves in color (Figure 7c). A significant difference between desert and water was mainly displayed for alpha and beta waves in landscape, as well as for beta and gamma waves in structure and color (Figure 7d).
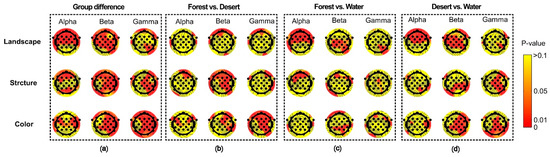
Figure 7.
The difference in distribution of brain waves for alpha and beta waves among landscapes in different scenarios. (a) the group differences among different scenarios, (b) the difference between forest and desert, (c) the difference between forest and water, (d) the difference between desert and water.
Significant group differences among scenarios (landscape images, structure images, and color images) were reflected for most electrodes using alpha, beta, and gamma rhythms in brain waves (Figure 8a). Significant differences between landscape and structure images were mainly shown for most electrodes using beta waves in forest and desert, as well as alpha and beta waves in water (Figure 8b). Significant difference between landscape and color images were mainly shown using gamma waves in forest, beta waves in desert, and alpha and gamma waves in water (Figure 8c).
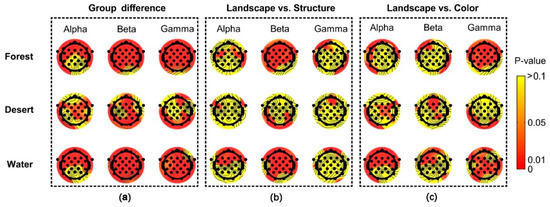
Figure 8.
The difference in distribution of brain waves among scenarios in different landscape types. Landscape indicates landscape images, Structure indicates structure images, and Color indicates color images. (a) the group differences among different landscape types, (b) the difference between landscape images and structure images, (c) the difference between landscape images and color images.
4. Discussion
4.1. Recognition Accuracy of Landscape, Structure, and Color Based on Machine Learning
The recognition of landscape images, structure images, and color images, as well as the recognition of different scenarios, showed that SVM was the classifier with the highest accuracy among the three landscape types (Figure 3 and Figure 4). The classification accuracy was 98.3% for landscape types using beta waves, 97.5% for colors (green, blue, and orange) using beta waves, and 93.9% for structures using gamma waves. Rasheed et al. used linear, polynomial, and radial basis function kernels in a support vector machine to classify red, green, and blue colors on the basis of EEG signals, yielding accuracies of 84%, 89%, and 98%, respectively [16], similar to the results for color classification accuracy in this study (97.5%), thus indicating their reliability. Khasnobish et al. classified objects on the basis of EEG signals using 10 objects of various regular geometrical shapes (cone, cube, sphere, hemisphere, cylinder, prism, and hexagonal base cylinder) and two irregularly shaped objects (lock and mouse). The recognition accuracy was 88.34% for pure tactile, 81.1% for pure visual, and 82.2% for a mixture of tactile and visual elements. The average classification accuracy over all three object exploration modalities was 83.89% [14]. Rus et al. found that the EEG features in gamma wave were more suitable for object recognition, and they used three different classifiers (SVM, KNN, and ANN) to classify objects, yielding accuracies of 89.5%, 89.5%, and 83%, respectively [15], consistent with the highest classification accuracy obtained using gamma waves in all brain waves in this study. Using EEG signals, Lam et al. implemented a single-layer neural network method to identify and classify landscape images and animal images, yielding an average accuracy of 91.15%, in which the average recognition rate of landscape images was 89.69%, and that of animal images was 92.34% [17]. Our classification accuracy results of 98.3% using beta waves, 96.9% using gamma waves, and 90.6% using alpha waves for landscape images with an SVM classifier are a little higher than Lam et al.’s result of 89.69%.
4.2. Role of Color and Structure in Landscape Identification
According to the average values of the whole brain, color plays a major role in stimulating alpha waves, whereas structure plays a major role in stimulating gamma waves for all landscape types (forest, desert, and water). In addition, structure played a major role in forest recognition, while color played a major role in desert and water recognition using beta waves. A major role denotes a weight in landscape recognition greater than 50% (Figure 5). The locations of the brain where structure played a major role were not the same as those identified for colors using alpha, beta, and gamma waves in different landscape types (Figure 6). The reason for this finding may be due to the structure of forests being the most complex among the three landscapes, while the structure of the other landscapes is relatively simple and homogeneous. Alpha waves normally play a major role in the relaxed state [21,52]. Our finding that color plays a major role in stimulating alpha waves for all landscapes suggests that color is very important in recognizing natural landscapes that induce relaxation and stress recovery. Gamma waves are associated with high-level information processing and a high cognitive state [45,46,53,54,55]. Our finding that structure plays a major role in stimulating gamma waves for all landscape types is consistent with the above conclusion. Beta waves play a major role when people are alert or stimulated [3]. Among the three landscape types, the structure of forests is relatively complex, while the structure of deserts and water is relatively simple. Consequently, when people were stimulated by the corresponding landscape, structure played a major role in the recognition of forest landscape, while color played a major role in the recognition of desert and water using beta waves. Another possible reason may be closely related to the plant diversity of the forest, where the tree density level is more conducive to a sense of relaxation. Previous studies have shown that moderate vegetation levels are associated with optimal physiological outcomes [56]. The structure of the forest landscape in this study was relatively complex with a medium vegetation level. It can be concluded that, in simple landscapes, color plays a very important role in influencing people’s perception, whereas, in relatively complex landscapes with a high species diversity, structure plays a major role. In summary, both color and structure are important for landscape recognition. Therefore, their reasonable usage and layout can be very important for guiding landscape aesthetics in future landscape design and landscape planning.
Compared with other BCI-based studies [18,19,23,26,36,57,58], the electrode distribution in this study was denser. Thus, relatively more detailed brain distribution differences and higher spatial brain resolution were obtained. In order to clearly reflect the role of structure and color, we also examined the differences between each group. Our finding confirmed a statistical significance in landscape and scenario recognition using alpha, beta, and gamma waves, thereby revealing that structure and color are important for landscape recognition as their absence led to significantly differences.
Future research should further explore landscape structures and colors that can cause an increase in the alpha rhythm of brain waves (inducing a physiological relaxation and stress recovery state), which can greatly help in the identification of landscapes that provide spiritual cultural services for human beings. Moreover, there is a need for further research into the relationship between the time of human exposure to the natural landscape and the process of brain waves of humans. Future research should focus on the differences in the individual perception of landscape physiology, including an increase in sample size and age range and more varied employment situations, as well as differences in gender, education level, residence, property income, and other social attributes. It may be helpful to find relevant patterns between psychophysiological trends and individual social characteristics.
5. Conclusions
With the development of EEG technology in recent years, direct evidence of human brain activity has enabled new pathways for landscape research. The observation of brain activity can provide the possibility of identifying mechanisms underlying perceptual reactions associated with environmental stimuli.
This study showed that the SVM classifier was the most suitable classifier for landscape classification based on EEG features. Secondly, color played a major role in stimulating alpha waves, while structure played a major role in stimulating gamma waves for all the landscape types (forest, desert, and water). In addition, structure played a major role in forest recognition, while color played a major role in desert and water recognition using beta waves. Lastly, a statistical significance difference in landscape and scenario recognition using alpha, beta, and gamma rhythms in brain waves was confirmed.
In conclusion, the leading role of structure or color in landscape recognition is not always certain; thus, a reasonable usage and layout of structure and color can be a very important guiding value for landscape aesthetics in future landscape design and landscape planning. This could have constructive significance for the development of beautiful countries and cities. Furthermore, the significant difference in the stimulation of brain waves according to landscapes highlights their influence on people’s perception, which is a great reference value for the rational planning of multifunctional landscapes with both recreational and educational function; it also provides a method for the quantification of people’s spiritual value of cultural ecosystem services.
Author Contributions
Study design, Y.W. and M.X.; data collection, Y.W. and S.W.; project design, data interpretation, and writing—original draft, Y.W. and S.W.; supervision, writing—review and editing, project administration, and funding acquisition, M.X. All authors have read and agreed to the published version of the manuscript.
Funding
This research was funded by the National Key R&D Program of China Climate Change Impact and Adaptation in Major Countries along the Belt and Road (2018YFA0606500).
Institutional Review Board Statement
The study was conducted according to the guidelines of the Declaration of Helsinki and approved by the Institutional Review Board at Biomedical Research Ethics Sub-Committee of Henan University (protocol code: HUSOM2021-166; date of approval: 15 March 2020).
Informed Consent Statement
Informed consent was obtained from all subjects involved in the study.
Data Availability Statement
The data presented in this study are available in insert article and Appendix A here.
Acknowledgments
The authors would like to thank the 20 enthusiastic participants.
Conflicts of Interest
The authors declare no conflict of interest.
Appendix A
The goodness of fit, specificity, and sensitivity of different classifiers were calculated for different landscape types and different scenarios to help with choosing the most appropriate classifier in this study.
Table A1.
The goodness of fit, specificity, and sensitivity of different classifiers for different landscape types.
Table A1.
The goodness of fit, specificity, and sensitivity of different classifiers for different landscape types.
| Classifier | Variable (Scenario) | Forest | Desert | Water | ||||||
|---|---|---|---|---|---|---|---|---|---|---|
| Goodness of Fit | Sensitivity | Specificity | Goodness of Fit | Sensitivity | Specificity | Goodness of Fit | Sensitivity | Specificity | ||
| Alpha_SVM | 0.842 | 0.838 | 0.597 | |||||||
| SVM | Landscape | 0.958 | 0.988 | 0.942 | 0.946 | 0.825 | 0.971 | |||
| SVM | Structure | 1.000 | 0.954 | 0.950 | 0.971 | 1.000 | 0.992 | |||
| SVM | Color | 0.892 | 0.983 | 0.942 | 1.000 | 0.933 | 0.917 | |||
| Beta_SVM | 0.952 | 0.770 | 0.780 | |||||||
| SVM | Landscape | 1.000 | 1.000 | 0.983 | 0.946 | 1.000 | 0.942 | |||
| SVM | Structure | 1.000 | 0.950 | 1.000 | 1.000 | 0.950 | 1.000 | |||
| SVM | Color | 0.900 | 1.000 | 0.892 | 0.992 | 0.892 | 0.979 | |||
| Gamma_SVM | 0.944 | 0.912 | 0.971 | |||||||
| SVM | Landscape | 1.000 | 0.975 | 0.992 | 0.975 | 0.992 | 0.988 | |||
| SVM | Structure | 0.942 | 0.971 | 0.983 | 1.000 | 0.967 | 0.988 | |||
| SVM | Color | 0.942 | 0.996 | 0.967 | 0.996 | 0.983 | 0.996 | |||
| Alpha_RF | 0.365 | 0.672 | 0.481 | |||||||
| RF | Landscape | 0.800 | 0.925 | 0.817 | 0.883 | 0.875 | 0.917 | |||
| RF | Structure | 0.967 | 0.917 | 0.858 | 0.896 | 0.975 | 0.983 | |||
| RF | Color | 0.700 | 0.892 | 0.883 | 1.000 | 0.800 | 0.925 | |||
| Beta_RF | 0.938 | 0.639 | 0.778 | |||||||
| RF | Landscape | 0.967 | 0.992 | 0.925 | 0.933 | 0.983 | 0.942 | |||
| RF | Structure | 1.000 | 0.971 | 0.992 | 1.000 | 0.925 | 0.979 | |||
| RF | Color | 0.958 | 1.000 | 0.875 | 0.963 | 0.883 | 0.975 | |||
| Gamma_RF | 0.924 | 0.787 | 0.824 | |||||||
| RF | Landscape | 0.983 | 0.975 | 1.000 | 0.942 | 0.992 | 0.921 | |||
| RF | Structure | 0.917 | 0.996 | 1.000 | 1.000 | 0.875 | 0.983 | |||
| RF | Color | 0.992 | 0.975 | 0.883 | 1.000 | 0.917 | 0.988 | |||
| Alpha_KNN | 0.430 | 0.437 | 0.468 | |||||||
| KNN | Landscape | 0.867 | 0.850 | 0.650 | 0.858 | 0.758 | 0.938 | |||
| KNN | Structure | 0.917 | 0.929 | 0.800 | 0.829 | 0.900 | 0.958 | |||
| KNN | Color | 0.700 | 0.963 | 0.817 | 0.946 | 0.883 | 0.875 | |||
| Beta_KNN | 0.655 | 0.744 | 0.823 | |||||||
| KNN | Landscape | 0.833 | 0.967 | 0.975 | 0.929 | 0.983 | 0.963 | |||
| KNN | Structure | 1.000 | 0.971 | 0.992 | 0.988 | 0.992 | 1.000 | |||
| KNN | Color | 0.933 | 0.946 | 0.867 | 1.000 | 0.925 | 0.988 | |||
| Gamma_KNN | 0.819 | 0.708 | 0.835 | |||||||
| KNN | Landscape | 0.950 | 0.950 | 1.000 | 0.917 | 0.958 | 0.971 | |||
| KNN | Structure | 0.942 | 1.000 | 1.000 | 1.000 | 0.950 | 0.971 | |||
| KNN | Color | 0.958 | 0.975 | 0.833 | 1.000 | 0.925 | 0.975 |
Table A2.
The goodness of fit, specificity, and sensitivity of different classifiers for different scenarios.
Table A2.
The goodness of fit, specificity, and sensitivity of different classifiers for different scenarios.
| Classifier | Variable (Landscape Type) | Landscape Images | Structure Images | Color Images | ||||||
|---|---|---|---|---|---|---|---|---|---|---|
| Goodness of Fit | Sensitivity | Specificity | Goodness of Fit | Sensitivity | Specificity | Goodness of Fit | Sensitivity | Specificity | ||
| Alpha_SVM | 0.642 | 0.331 | 0.780 | |||||||
| SVM | Forest | 0.842 | 0.938 | 0.783 | 0.892 | 0.950 | 0.992 | |||
| SVM | Desert | 0.975 | 0.954 | 0.842 | 0.950 | 0.892 | 0.938 | |||
| SVM | Water | 0.900 | 0.967 | 0.750 | 0.846 | 0.867 | 0.925 | |||
| Beta_SVM | 0.825 | 0.911 | 0.883 | |||||||
| SVM | Forest | 0.942 | 0.983 | 0.933 | 0.988 | 1.000 | 0.988 | |||
| SVM | Desert | 1.000 | 1.000 | 0.933 | 0.958 | 0.950 | 0.954 | |||
| SVM | Water | 0.967 | 0.971 | 0.975 | 0.975 | 0.883 | 0.975 | |||
| Gamma_SVM | 0.960 | 0.901 | 0.920 | |||||||
| SVM | Forest | 1.000 | 0.975 | 0.942 | 0.979 | 1.000 | 0.992 | |||
| SVM | Desert | 0.958 | 0.996 | 0.950 | 0.925 | 1.000 | 0.950 | |||
| SVM | Water | 0.983 | 1.000 | 0.908 | 0.996 | 0.883 | 1.000 | |||
| Alpha_RF | 0.460 | 0.281 | 0.460 | |||||||
| RF | Forest | 0.725 | 0.850 | 0.817 | 0.825 | 0.758 | 0.950 | |||
| RF | Desert | 0.817 | 0.913 | 0.800 | 0.863 | 0.733 | 0.888 | |||
| RF | Water | 0.867 | 0.942 | 0.558 | 0.900 | 0.808 | 0.813 | |||
| Beta_RF | 0.663 | 0.653 | 0.617 | |||||||
| RF | Forest | 0.800 | 0.983 | 0.950 | 0.929 | 0.933 | 0.925 | |||
| RF | Desert | 0.958 | 0.971 | 0.892 | 0.933 | 0.858 | 0.938 | |||
| RF | Water | 0.975 | 0.913 | 0.783 | 0.950 | 0.792 | 0.929 | |||
| Gamma_RF | 0.931 | 0.946 | 0.874 | |||||||
| RF | Forest | 0.992 | 0.988 | 0.958 | 1.000 | 1.000 | 0.971 | |||
| RF | Desert | 0.958 | 1.000 | 1.000 | 0.963 | 0.967 | 0.967 | |||
| RF | Water | 0.983 | 0.979 | 0.958 | 0.996 | 0.892 | 0.992 | |||
| Alpha_KNN | 0.208 | 0.086 | 0.384 | |||||||
| KNN | Forest | 0.667 | 0.713 | 0.725 | 0.771 | 0.650 | 0.888 | |||
| KNN | Desert | 0.717 | 0.867 | 0.733 | 0.904 | 0.583 | 0.900 | |||
| KNN | Water | 0.650 | 0.938 | 0.475 | 0.792 | 0.892 | 0.775 | |||
| Beta_KNN | 0.320 | 0.534 | 0.541 | |||||||
| KNN | Forest | 0.575 | 0.942 | 0.858 | 0.900 | 0.833 | 0.925 | |||
| KNN | Desert | 0.967 | 0.950 | 0.933 | 0.975 | 0.900 | 0.967 | |||
| KNN | Water | 0.917 | 0.838 | 0.850 | 0.946 | 0.875 | 0.913 | |||
| Gamma_KNN | 0.592 | 0.879 | 0.720 | |||||||
| KNN | Forest | 0.775 | 0.992 | 0.942 | 0.979 | 0.925 | 0.888 | |||
| KNN | Desert | 1.000 | 1.000 | 0.950 | 0.967 | 0.825 | 0.954 | |||
| KNN | Water | 0.983 | 0.888 | 0.958 | 0.979 | 0.892 | 0.979 | |||
References
- Schafer, P.J.; Serman, M.; Arnold, M.; Corona-Strauss, F.I.; Strauss, D.J.; Seidler-Fallbohmer, B.; Seidler, H. Evaluation of an objective listening effort measure in a selective, multi-speaker listening task using different hearing aid settings. Conf. Proc. IEEE Eng. Med. Biol. Soc. 2015, 4647–4650. [Google Scholar] [CrossRef]
- Keshavarz, B.; Campos, J.L.; Berti, S. Vection lies in the brain of the beholder: EEG parameters as an objective measurement of vection. Front. Psychol. 2015, 6, 1581. [Google Scholar] [CrossRef]
- Norwood, M.F.; Lakhani, A.; Maujean, A.; Zeeman, H.; Kendall, E. Brain activity, underlying mood and the environment: A systematic review. J. Environ. Psychol. 2019, 65, 101321. [Google Scholar] [CrossRef]
- Teplan, M. Fundamentals of EEG measurement. Meas. Sci. Rev. 2002, 2, 1–11. [Google Scholar]
- Whalen, P.J.; Rauch, S.L.; Etcoff, N.L.; McInerney, S.C.; Lee, M.B.; Jenike, M.A. Masked Presentations of Emotional Facial Expressions Modulate Amygdala Activity without Explicit Knowledge. J. Neurosci. 1998, 18, 411–418. [Google Scholar] [CrossRef]
- Chang, C.Y.; Hammitt, W.E.; Chen, P.K.; Machnik, L.; Su, W.C. Psychophysiological responses and restorative values of natural environments in Taiwan. Landsc. Urban Plan. 2008, 85, 79–84. [Google Scholar] [CrossRef]
- Martínez-Soto, J.; Gonzales-Santos, L.; Pasaye, E.; Barrios, F.A. Exploration of neural correlates of restorative environment exposure through functional magnetic resonance. Intell. Build. Int. 2013, 5, 10–28. [Google Scholar] [CrossRef]
- Bear, M.; Connors, B.; Paradiso, M. Neuroscience: Exploring the Brain; Jones & Bartlett Learning: Burlington, ON, Canada, 2015. [Google Scholar]
- Moon, S.E.; Chen, C.J.; Hsieh, C.J.; Wang, J.L.; Lee, J.S. Emotional EEG classification using connectivity features and convolutional neural networks. Neural Netw. 2020, 132, 96–107. [Google Scholar] [CrossRef]
- Liu, S.; Tong, J.; Meng, J.; Yang, J.; Zhao, X.; He, F.; Qi, H.; Ming, D. Study on an effective cross-stimulus emotion recognition model using EEGs based on feature selection and support vector machine. Int. J. Mach. Learn. Cybern. 2018, 9, 721–726. [Google Scholar] [CrossRef]
- Li, J.; Zhang, Z.; He, H. Hierarchical convolutional neural networks for EEG-based emotion recognition. Cogn. Comput. 2018, 10, 368–380. [Google Scholar] [CrossRef]
- Shahabi, H.; Moghimi, S. Toward automatic detection of brain responses to emotional music through analysis of EEG effective connectivity. Comput. Hum. Behav. 2016, 58, 231–239. [Google Scholar] [CrossRef]
- Zheng, W.L.; Lu, B.L. Investigating critical frequency bands and channels for EEG-based emotion recognition with deep neural networks. IEEE Tran. Auton. Ment. Dev. 2015, 7, 162–175. [Google Scholar] [CrossRef]
- Khasnobish, A.; Konar, A.; Tibarewala, D.; Bhattacharyya, S.; Janarthanan, R. Object shape recognition from EEG signals during tactile and visual exploration. In Proceedings of the International Conference on Pattern Recognition and Machine Intelligence, Kolkata, India, 10–14 December 2013; pp. 459–464. [Google Scholar] [CrossRef]
- Rus, I.D.; Marc, P.; Dinsoreanu, M.; Potolea, R.; Muresan, R.C. Classification of EEG signals in an object recognition task. In Proceedings of the 2017 13th IEEE International Conference on Intelligent Computer Communication and Processing (ICCP), Cluj-Napoca, Romania, 7–9 September 2017; pp. 391–395. [Google Scholar] [CrossRef]
- Rasheed, S.; Marini, D. Classification of EEG signals produced by RGB colour stimuli. J. Biomed. Eng. Med. 2015, 2, 56. [Google Scholar] [CrossRef]
- Lam, Q.C.; Nguyen, L.A.T.; Nguyen, H.K. EEG Signal Identification Using Single-Layer Neural Network. Int J. Cybern. Inform. 2016, 5, 1–10. [Google Scholar] [CrossRef]
- Roe, J.J.; Aspinall, P.A.; Mavros, P.; Coyne, R. Engaging the brain: The impact of natural versus urban scenes using novel EEG methods in an experimental setting. Environ. Sci. 2013, 1, 93–104. [Google Scholar] [CrossRef]
- Tilley, S.; Neale, C.; Patuano, A.; Cinderby, S. Older People’s Experiences of Mobility and Mood in an Urban Environment: A Mixed Methods Approach Using Electroencephalography (EEG) and Interviews. Int. J. Environ. Res. Public Health 2017, 14, 151. [Google Scholar] [CrossRef] [PubMed]
- Ulrich, R.S. Natural versus urban scenes: Some psychophysiological effects. Environ. Behav. 1981, 13, 523–556. [Google Scholar] [CrossRef]
- Chiang, Y.C.; Li, D.Y.; Jane, H.A. Wild or tended nature? The effects of landscape location and vegetation density on physiological and psychological responses. Landsc. Urban Plan. 2017, 167, 72–83. [Google Scholar] [CrossRef]
- Qin, J.; Zhou, X.; Sun, C.; Leng, H.; Lian, Z. Influence of green spaces on environmental satisfaction and physiological status of urban residents. Urban For. Urban Green. 2013, 12, 490–497. [Google Scholar] [CrossRef]
- Sacchelli, S.; Grilli, G.; Capecchi, I.; Bambi, L.; Barbierato, E.; Borghini, T. Neuroscience Application for the Analysis of Cultural Ecosystem Services Related to Stress Relief in Forest. Forests 2020, 11, 190. [Google Scholar] [CrossRef]
- Elliot, A.J.; Maier, M.A.; Moller, A.C.; Friedman, R.; Meinhardt, J.R. Color and psychological functioning: The effect of red on performance attainment. J. Expt. Psychol. Gen. 2007, 136, 154–168. [Google Scholar] [CrossRef]
- Palmer, S.E.; Schloss, K.B. An ecological valence theory of human color preference. Proc. Natl. Acad. Sci. USA 2010, 107, 8877–8882. [Google Scholar] [CrossRef]
- Freiders, S.; Lee, S.; Statz, D.; Kim, T. The Influence of Color on Physiological Response. J. Adv. Stud. Sci. 2012, 1, 1–12. [Google Scholar]
- Kim, J.Y.; Lee, H.S. A study on interior wall color based on measurement of emotional responses. Sci. Emot. Sensib. 2009, 12, 205–214. [Google Scholar]
- Lancaster, M. Colourscape; Academy Editions: London, UK, 1996. [Google Scholar]
- Biederman, I. Recognition-by-components: A theory of human image understanding. Psychol. Rev. 1987, 94, 115–147. [Google Scholar] [CrossRef]
- Biederman, I.; Ju, G. Surface versus edge-based determinants of visual recognition. Cogn. Psychol. 1988, 20, 38–64. [Google Scholar] [CrossRef]
- Tanaka, J.; Weiskopf, D.; Williams, P. The role of color in high-level vision. Trends Cogn. Sci. 2001, 5, 211–215. [Google Scholar] [CrossRef]
- Inês Bramão, L.F.; Petersson, K.M.; Reis, A. The Contribution of Color to Object Recognition; InTech: Rijeka, Croatia, 2012. [Google Scholar]
- Bramão, I.; Faísca, L.; Forkstam, C.; Reis, A.; Petersson, K.M. Cortical brain regions associated with color processing: An FMRI study. Open Neuroimag. J. 2010, 4, 164–173. [Google Scholar] [CrossRef] [PubMed]
- Zhang, X.J.; Chen, J.; Li, Q.Y.; Liu, J.C.; Tao, J.P. Color quantification and evaluation of landscape aesthetic quality for autumn landscape forest based on visual characteristics in subalpine region of western Sichuan, China. Yingyong Shengtai Xuebao 2020, 31, 45–54. [Google Scholar] [CrossRef]
- Deng, S.; Yan, J.; Guan, Q.; Katoh, M. Short-term effects of thinning intensity on scenic beauty values of different stands. J. For. Res. 2013, 18, 209–219. [Google Scholar] [CrossRef]
- Tang, I.C.; Tsai, Y.P.; Lin, Y.J.; Chen, J.H.; Hsieh, C.H.; Hung, S.H.; Sullivan, W.C.; Tang, H.F.; Chang, C.Y. Using functional Magnetic Resonance Imaging (fMRI) to analyze brain region activity when viewing landscapes. Landsc. Urban Plan. 2017, 162, 137–144. [Google Scholar] [CrossRef]
- Balconi, M.; Molteni, E. Past and future of near-infrared spectroscopy in studies of emotion and social neuroscience. J. Cogn. Psychol. 2016, 28, 129–146. [Google Scholar] [CrossRef]
- Matsubara, T.; Matsuo, K.; Hirata, K.; Harada, K.; Hirotsu, M.; Watanuki, T.; Watanabe, Y.; Nakagawa, S. F150. Neurofeedback of frontal response to emotional sentence in healthy subjects: A functional near-infrared spectroscopy study. Biol. Psychiatry 2018, 83, S296. [Google Scholar] [CrossRef]
- Pivik, R.T.; Broughton, R.J.; Coppola, R.; Davidson, R.J.; Fox, N.; Nuwer, M.R. Guidelines for the recording and quantitative analysis of electroencephalographic activity in research contexts. Psychophysiology 1993, 30, 547–558. [Google Scholar] [CrossRef]
- Keil, A.; Debener, S.; Gratton, G.; Junghöfer, M.; Kappenman, E.S.; Luck, S.J.; Luu, P.; Miller, G.A.; Yee, C.M. Committee report: Publication guidelines and recommendations for studies using electroencephalography and magnetoencephalography. Psychophysiology 2014, 51, 1–21. [Google Scholar] [CrossRef]
- Fridlund, A.J.; Cacioppo, J.T. Guidelines for human electromyographic research. Psychophysiology 1986, 23, 567–589. [Google Scholar] [CrossRef]
- Gabard-Durnam, L.J.; Wilkinson, C.; Kapur, K.; Tager-Flusberg, H.; Levin, A.R.; Nelson, C.A. Longitudinal EEG power in the first postnatal year differentiates autism outcomes. Nat. Commun. 2019, 10, 1–12. [Google Scholar] [CrossRef] [PubMed]
- Conneau, A.C.; Essid, S. Assessment of new spectral features for eeg-based emotion recognition. In Proceedings of the 2014 IEEE International Conference on Acoustics, Speech and Signal Processing (ICASSP), Florence, Italy, 4–9 May2014. [Google Scholar] [CrossRef]
- Braboszcz, C.; Cahn, B.R.; Levy, J.; Fernandez, M.; Delorme, A. Increased Gamma Brainwave Amplitude Compared to Control in Three Different Meditation Traditions. PLoS ONE 2017, 12, e0170647. [Google Scholar] [CrossRef] [PubMed]
- Choi, Y.; Kim, M.; Chun, C. Measurement of occupants’ stress based on electroencephalograms (EEG) in twelve combined environments. Build. Environ. 2015, 88, 65–72. [Google Scholar] [CrossRef]
- Sanei, S.; Chambers, J.A. EEG Signal Processing; John Wiley & Sons Ltd.: West Sussex, UK, 2007. [Google Scholar]
- Chang, C.C.; Lin, C.J. LIBSVM: A library for support vector machines. ACM Trans. Intell. Syst. Technol. (TIST) 2011, 2, 1–27. [Google Scholar] [CrossRef]
- Johnson, J.W. Factors affecting relative weights: The influence of sampling and measurement error. Organ. Res. Methods 2004, 7, 283–299. [Google Scholar] [CrossRef]
- Johnson, J.W.; LeBreton, J.M. History and use of relative importance indices in organizational research. Organ. Res. Methods 2004, 7, 238–257. [Google Scholar] [CrossRef]
- LeBreton, J.M.; Tonidandel, S. Multivariate relative importance: Extending relative weight analysis to multivariate criterion spaces. J. Appl. Psychol. 2008, 93, 329. [Google Scholar] [CrossRef] [PubMed]
- Johnson, J.W. A heuristic method for estimating the relative weight of predictor variables in multiple regression. Multivar. Behav. Res. 2000, 35, 1–19. [Google Scholar] [CrossRef] [PubMed]
- Yuvaraj, R.; Murugappan, M.; Ibrahim, N.M.; Sundaraj, K.; Omar, M.I.; Mohamad, K.; Palaniappan, R. Optimal set of EEG features for emotional state classification and trajectory visualization in Parkinson’s disease. Int. J. Psychophys. 2014, 94, 482–495. [Google Scholar] [CrossRef]
- Balconi, M.; Lucchiari, C. Consciousness and arousal effects on emotional face processing as revealed by brain oscillations. A gamma band analysis. Int. J. Psychophys. 2008, 67, 41–46. [Google Scholar] [CrossRef]
- Bos, D.O. EEG-based emotion recognition. Influ. Vis. Audit. 2006, 56, 1–17. [Google Scholar]
- Keil, A.; Müller, M.M.; Gruber, T.; Wienbruch, C.; Stolarova, M.; Elbert, T. Effects of emotional arousal in the cerebral hemispheres: A study of oscillatory brain activity and event-related potentials. Clin. Neurophysiol. 2001, 112, 2057–2068. [Google Scholar] [CrossRef]
- Jiang, B.; Chang, C.Y.; Sullivan, W.C. A dose of nature: Tree cover, stress reduction, and gender differences. Landsc. Urban Plan. 2014, 132, 26–36. [Google Scholar] [CrossRef]
- Kim, M.; Cheon, S.; Kang, Y. Use of Electroencephalography (EEG) for the Analysis of Emotional Perception and Fear to Nightscapes. Sustainability 2019, 11, 233. [Google Scholar] [CrossRef]
- Qiu, L.; Lindberg, S.; Nielsen, A.B. Is biodiversity attractive?—On site perception of recreational and biodiversity values in urban green space. Landsc. Urban Plan. 2013, 119, 136–146. [Google Scholar] [CrossRef]


Publisher’s Note: MDPI stays neutral with regard to jurisdictional claims in published maps and institutional affiliations. |
© 2021 by the authors. Licensee MDPI, Basel, Switzerland. This article is an open access article distributed under the terms and conditions of the Creative Commons Attribution (CC BY) license (https://creativecommons.org/licenses/by/4.0/).