
Low-Level Radon Activity Concentration—A MetroRADON International Intercomparison

 , ,
, ,  , , and
Abstract
: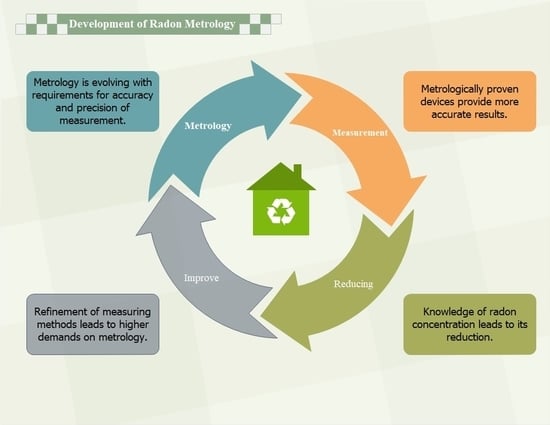
1. Introduction
2. Organization and Methodology
| volume activity at time t (Bq⋅m−3) | |
| volume activity at time 0 (Bq⋅m−3) | |
| λRn | radon decay rate constant (h−1) |
| multiple air exchange (h−1) | |
| time (h) | |
| radon feed rate (Bq⋅h−1) | |
| volume of radon chamber (m3) |
| aV,Rn | radon activity concentration (Bq⋅m−3) |
| Q | flow rate (m3⋅h−1) |
| M | molar mass (kg⋅mol−1) |
| p at Q calibration | air pressure 1013,25 (hPa) |
| R | molar gas constant (J⋅mol−1⋅K−1) |
| T at Q calibration | temperature 273,16 (K) |
| pat Rn confrontation | air pressure (Pa) |
| Tat Rn confrontation | temperature (K) |
| λRn | radon decay rate constant (h−1) |
| V | volume of radon chamber (m3) |
| RRn | radon emanation power (Bq⋅h−1) |
- Determination of Z Score:
- Interpretation of Score
| the result is considered acceptable | |
| the result is considered a source of warning | |
| the result is considered unacceptable |
- Deviation Estimation (Measurement Error):
3. Results and Discussion
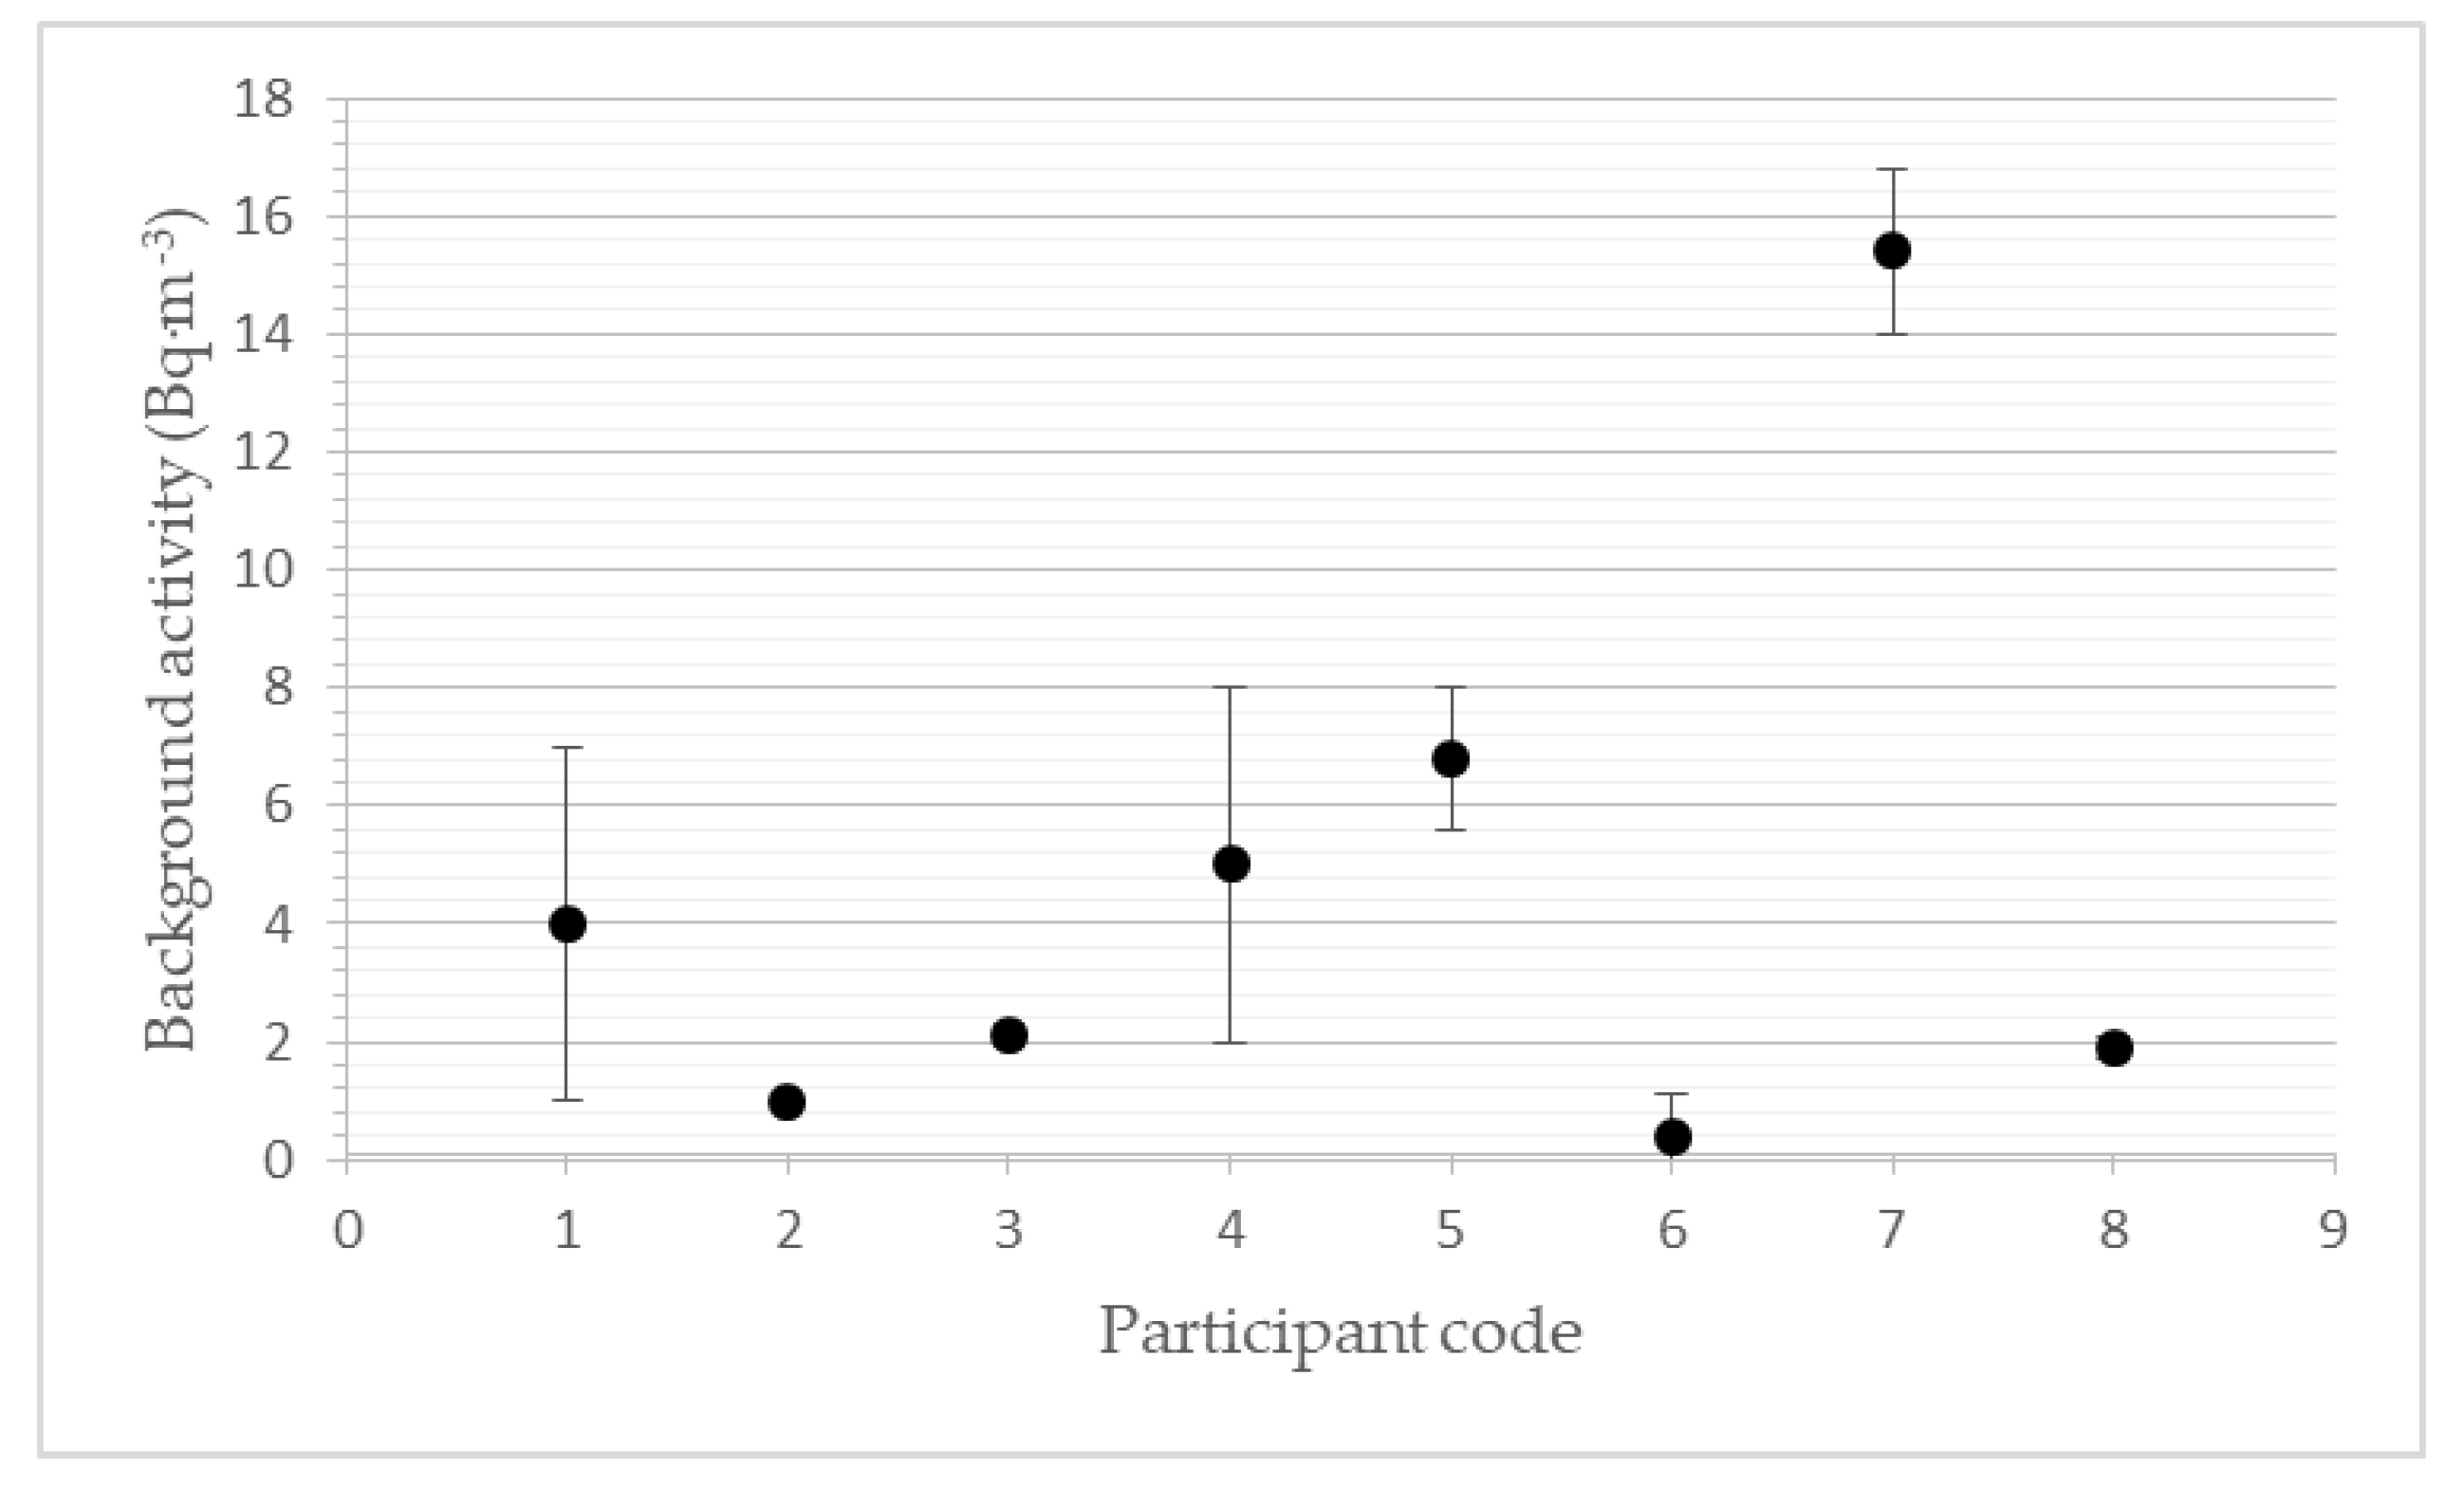
3.1. Background Activity Concentration
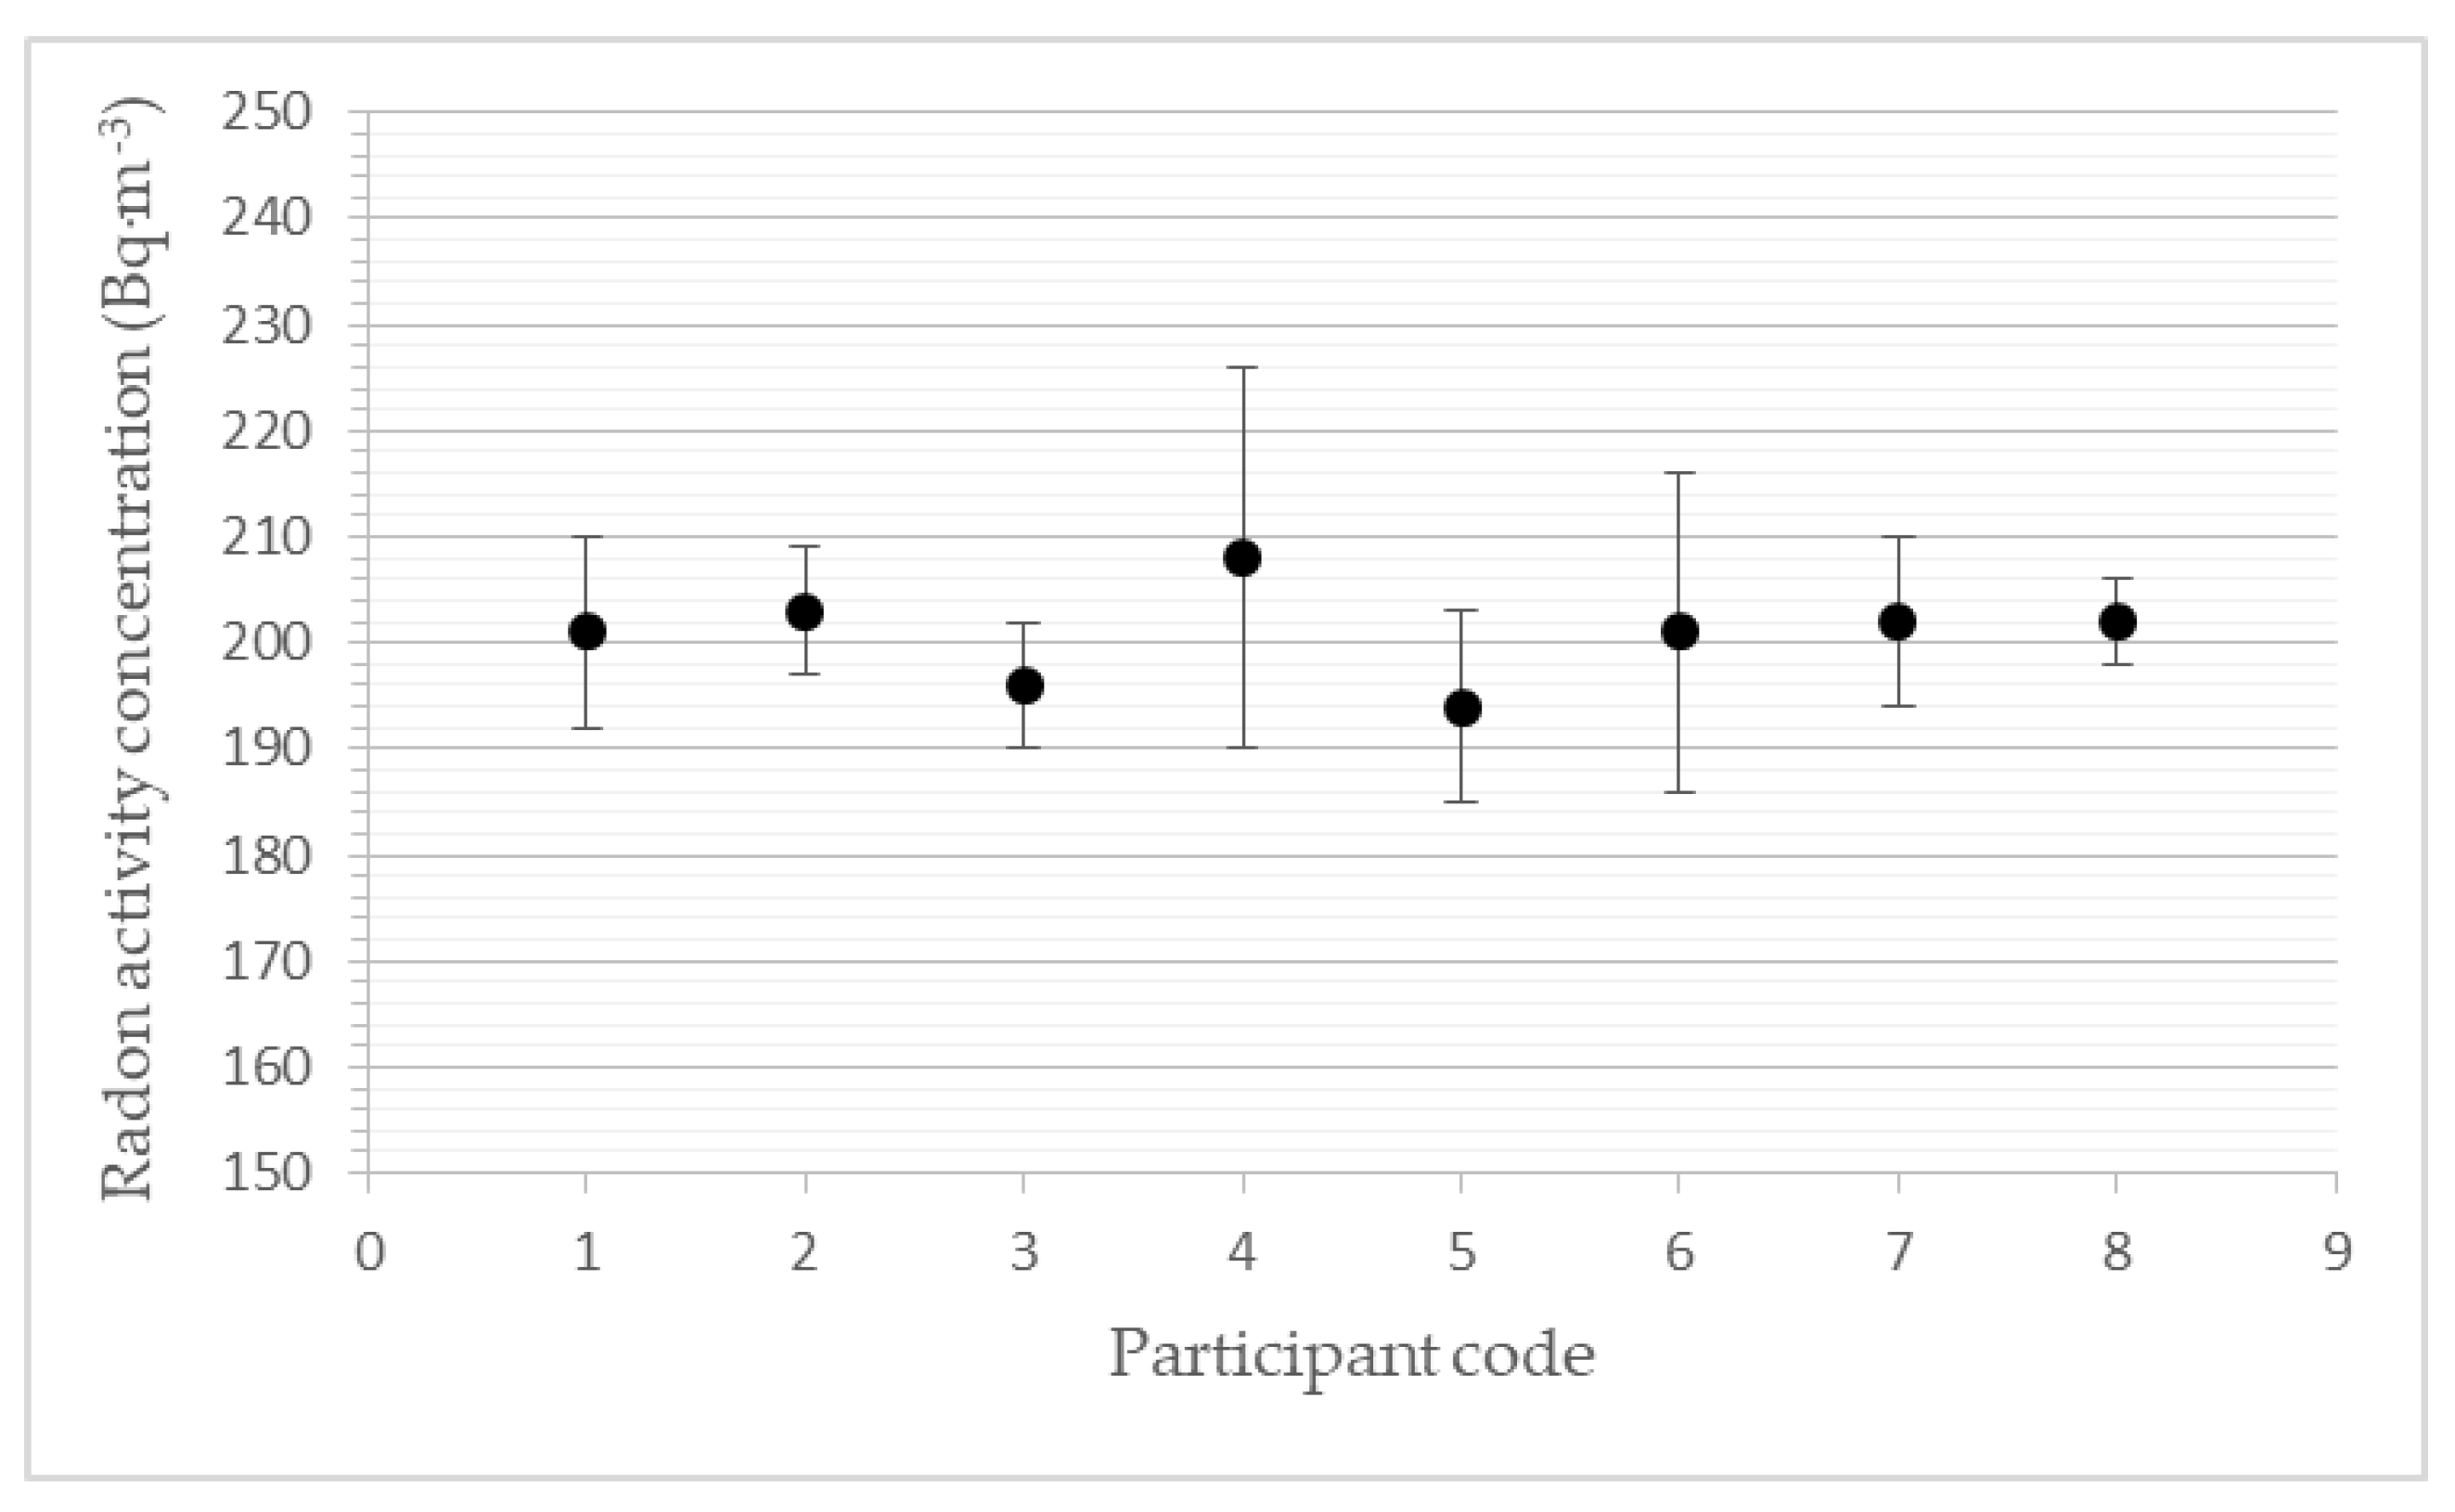
3.2. Participants’ Results for a Level of 200 Bq·m−3
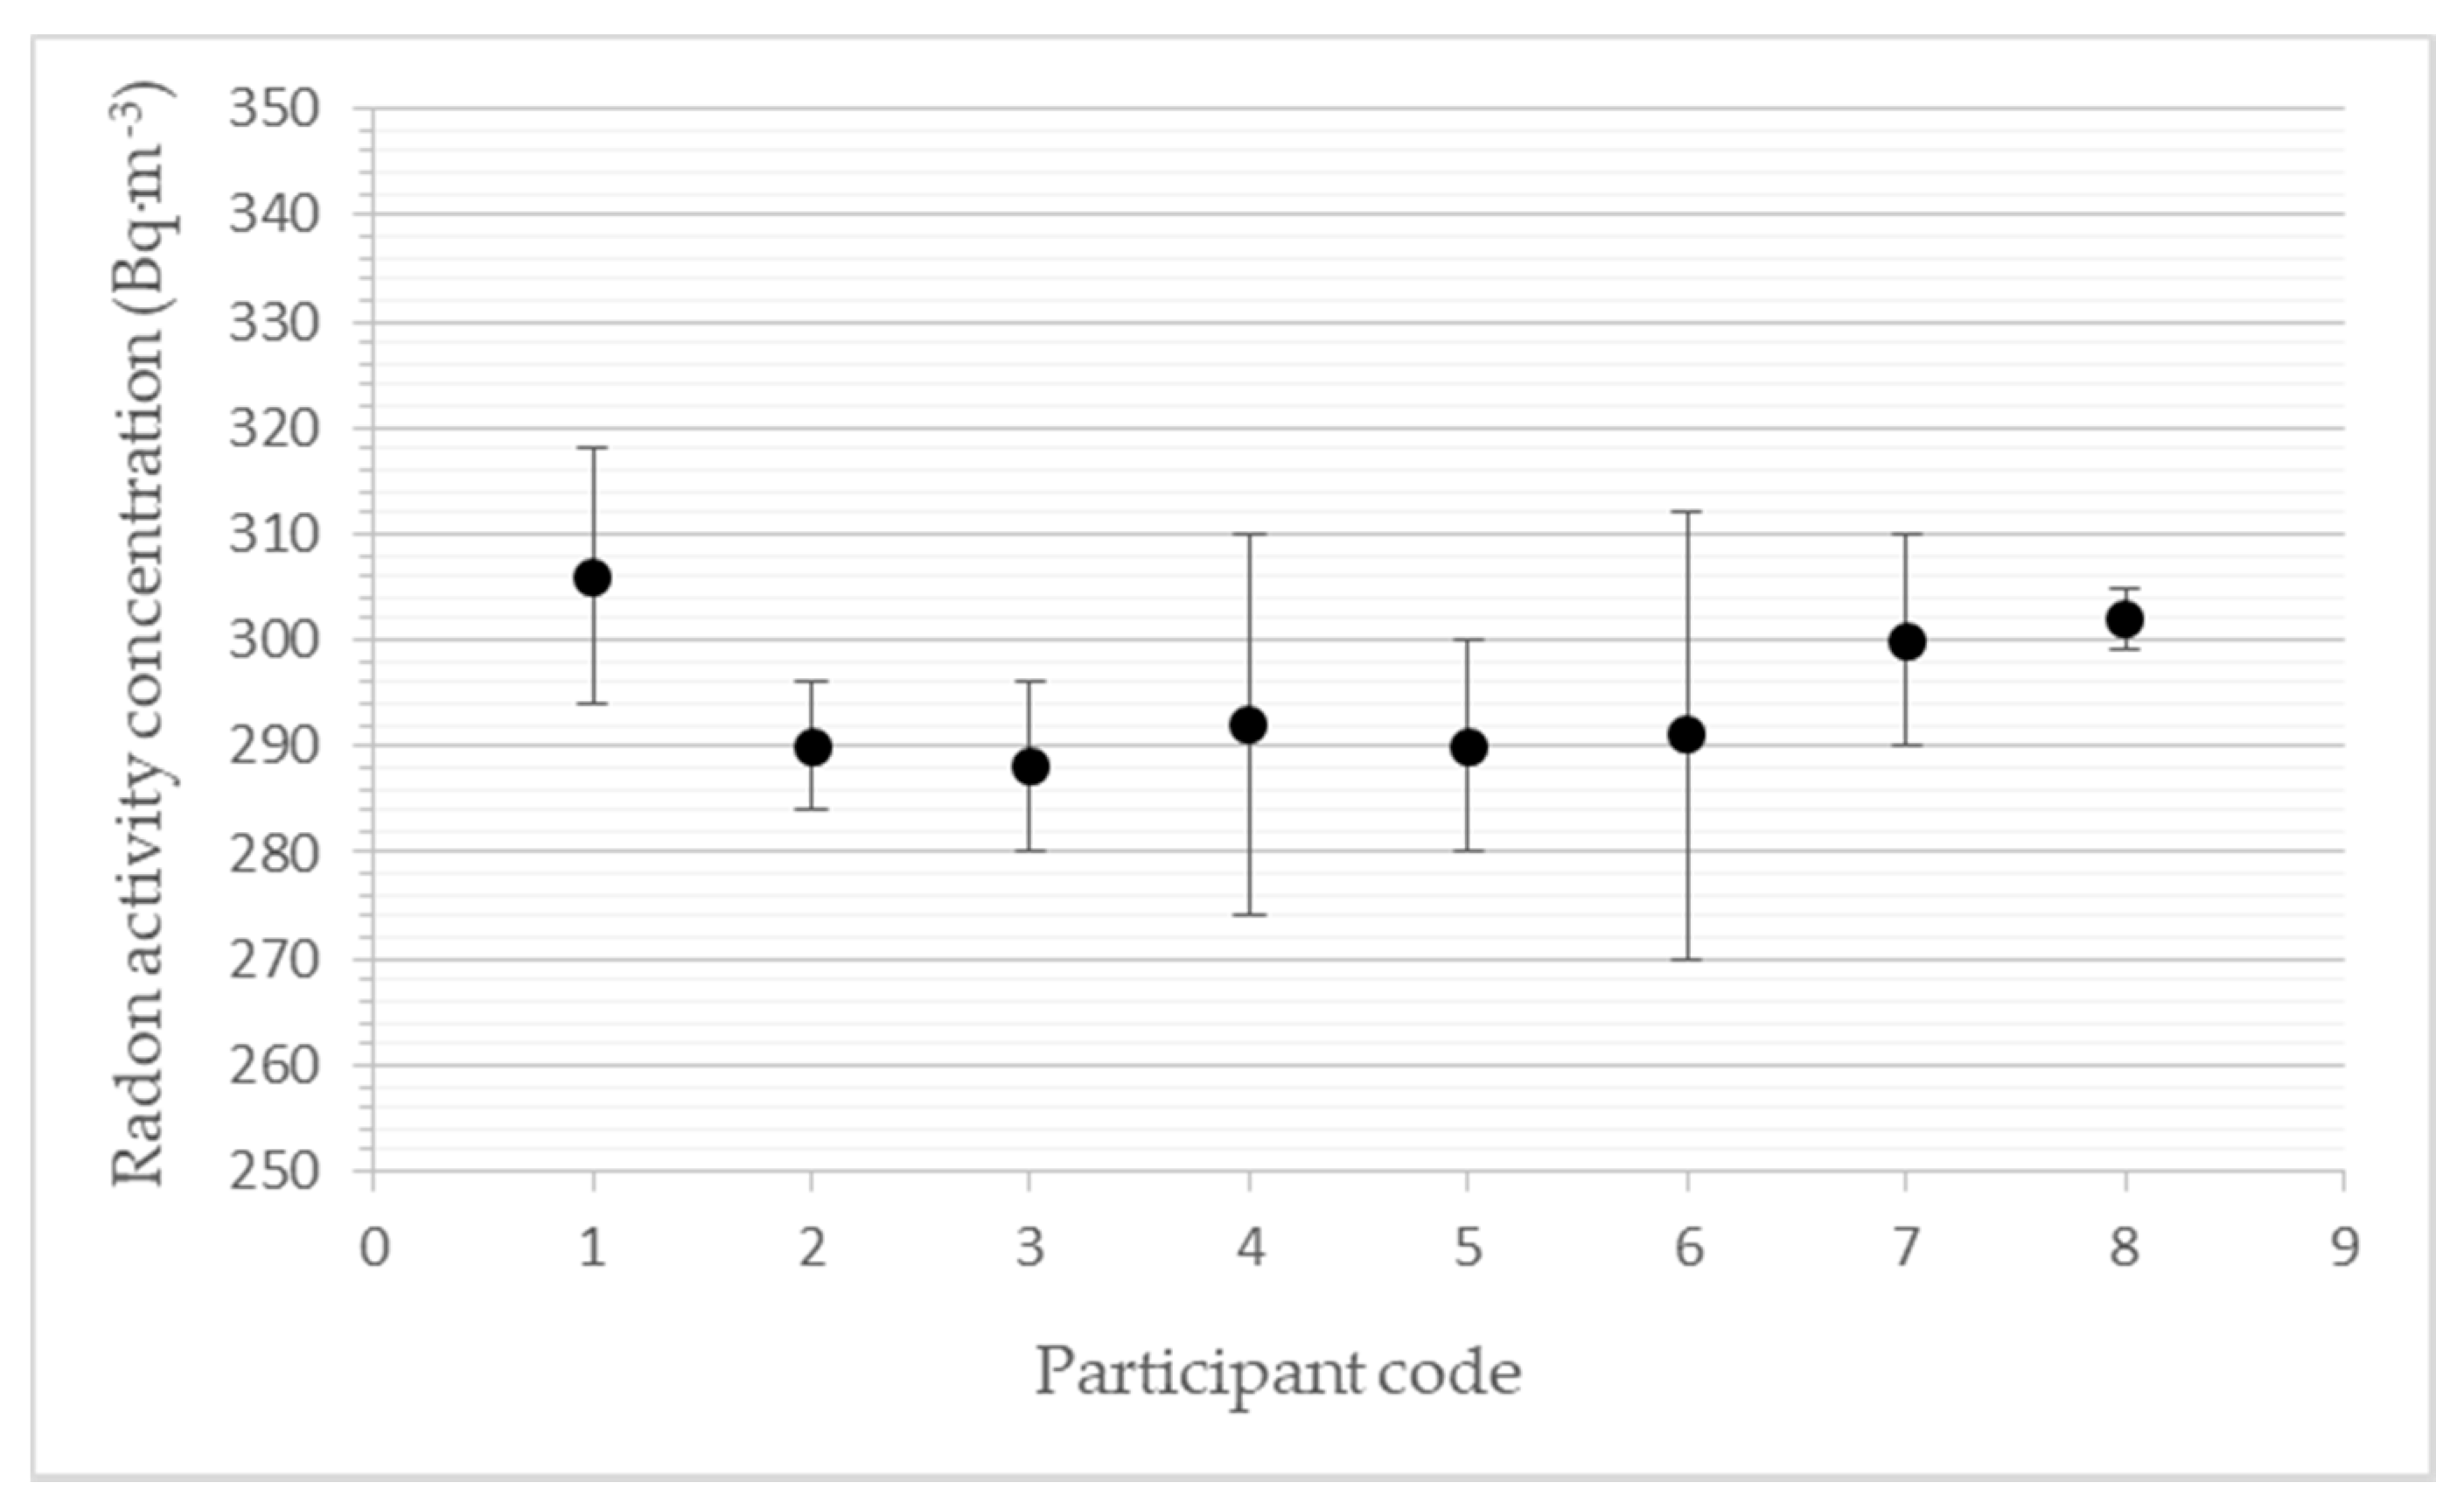
3.3. Participants’ Results for a Level of 300 Bq·m−3
4. Conclusions
Author Contributions
Funding
Data Availability Statement
Conflicts of Interest
References
- European Commission; Joint Research Centre; Cinelli, G.; De Cort, M.; Tollefsen, T. (Eds.) European Atlas of Natural Radiation; Publication Office of the European Union: Luxemburg, 2019; ISBN 978-92-76-08259-0. [Google Scholar]
- Grossi, C.; Grossi, C.; Àgueda, A.; Vogel, F.R.; Vargas, A.; Zimnoch, M.; Wach, P.; Martín, J.E.; López-Coto, I.; Bolívar, J.P.; et al. Analysis of ground-based 222Rn measurements over Spain: Filling the gap in southwestern Europe. J. Geophys. Res. Atmos. 2016, 121, 11021–11037. [Google Scholar] [CrossRef]
- Otahal, P.; Burian, I. Radon decay products in the boundary layer of the atmosphere. Nukleonika 2010, 55, 539–542. [Google Scholar]
- Sinkevičius, R. Council Directive 2013/59/Euratom of 5 December 2013 Laying Down Basic Safety Standards for Protection against the Dangers Arising from Exposure to Ionizing Radiation, and Repealing Directives 89/618/Euratom, 90/641/Euratom, 96/29/Euratom, 97/43/Euratom and 2003/122/Euratom. Official Journal of the European Union, 5 December 2013; EUR-Lex-32013L0059–EN. [Google Scholar]
- ICRP. Occupational Intakes of Radionuclides: Part 3. ICRP Publication 137. Ann. ICRP 2017, 46, 3–4. [Google Scholar]
- Fialova, E.; Otahal, P.; Vosahlik, J.; Mazanova, M. Equipment for Testing Measuring Devices at a Low-Level Radon Activity Concentration. Int. J. Environ. Res. Public Health 2020, 17, 1904. [Google Scholar] [CrossRef] [PubMed] [Green Version]
- EMPIR Project Metrology for Radon. Deliverable D7. Validation Report on the Traceability of Primary and Secondary Radon Calibration Facilities in Europe. Available online: http://metroradon.eu/wp-content/uploads/2017/06/16ENV10-MetroRADON-D7-final_accepted.pdf (accessed on 4 April 2022).
- Rusu, M.; Ghendov-Mosanu, A.; Sturza, R. EA 04/02 M: 2013; Evaluation of the Uncertainty of Measurement in Calibration. European Cooperation for Accreditation: Geneva, Switzerland, 2013. [Google Scholar]
- ISO 13528:2015 (010248); Statistical Methods for Use in Proficiency Testing by Interlaboratory Comparison. ISO: Geneva, Switzerland, 2015.

| Acronym | Institute | Country | Measuring Device |
|---|---|---|---|
| BEV-PTP | Physikalisch-technischer Prüfdienst, Bundesamt für Eich- und Vermessungswesen, Wien | Austria | AG * PQ2000 Pro |
| BfS | Federal Office for Radiation Protection, Berlin | Germany | AG DF2000 |
| CLOR | Central Laboratory for Radiological Protection, Warsaw | Poland | AG DF2000 |
| IFIN-HH | Horia Hulubei National Institute for R&D in Physics and Nuclear Engineering, Bucharest | Romania | RadonScout |
| IRSN | Institut de Radioprotection et de Sûreté Nucléaire, Fontenay-aux-Roses | France | AG PQ2000 |
| STUK | Radiation and Nuclear Safety Authority, Helsinki | Finland | AG PQ2000 |
| SUJCHBO (Coordinator) | National Institute for Nuclear, Chemical and Biological Protection, Milin | Czech Republic | AG DF2000 |
| INTE-UPC | Laboratory of 222Rn studies of the Institut de Tecniques Energetiques of the Universitat Politecnica de Catalunya, Barcelona | Spain | AG PQ2000 Pro |
| Parameter | Value |
|---|---|
| Integration time | 60 min |
| Exposure time | at least 24 h |
| Temperature | 22.3 ± 1.1 °C |
| Relative humidity | 51.2 ± 3.8% |
| Air pressure | 955.8 ± 8.6 hPa |
| Participants’ Code | av,Rn (Bq·m−3) | s(av,Rn) (Bq·m−3) | z-Score (-) | D (%) |
|---|---|---|---|---|
| 1 | 201 | 9 | 0.1 | 0.5 |
| 2 | 203 | 6 | 0.3 | 1.5 |
| 3 | 196 | 6 | −0.4 | −2.0 |
| 4 | 208 | 18 | 0.8 | 4.0 |
| 5 | 194 | 9 | −0.6 | −3.0 |
| 6 | 201 | 15 | 0.1 | 0.5 |
| 7 | 202 | 8 | 0.2 | 1.0 |
| 8 | 202 | 4 | 0.2 | 1.0 |
| Participants’ Code | av,Rn (Bq·m−3) | s(av,Rn) (Bq·m−3) | z-Score (-) | D (%) |
|---|---|---|---|---|
| 1 | 306 | 12 | 0.6 | 2.0 |
| 2 | 290 | 6 | −1.0 | −3.3 |
| 3 | 288 | 8 | −1.2 | −4.0 |
| 4 | 292 | 18 | −0.8 | −2.7 |
| 5 | 290 | 10 | −1.0 | −3.3 |
| 6 | 291 | 21 | −0.9 | −3.0 |
| 7 | 300 | 10 | 0 | 0 |
| 8 | 302 | 3 | 0.2 | 0.7 |
Publisher’s Note: MDPI stays neutral with regard to jurisdictional claims in published maps and institutional affiliations. |
© 2022 by the authors. Licensee MDPI, Basel, Switzerland. This article is an open access article distributed under the terms and conditions of the Creative Commons Attribution (CC BY) license (https://creativecommons.org/licenses/by/4.0/).
Share and Cite
Otahal, P.P.S.; Fialova, E.; Vosahlik, J.; Wiedner, H.; Grossi, C.; Vargas, A.; Michielsen, N.; Turtiainen, T.; Luca, A.; Wołoszczuk, K.; et al. Low-Level Radon Activity Concentration—A MetroRADON International Intercomparison. Int. J. Environ. Res. Public Health 2022, 19, 5810. https://doi.org/10.3390/ijerph19105810
Otahal PPS, Fialova E, Vosahlik J, Wiedner H, Grossi C, Vargas A, Michielsen N, Turtiainen T, Luca A, Wołoszczuk K, et al. Low-Level Radon Activity Concentration—A MetroRADON International Intercomparison. International Journal of Environmental Research and Public Health. 2022; 19(10):5810. https://doi.org/10.3390/ijerph19105810
Chicago/Turabian StyleOtahal, Petr P. S., Eliska Fialova, Josef Vosahlik, Hannah Wiedner, Claudia Grossi, Arturo Vargas, Nathalie Michielsen, Tuukka Turtiainen, Aurelian Luca, Katarzyna Wołoszczuk, and et al. 2022. "Low-Level Radon Activity Concentration—A MetroRADON International Intercomparison" International Journal of Environmental Research and Public Health 19, no. 10: 5810. https://doi.org/10.3390/ijerph19105810
APA StyleOtahal, P. P. S., Fialova, E., Vosahlik, J., Wiedner, H., Grossi, C., Vargas, A., Michielsen, N., Turtiainen, T., Luca, A., Wołoszczuk, K., & Beck, T. R. (2022). Low-Level Radon Activity Concentration—A MetroRADON International Intercomparison. International Journal of Environmental Research and Public Health, 19(10), 5810. https://doi.org/10.3390/ijerph19105810