Geometric Mean Serum Cotinine Concentrations Confirm a Continued Decline in Secondhand Smoke Exposure among U.S. Nonsmokers—NHANES 2003 to 2018
Abstract
1. Introduction
2. Materials and Methods
2.1. Overview
2.2. Participants
2.3. Cotinine Analysis
2.4. Analysis Changes
2.5. Quality Assurance
2.6. Long-Term Assay Stability
2.7. Statistical Analysis
3. Results
4. Discussion
5. Conclusions
Author Contributions
Funding
Institutional Review Board Statement
Informed Consent Statement
Data Availability Statement
Conflicts of Interest
Disclaimer
Appendix A
| Survey | Collection Years | Ages Collected | Serum Volume (mL) | Method of Extraction | Mass Spectrometer | LOD (ng/mL) |
|---|---|---|---|---|---|---|
| NHANES III phase 1 | 1988–1991 | ≥4 | 1 | manual liquid–liquid | API III | 0.05 |
| NHANES III phase 2 | 1991–1994 | ≥4 | 1 | manual liquid–liquid | API III | 0.05 |
| NHANES 1999–2000 | 1999–2000 | ≥3 | 1 | Chem Elut columns | API III | 0.05 |
| NHANES 2001–2002 * | 2001–2002 | ≥3 | 1/0.5 | Chem Elut columns | API 4000 | 0.015 |
| NHANES 2003–2004 | 2003–2004 | ≥3 | 0.5 | Chem Elut columns | API 4000 | 0.015 |
| NHANES 2005–2006 | 2005–2006 | ≥3 | 0.5 | Chem Elut columns | API 4000 | 0.015 |
| NHANES 2007–2008 | 2007–2008 | ≥3 | 0.5 | Chem Elut columns | API 4000 | 0.015 |
| NHANES 2009–2010 | 2009–2010 | ≥3 | 0.5 | Chem Elut columns | API 4000 | 0.015 |
| NHANES 2011–2012 | 2011–2012 | ≥3 | 0.5 | Chem Elut columns | API 4000 | 0.015 |
| NHANES 2013–2014 | 2013–2014 | ≥3 | 0.2 | Isolute SLE+ 96-well plates | API 6500 | 0.015 |
| NHANES 2015–2016 | 2015–2016 | ≥3 | 0.2 | Isolute SLE+ 96-well plates | API 6500 | 0.015 |
| NHANES 2017–2018 | 2017–2018 | ≥3 | 0.2 | Isolute SLE+ 96-well plates | API 6500 | 0.015 |
| Category | 2003–2004 | 2005–2006 | 2007–2008 | 2009–2010 | 2011–2012 | 2013–2014 | 2015–2016 | 2017–2018 |
|---|---|---|---|---|---|---|---|---|
| Overall | 78.3 | 76.5 | 75.9 | 67.7 | 58.4 | 53.8 | 53.2 | 52.2 |
| 3–5 years | 88.2 | 84.7 | 84.5 | 78.7 | 69.6 | 66.0 | 69.9 | 71.0 |
| 6–11 years | 83.8 | 79.3 | 83.4 | 71.6 | 66.8 | 57.9 | 62.8 | 60.1 |
| 12–19 years | 82.4 | 78.3 | 78.1 | 71.0 | 64.5 | 57.7 | 60.8 | 59.3 |
| 20–39 years | 79.6 | 78.4 | 78.6 | 71.0 | 61.3 | 60.5 | 56.8 | 60.5 |
| 40–59 years | 77.1 | 75.2 | 71.4 | 65.6 | 56.2 | 49.9 | 48.4 | 46.3 |
| 60–85 years | 70.5 | 72.0 | 72.9 | 61.4 | 49.0 | 45.7 | 45.0 | 41.3 |
| Male | 83.4 | 81.2 | 79.7 | 71.9 | 60.9 | 56.5 | 55.7 | 54.8 |
| Female | 74.1 | 72.7 | 72.8 | 64.1 | 56.3 | 51.4 | 51.1 | 50.0 |
| Non-Hispanic White | 76.5 | 74.6 | 75.0 | 64.6 | 52.7 | 48.0 | 48.8 | 48.9 |
| Non-Hispanic Black | 91.4 | 90.1 | 86.9 | 85.5 | 79.0 | 78.7 | 77.1 | 74.4 |
| Mexican American | 71.5 | 69.5 | 68.9 | 65.5 | 61.1 | 52.2 | 49.5 | 41.2 |
| Other Hispanic/Other Race/Multi-Racial | 81.6 | 80.6 | 77.6 | 70.8 | 64.7 | 61.5 | 56.7 | 57.3 |
| First Survey Period Studied | Last Survey Period Studied | Category | Log Difference | Standard Error | Adjusted p-Value | Percent Difference * |
|---|---|---|---|---|---|---|
| 2003–2004 | 2017–2018 | Overall | 0.346 | 0.055 | <0.0001 | −55.0 |
| 2003–2004 | 2017–2018 | 3–5 years | 0.347 | 0.117 | 0.022 | −55.0 |
| 2003–2004 | 2017–2018 | 6–11 years | 0.460 | 0.098 | <0.0001 | −65.3 |
| 2003–2004 | 2017–2018 | 12–19 years | 0.416 | 0.061 | <0.0001 | −61.6 |
| 2003–2004 | 2017–2018 | 20–39 years | 0.254 | 0.058 | 0.0001 | −44.2 |
| 2003–2004 | 2017–2018 | 40–59 years | 0.332 | 0.062 | <0.0001 | −53.5 |
| 2003–2004 | 2017–2018 | 60–85 years | 0.302 | 0.052 | <0.0001 | −50.1 |
| 2003–2004 | 2017–2018 | Male | 0.388 | 0.062 | <0.0001 | −59.1 |
| 2003–2004 | 2017–2018 | Female | 0.313 | 0.053 | <0.0001 | −51.3 |
| 2003–2004 | 2017–2018 | Non-Hispanic White | 0.357 | 0.067 | <0.0001 | −56.1 |
| 2003–2004 | 2017–2018 | Non-Hispanic Black | 0.299 | 0.081 | 0.0013 | −49.8 |
| 2003–2004 | 2017–2018 | Mexican American | 0.256 | 0.059 | 0.0001 | −44.5 |
| 2003–2004 | 2017–2018 | Other Hispanic/Other Race/Multi-Racial | 0.357 | 0.048 | <0.0001 | −56.1 |
| Parameter | Coefficient | 95% Lower Confidence Limit | 95% Upper Confidence Limit | Pr > |t| | Exponentiated Coefficient |
|---|---|---|---|---|---|
| Intercept | −1.086 | −1.165 | −1.007 | <0.0001 | 0.082 |
| NHANES survey cycle | −0.050 | −0.061 | −0.040 | <0.0001 | 0.890 |
| Parameter | Coefficient | 95% Lower Confidence Limit | 95% Upper Confidence Limit | Pr > |t| | Exponentiated Coefficient |
|---|---|---|---|---|---|
| Intercept | −1.097 | −1.199 | −0.995 | <0.0001 | 0.080 |
| Mexican American | −0.171 | −0.312 | −0.030 | 0.0180 | 0.675 |
| Non-Hispanic Black | 0.284 | 0.152 | 0.416 | <0.0001 | 1.924 |
| Other Hispanic/Other Race/Multi-Racial | −0.054 | −0.186 | 0.079 | 0.4243 | 0.884 |
| Non-Hispanic White | 0.000 | 0.000 | 0.000 | . | 1.000 |
| NHANES survey cycle | −0.055 | −0.068 | −0.041 | <0.0001 | 0.882 |
| NHANES survey cycle × Mexican American | 0.016 | −0.002 | 0.034 | 0.0828 | 1.037 |
| NHANES survey cycle × Non-Hispanic Black | 0.016 | −0.002 | 0.034 | 0.0778 | 1.037 |
| NHANES survey cycle × Other Hispanic/Other Race/Multi-Racial | 0.012 | −0.005 | 0.029 | 0.1818 | 1.027 |
| NHANES survey cycle × Non-Hispanic White | 0.000 | 0.000 | 0.000 | . | 1.000 |
| Parameter | Coefficient | 95% Lower Confidence Limit | 95% Upper Confidence Limit | Pr > |t| | Exponentiated Coefficient |
|---|---|---|---|---|---|
| Intercept | −1.116 | −1.201 | −1.030 | <0.0001 | 0.077 |
| 12–19 years | 0.197 | 0.102 | 0.291 | <0.0001 | 1.572 |
| 3–5 years | 0.361 | 0.207 | 0.515 | <0.0001 | 2.294 |
| 40–59 years | −0.067 | −0.141 | 0.007 | 0.0771 | 0.857 |
| 6–11 years | 0.319 | 0.198 | 0.441 | <0.0001 | 2.086 |
| 60–85 years | −0.141 | −0.216 | −0.067 | 0.0003 | 0.722 |
| 20–39 years | 0.000 | 0.000 | 0.000 | . | 1.000 |
| NHANES survey cycle | −0.042 | −0.053 | −0.030 | <0.0001 | 0.909 |
| NHANES survey cycle × 12–19 years | −0.013 | −0.026 | 0.000 | 0.0452 | 0.970 |
| NHANES survey cycle × 3–5 years | −0.007 | −0.028 | 0.014 | 0.4866 | 0.983 |
| NHANES survey cycle × 40–59 years | −0.008 | −0.019 | 0.002 | 0.1240 | 0.981 |
| NHANES survey cycle × 6–11 years | −0.023 | −0.039 | −0.007 | 0.0064 | 0.949 |
| NHANES survey cycle × 60–85 years | −0.003 | −0.014 | 0.007 | 0.5629 | 0.993 |
| NHANES survey cycle × 20–39 years | 0.000 | 0.000 | 0.000 | . | 1.000 |
| Parameter | Coefficient | 95% Lower Confidence Limit | 95% Upper Confidence Limit | Pr > |t| | Exponentiated Coefficient |
|---|---|---|---|---|---|
| Intercept | −1.158 | −1.237 | −1.079 | <0.0001 | 0.070 |
| Male | 0.159 | 0.115 | 0.203 | <0.0001 | 1.442 |
| Female | 0.000 | 0.000 | 0.000 | . | 1.000 |
| NHANES survey cycle | −0.045 | −0.055 | −0.034 | <0.0001 | 0.902 |
| NHANES survey cycle × Male | −0.013 | −0.020 | −0.006 | 0.0002 | 0.971 |
| NHANES survey cycle × Female | 0.000 | 0.000 | 0.000 | . | 1.000 |
References
- Advisory Committee to the Surgeon General of the Public Health Service. Smoking and Health: Report of the Advisory Committee to the Surgeon General of the Public Health Service; U.S. Department of Health, Education, and Welfare, Public Health Service, Center for Disease Control: Washington, DC, USA, 1964.
- National Center for Chronic Disease Prevention and Health Promotion (US) Office on Smoking and Health. The Health Consequences of Smoking—50 Years of Progress: A Report of the Surgeon General; Reports of the Surgeon General; Centers for Disease Control and Prevention (US): Atlanta, GA, USA, 2014.
- Office of the Surgeon General (US); Office on Smoking and Health (US). Reducing Tobacco Use: A Report of the Surgeon General; Reports of the Surgeon General; Centers for Disease Control and Prevention (US): Atlanta, GA, USA, 2000.
- Office of the Surgeon General (US); Office on Smoking and Health (US). The Health Consequences of Smoking: A Report of the Surgeon General; Reports of the Surgeon General; Centers for Disease Control and Prevention (US): Atlanta, GA, USA, 2004.
- National Research Council (US) Committee on Passive Smoking. Environmental Tobacco Smoke: Measuring Exposures and Assessing Health Effects; National Academies Press (US): Washington, DC, USA, 1986; ISBN 978-0-309-03730-3.
- California Environmental Protection Agency: Air Resources Board. Proposed Identification of Environmental Tobacco Smoke as a Toxic Air Contaminant. UCSF Cent. Tob. Control Res. Educ. 2005. Available online: https://escholarship.org/uc/item/8hk6960q (accessed on 2 February 2022).
- California Environmental Protection Agency. Health Effects of Exposure to Environmental Tobacco Smoke. Tob. Control 1997, 6, 346–353. [Google Scholar] [CrossRef] [PubMed][Green Version]
- U.S. EPA. Respiratory Health Effects of Passive Smoking (Also Known as Exposure to Secondhand Smoke or Environmental Tobacco Smoke ETS); U.S. Environmental Protection Agency, Office of Research and Development, Office of Health and Environmental Assessment: Washington, DC, USA, 1992.
- Office on Smoking and Health (US). The Health Consequences of Involuntary Exposure to Tobacco Smoke: A Report of the Surgeon General; Publications and Reports of the Surgeon General; Centers for Disease Control and Prevention (US): Atlanta, GA, USA, 2006.
- Centers for Disease Control and Prevention (US); National Center for Chronic Disease Prevention and Health Promotion (US); Office on Smoking and Health (US). How Tobacco Smoke Causes Disease: The Biology and Behavioral Basis for Smoking-Attributable Disease: A Report of the Surgeon General; Publications and Reports of the Surgeon General; Centers for Disease Control and Prevention (US): Atlanta, GA, USA, 2010; ISBN 978-0-16-084078-4.
- Institute of Medicine (US) Committee on Secondhand Smoke Exposure and Acute Coronary. Events Secondhand Smoke Exposure and Cardiovascular Effects: Making Sense of the Evidence; National Academies Press (US): Washington, DC, USA, 2010; ISBN 978-0-309-13839-0.
- Watts, R.R.; Langone, J.J.; Knight, G.J.; Lewtas, J. Cotinine Analytical Workshop Report: Consideration of Analytical Methods for Determining Cotinine in Human Body Fluids as a Measure of Passive Exposure to Tobacco Smoke. Environ. Health Perspect. 1990, 84, 173–182. [Google Scholar] [CrossRef] [PubMed]
- Benowitz, N.L. Cotinine as a Biomarker of Environmental Tobacco Smoke Exposure. Epidemiol. Rev. 1996, 18, 188–204. [Google Scholar] [CrossRef] [PubMed]
- St. Helen, G.; Havel, C.; Dempsey, D.; Jacob, P.; Benowitz, N.L. Nicotine Delivery, Retention, and Pharmacokinetics from Various Electronic Cigarettes. Addict. Abingdon Engl. 2016, 111, 535–544. [Google Scholar] [CrossRef]
- Pirkle, J.L.; Flegal, K.M.; Bernert, J.T.; Brody, D.J.; Etzel, R.A.; Maurer, K.R. Exposure of the US Population to Environmental Tobacco Smoke: The Third National Health and Nutrition Examination Survey, 1988 to 1991. JAMA 1996, 275, 1233–1240. [Google Scholar] [CrossRef] [PubMed]
- Pirkle, J.L.; Bernert, J.T.; Caudill, S.P.; Sosnoff, C.S.; Pechacek, T.F. Trends in the Exposure of Nonsmokers in the U.S. Population to Secondhand Smoke: 1988-2002. Environ. Health Perspect. 2006, 114, 853–858. [Google Scholar] [CrossRef] [PubMed]
- Bernert, J.T.; Turner, W.E.; Pirkle, J.L.; Sosnoff, C.S.; Akins, J.R.; Waldrep, M.K.; Ann, Q.; Covey, T.R.; Whitfield, W.E.; Gunter, E.W.; et al. Development and Validation of Sensitive Method for Determination of Serum Cotinine in Smokers and Nonsmokers by Liquid Chromatography/Atmospheric Pressure Ionization Tandem Mass Spectrometry. Clin. Chem. 1997, 43, 2281–2291. [Google Scholar] [CrossRef]
- Bernert, J.T.; McGuffey, J.E.; Morrison, M.A.; Pirkle, J.L. Comparison of Serum and Salivary Cotinine Measurements by a Sensitive High-Performance Liquid Chromatography-Tandem Mass Spectrometry Method as an Indicator of Exposure to Tobacco Smoke among Smokers and Nonsmokers. J. Anal. Toxicol. 2000, 24, 333–339. [Google Scholar] [CrossRef]
- Caudill, S.P.; Schleicher, R.L.; Pirkle, J.L. Multi-Rule Quality Control for the Age-Related Eye Disease Study. Stat. Med. 2008, 27, 4094–4106. [Google Scholar] [CrossRef]
- Bernert, J.T.; Jacob, P.; Holiday, D.B.; Benowitz, N.L.; Sosnoff, C.S.; Doig, M.V.; Feyerabend, C.; Aldous, K.M.; Sharifi, M.; Kellogg, M.D.; et al. Interlaboratory Comparability of Serum Cotinine Measurements at Smoker and Nonsmoker Concentration Levels: A Round-Robin Study. Nicotine Tob. Res. Off. J. Soc. Res. Nicotine Tob. 2009, 11, 1458–1466. [Google Scholar] [CrossRef] [PubMed]
- Tobacco and Volatiles Branch, Division of Laboratory Sciences, National Center for Environmental Health DLS Laboratory Procedure Manual: Cotinine and Hydroxycotinine in Serum. Available online: https://wwwn.cdc.gov/nchs/data/nhanes/2017-2018/labmethods/COT-J-MET-508.pdf (accessed on 2 February 2022).
- Tsai, J. Exposure to Secondhand Smoke among Nonsmokers—United States, 1988–2014. MMWR Morb. Mortal. Wkly. Rep. 2018, 67, 1342–1346. [Google Scholar] [CrossRef] [PubMed]
- Tsai, J.; Homa, D.M.; Neff, L.J.; Sosnoff, C.S.; Wang, L.; Blount, B.C.; Melstrom, P.C.; King, B.A. Trends in Secondhand Exposure 2011-2018: Impact and Implications of Expanding Serum Cotinine Range. Am. J. Prev. Med. 2021, 61, e109–e117. [Google Scholar] [CrossRef]
- American Nonsmokers’ Rights Foundation. Summary of 100% Smokefree State Laws and Population Protected by 100% U.S. Smokefree Laws. 2021. Available online: https://no-smoke.org/wp-content/uploads/pdf/SummaryUSPopList.pdf (accessed on 2 February 2022).
- Kim, S. Overview of Cotinine Cutoff Values for Smoking Status Classification. Int. J. Environ. Res. Public. Health 2016, 13, 1236. [Google Scholar] [CrossRef] [PubMed]
- Benowitz, N.L.; Bernert, J.T.; Caraballo, R.S.; Holiday, D.B.; Wang, J. Optimal Serum Cotinine Levels for Distinguishing Cigarette Smokers and Nonsmokers within Different Racial/Ethnic Groups in the United States between 1999 and 2004. Am. J. Epidemiol. 2009, 169, 236–248. [Google Scholar] [CrossRef] [PubMed]
- Benowitz, N.L.; Bernert, J.T.; Foulds, J.; Hecht, S.S.; Jacob, P.; Jarvis, M.J.; Joseph, A.; Oncken, C.; Piper, M.E. Biochemical Verification of Tobacco Use and Abstinence: 2019 Update. Nicotine Tob. Res. Off. J. Soc. Res. Nicotine Tob. 2020, 22, 1086–1097. [Google Scholar] [CrossRef] [PubMed]
- Murphy, S.E.; Sipe, C.J.; Choi, K.; Raddatz, L.M.; Koopmeiners, J.S.; Donny, E.C.; Hatsukami, D.K. Low Cotinine Glucuronidation Results in Higher Serum and Saliva Cotinine in African American Compared to White Smokers. Cancer Epidemiol. Biomark. Prev. Publ. Am. Assoc. Cancer Res. Cosponsored Am. Soc. Prev. Oncol. 2017, 26, 1093–1099. [Google Scholar] [CrossRef]
- Tattan-Birch, H.; Jarvis, M.J. Children’s exposure to second-hand smoke 10 years on from smoke-free legislation in England: Cotinine data from the Health Survey for England 1998-2018. Lancet Reg. Health Eur. 2022, 15, 100315. [Google Scholar] [CrossRef]
- Jarvis, M.J.; Goddard, E.; Higgins, V.; Feyerabend, C.; Bryant, A.; Cook, D.G. Children’s Exposure to Passive Smoking in England since the 1980s: Cotinine Evidence from Population Surveys. BMJ 2000, 321, 343–345. [Google Scholar] [CrossRef]
- Mbulo, L.; Palipudi, K.M.; Andes, L.; Morton, J.; Bashir, R.; Fouad, H.; Ramanandraibe, N.; Caixeta, R.; Dias, R.C.; Wijnhoven, T.M.A.; et al. Secondhand Smoke Exposure at Home among One Billion Children in 21 Countries: Findings from the Global Adult Tobacco Survey (GATS). Tob. Control 2016, 25, e95–e100. [Google Scholar] [CrossRef]
- Nguyen, K.H.; King, B.A.; Dube, S.R. Association between Current Asthma and Secondhand Smoke Exposure in Vehicles among Adults Living in Four US States. Tob. Control 2015, 24, 376–381. [Google Scholar] [CrossRef] [PubMed]
- Czogala, J.; Goniewicz, M.L.; Fidelus, B.; Zielinska-Danch, W.; Travers, M.J.; Sobczak, A. Secondhand Exposure to Vapors from Electronic Cigarettes. Nicotine Tob. Res. 2014, 16, 655–662. [Google Scholar] [CrossRef] [PubMed]
- Johnson, J.M.; Naeher, L.P.; Yu, X.; Sosnoff, C.; Wang, L.; Rathbun, S.L.; De Jesús, V.R.; Xia, B.; Holder, C.; Muilenburg, J.L.; et al. A Biomonitoring Assessment of Secondhand Exposures to Electronic Cigarette Emissions. Int. J. Hyg. Environ. Health 2019, 222, 816–823. [Google Scholar] [CrossRef] [PubMed]
- Melstrom, P.; Sosnoff, C.; Koszowski, B.; King, B.A.; Bunnell, R.; Le, G.; Wang, L.; Thanner, M.H.; Kenemer, B.; Cox, S.; et al. Systemic Absorption of Nicotine Following Acute Secondhand Exposure to Electronic Cigarette Aerosol in a Realistic Social Setting. Int. J. Hyg. Environ. Health 2018, 221, 816–822. [Google Scholar] [CrossRef]
- Son, Y.; Giovenco, D.P.; Delnevo, C.; Khlystov, A.; Samburova, V.; Meng, Q. Indoor Air Quality and Passive E-Cigarette Aerosol Exposures in Vape-Shops. Nicotine Tob. Res. 2020, 22, 1772–1779. [Google Scholar] [CrossRef]
- Jones, I.; St Helen, G.; Meyers, M.; Dempsey, D.A.; Havel, C.; Jacob, P.; Northcross, A.; Hammond, S.K.; Benowitz, N.L. Biomarkers of Secondhand Smoke Exposure in Automobiles. Tob. Control 2014, 23, 51–57. [Google Scholar] [CrossRef]
- Bernert, J.T.; Gordon, S.M.; Jain, R.B.; Brinkman, M.C.; Sosnoff, C.S.; Seyler, T.H.; Xia, Y.; McGuffey, J.E.; Ashley, D.L.; Pirkle, J.L.; et al. Increases in Tobacco Exposure Biomarkers Measured in Non-Smokers Exposed to Sidestream Cigarette Smoke under Controlled Conditions. Biomarkers 2009, 14, 82–93. [Google Scholar] [CrossRef]
- Zhang, L.; Wang, L.; Li, Y.; Xia, Y.; Chang, C.M.; Xia, B.; Sosnoff, C.S.; Pine, B.N.; deCastro, B.R.; Blount, B.C. Evaluation of Tobacco Smoke and Diet as Sources of Exposure to Two Heterocyclic Aromatic Amines for the U.S. Population: NHANES 2013–2014. Cancer Epidemiol. Biomark. Prev. Publ. Am. Assoc. Cancer Res. Cosponsored Am. Soc. Prev. Oncol. 2020, 29, 103–111. [Google Scholar] [CrossRef]
- Bhandari, D.; Zhang, L.; Zhu, W.; De Jesús, V.R.; Blount, B.C. Optimal Cutoff Concentration of Urinary Cyanoethyl Mercapturic Acid for Differentiating Cigarette Smokers from Nonsmokers. Nicotine Tob. Res. 2021, 24, 761–767. [Google Scholar] [CrossRef]
- Goniewicz, M.L.; Eisner, M.D.; Lazcano-Ponce, E.; Zielinska-Danch, W.; Koszowski, B.; Sobczak, A.; Havel, C.; Jacob, P.; Benowitz, N.L. Comparison of Urine Cotinine and the Tobacco-Specific Nitrosamine Metabolite 4-(Methylnitrosamino)-1-(3-Pyridyl)-1-Butanol (NNAL) and Their Ratio to Discriminate Active from Passive Smoking. Nicotine Tob. Res. Off. J. Soc. Res. Nicotine Tob. 2011, 13, 202–208. [Google Scholar] [CrossRef]
| Category | 2003–2004 | 2005–2006 | 2007–2008 | 2009–2010 | 2011–2012 | 2013–2014 | 2015–2016 | 2017–2018 |
|---|---|---|---|---|---|---|---|---|
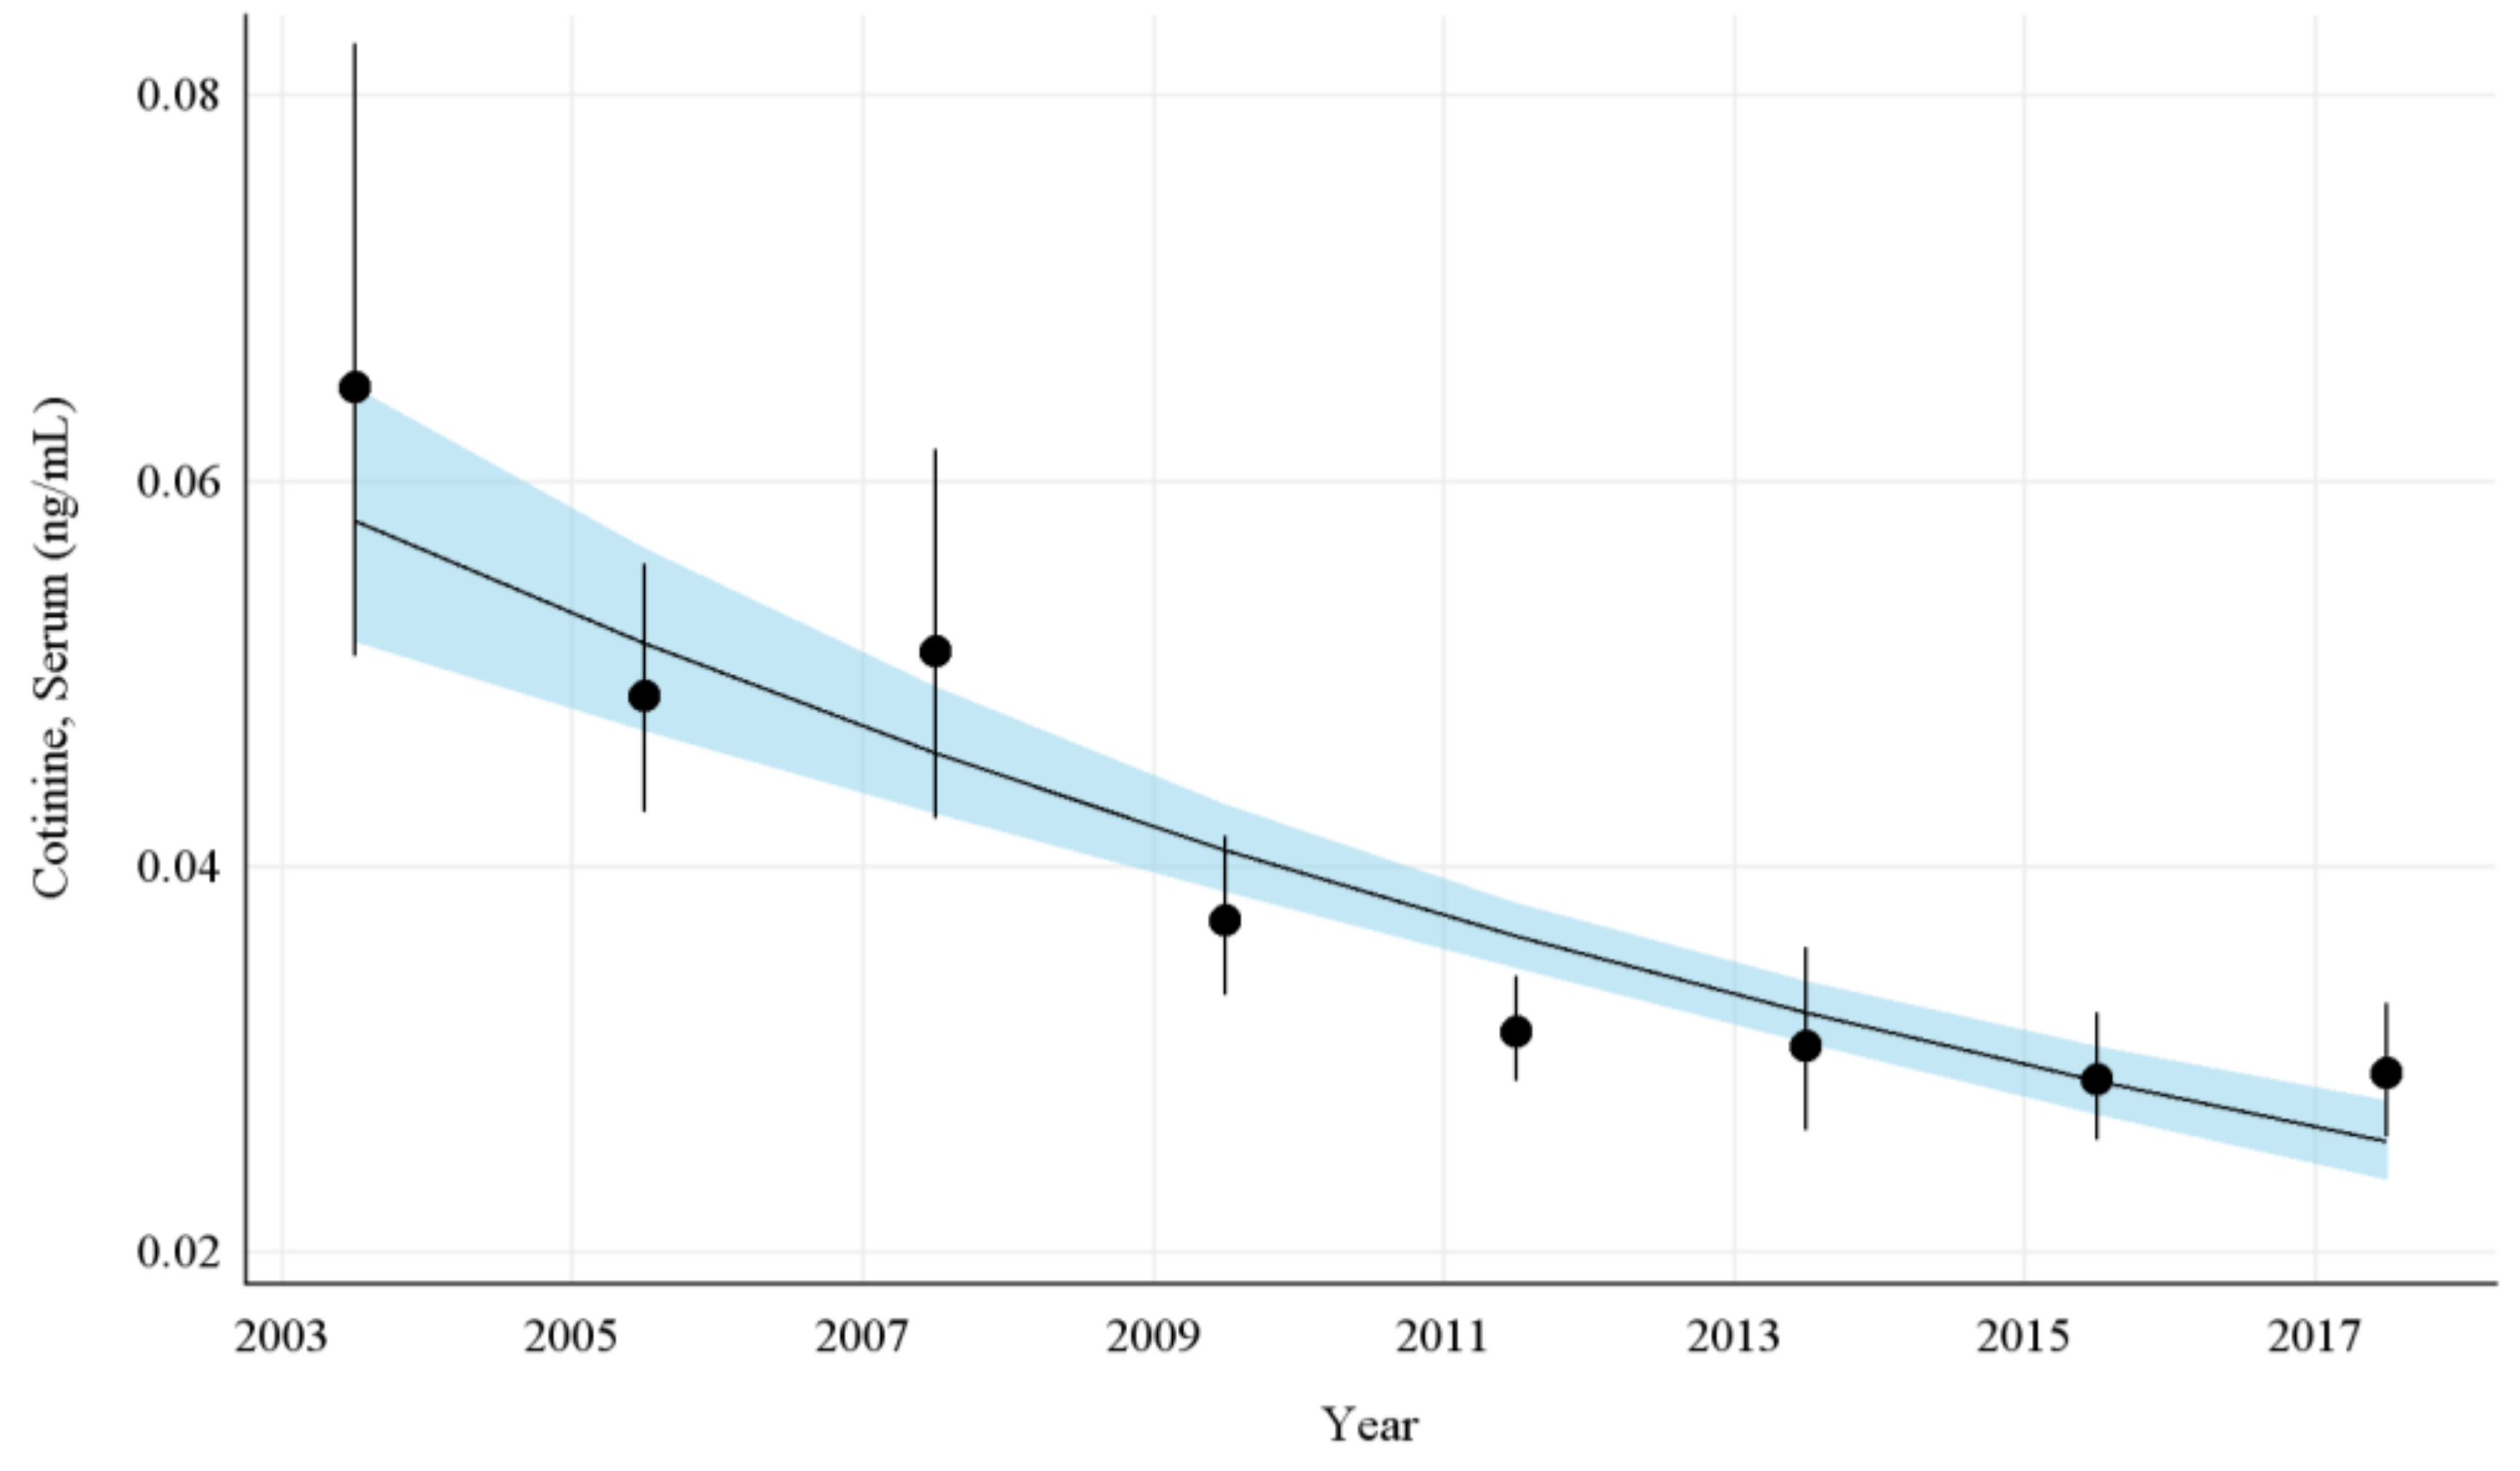
| Overall | 0.065 [0.052, 0.081] n = 6130 | 0.049 [0.043, 0.055] n = 6114 | 0.051 [0.043, 0.061] n = 5998 | 0.037 [0.034, 0.041] n = 6450 | 0.031 [0.029, 0.034] * n = 5938 | 0.031 [0.027, 0.035] * n = 6394 | 0.029 [0.026, 0.032] * n = 6207 | 0.029 [0.026, 0.033] * n = 5724 |
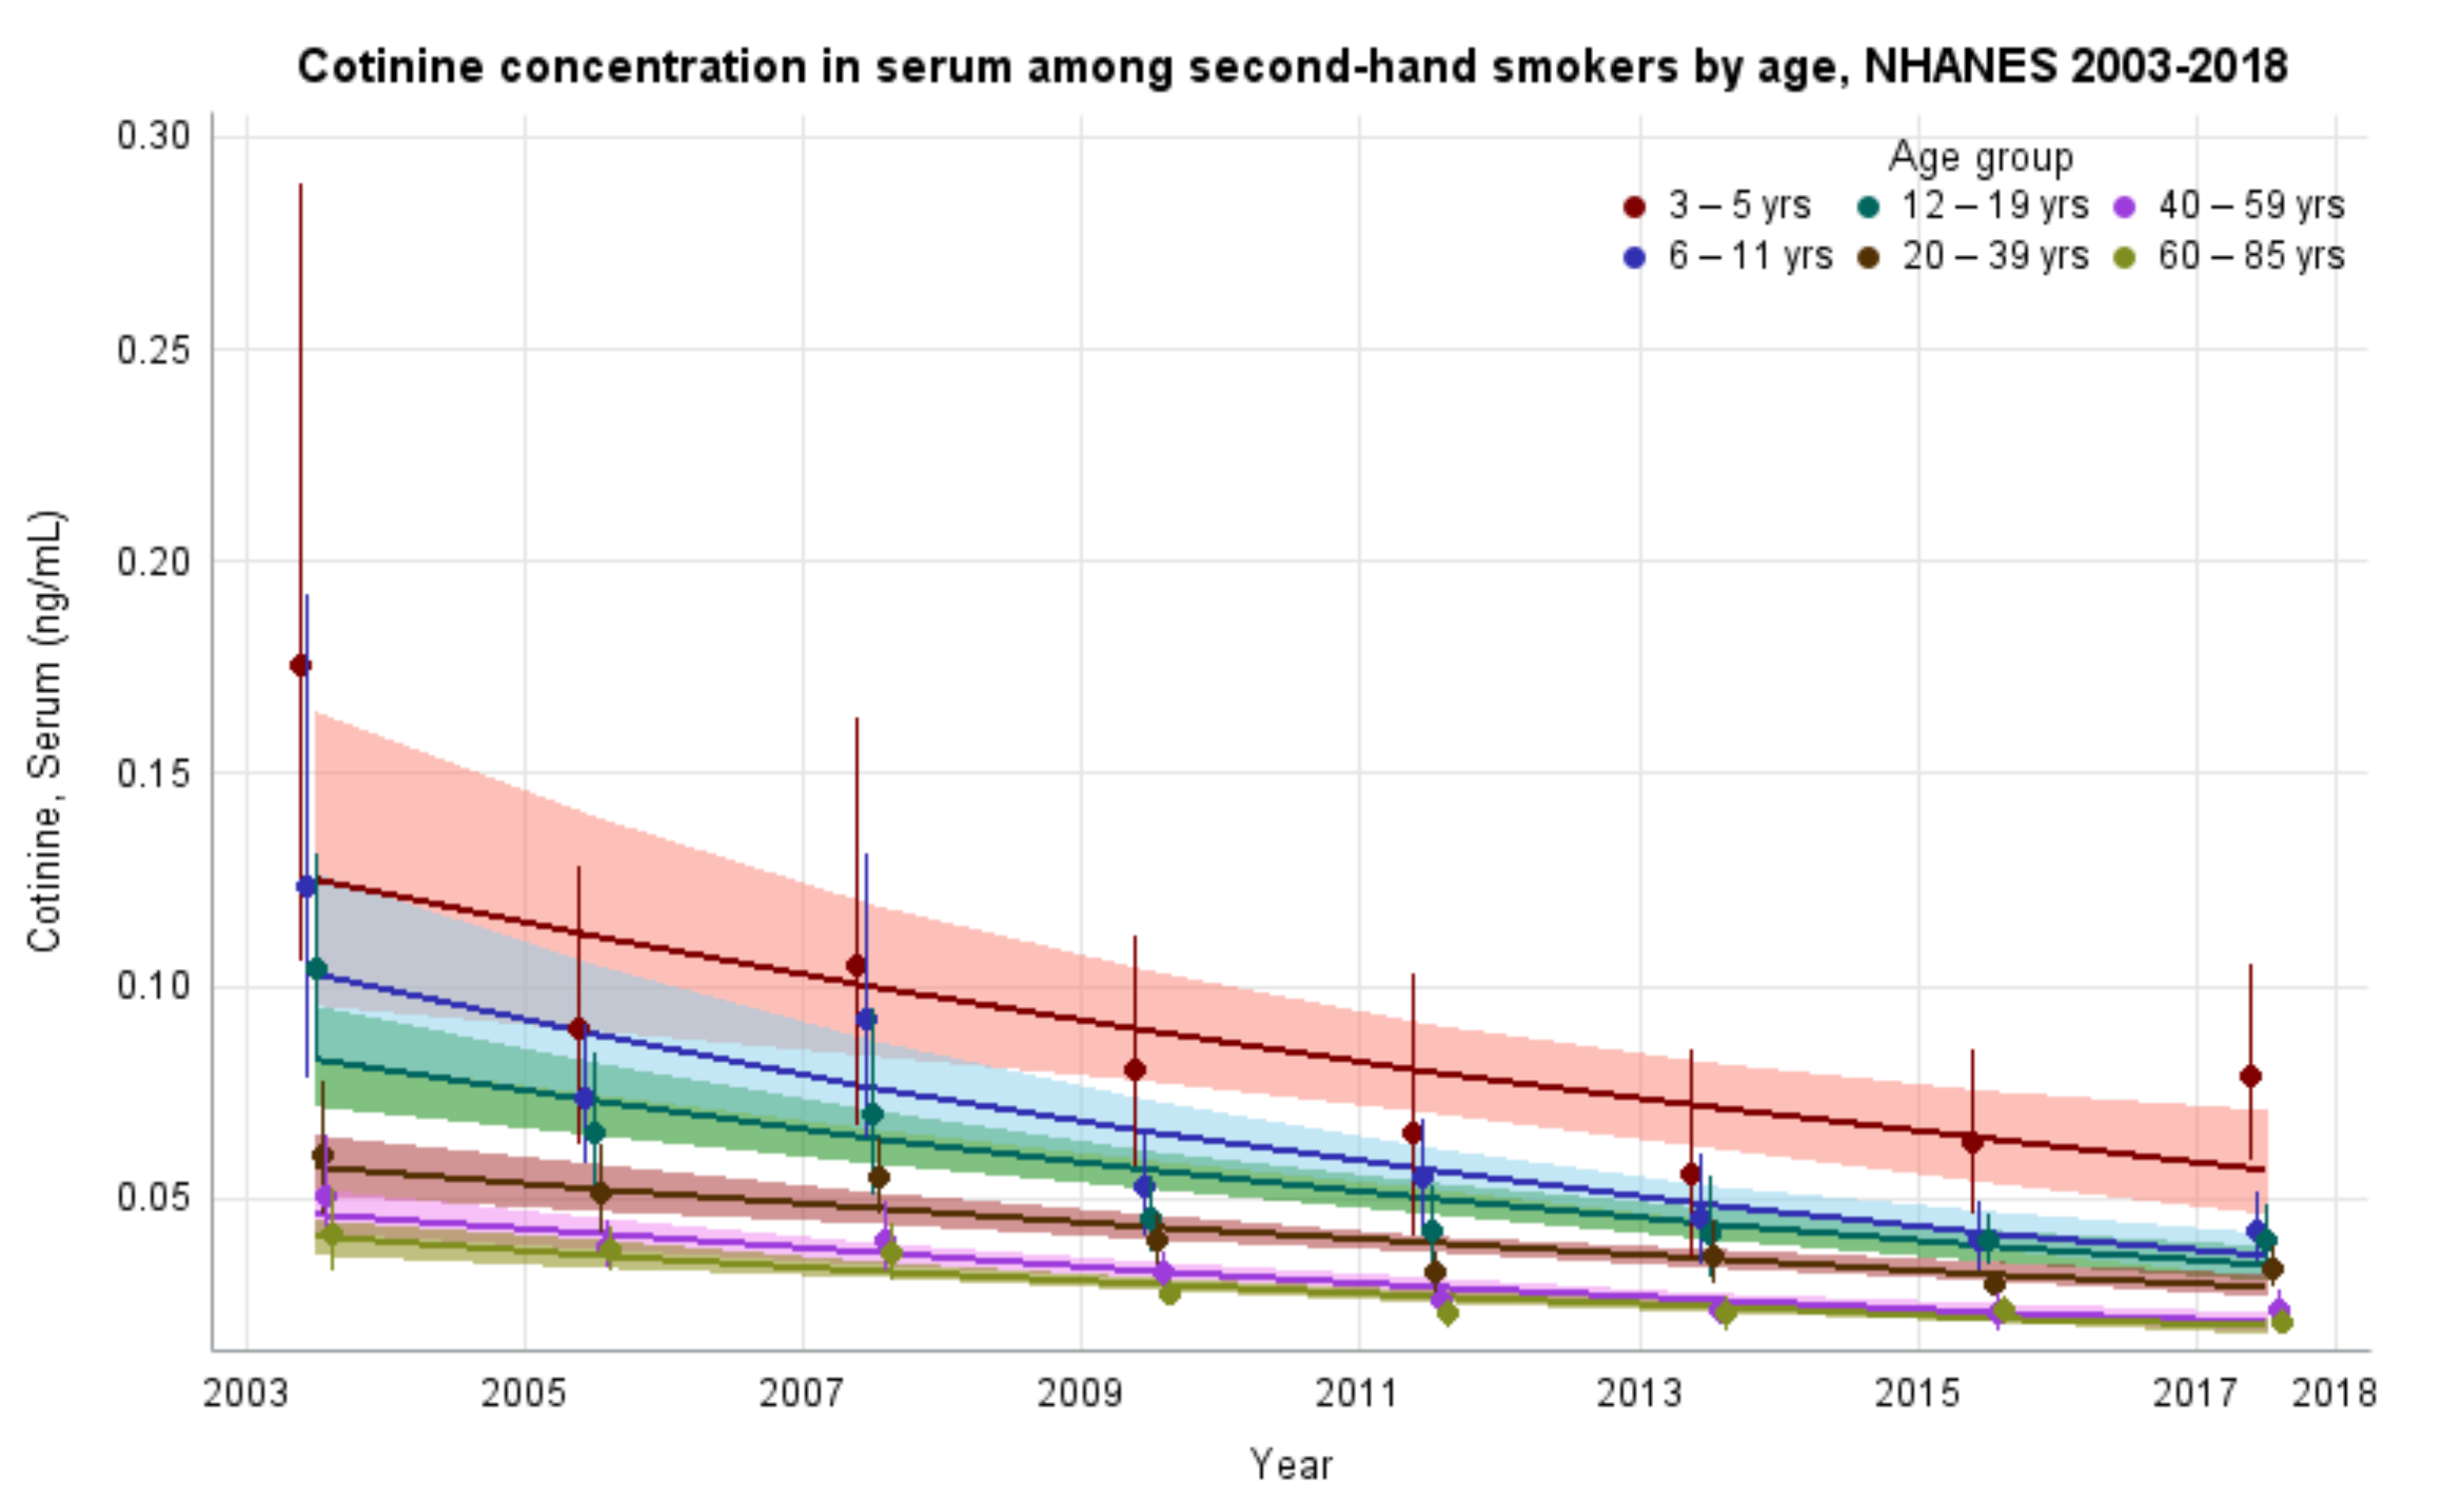
| 3–5 years | 0.175 [0.110, 0.279] n = 420 | 0.090 [0.065, 0.125] n = 396 | 0.105 [0.070, 0.158] n = 364 | 0.080 [0.059, 0.109] n = 386 | 0.066 [0.043, 0.100] n = 360 | 0.056 [0.038, 0.082] n = 400 | 0.063 [0.048, 0.083] n = 394 | 0.079 [0.060, 0.103] n = 330 |
| 6–11 years | 0.123 [0.082, 0.186] n = 832 | 0.073 [0.060, 0.090] n = 900 | 0.092 [0.066, 0.128] n = 973 | 0.053 [0.043, 0.066] n = 969 | 0.055 [0.044, 0.068] n = 988 | 0.046 [0.035, 0.059] * n = 1045 | 0.040 [0.034, 0.048] n = 994 | 0.043 [0.036, 0.051] n = 806 |
| 12–19 years | 0.104 [0.084, 0.129] n = 1723 | 0.065 [0.052, 0.082] n = 1610 | 0.070 [0.052, 0.092] n = 868 | 0.046 [0.038, 0.054] n = 962 | 0.043 [0.035, 0.052] n = 943 | 0.042 [0.032, 0.054] * n = 1071 | 0.040 [0.036, 0.046] n = 998 | 0.040 [0.033, 0.048] * n = 899 |
| 20–39 years | 0.060 [0.048, 0.076] n = 970 | 0.051 [0.043, 0.062] n = 1145 | 0.055 [0.047, 0.063] n = 1045 | 0.040 [0.036, 0.045] n = 1224 | 0.033 [0.029, 0.037] n = 1190 | 0.037 [0.031, 0.044] n = 1175 | 0.030 [0.027, 0.033] * n = 1178 | 0.034 [0.030, 0.038] n = 991 |
| 40–59 years | 0.051 [0.041, 0.064] n = 828 | 0.039 [0.034, 0.044] n = 931 | 0.040 [0.034, 0.048] n = 1150 | 0.032 [0.029, 0.037] n = 1325 | 0.026 [0.024, 0.028] * n = 1180 | 0.024 [0.021, 0.027] * n = 1283 | 0.023 [0.020, 0.027] * n = 1242 | 0.024 [0.020, 0.028] * n = 1135 |
| 60–85 years | 0.042 [0.034, 0.051] n = 1357 | 0.038 [0.034, 0.043] n = 1132 | 0.037 [0.032, 0.043] n = 1598 | 0.028 [0.025, 0.030] n = 1584 | 0.023 [0.020, 0.026] * n = 1277 | 0.023 [0.020, 0.026] * n = 1420 | 0.024 [0.021, 0.027] * n = 1401 | 0.021 [0.018, 0.024] * n = 1563 |
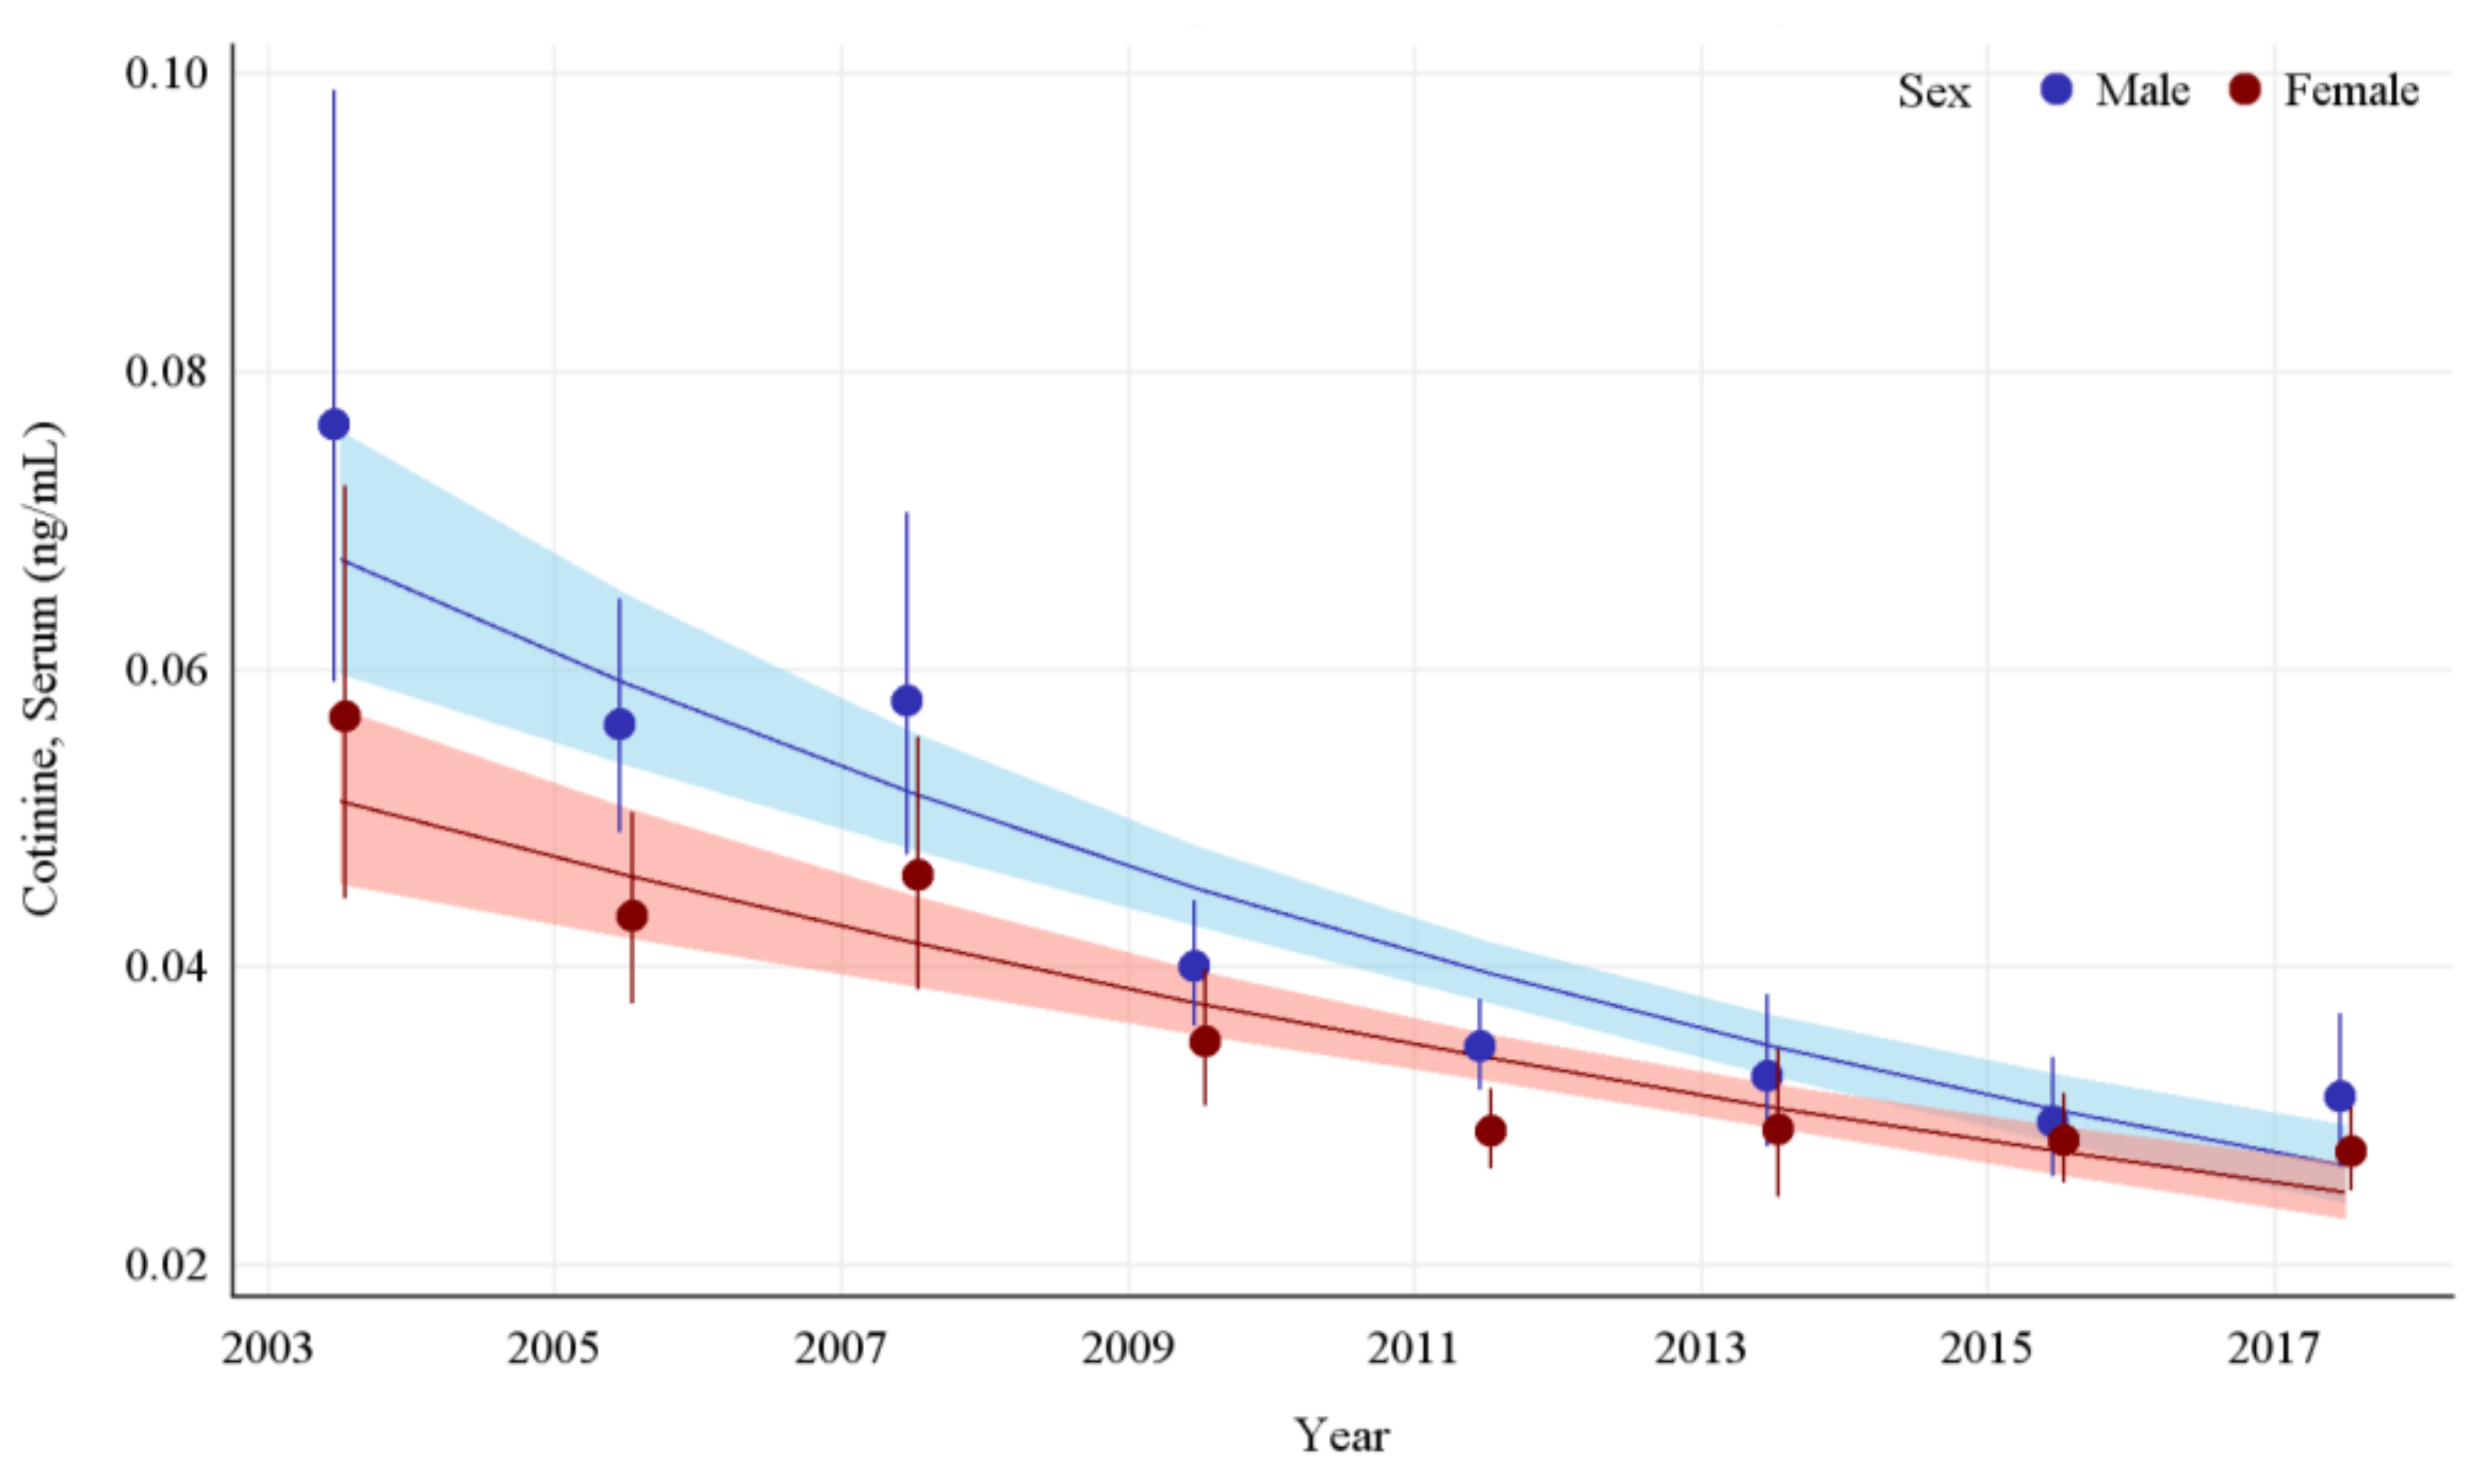
| Male | 0.076 [0.060, 0.097] n = 2822 | 0.056 [0.049, 0.064] n = 2775 | 0.058 [0.048, 0.070] n = 2824 | 0.040 [0.036, 0.044] n = 3041 | 0.035 [0.032, 0.038] n = 2781 | 0.033 [0.028, 0.038] * n = 2965 | 0.030 [0.026, 0.034] * n = 2854 | 0.031 [0.027, 0.036] * n = 2612 |
| Female | 0.057 [0.045, 0.071] n = 3308 | 0.043 [.038, 0.050] n = 3339 | 0.046 [0.039, 0.055] n = 3174 | 0.035 [0.031, 0.040] n = 3409 | 0.029 [0.027, 0.032] * n = 3157 | 0.029 [0.025, 0.034] * n = 3429 | 0.028 [0.026, 0.031] * n = 3353 | 0.028 [0.025, 0.030] * n = 3112 |
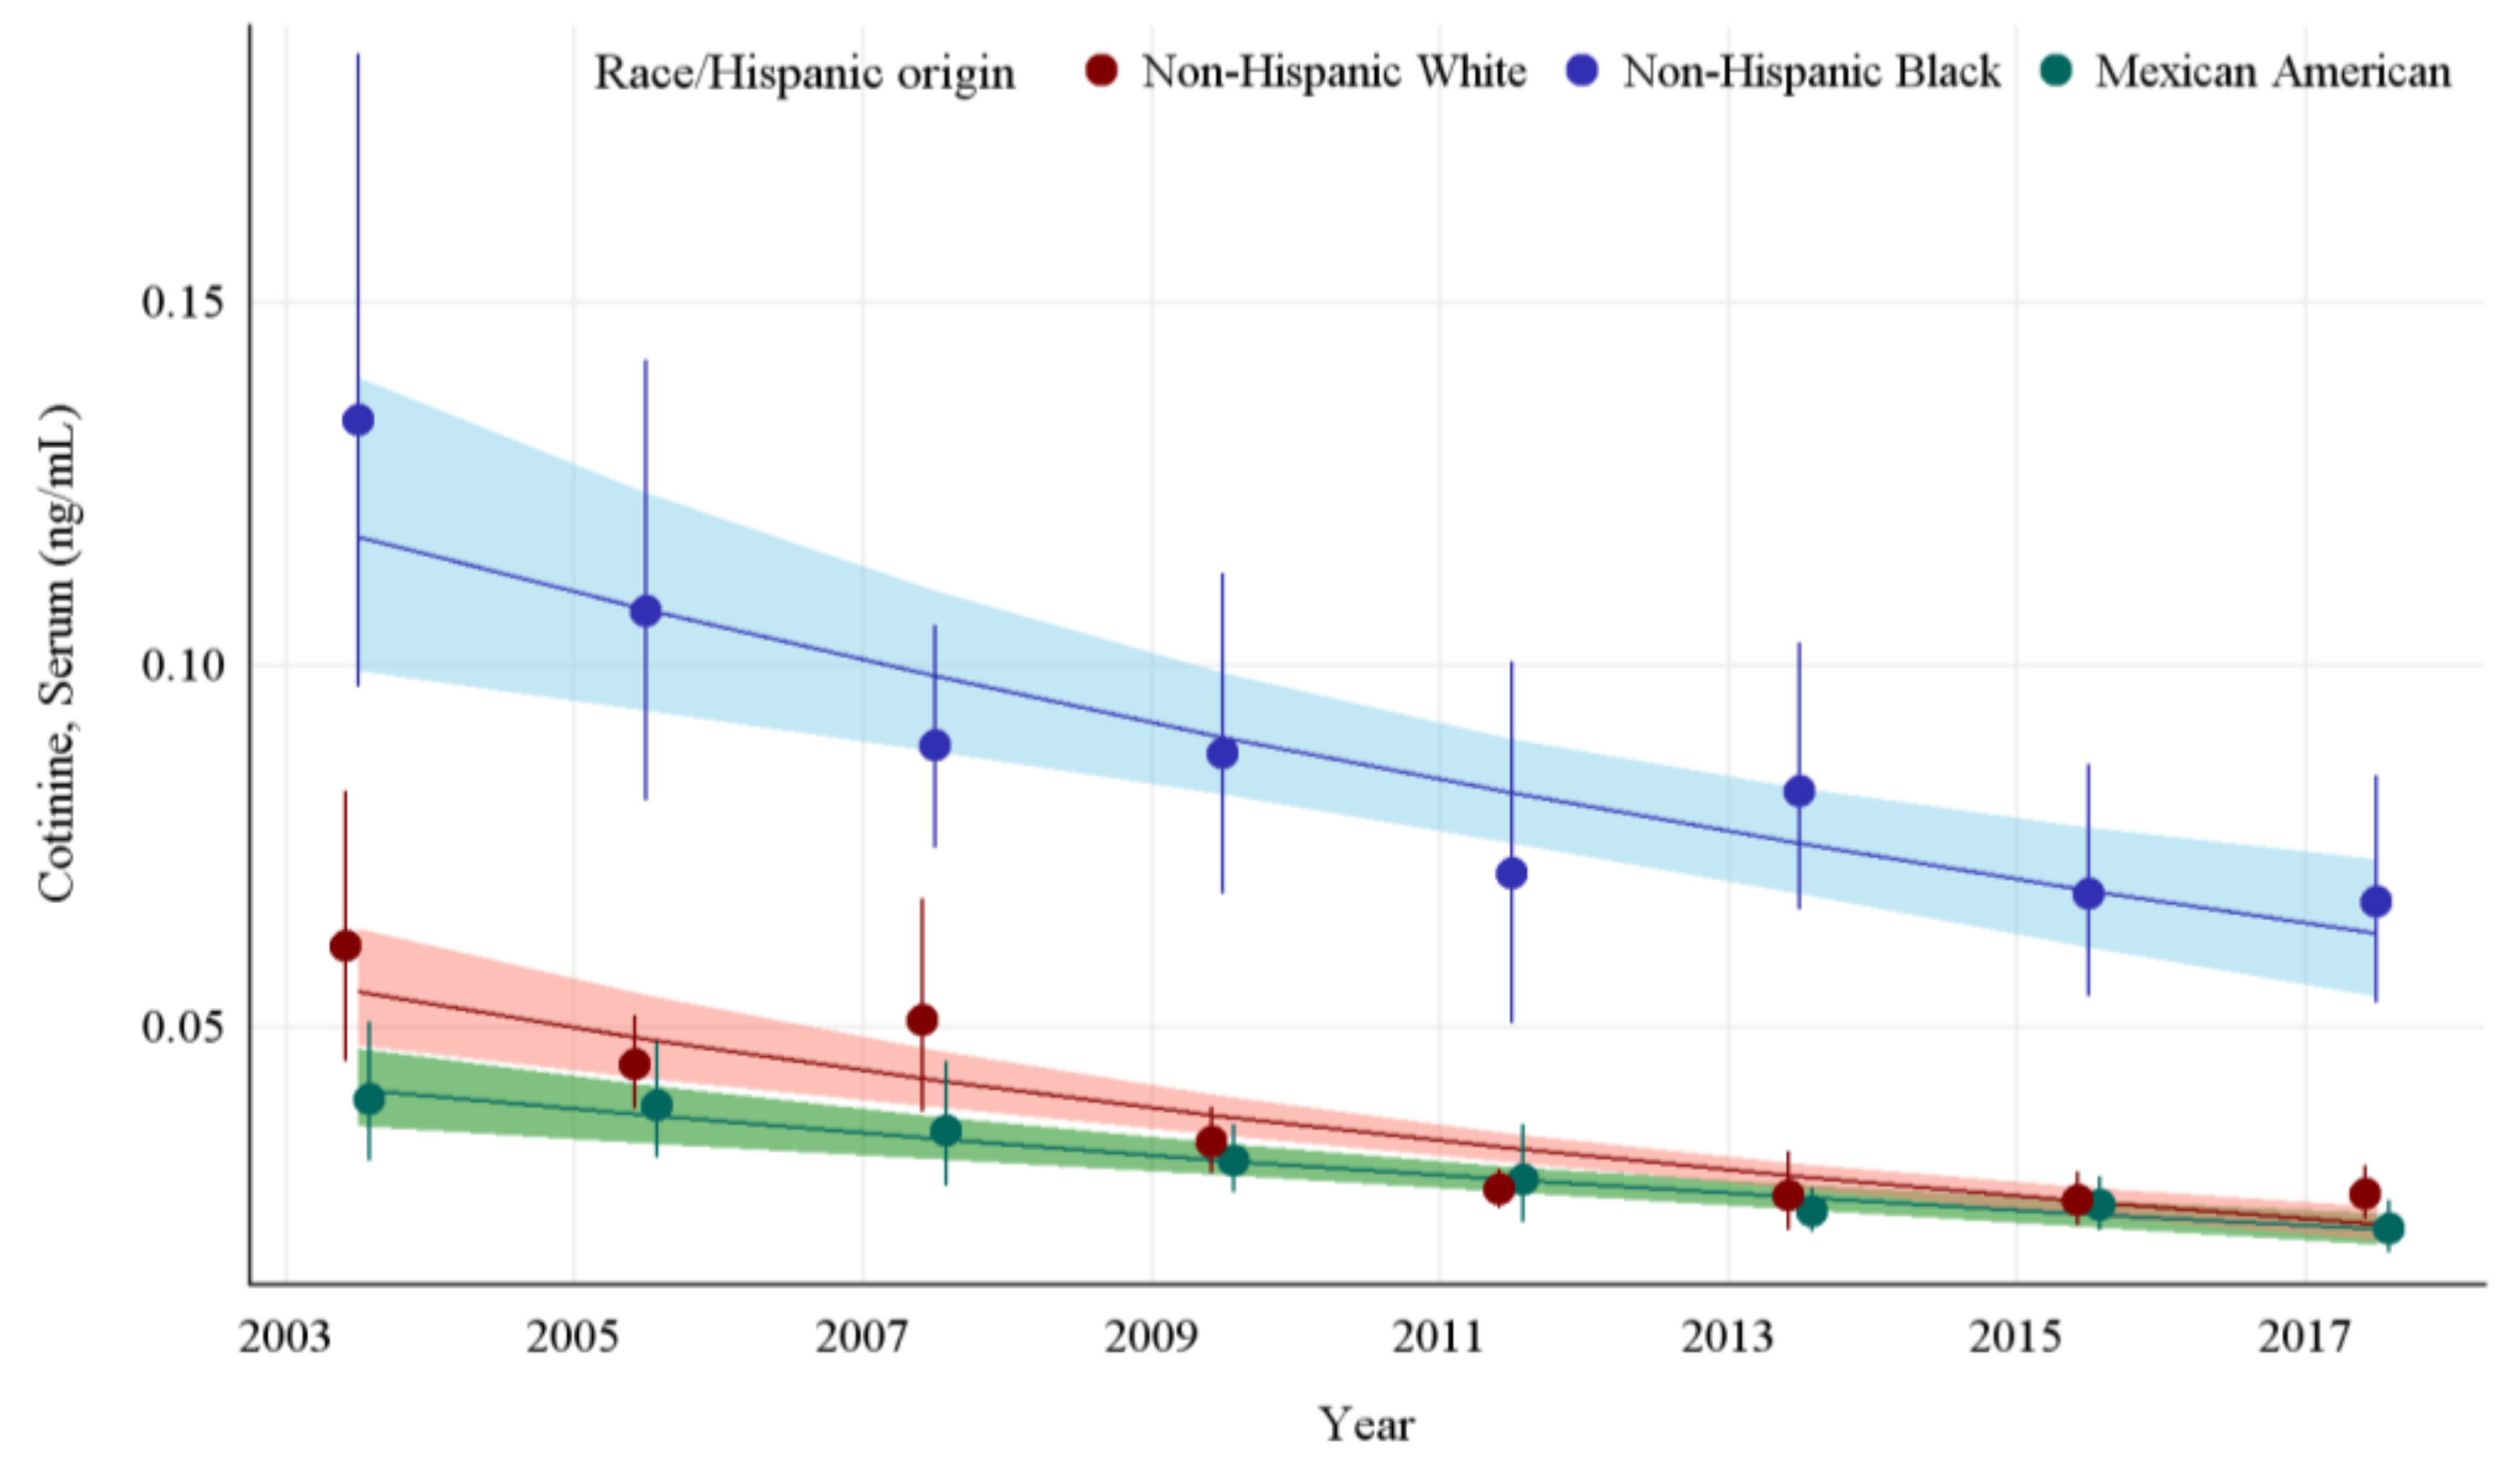
| Non-Hispanic White | 0.061 [0.046, 0.081] n = 2416 | 0.045 [0.039, 0.051] n = 2329 | 0.051 [0.039, 0.066] n = 2414 | 0.034 [0.030, 0.038] n = 2674 | 0.027 [0.025, 0.030] * n = 1781 | 0.027 [0.022, 0.032] * n = 2245 | 0.026 [0.023, 0.030] * n = 1808 | 0.027 [0.024, 0.031] * n = 1820 |
| Non-Hispanic Black | 0.134 [0.099, 0.180] n = 1622 | 0.107 [0.083, 0.139] n = 1593 | 0.089 [0.075, 0.104] n = 1229 | 0.088 [0.069, 0.111] n = 1101 | 0.071 [0.052, 0.098] n = 1550 | 0.082 [0.067, 0.101] n = 1279 | 0.068 [0.055, 0.085] n = 1209 | 0.067 [0.054, 0.083] n = 1183 |
| Mexican American | 0.040 [0.032, 0.050] n = 1617 | 0.039 [0.032, 0.047] n = 1704 | 0.036 [0.028, 0.044] n = 1340 | 0.032 [0.027, 0.036] n = 1532 | 0.029 [0.023, 0.036] n = 850 | 0.025 [0.022, 0.028] * n = 1219 | 0.025 [0.022, 0.029] * n = 1323 | 0.022 [0.019, 0.026] * n = 952 |
| Other Hispanic/Other Race/Multi-Racial | 0.066 [0.055, 0.079] n = 475 | 0.045 [0.037, 0.053] n = 488 | 0.044 [0.036, 0.054] n = 1015 | 0.034 [0.029, 0.039] n = 1143 | 0.032 [0.027, 0.036] n = 1757 | 0.033 [0.028, 0.038] n = 1651 | 0.028 [0.024, 0.031] * n = 1867 | 0.029 [0.026, 0.033] * n = 1769 |
| Category 1 | Category 2 | Log Difference | Standard Error | Adjusted p-Value | Percent Difference * |
|---|---|---|---|---|---|
| 3–5 years | 6–11 years | 0.266 | 0.059 | 0.0002 | −45.8 |
| 3–5 years | 12–19 years | 0.296 | 0.047 | <0.0001 | −49.4 |
| 3–5 years | 20–39 years | 0.370 | 0.051 | <0.0001 | −57.4 |
| 3–5 years | 40–59 years | 0.523 | 0.059 | <0.0001 | −70.0 |
| 3–5 years | 60–85 years | 0.578 | 0.052 | <0.0001 | −73.6 |
| 6–11 years | 12–19 years | 0.030 | 0.034 | 1.0000 | −6.67 |
| 6–11 years | 20–39 years | 0.104 | 0.045 | 0.3409 | −21.3 |
| 6–11 years | 40–59 years | 0.257 | 0.050 | <0.0001 | −44.7 |
| 6–11 years | 60–85 years | 0.312 | 0.032 | <0.0001 | −51.2 |
| 12–19 years | 20–39 years | 0.074 | 0.039 | 0.9295 | −15.7 |
| 12–19 years | 40–59 years | 0.227 | 0.046 | <0.0001 | −40.7 |
| 12–19 years | 60–85 years | 0.282 | 0.032 | <0.0001 | −47.7 |
| 20–39 years | 40–59 years | 0.153 | 0.035 | 0.0005 | −29.7 |
| 20–39 years | 60–85 years | 0.208 | 0.034 | <0.0001 | −38.0 |
| 40–59 years | 60–85 years | 0.055 | 0.039 | 1.0000 | −11.8 |
| Female | Male | −0.054 | 0.026 | 0.0384 | 13.2 |
| Non-Hispanic White | Non-Hispanic Black | −0.398 | 0.041 | <0.0001 | 150.0 |
| Non-Hispanic White | Mexican American | 0.084 | 0.031 | 0.0491 | −17.6 |
| Non-Hispanic White | Other Hispanic/Other Race/Multi-Racial | −0.034 | 0.035 | 1.0000 | 8.2 |
| Mexican American | Non-Hispanic Black | −0.482 | 0.041 | <0.0001 | 203.5 |
| Mexican American | Other Hispanic/Other Race/Multi-Racial | −0.119 | 0.038 | 0.0153 | 31.3 |
| Non-Hispanic Black | Other Hispanic/Other Race/Multi-Racial | 0.364 | 0.038 | <0.0001 | −56.7 |
Publisher’s Note: MDPI stays neutral with regard to jurisdictional claims in published maps and institutional affiliations. |
© 2022 by the authors. Licensee MDPI, Basel, Switzerland. This article is an open access article distributed under the terms and conditions of the Creative Commons Attribution (CC BY) license (https://creativecommons.org/licenses/by/4.0/).
Share and Cite
Caron, K.T.; Zhu, W.; Bernert, J.T.; Wang, L.; Blount, B.C.; Dortch, K.; Hunter, R.E.; Harmon, T.; Akins, J.R.; Tsai, J.; et al. Geometric Mean Serum Cotinine Concentrations Confirm a Continued Decline in Secondhand Smoke Exposure among U.S. Nonsmokers—NHANES 2003 to 2018. Int. J. Environ. Res. Public Health 2022, 19, 5862. https://doi.org/10.3390/ijerph19105862
Caron KT, Zhu W, Bernert JT, Wang L, Blount BC, Dortch K, Hunter RE, Harmon T, Akins JR, Tsai J, et al. Geometric Mean Serum Cotinine Concentrations Confirm a Continued Decline in Secondhand Smoke Exposure among U.S. Nonsmokers—NHANES 2003 to 2018. International Journal of Environmental Research and Public Health. 2022; 19(10):5862. https://doi.org/10.3390/ijerph19105862
Chicago/Turabian StyleCaron, Kevin T., Wanzhe Zhu, John T. Bernert, Lanqing Wang, Benjamin C. Blount, Kristin Dortch, Ronald E. Hunter, Tia Harmon, J. Ricky Akins, James Tsai, and et al. 2022. "Geometric Mean Serum Cotinine Concentrations Confirm a Continued Decline in Secondhand Smoke Exposure among U.S. Nonsmokers—NHANES 2003 to 2018" International Journal of Environmental Research and Public Health 19, no. 10: 5862. https://doi.org/10.3390/ijerph19105862
APA StyleCaron, K. T., Zhu, W., Bernert, J. T., Wang, L., Blount, B. C., Dortch, K., Hunter, R. E., Harmon, T., Akins, J. R., Tsai, J., Homa, D. M., Pirkle, J. L., & Sosnoff, C. S. (2022). Geometric Mean Serum Cotinine Concentrations Confirm a Continued Decline in Secondhand Smoke Exposure among U.S. Nonsmokers—NHANES 2003 to 2018. International Journal of Environmental Research and Public Health, 19(10), 5862. https://doi.org/10.3390/ijerph19105862


