
Do Budget Cigarettes Emit More Particles? An Aerosol Spectrometric Comparison of Particulate Matter Concentrations between Private-Label Cigarettes and More Expensive Brand-Name Cigarettes


Abstract
:1. Introduction
2. Materials and Methods
2.1. Tobacco Products
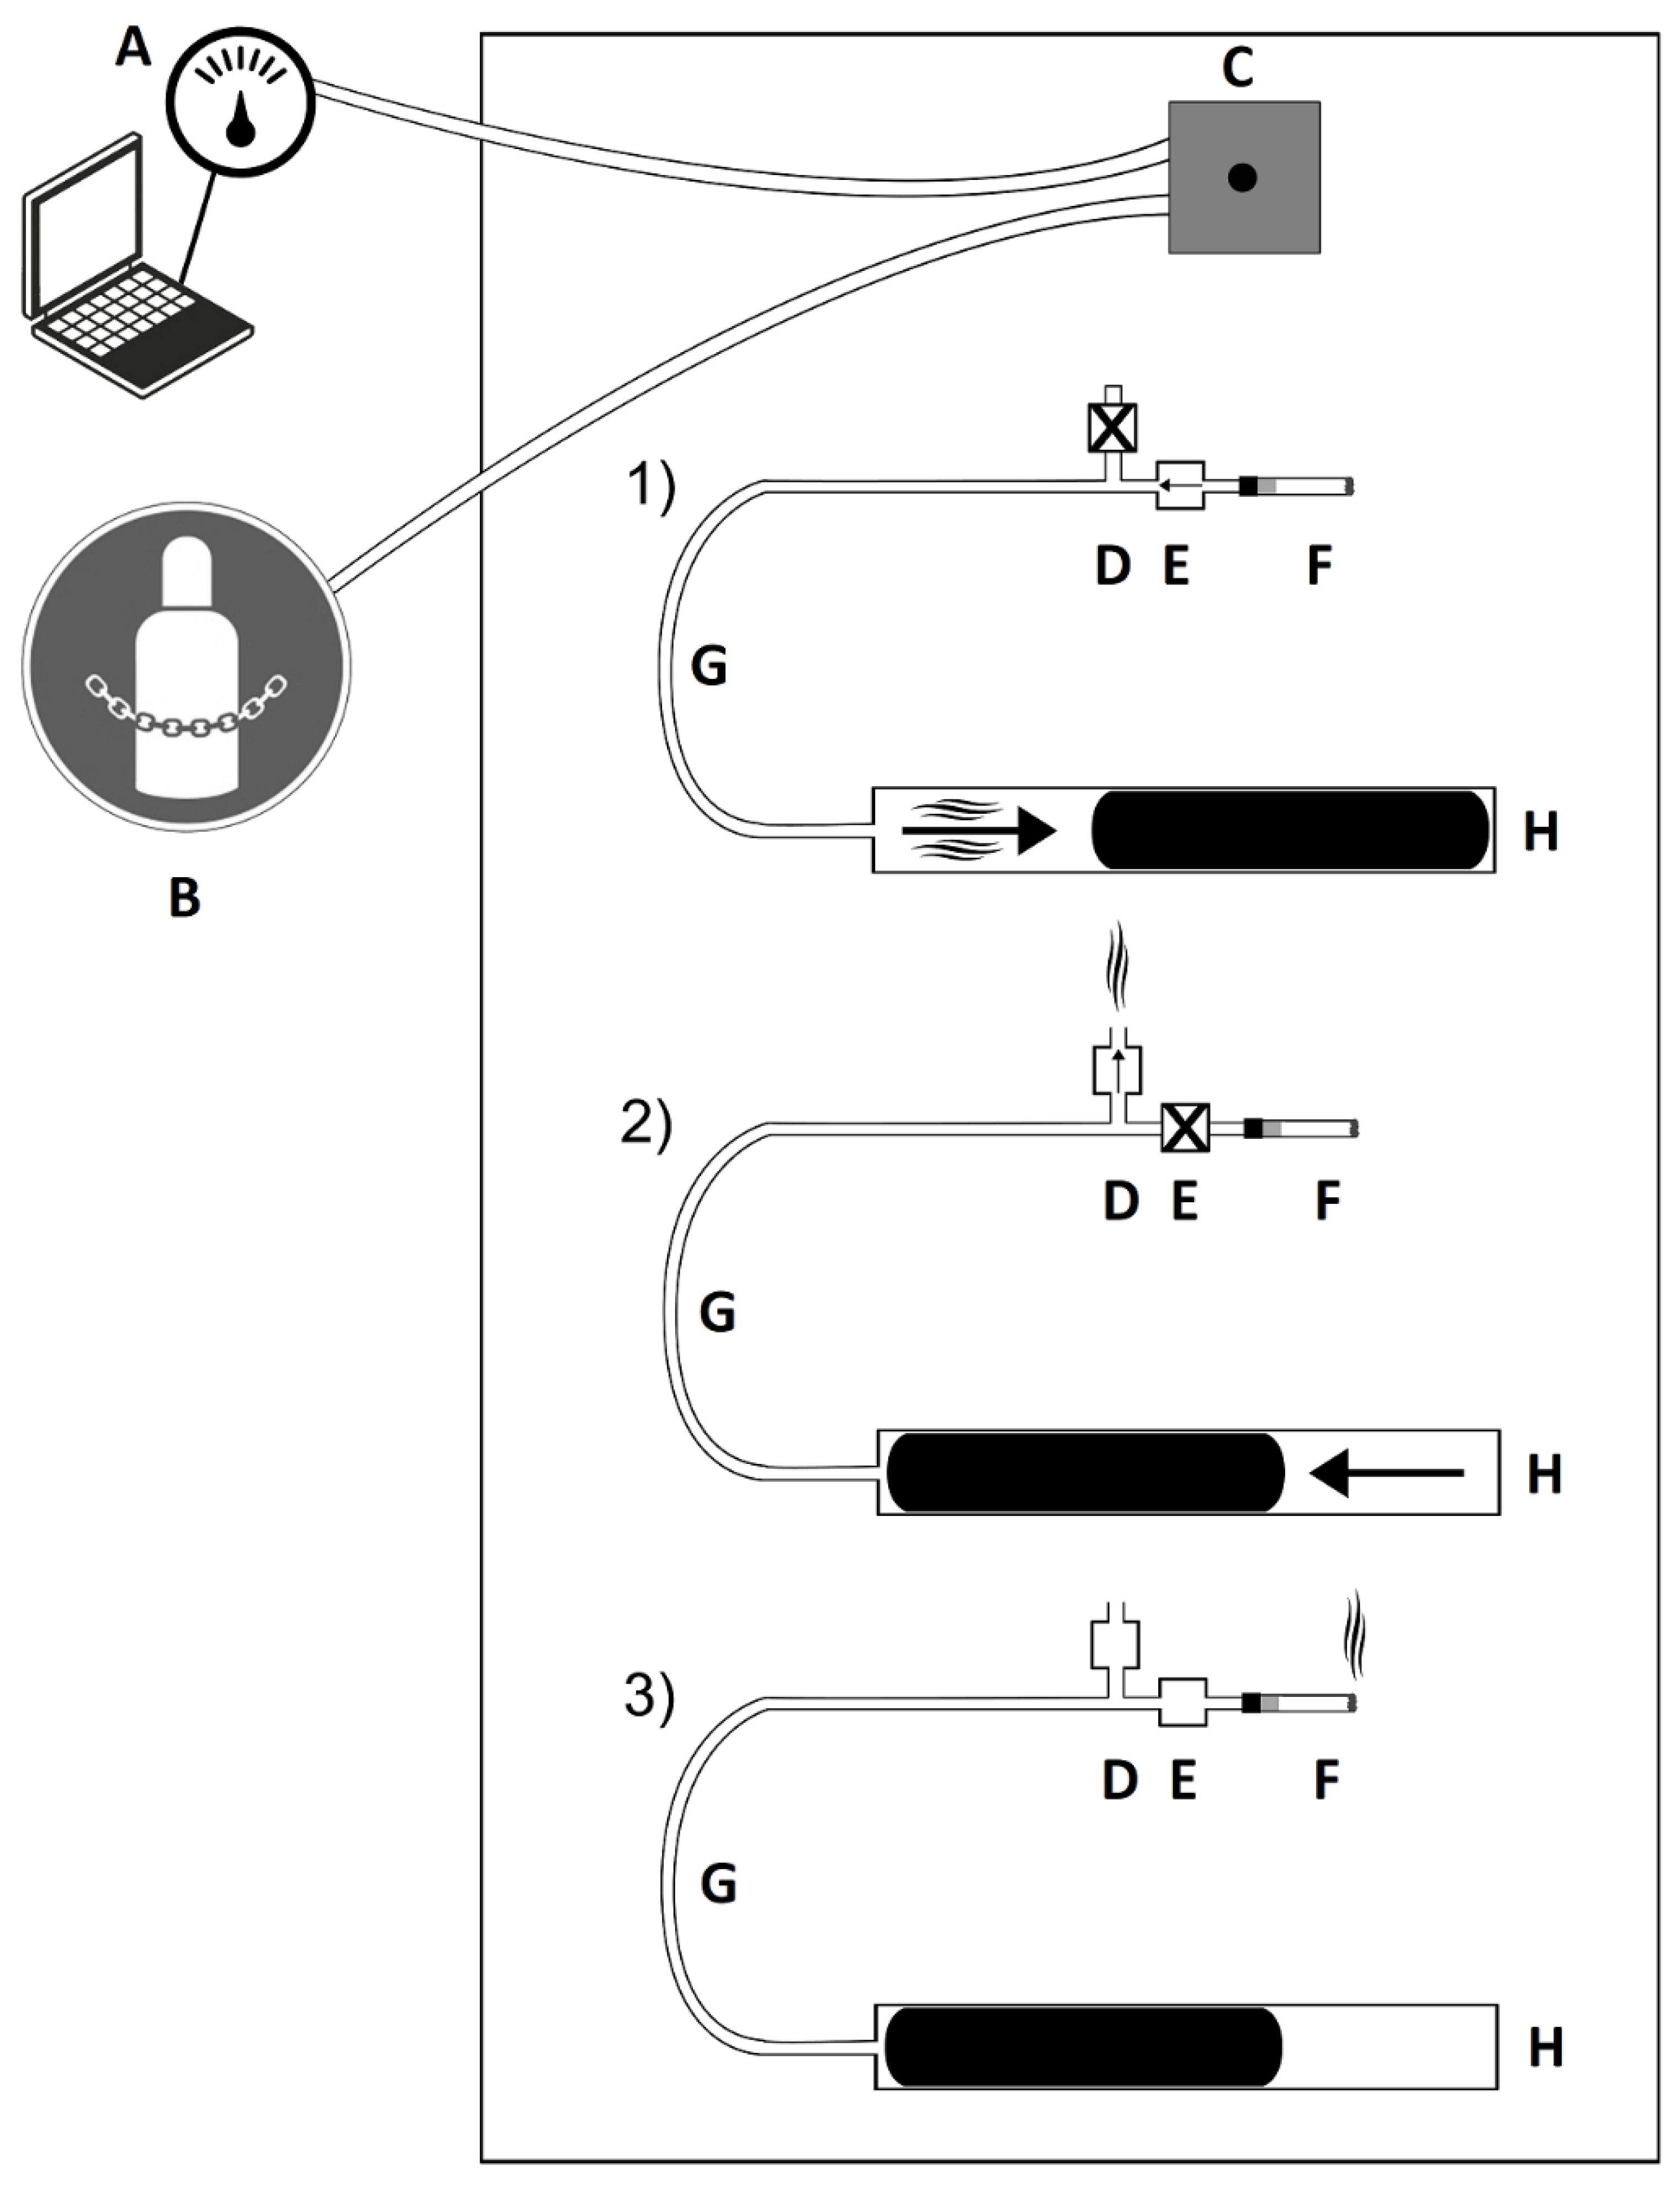
2.2. Measuring Chamber
2.3. Automatic Environmental Tobacco Smoke Emitter
2.4. Laser Aerosol Spectrometer
2.5. Smoking Protocol
2.6. Data Processing and Statistical Analysis
3. Results
4. Discussion
5. Conclusions
Author Contributions
Funding
Institutional Review Board Statement
Informed Consent Statement
Data Availability Statement
Acknowledgments
Conflicts of Interest
References
- WHO (World Health Organization). Fact Sheets. Tobacco. 2021. Available online: https://www.who.int/news-room/fact-sheets/detail/tobacco (accessed on 12 October 2021).
- Schaller, K.; Kahnert, S.; Graen, L.; Mons, U.; Ouédraogo, N. Tabakatlas Deutschland 2020; Deutsches Krebsforschungszentrum: Heidelberg, Germany, 2020. [Google Scholar]
- Apelberg, B.J.; Hepp, L.M.; Avila-Tang, E.; Gundel, L.; Hammond, S.K.; Hovell, M.F.; Hyland, A.; Klepeis, N.E.; Madsen, C.C.; Navas-Acien, A.; et al. Environmental monitoring of secondhand smoke exposure. Tob. Control 2013, 22, 147–155. [Google Scholar] [CrossRef] [PubMed] [Green Version]
- Van Deusen, A.; Hyland, A.; Travers, M.J.; Wang, C.; Higbee, C.; King, B.A.; Alford, T.; Cummings, K.M. Secondhand smoke and particulate matter exposure in the home. Nicotine Tob. Res. 2009, 11, 635–641. [Google Scholar] [CrossRef] [PubMed]
- EPA (United States Environmental Protection Agency). Particulate Matter (PM) Pollution. 2021. Available online: https://www.epa.gov/pm-pollution (accessed on 12 October 2021).
- WHO (World Health Organization). Health Topics. Ambient (Outdoor) Air Pollution. 2021. Available online: https://www.who.int/news-room/fact-sheets/detail/ambient-(outdoor)-air-quality-and-health (accessed on 12 October 2021).
- Chen, J.; Hoek, G. Long-term exposure to PM and all-cause and cause-specific mortality: A systematic review and meta-analysis. Environ. Int. 2020, 143, 105974. [Google Scholar] [CrossRef]
- Kim, K.H.; Kabir, E.; Kabir, S. A review on the human health impact of airborne particulate matter. Environ. Int. 2015, 74, 136–143. [Google Scholar] [CrossRef] [PubMed]
- Jarvis, M.J. Supermarket cigarettes: The brands that dare not speak their name. BMJ 1998, 316, 929–931. [Google Scholar] [CrossRef] [PubMed] [Green Version]
- Statista. Zigarettenmarkt Deutschland. Dossier. 2021. Available online: https://de.statista.com/statistik/studie/id/17809/dokument/zigaretten--statista-dossier/ (accessed on 13 October 2021).
- UK (University of Kentucky). Kentucky Tobacco Research and Development Center. 3R4F Preliminary Analysis Kentucky. 2018. Available online: https://ctrp.uky.edu/assets/pdf/webdocs/3R4F%20Preliminary%20Analysis.pdf (accessed on 19 October 2021).
- BMEL. Federal Ministry of Food and Agriculture of Germany. 2011. Available online: https://service.bmel.de/tabakerzeugnisse/index2.php?site_key=153 (accessed on 19 October 2021).
- Schimpf-ING. Electronics Development. Available online: http://www.schimpf-ing.no/ (accessed on 19 October 2021).
- Grimm Aerosol Technik GmbH & Co KG Manual. Portable Laser Aerosolspectrometer and Dust Monitor Model 1.108/1.109. 2010. Available online: http://cires1.colorado.edu/jimenez-group/Manuals/Grimm_OPC_Manual.pdf (accessed on 19 October 2021).
- Mueller, D.; Uibel, S.; Braun, M.; Klingelhoefer, D.; Takemura, M.; Groneberg, D.A. Tobacco smoke particles and indoor air quality (ToPIQ)—The protocol of a new study. J. Occup. Med. Toxicol. 2011, 6, 35. [Google Scholar] [CrossRef] [Green Version]
- Gerber, A.; Hofen-Hohloch, A.V.; Schulze, J.; Groneberg, D.A. Tobacco smoke particles and indoor air quality (ToPIQ-II)—A modified study protocol and first results. J. Occup. Med. Toxicol. 2015, 10, 5. [Google Scholar] [CrossRef] [Green Version]
- Braun, M.; Al-Qaysi, R.; Klingelhofer, D.; Muller, R.; Groneberg, D.A. High Particulate Matter Burden of Cigarettes from the United Arab Emirates and Germany: Are There Country-Specific Differences? Int. J. Environ. Res. Public Health 2020, 17, 2415. [Google Scholar] [CrossRef] [Green Version]
- Braun, M.; Dehm, M.; Klingelhofer, D.; Groneberg, D.A. High particulate matter burden by cigarillos: A laser spectrometric analysis of second-hand smoke of common brands with and without filter. PLoS ONE 2021, 16, e0254537. [Google Scholar] [CrossRef]
- Braun, M.; Fromm, E.L.; Gerber, A.; Klingelhofer, D.; Muller, R.; Groneberg, D.A. Particulate matter emissions of four types of one cigarette brand with and without additives: A laser spectrometric particulate matter analysis of secondhand smoke. BMJ Open 2019, 9, e024400. [Google Scholar] [CrossRef] [Green Version]
- Braun, M.; Klingelhofer, D.; Droge, J.; Groneberg, D.A. Very high particulate matter levels by cigarettes from Bangladesh and especially Nepal. Nicotine Tob. Res. 2022, ntac100. [Google Scholar] [CrossRef] [PubMed]
- Braun, M.; Koger, F.; Klingelhofer, D.; Muller, R.; Groneberg, D.A. Particulate Matter Emissions of Four Different Cigarette Types of One Popular Brand: Influence of Tobacco Strength and Additives. Int. J. Environ. Res. Public Health 2019, 16, 263. [Google Scholar] [CrossRef] [PubMed] [Green Version]
- Braun, M.; Marsidi, L.L.; Klingelhofer, D.; Groneberg, D.A. Kretek cigarettes and particulate matter emissions—An aerosol spectrometric study on typical Indonesian brands flavored with cloves. Nicotine Tob. Res. 2022, 24, 778–784. [Google Scholar] [CrossRef] [PubMed]
- Mbulo, L.; Palipudi, K.M.; Andes, L.; Morton, J.; Bashir, R.; Fouad, H.; Ramanandraibe, N.; Caixeta, R.; Dias, R.C.; Wijnhoven, T.M.; et al. Secondhand smoke exposure at home among one billion children in 21 countries: Findings from the Global Adult Tobacco Survey (GATS). Tob. Control 2016, 25, e95–e100. [Google Scholar] [CrossRef] [Green Version]
- Brinker, T.J.; Stamm-Balderjahn, S.; Seeger, W.; Klingelhofer, D.; Groneberg, D.A. Education Against Tobacco (EAT): A quasi-experimental prospective evaluation of a multinational medical-student-delivered smoking prevention programme for secondary schools in Germany. BMJ Open 2015, 5, e008093. [Google Scholar] [CrossRef]
- Schulz, M.; Gerber, A.; Groneberg, D.A. Are Filter-Tipped Cigarettes Still Less Harmful than Non-Filter Cigarettes?—A Laser Spectrometric Particulate Matter Analysis from the Non-Smokers Point of View. Int. J. Environ. Res. Public Health 2016, 13, 429. [Google Scholar] [CrossRef] [Green Version]
- Baker, R.R.; da Silva, J.R.P.; Smith, G. The effect of tobacco ingredients on smoke chemistry. Part I: Flavourings and additives. Food Chem. Toxicol. 2004, 42, S3–S37. [Google Scholar] [CrossRef]
- WHO (World Health Organization). WHO Global Air Quality Guidelines. 2021. Available online: https://apps.who.int/iris/bitstream/handle/10665/345329/9789240034228-eng.pdf?sequence=1&isAllowed=y (accessed on 12 October 2021).
- ISO/TR 17219:2013(en); Review of Human Smoking Behaviour and Recommendations for a New ISO Standard for the Machine Smoking of Cigarettes. International Organization for Standardization: Geneva, Switzerland, 2013. Available online: https://www.iso.org/obp/ui/#iso:std:iso:3308:ed-5:v1:en (accessed on 27 October 2021).
- WHO (World Health Organization). Standard Operating Procedure for Intense Smoking of Cigarettes. 2012. Available online: https://apps.who.int/iris/bitstream/handle/10665/75261/9789241503891_eng.pdf;sequence=1 (accessed on 27 October 2021).
- Mueller, D.; Schulze, J.; Ackermann, H.; Klingelhoefer, D.; Uibel, S.; Groneberg, D.A. Particulate matter (PM) 2.5 levels in ETS emissions of a Marlboro Red cigarette in comparison to the 3R4F reference cigarette under open- and closed-door condition. J. Occup. Med. Toxicol. 2012, 7, 14. [Google Scholar] [CrossRef] [Green Version]
- Hammond, D.; Wiebel, F.; Kozlowski, L.T.; Borland, R.; Cummings, K.M.; O’Connor, R.J.; McNeill, A.; Connolly, G.N.; Arnott, D.; Fong, G.T. Revising the machine smoking regime for cigarette emissions: Implications for tobacco control policy. Tob. Control 2007, 16, 8–14. [Google Scholar] [CrossRef] [Green Version]
- EPA (United States Environmental Protection Agency). Department of Energy. Fuel Economy Guide. 2021. Available online: https://www.fueleconomy.gov/feg/pdfs/guides/FEG2018.pdf (accessed on 3 November 2021).
- Semple, S.; Latif, N. How long does secondhand smoke remain in household air: Analysis of PM2.5 data from smokers’ homes. Nicotine Tob. Res. 2014, 16, 1365–1370. [Google Scholar] [CrossRef]
- Sahu, S.K.; Tiwari, M.; Bhangare, R.C.; Pandit, G.G. Particle Size Distribution of Mainstream and Exhaled Cigarette Smoke and Predictive Deposition in Human Respiratory Tract. Aerosol Air Qual. Res. 2013, 13, 324–332. [Google Scholar] [CrossRef] [Green Version]
- Baker, R.R.; Dixon, M. The retention of tobacco smoke constituents in the human respiratory tract. Inhal. Toxicol. 2006, 18, 255–294. [Google Scholar] [CrossRef] [PubMed]
- Besaratinia, A.; Pfeifer, G.P. Second-hand smoke and human lung cancer. Lancet Oncol. 2008, 9, 657–666. [Google Scholar] [CrossRef] [Green Version]
- Keith, C.H.; Derrick, J.C. Measurement of the particle size distribution and concentration of cigarette smoke by the “conifuge”. J. Colloid Sci. 1960, 15, 340–356. [Google Scholar] [CrossRef]
- Mannix, R.C.; Nguyen, K.P.; Tan, E.W.; Ho, E.E.; Phalen, R.F. Physical characterization of incense aerosols. Sci. Total Environ. 1996, 193, 149–158. [Google Scholar] [CrossRef] [Green Version]
- Nazaroff, W.W.; Klepeis, N.E. Environmental tobacco smoke particles. In Indoor Environment: Airborne Particles and Settled Dust; Wiley-VCH: Weinheim/Berlin, Germany, 2003. [Google Scholar]
- Haustein, K.O.; Groneberg, D.A. Tabakabhängigkeit. Gesundheitliche Schäden Durch das Rauchen; Springer: Berlin/Heidelberg, Germany, 2008. [Google Scholar]
- Ohlwein, S.; Kappeler, R.; Joss, M.K.; Kunzli, N.; Hoffmann, B. Health effects of ultrafine particles: A systematic literature review update of epidemiological evidence. Int. J. Public Health 2019, 64, 547–559. [Google Scholar] [CrossRef]
- Raskind, I.G.; Vishwakarma, M.; Schleicher, N.C.; Andersen-Rodgers, E.; Henriksen, L. The changing retail landscape for tobacco: Dollar stores and the availability of cheap cigarettes among tobacco-related priority populations. Tob. Control, 2021; Epub ahead of print. [Google Scholar] [CrossRef]
- Giskes, K.; Kunst, A.E.; Benach, J.; Borrell, C.; Costa, G.; Dahl, E.; Dalstra, J.A.; Federico, B.; Helmert, U.; Judge, K.; et al. Trends in smoking behaviour between 1985 and 2000 in nine European countries by education. J. Epidemiol. Community Health 2005, 59, 395–401. [Google Scholar] [CrossRef] [Green Version]
- Kestila, L.; Martelin, T.; Rahkonen, O.; Harkanen, T.; Koskinen, S. The contribution of childhood circumstances, current circumstances and health behaviour to educational health differences in early adulthood. BMC Public Health 2009, 9, 164. [Google Scholar] [CrossRef]
- Tsai, Y.W.; Yang, C.L.; Chen, C.S.; Liu, T.C.; Chen, P.F. The effect of Taiwan’s tax-induced increases in cigarette prices on brand-switching and the consumption of cigarettes. Health Econ. 2005, 14, 627–641. [Google Scholar] [CrossRef]
- Elton-Marshall, T.; Leatherdale, S.T.; Burkhalter, R. Native, discount, or premium brand cigarettes: What types of cigarettes are Canadian youth currently smoking? Nicotine Tob. Res. 2013, 15, 435–443. [Google Scholar] [CrossRef] [PubMed]
- Chen, C.M.; Chang, K.L.; Lin, L.; Lee, J.L. Brand switching or reduced consumption? A study of how cigarette taxes affect tobacco consumption. Eur. J. Health Econ. 2014, 15, 991–998. [Google Scholar] [CrossRef] [PubMed]
- Cummings, K.M.; Hyland, A.; Lewit, E.; Shopland, D. Use of discount cigarettes by smokers in 20 communities in the United States, 1988–1993. Tob. Control 1997, 6 (Suppl. 2), S25–S30. [Google Scholar] [CrossRef] [PubMed] [Green Version]
- Nargis, N.; Fong, G.T.; Chaloupka, F.J.; Li, Q. The choice of discount brand cigarettes: A comparative analysis of International Tobacco Control surveys in Canada and the USA (2002–2005). Tob. Control 2014, 23 (Suppl. 1), i86–i96. [Google Scholar] [CrossRef] [PubMed] [Green Version]
- de Miera Juarez, B.S.; Thrasher, J.F.; Shigematsu, L.M.R.; Avila, M.H.; Chaloupka, F.J. Tax, price and cigarette brand preferences: A longitudinal study of adult smokers from the ITC Mexico Survey. Tob. Control 2014, 23 (Suppl. 1), i80–i85. [Google Scholar] [CrossRef] [PubMed]
- Verguet, S.; Kearns, P.K.A.; Rees, V.W. Questioning the regressivity of tobacco taxes: A distributional accounting impact model of increased tobacco taxation. Tob. Control 2021, 30, 245–257. [Google Scholar] [CrossRef]
- Shang, C.; Chaloupka, F.J.; Zahra, N.; Fong, G.T. The distribution of cigarette prices under different tax structures: Findings from the International Tobacco Control Policy Evaluation (ITC) Project. Tob. Control 2014, 23 (Suppl. 1), i23–i29. [Google Scholar] [CrossRef] [Green Version]


| Brand (n) | Reference Cigarette 3R4F (33) | Camel Yellow Filter (34), bn | Marlboro Red (36), bn | Nil Blue (34), bn | Giants Red (38), pl | Goldfield Red (35), pl | Jakordia Red (36), pl |
|---|---|---|---|---|---|---|---|
| Manufacturer | KTRDC University of Kentucky | JT International GmbH | Philip Morris GmbH Munich | JT International GmbH | Imperial Tobacco Holdings International B.V. | Heintz Van Landewyck GmbH | Johannes Wilhelm von Eicken GmbH |
| Price per cigarette [EUR] | n/a | 0.34 | 0.34 | 0.34 | 0.24 | 0.24 | 0.24 |
| Tar [mg] | 9.4 | 10 | 10 | 10 | 10 | 10 | 10 |
| Nicotine [mg] | 0.73 | 0.8 | 0.8 | 0.8 | 0.8 | 0.8 | 0.8 |
| CO [mg] | 12 | 10 | 10 | 10 | 10 | 10 | 10 |
| Total length [mm] | 84 | 84 | 82 | 83 | 83 | 83 | 83 |
| Filter length [mm] | 27 | 21 | 21 | 22 | 20 | 22 | 25 |
| Filter diameter [mm] | 8 | 8 | 8 | 8 | 8 | 8 | 8 |
| Total weight [mg] | 980 | 790 | 800 | 800 | 810 | 850 | 860 |
| Tobacco weight [mg] | 700 | 590 | 590 | 600 | 620 | 640 | 610 |
| Filling density [mg/cm3] | 244 | 186 | 192 | 195 | 196 | 202 | 209 |
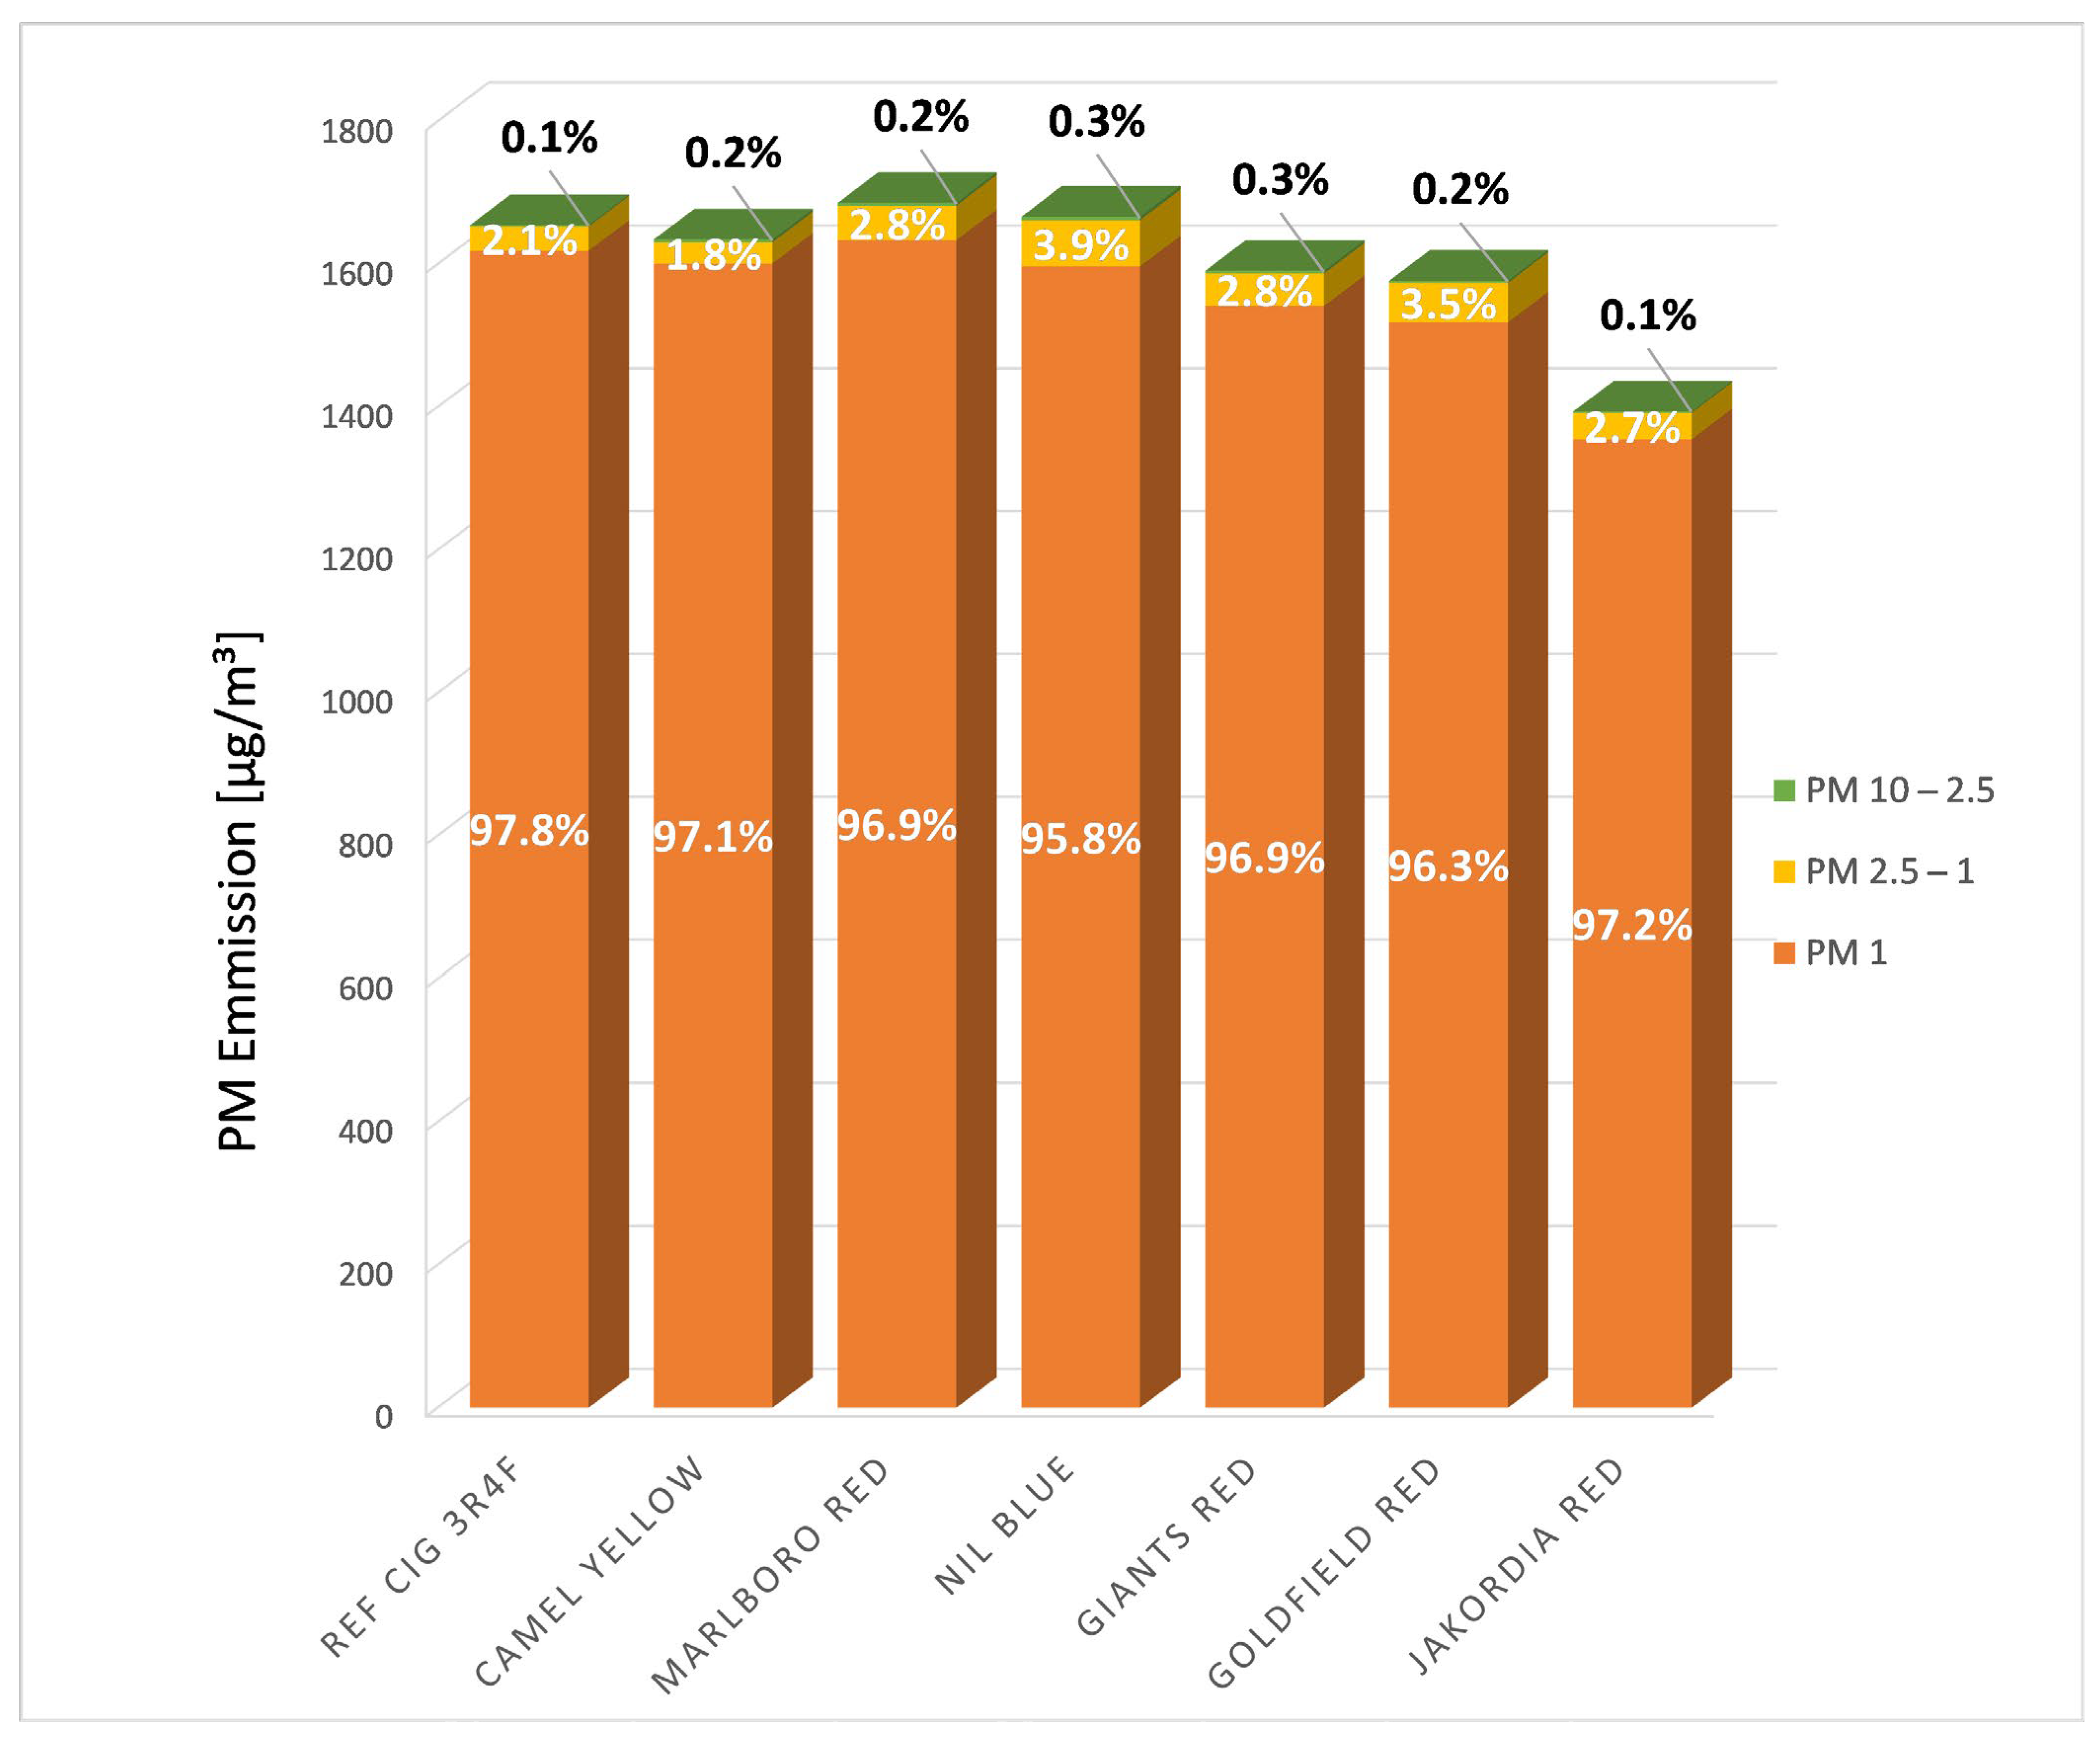
| Brand | PM10 [µg/m3] | PM2.5 [µg/m3] | PM1 [µg/m3] |
|---|---|---|---|
| Reference cigarette 3R4F | 1655 ± 185 | 1653 ± 184 | 1619 ± 178 |
| Camel Yellow Filter (bn) | 1635 ± 192 (−1.2%, ns) | 1631 ± 191 (−1.3%, ns) | 1601 ± 209 (−1.1%, ns) |
| Marlboro Red (bn) | 1686 ± 183 (+1.9%, ns) | 1682 ± 182 (+1.8%, ns) | 1634 ± 166 (+0.9%, ns) |
| Nil Blue (bn) | 1667 ± 195 (+0.7%, ns) | 1662 ± 193 (+0.5%, ns) | 1597 ± 174 (−1.4%, ns) |
| Giants Red (pl) | 1591 ± 204 (−3.9%, ns) | 1587 ± 203 (−4.0%, ns) | 1542 ± 188 (−4.8%, ns) |
| Goldfield Red (pl) | 1577 ± 168 (−4.7%, ns) | 1574 ± 167 (−4.8%, ns) | 1519 ± 153 (−6.2%, ns) |
| Jakordia Red (pl) | 1394 ± 203 (−15.8%, ***) | 1392 ± 202 (−15.8%, ***) | 1355 ± 190 (−16.3%, ***) |
Publisher’s Note: MDPI stays neutral with regard to jurisdictional claims in published maps and institutional affiliations. |
© 2022 by the authors. Licensee MDPI, Basel, Switzerland. This article is an open access article distributed under the terms and conditions of the Creative Commons Attribution (CC BY) license (https://creativecommons.org/licenses/by/4.0/).
Share and Cite
Gerlach, G.; Braun, M.; Dröge, J.; Groneberg, D.A. Do Budget Cigarettes Emit More Particles? An Aerosol Spectrometric Comparison of Particulate Matter Concentrations between Private-Label Cigarettes and More Expensive Brand-Name Cigarettes. Int. J. Environ. Res. Public Health 2022, 19, 5920. https://doi.org/10.3390/ijerph19105920
Gerlach G, Braun M, Dröge J, Groneberg DA. Do Budget Cigarettes Emit More Particles? An Aerosol Spectrometric Comparison of Particulate Matter Concentrations between Private-Label Cigarettes and More Expensive Brand-Name Cigarettes. International Journal of Environmental Research and Public Health. 2022; 19(10):5920. https://doi.org/10.3390/ijerph19105920
Chicago/Turabian StyleGerlach, Greta, Markus Braun, Janis Dröge, and David A. Groneberg. 2022. "Do Budget Cigarettes Emit More Particles? An Aerosol Spectrometric Comparison of Particulate Matter Concentrations between Private-Label Cigarettes and More Expensive Brand-Name Cigarettes" International Journal of Environmental Research and Public Health 19, no. 10: 5920. https://doi.org/10.3390/ijerph19105920