
EEG Global Coherence in Scholar ADHD Children during Visual Object Processing


 ,
,  , , and
Abstract
:1. Introduction
1.1. ADHD in School-Aged Children
1.2. EEG Research Tools in Pediatric ADHD
1.3. Age-Related Changes in EEG Coherence
2. Materials and Methods
2.1. Subjects
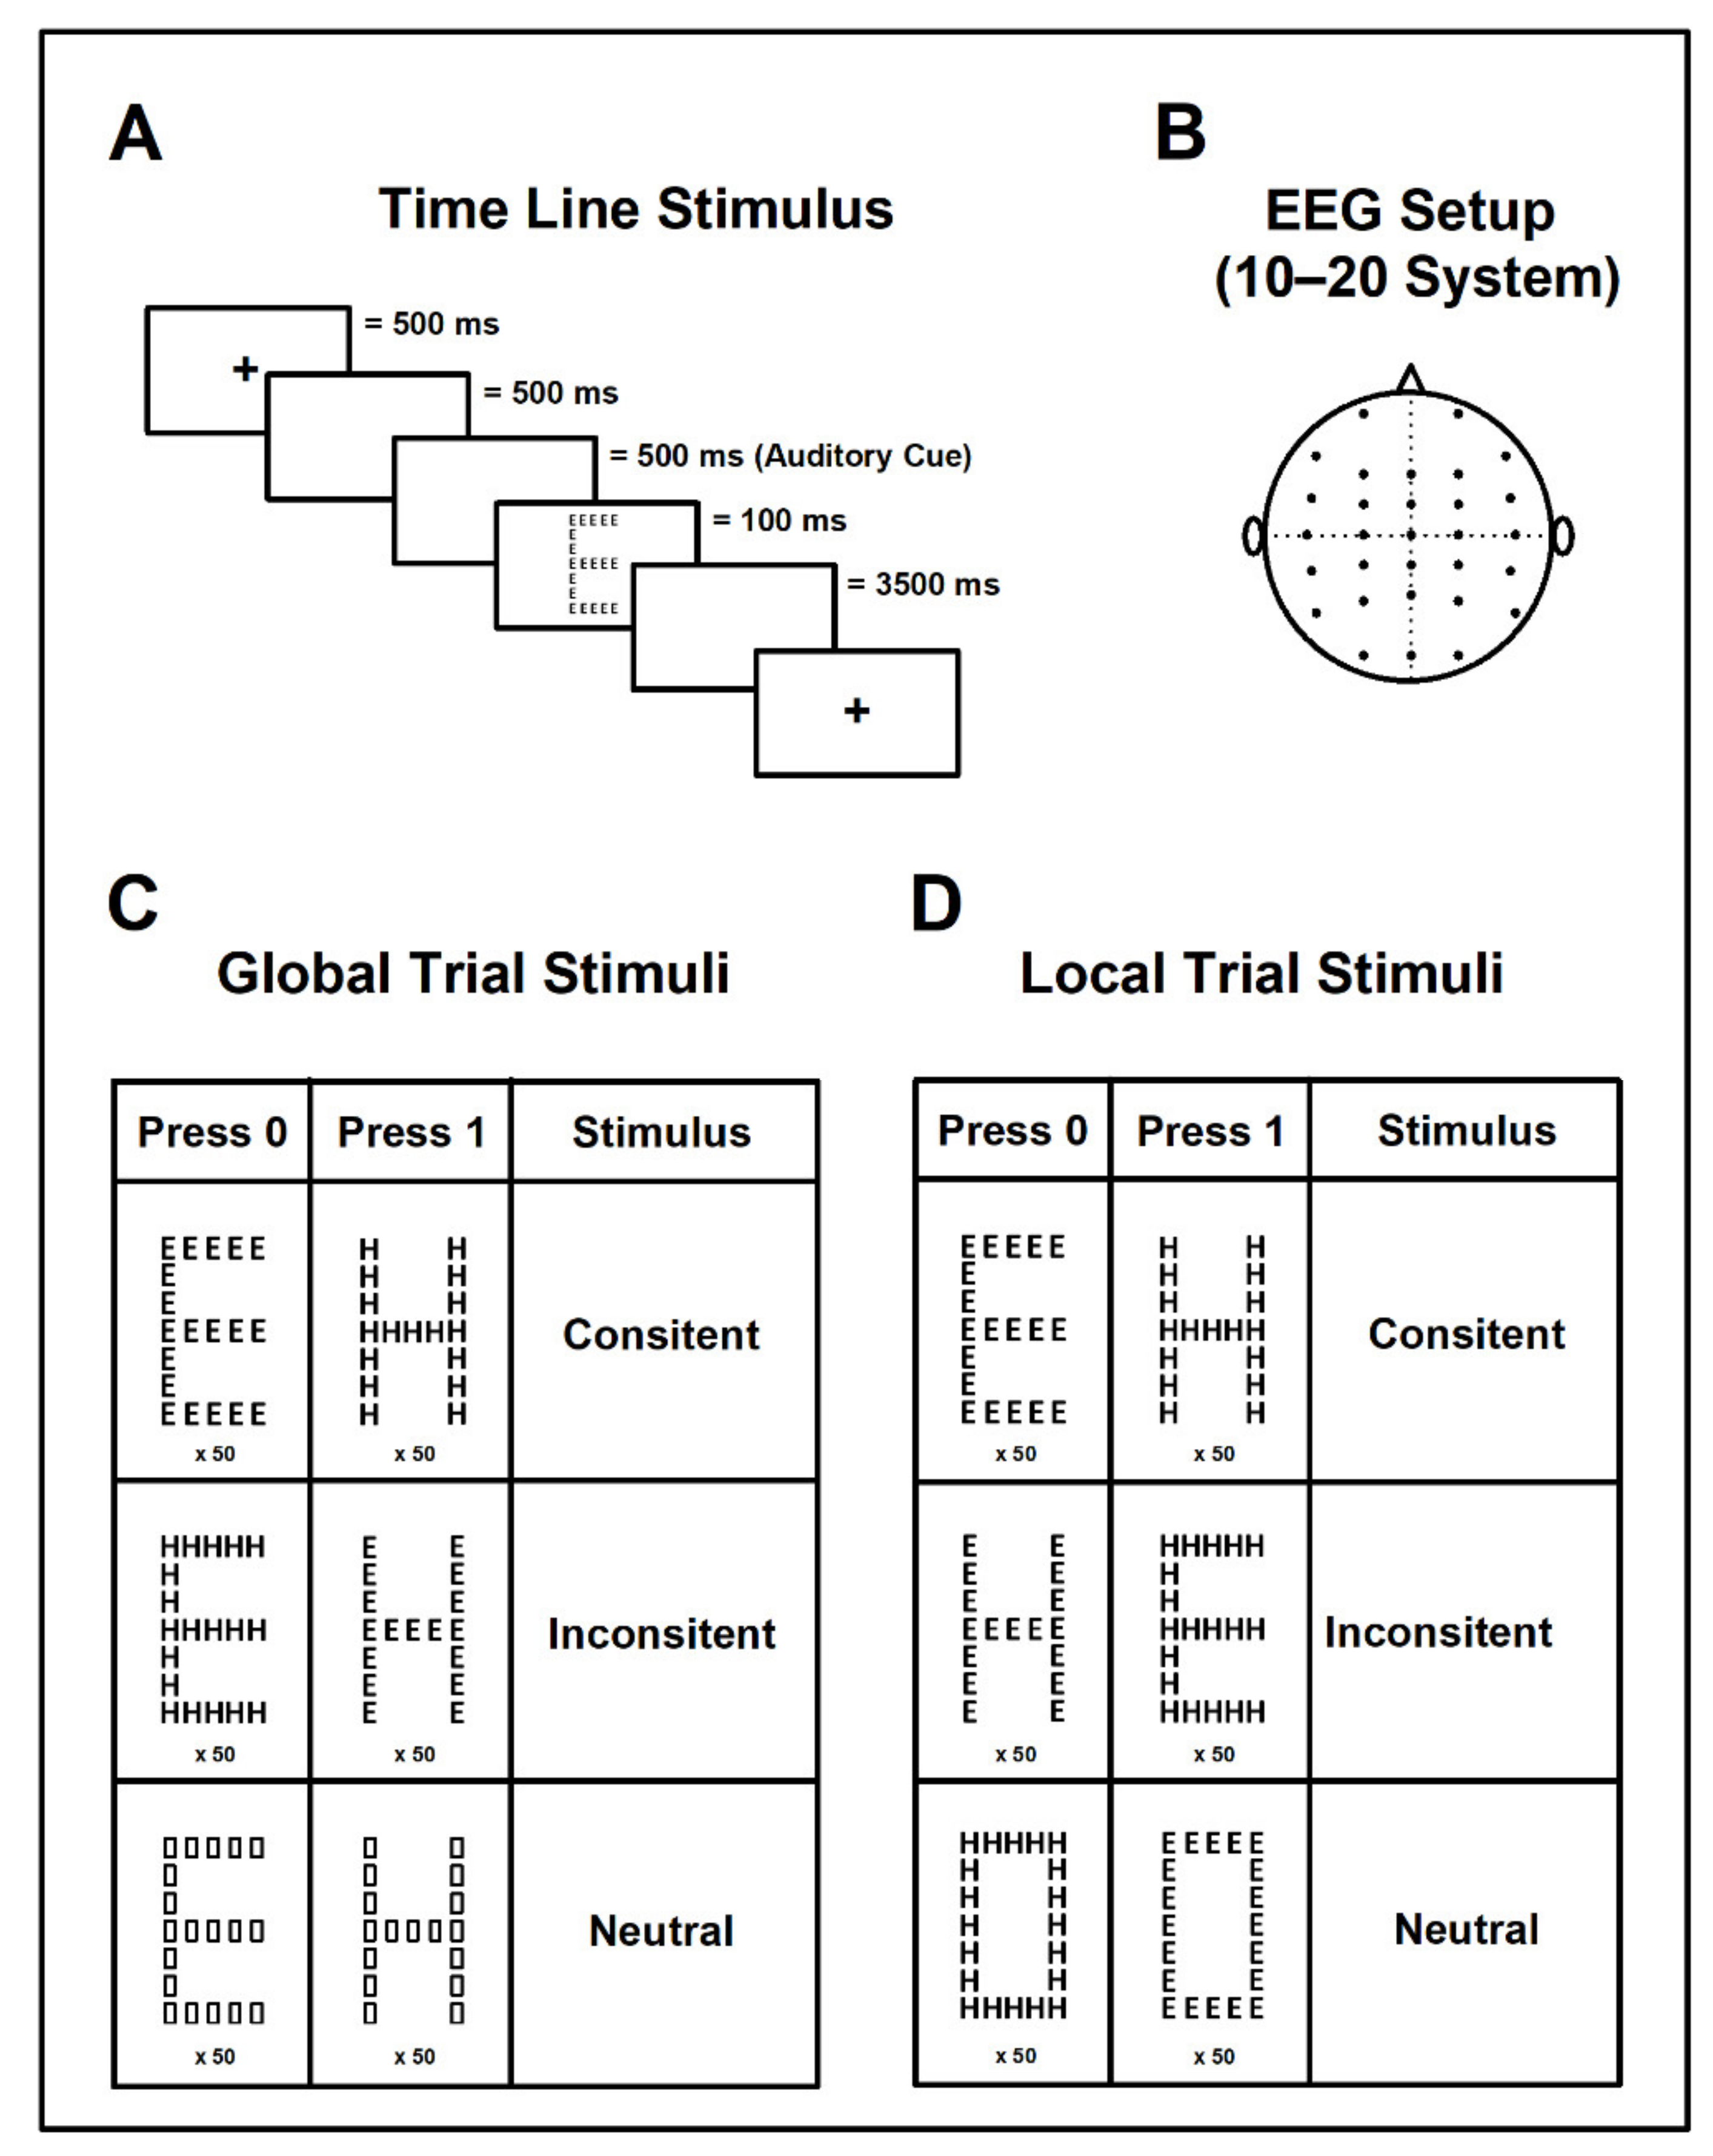
2.2. Navon Experimental Paradigm
2.2.1. Global and Local Aspect Recognition
- Global Aspect Recognition Test: In this task children were asked to click on the response pad as soon as they identified the large figure (independently from the smaller figure composing it). We used 6 different types of stimuli: 2 consistent, 2 inconsistent, and 2 neutral. After the response, the entire trial began again by presenting a different stimulus (Figure 1A,C).
- Local Aspect Recognition Test: In contrast to the first part, children were asked to identify the smaller figure without paying attention to the larger figure. The stimuli presented were also 2 consistent, 2 inconsistent, and 2 neutral; however, neutral stimuli were different for each test (global/local) (Figure 1D).
2.2.2. Recordings
2.3. Data Analysis
2.3.1. EEG-EEG Coherence Analysis
2.3.2. Calculation of EEG Spectral Power and EEG-EEG Cortico-Cortical Coherence
2.4. Calculation of Mean-Weighted Coherence
2.5. Statistical Analysis
3. Results
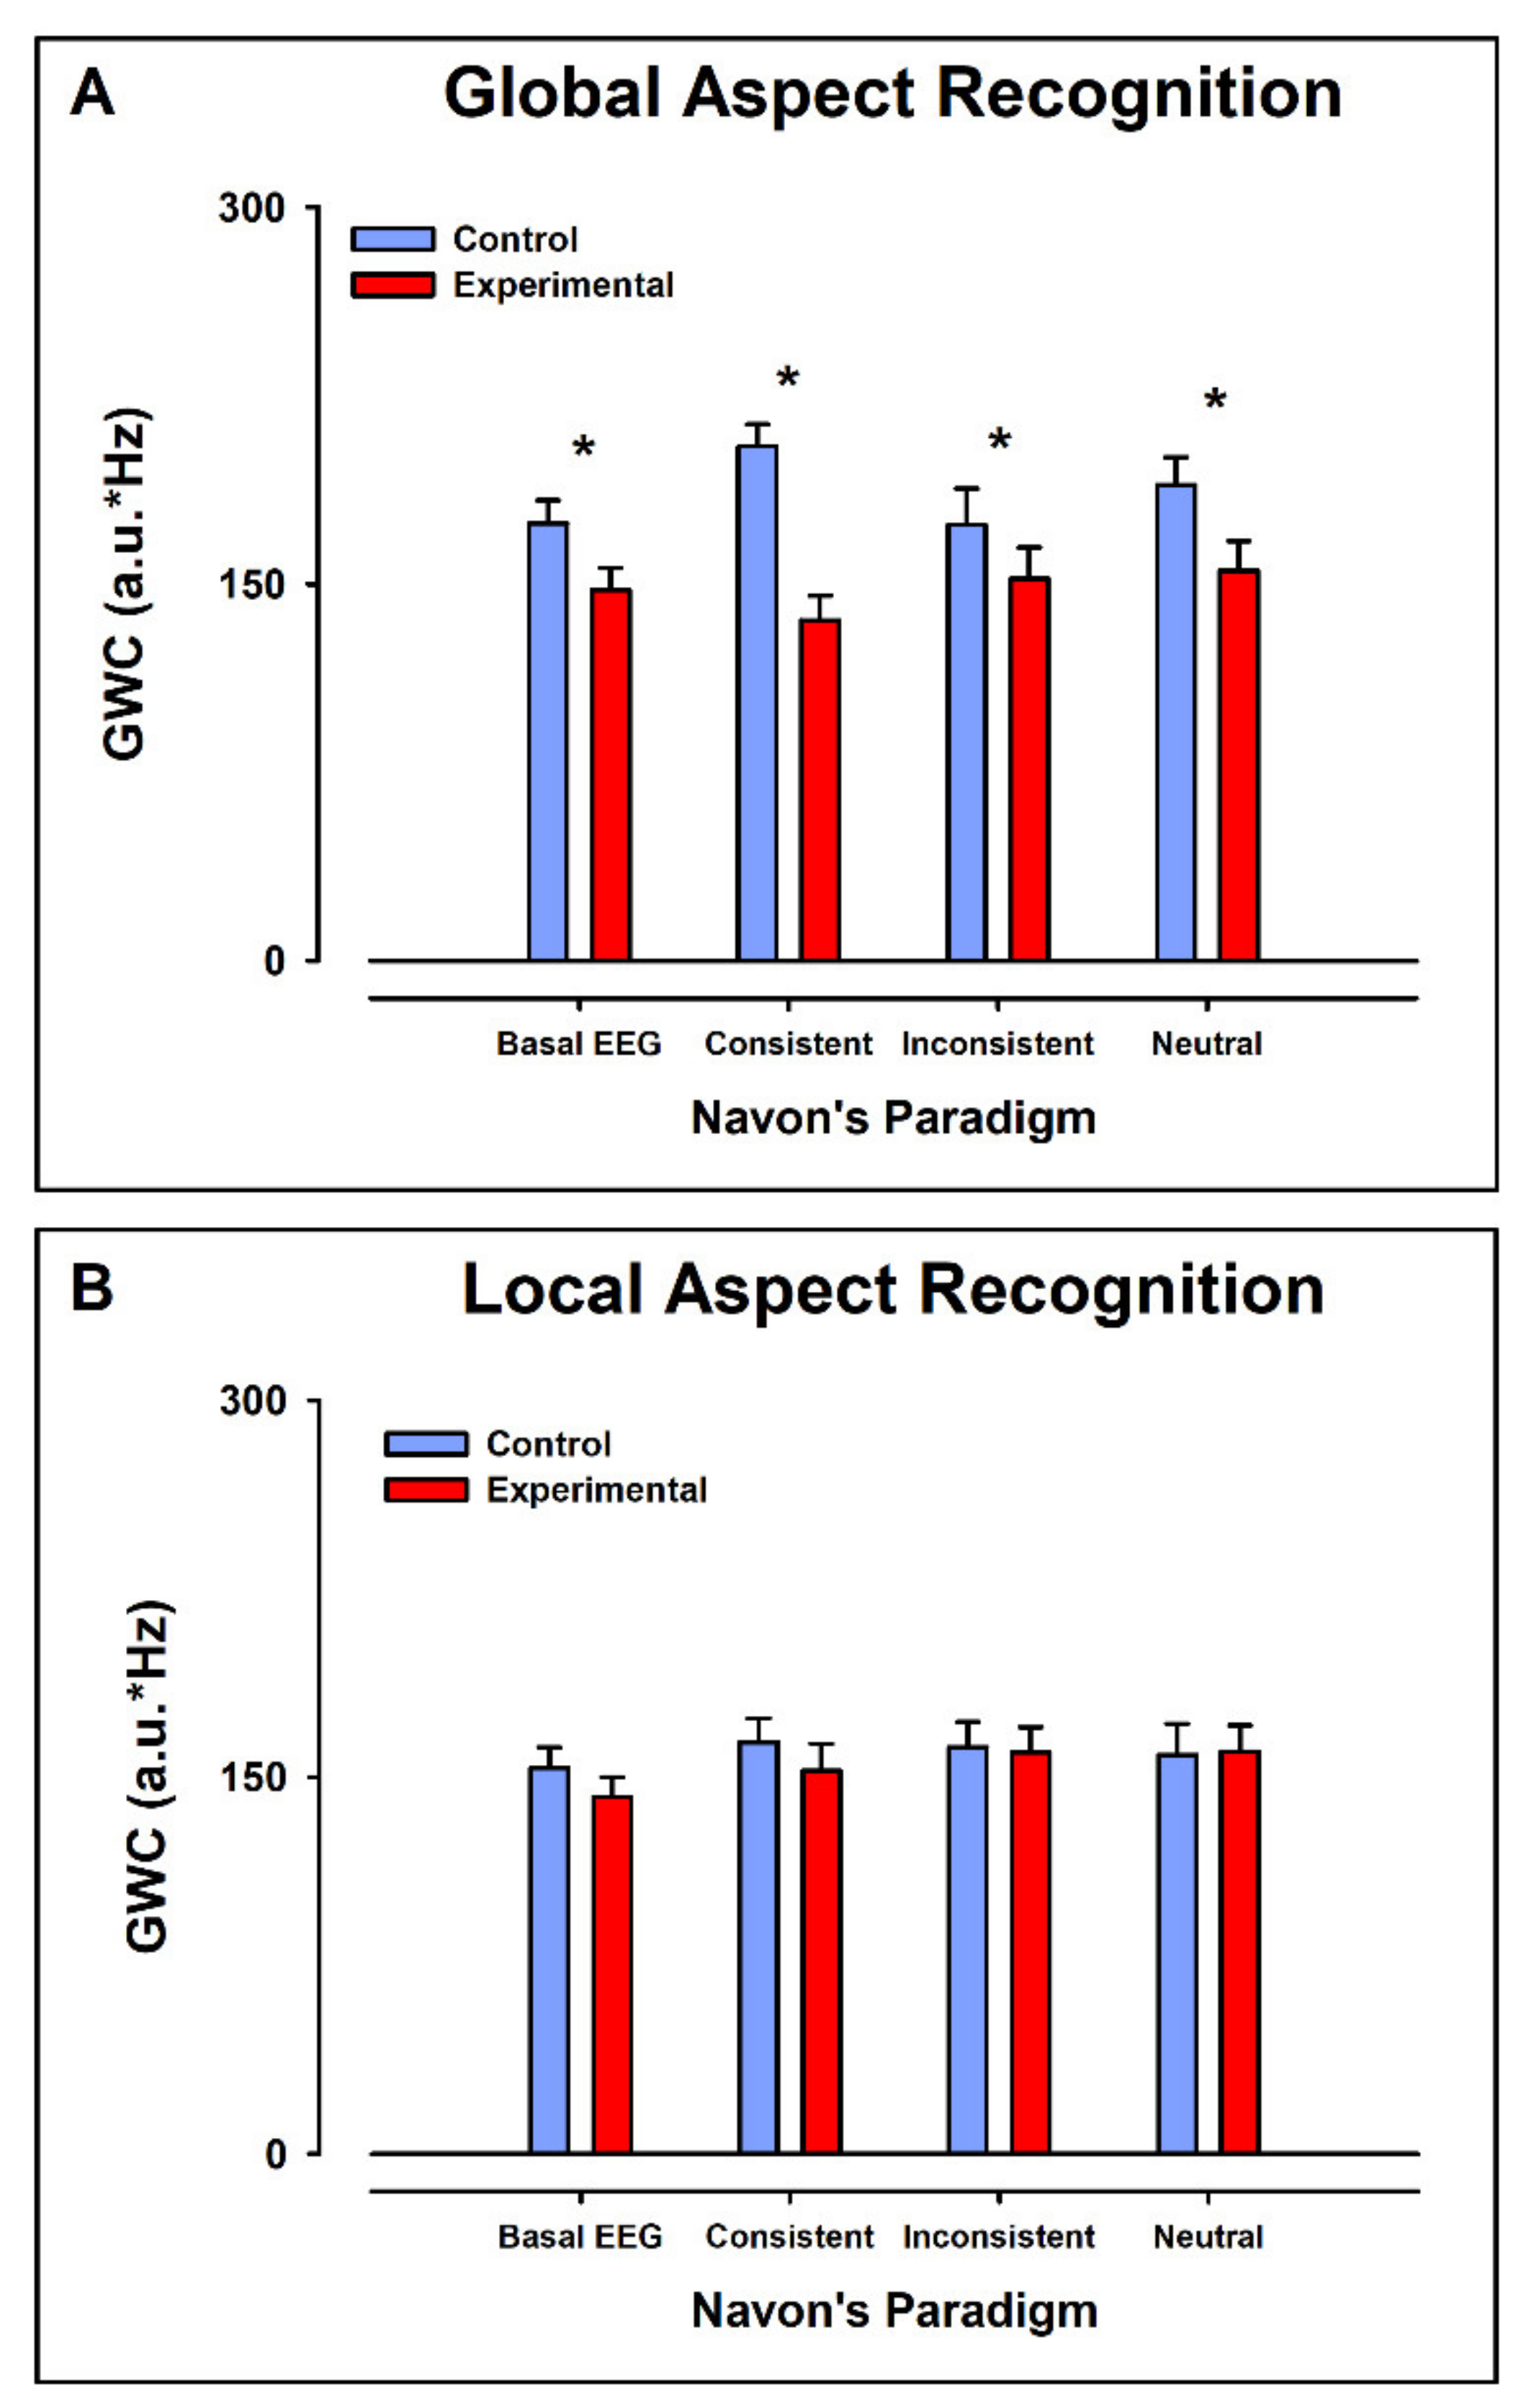
3.1. Global Mean-Weighted Coherence
3.1.1. Intergroup Contrast: Control vs. ADHD
Global Aspect Recognition
Local Aspect Recognition
3.1.2. Intragroup Intra-Condition Contrasts
Control Group
Experimental Group
3.1.3. Intragroup Contrasts Inter-Condition: Global vs. Local
Control Group
Experimental Group
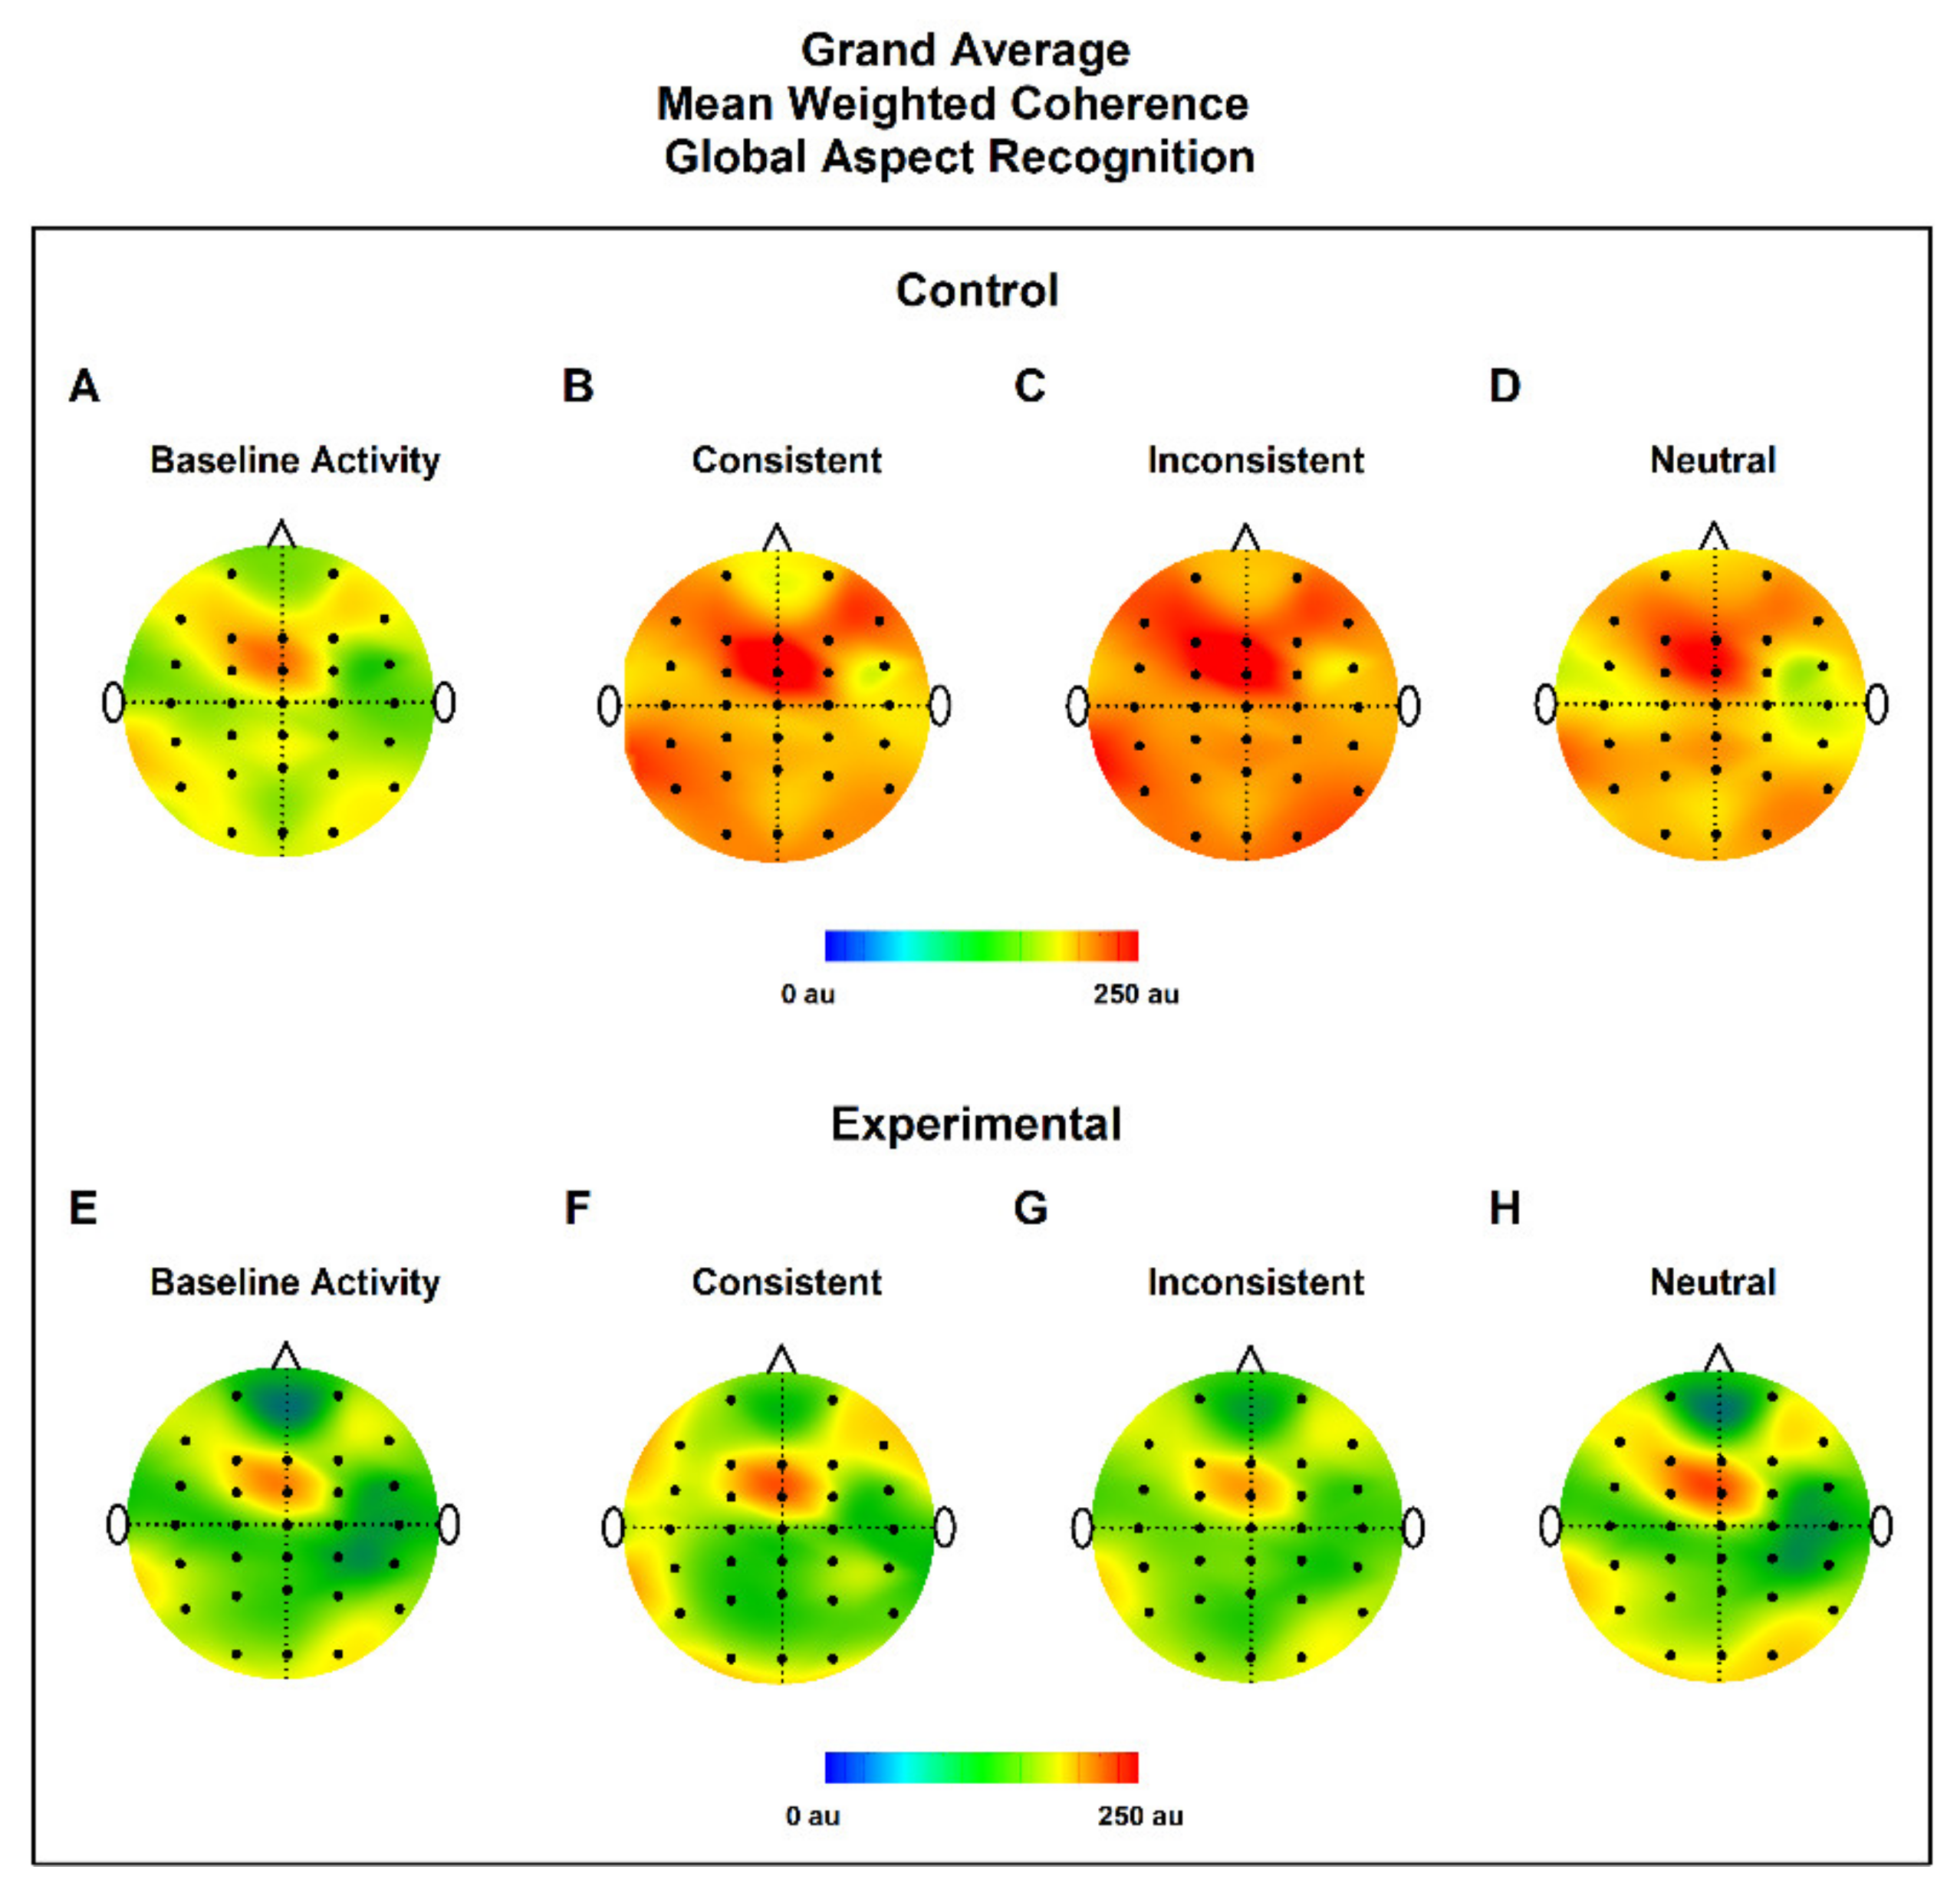
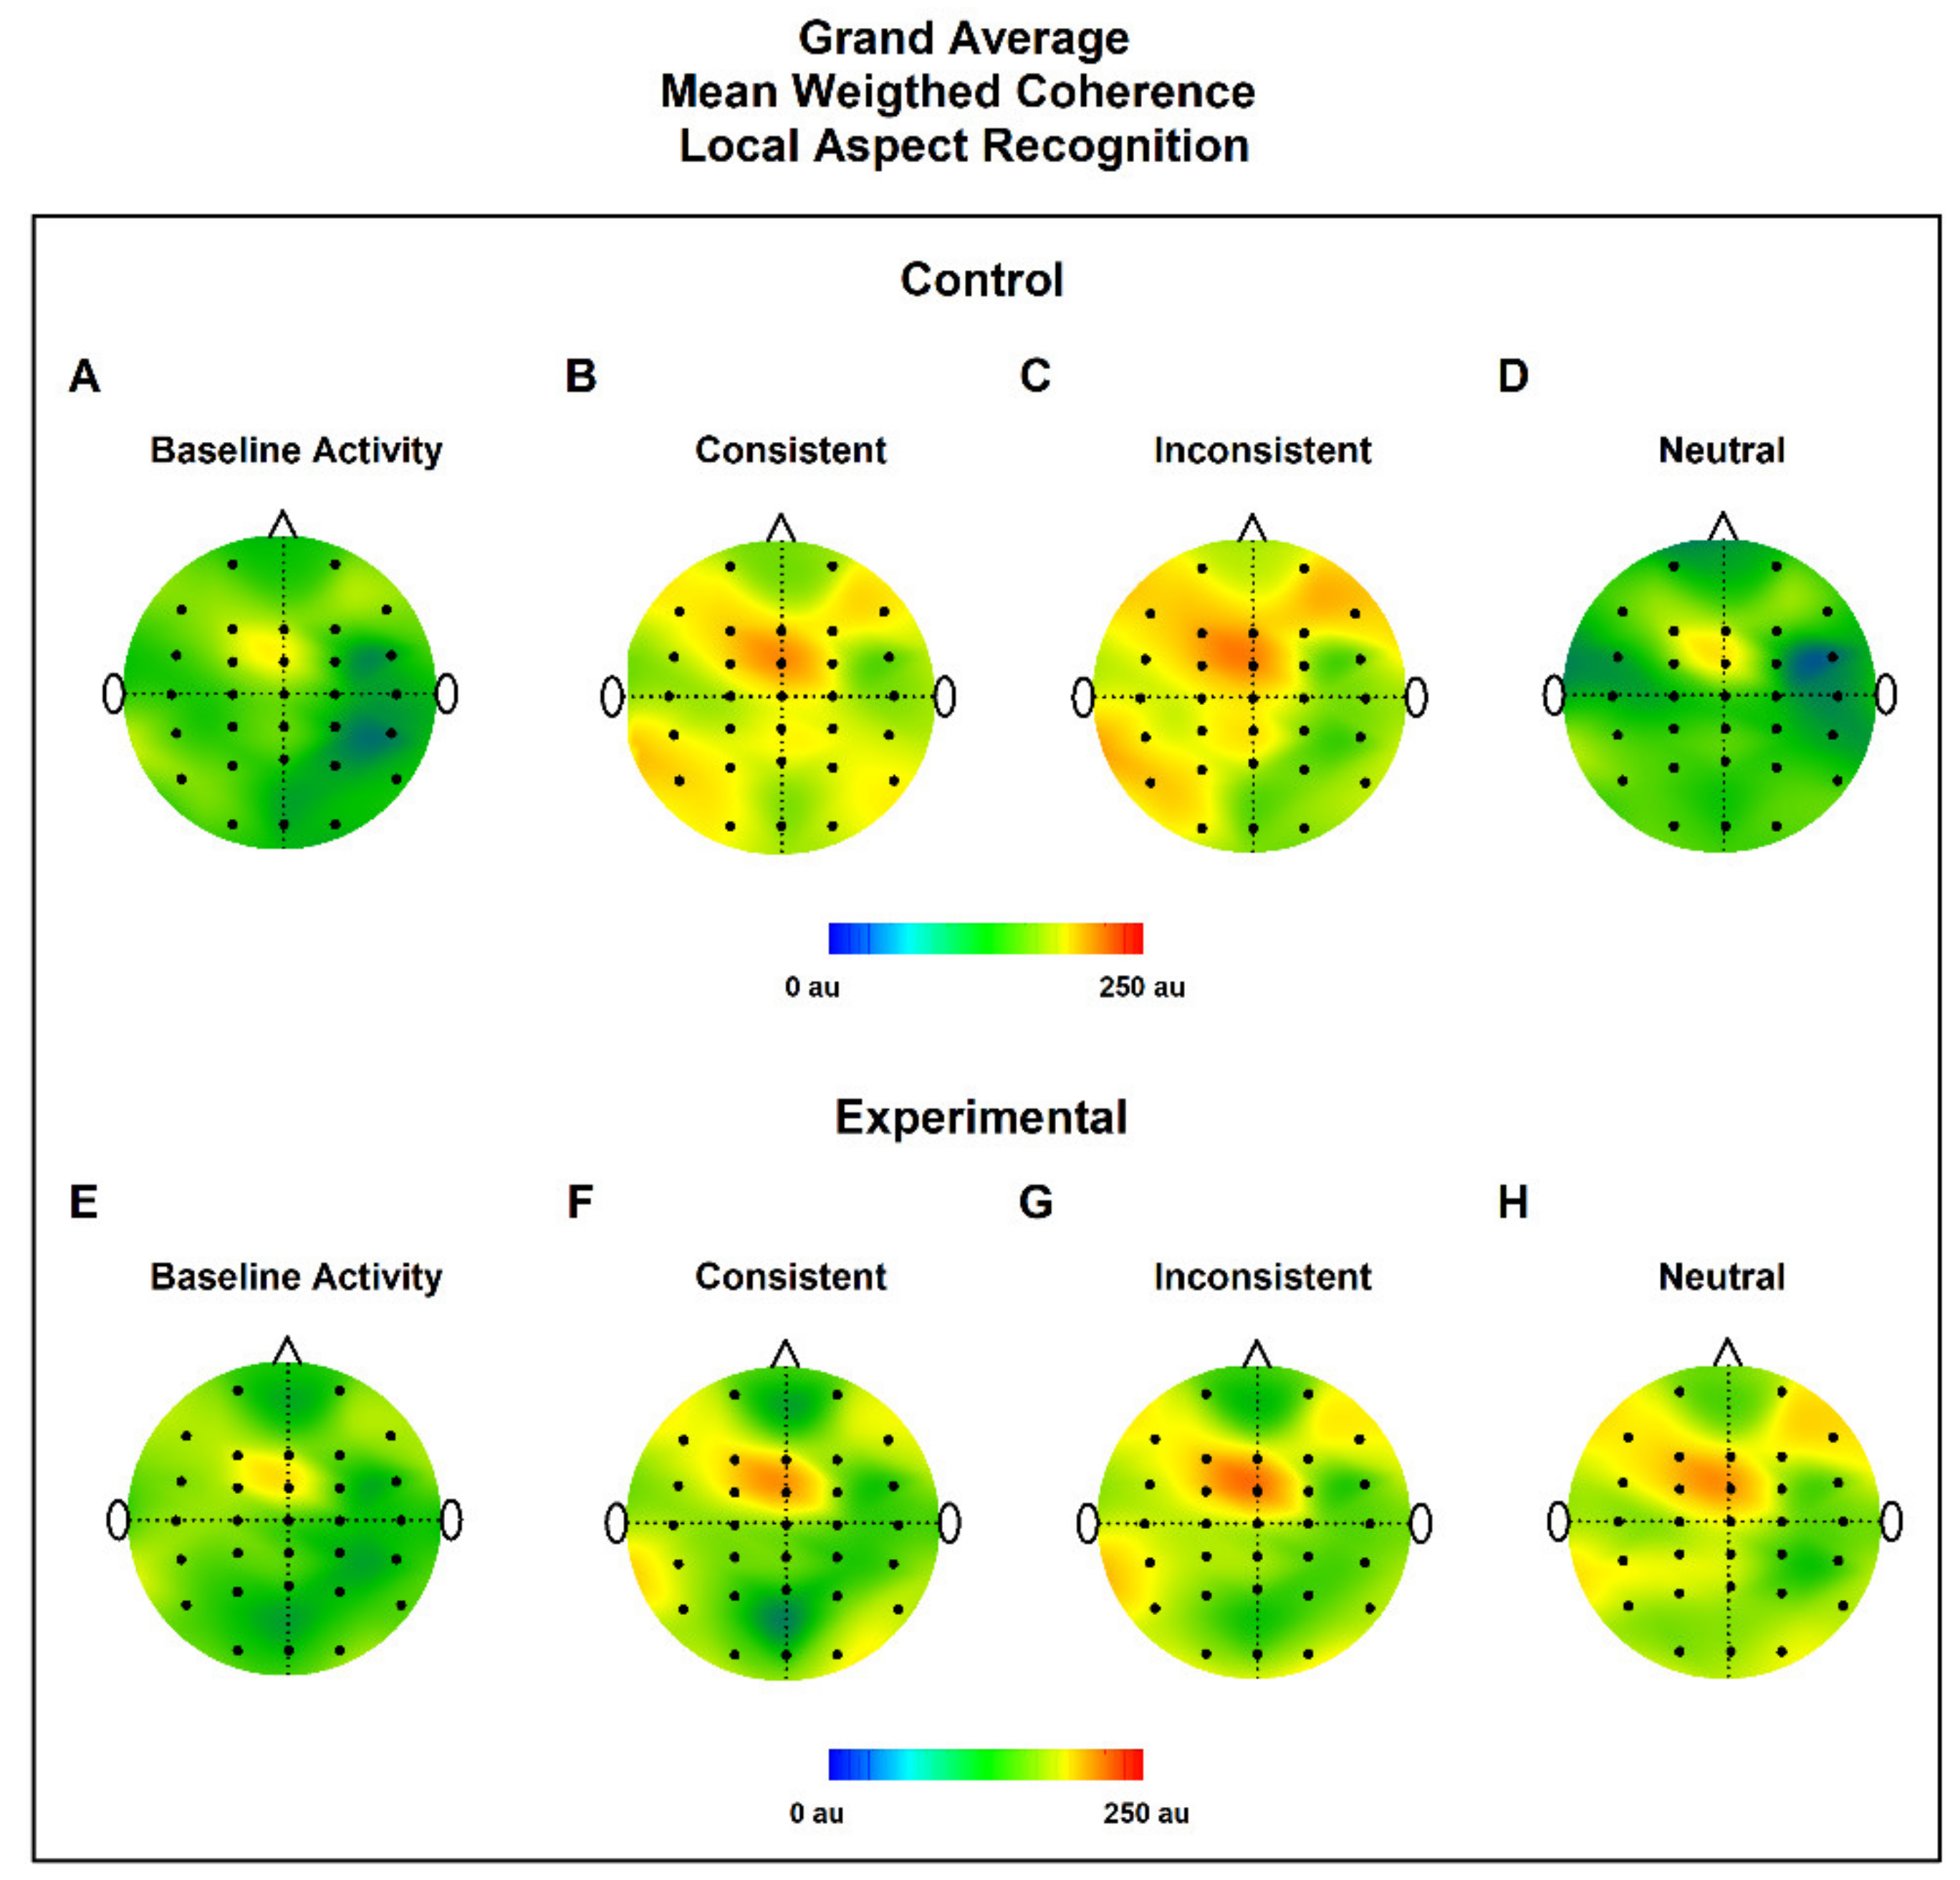
3.2. MWC Maps
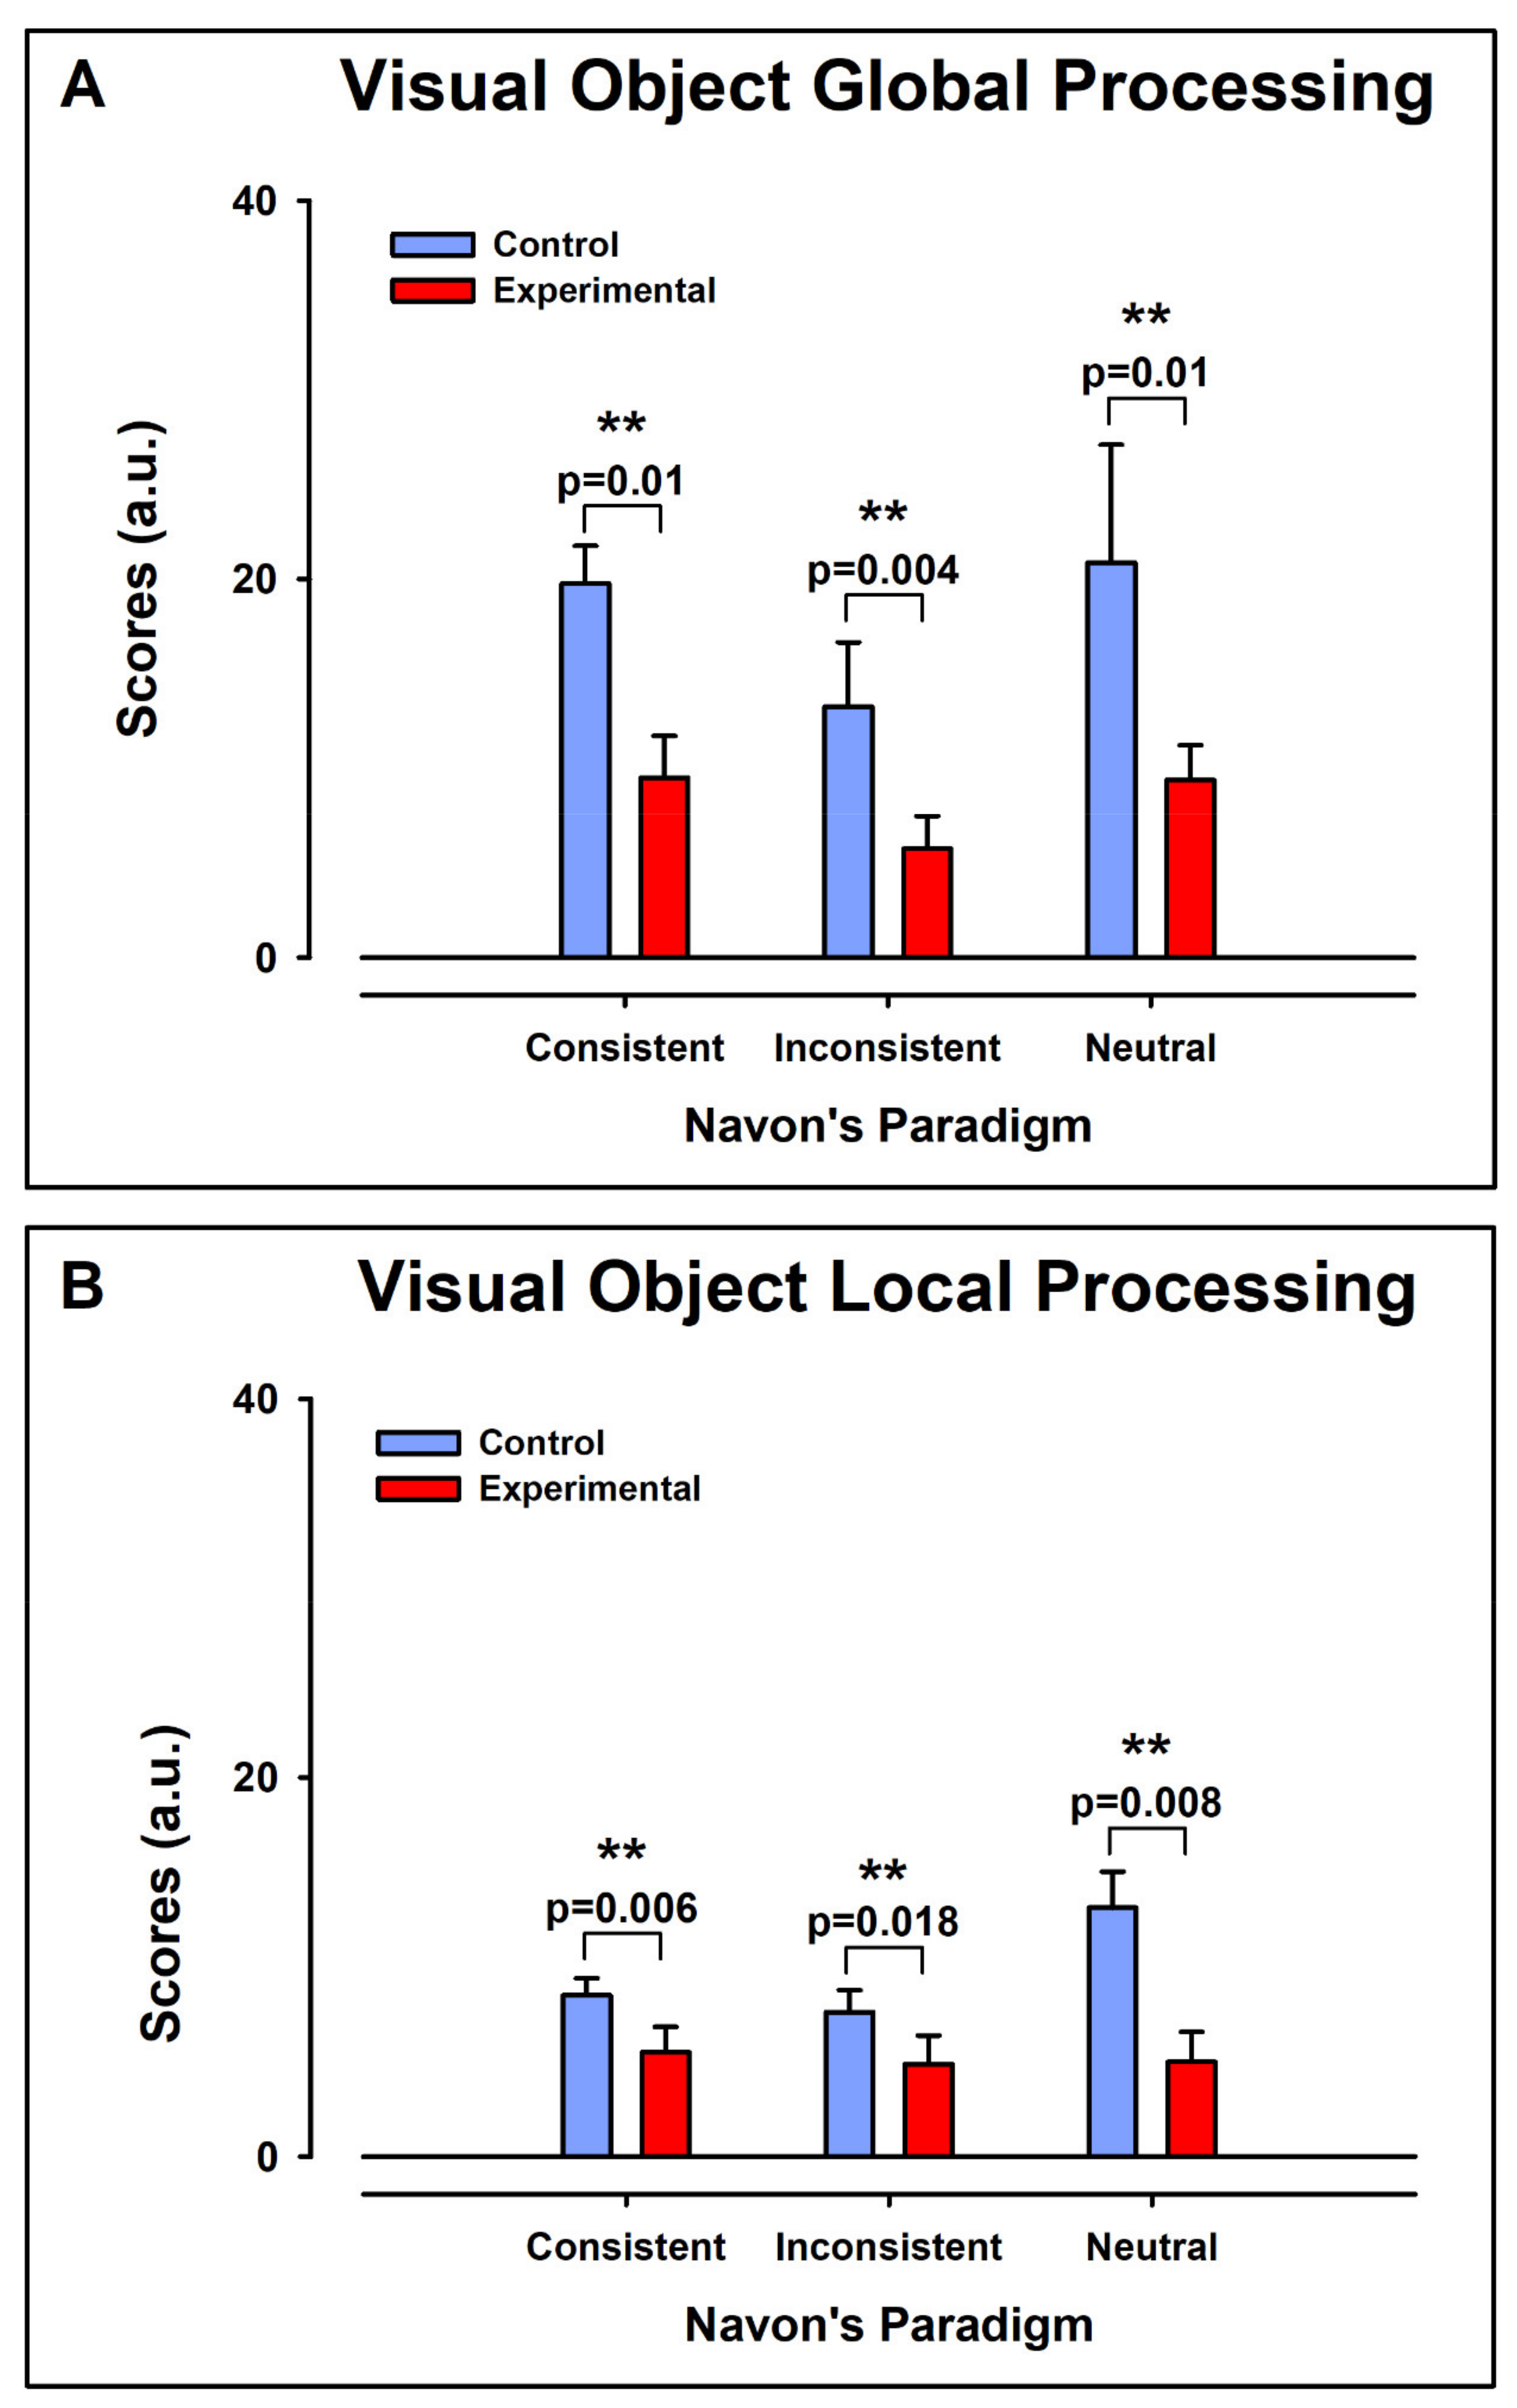
3.3. Navon Scores
3.3.1. Intergroup Contrast: Control vs. ADHD
Global Aspect Recognition
Local Aspect Recognition
3.3.2. Intragroup Intra-Condition Contrasts
Control Group
Experimental Group
3.3.3. Intragroup Contrasts Inter-Condition: Global vs. Local
Control Group
Experimental Group
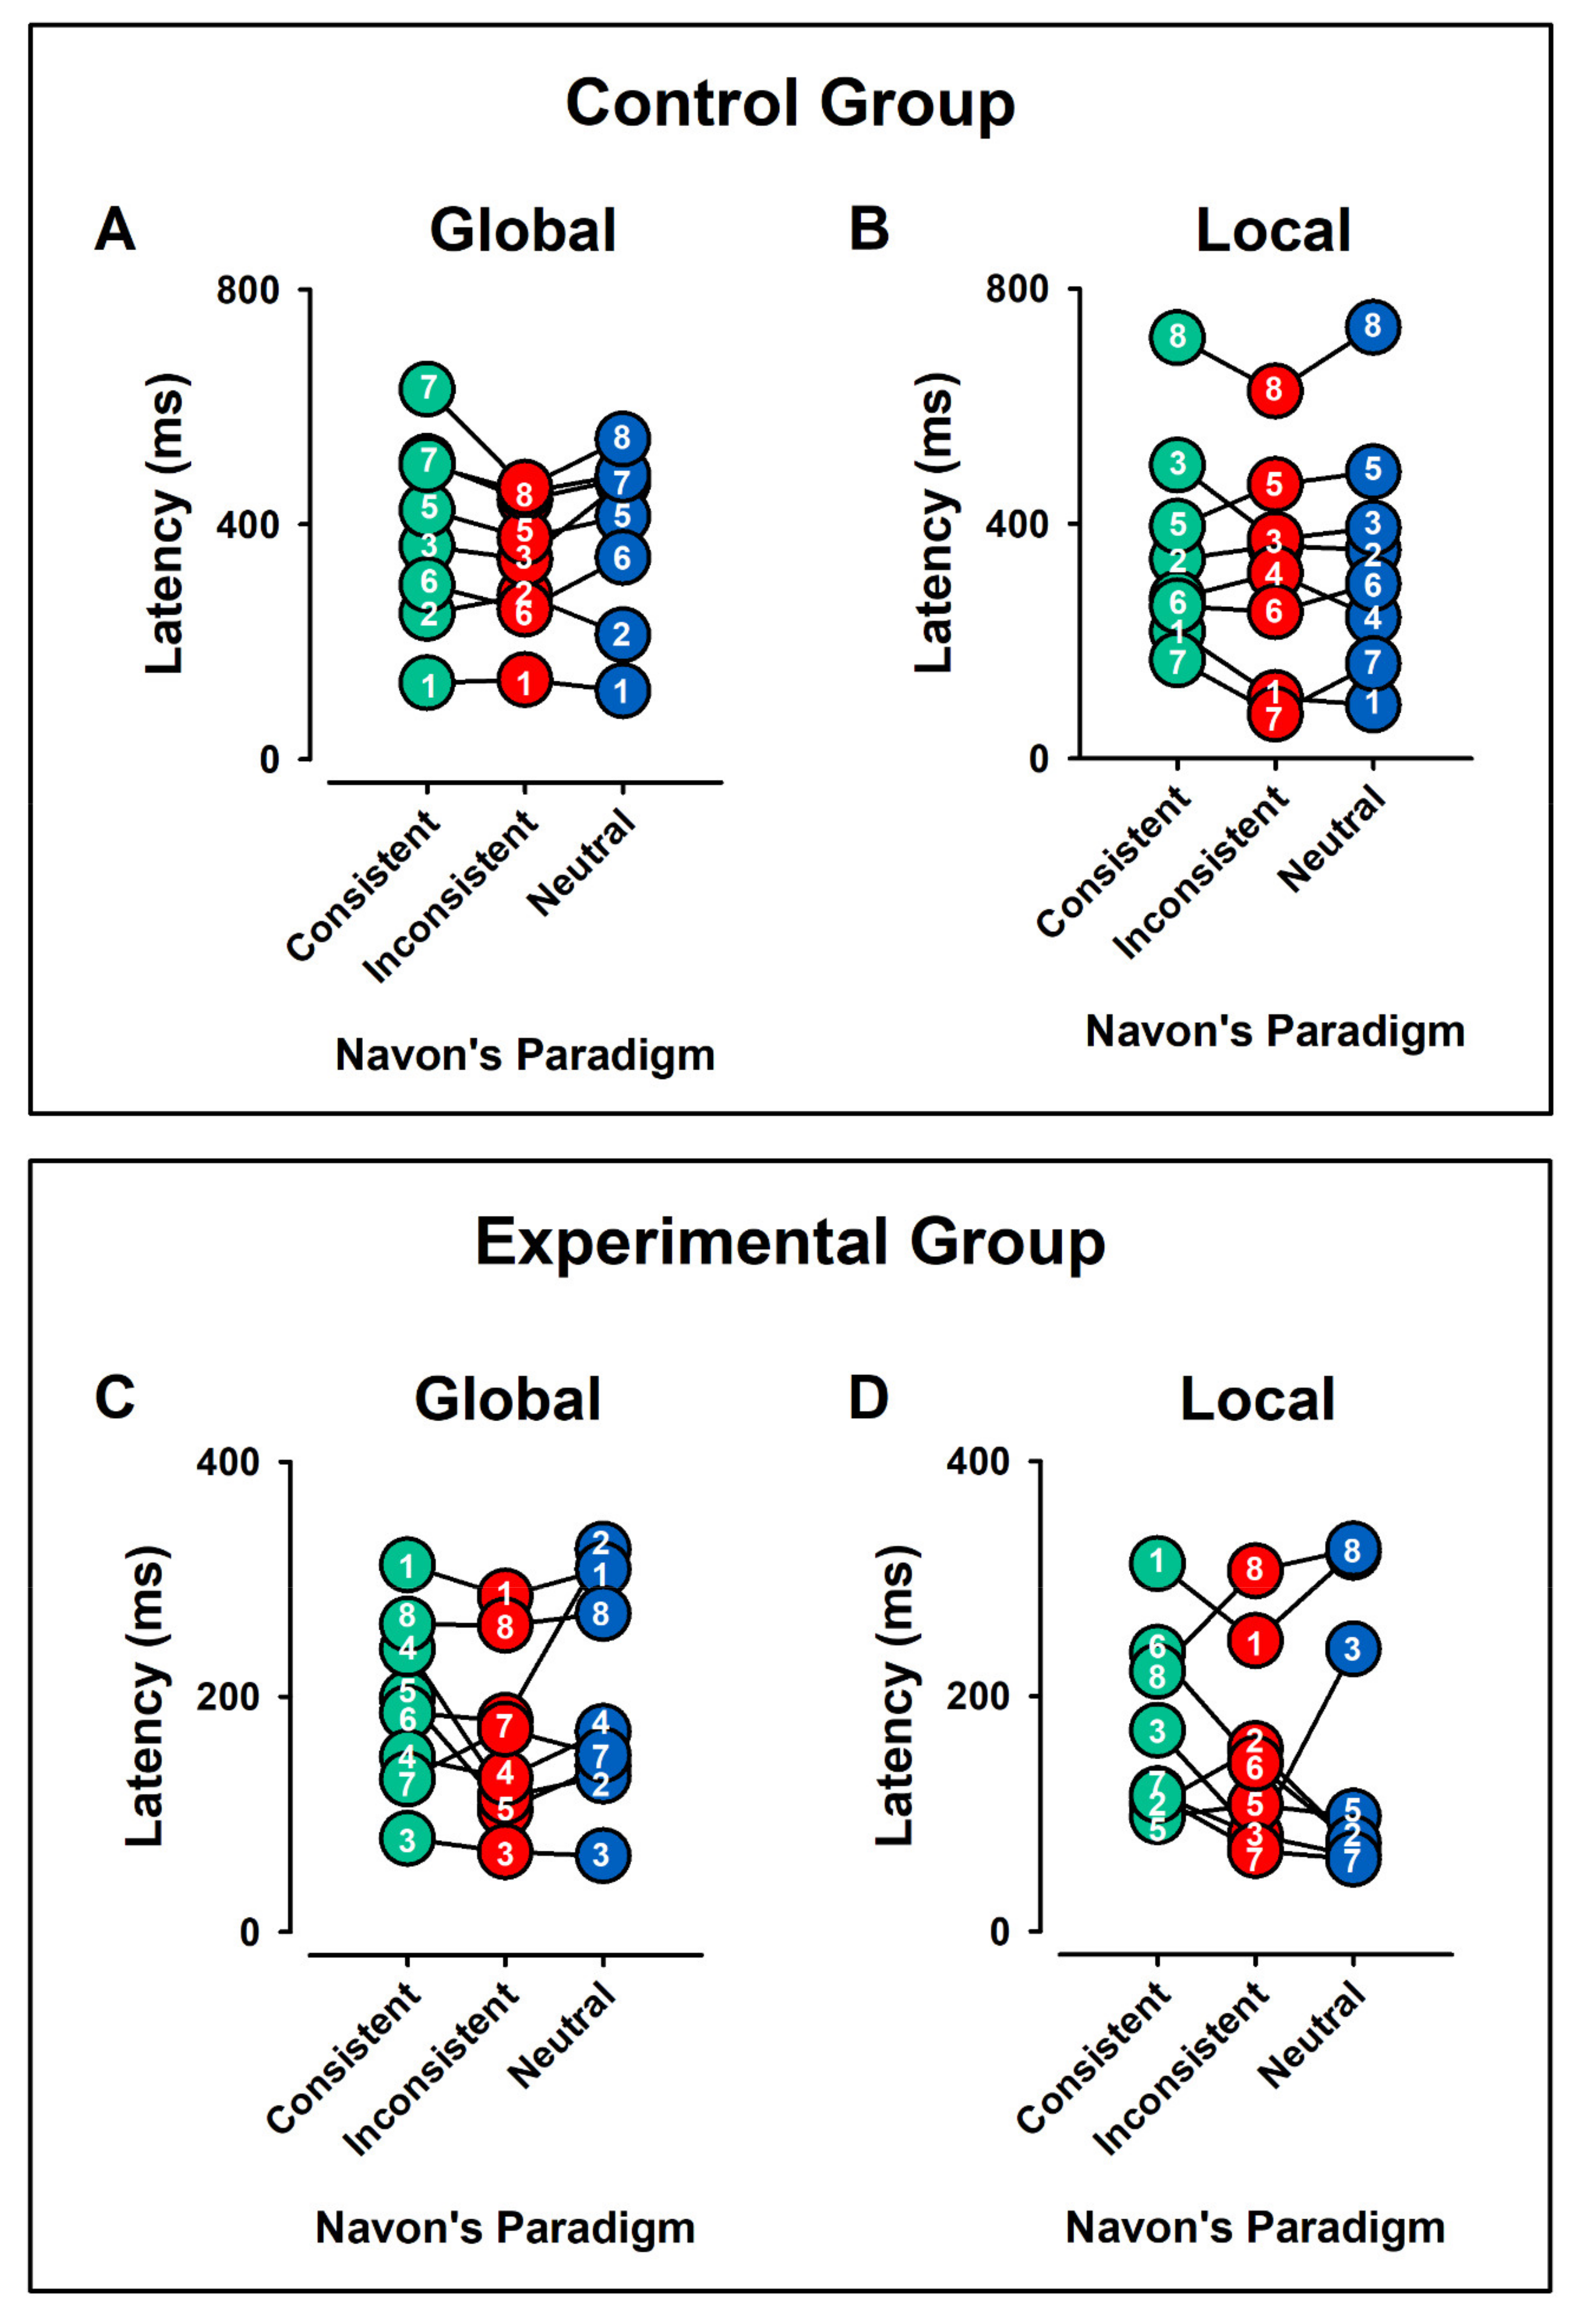
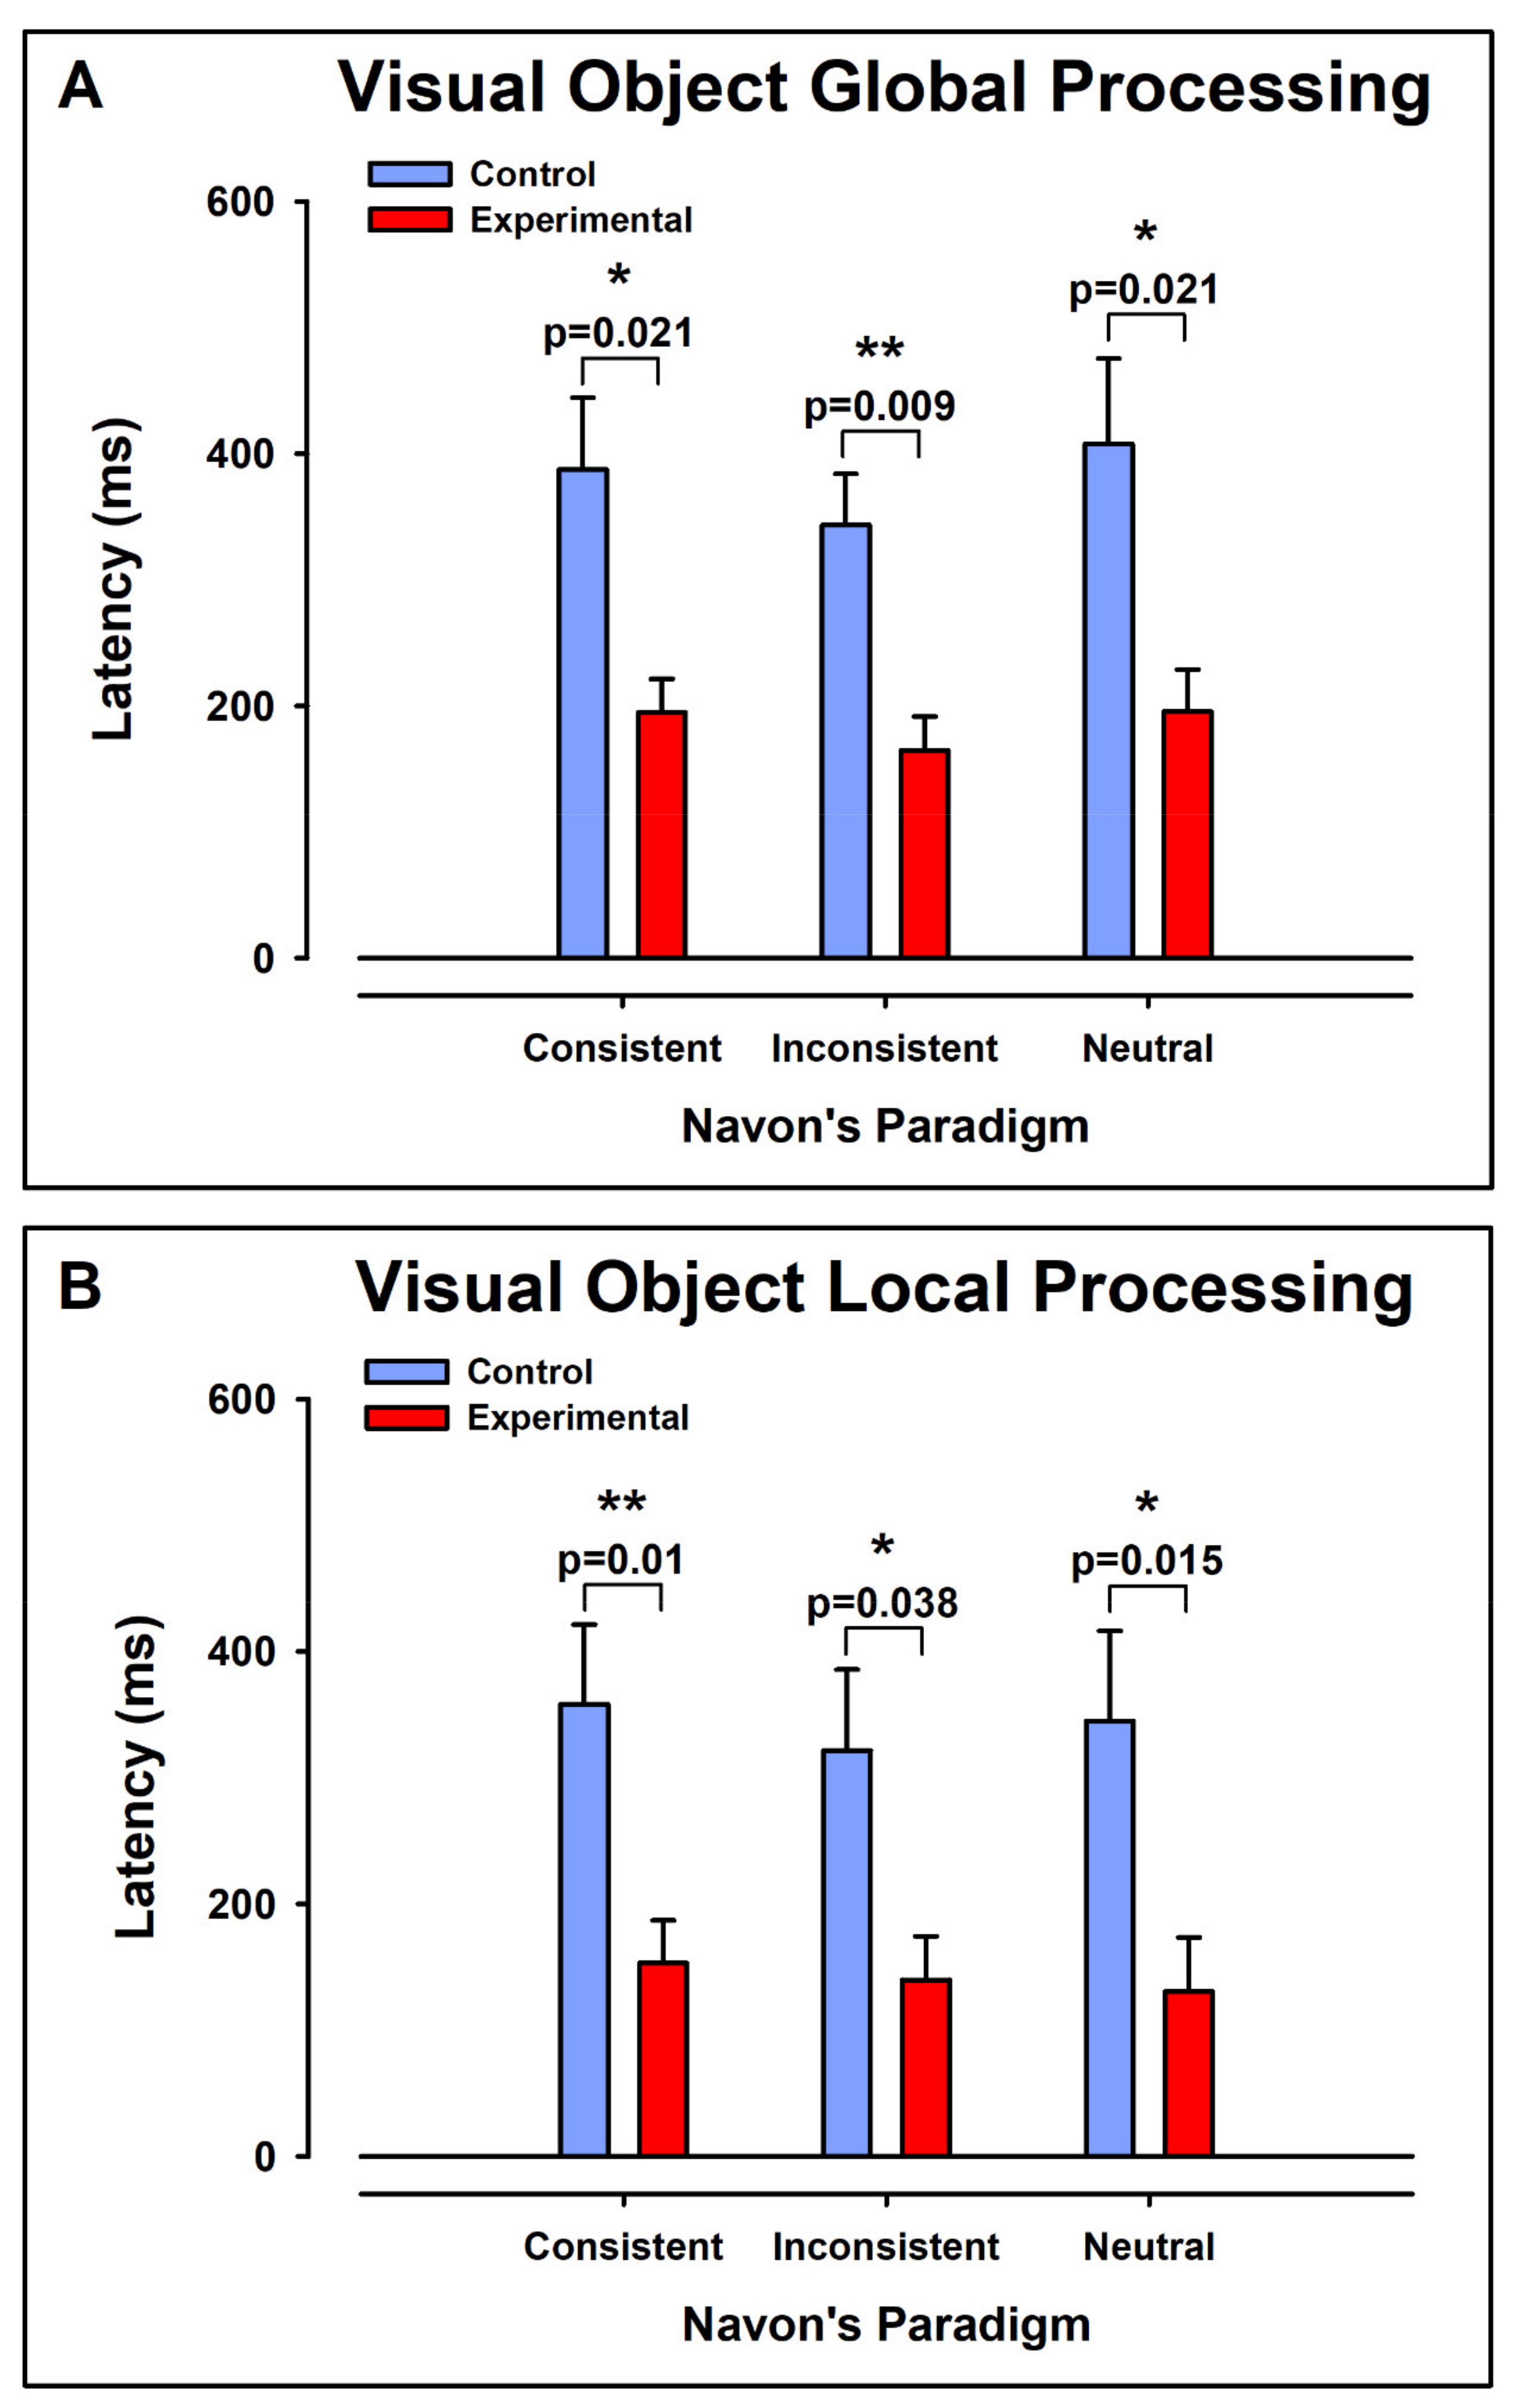
3.4. Latencies
3.4.1. Intergroup Contrast: Control vs. ADHD
Global Aspect Recognition
Local Aspect Recognition
3.4.2. Intragroup Intra-Condition Contrasts
Control Group
Experimental Group
3.4.3. Intragroup Contrasts Inter-Condition: Global vs. Local Condition
Control and Experimental Group
4. Discussion
4.1. Limitations
4.2. Open Questions for Further Research
5. Conclusions
Author Contributions
Funding
Institutional Review Board Statement
Informed Consent Statement
Data Availability Statement
Conflicts of Interest
References
- Scandurra, V.; Emberti Gialloreti, L.; Barbanera, F.; Scordo, M.R.; Pierini, A.; Canitano, R. Neurodevelopmental Disorders and Adaptive Functions: A Study of Children with Autism Spectrum Disorders (ASD) and/or Attention Deficit and Hyperactivity Disorder (ADHD). Front. Psychiatry 2019, 10, 673. [Google Scholar] [CrossRef] [PubMed] [Green Version]
- Barbaresi, W.J.; Katusic, S.K.; Colligan, R.C.; Weaver, A.L.; Jacobsen, S.J. Long-Term School Outcomes for Children with Attention-Deficit/Hyperactivity Disorder: A Population-Based Perspective. J. Dev. Behav. Pediatr. 2007, 28, 265–273. [Google Scholar] [CrossRef] [PubMed]
- Fredriksen, M.; Dahl, A.A.; Martinsen, E.W.; Klungsoyr, O.; Faraone, S.V.; Peleikis, D.E. Childhood and persistent ADHD symptoms associated with educational failure and long-term occupational disability in adult ADHD. ADHD Atten. Deficit Hyperact. Disord. 2014, 6, 87–99. [Google Scholar] [CrossRef] [PubMed] [Green Version]
- Diamond, A. Attention-Deficit Disorder (Attention-Deficit/Hyperactivity Disorder without Hyperactivity): A Neurobiologically and Behaviorally Distinct Disorder from Attention-Deficit/Hyperactivity Disorder (with Hyperactivity). Dev. Psychopathol. 2005, 17, 807–825. [Google Scholar] [CrossRef]
- Tirosh, E.; Cohen, A. Language deficit with attention-deficit disorder: A prevalent comorbidity. J. Child Neurol. 1998, 13, 493–497. [Google Scholar] [CrossRef]
- Marks, D.J.; Newcorn, J.H.; Halperin, J.M. Comorbidity in adults with attention-deficit/hyperactivity disorder. Ann. N. Y. Acad. Sci. 2001, 931, 216–238. [Google Scholar] [CrossRef]
- Quintanar, L.; Solovieva, Y.; Bonilla, R. Analysis of Visuospatial Activity in PreschoolChildren with Attention Deficit Disorder. Hum. Physiol. 2006, 32, 43–46. [Google Scholar] [CrossRef]
- Stiles, J.; Akshoomoff, N.A.; Haist, F. The development of visuospatial processing. In Neural Circuit and Cognitive Development; Elsevier: Amsterdam, The Netherlands, 2020; pp. 359–393. [Google Scholar] [CrossRef]
- Soluki, S.; Nejati, V.; Fathabadi, J. Spatial Ability in children with Attention-Deficit/Hyperactivity Disorder (ADHD) and its Impact on Executive Functions. Res. Sq. 2020. preprint. [Google Scholar] [CrossRef]
- Alderson, R.M.; Kasper, L.J.; Hudec, K.L.; Patros, C.H.G. Attention-deficit/hyperactivity disorder (ADHD) and working memory in adults: A meta-analytic review. Neuropsychology 2013, 27, 287–302. [Google Scholar] [CrossRef] [PubMed]
- Kofler, M.J.; Sarver, D.E.; Spiegel, J.A.; Day, T.N.; Harmon, S.L.; Wells, E.L. Heterogeneity in ADHD: Neurocognitive Predictors of Peer, Family, and Academic Functioning. Child Neuropsychol. 2017, 23, 733–759. [Google Scholar] [CrossRef] [PubMed]
- Rapport, M.D.; Orban, S.A.; Kofler, M.J.; Friedman, L.M. Do programs designed to train working memory, other executive functions, and attention benefit children with ADHD? A meta-analytic review of cognitive, academic, and behavioral outcomes. Clin. Psychol. Rev. 2013, 33, 1237–1252. [Google Scholar] [CrossRef]
- Cardillo, R.; Vio, C.; Mammarella, I.C. A comparison of local-global visuospatial processing in autism spectrum disorder, nonverbal learning disability, ADHD and typical development. Res. Dev. Disabil. 2020, 103, 103682. [Google Scholar] [CrossRef]
- Ging-Jehli, N.R.; Ratcliff, R.; Arnold, L.E. Improving neurocognitive testing using computational psychiatry—A systematic review for ADHD. Psychol. Bull. 2021, 147, 169–231. [Google Scholar] [CrossRef]
- Song, Y.; Hakoda, Y. Lack of global precedence and global-to-local interference without local processing deficit: A robust finding in children with attention-deficit/hyperactivity disorder under different visual angles of the Navon task. Neuropsychology 2015, 29, 888–894. [Google Scholar] [CrossRef]
- Berger, H. Über das elektrenkephalogramm des menschen. DMW-Dtsch. Med. Wochenschr. 1934, 60, 1947–1949. [Google Scholar] [CrossRef]
- Lindsley, D.B. A longitudinal study of the occipital alpha rhythm in normal children: Frequency and amplitude standards. Pedagog. Semin. J. Genet. Psychol. 1939, 55, 197–213. [Google Scholar] [CrossRef]
- Kellaway, P.; Noebels, J.L. Problems and Concepts in Developmental Neurophysiology; The Johns Hopkins University Press: Baltimore, MA, USA, 1989. [Google Scholar] [CrossRef]
- Saad, J.F.; Kohn, M.R.; Clarke, S.; Lagopoulos, J.; Hermens, D.F. Is the theta/beta EEG marker for ADHD inherently flawed? J. Atten. Disord. 2018, 22, 815–826. [Google Scholar] [CrossRef]
- Furlong, S.; Cohen, J.R.; Hopfinger, J.; Snyder, J.; Robertson, M.M.; Sheridan, M.A. Resting-state EEG Connectivity in Young Children with ADHD. J. Clin. Child Adolesc. Psychol. 2020, 50, 746–762. [Google Scholar] [CrossRef]
- Khoshnoud, S.; Nazari, M.A.; Shamsi, M. Functional brain dynamic analysis of ADHD and control children using nonlinear dynamical features of EEG signals. J. Integr. Neurosci. 2018, 17, 17–30. [Google Scholar] [CrossRef]
- Murias, M.; Swanson, J.M.; Srinivasan, R. Functional Connectivity of Frontal Cortex in Healthy and ADHD Children Reflected in EEG Coherence. Cereb. Cortex 2007, 17, 1788–1799. [Google Scholar] [CrossRef] [Green Version]
- Robbie, J.C.; Clarke, A.R.; Barry, R.J.; Dupuy, F.E.; McCarthy, R.; Selikowitz, M. Coherence in children with AD/HD and excess alpha power in their EEG. Clin. Neurophysiol. 2016, 127, 2161–2166. [Google Scholar] [CrossRef]
- Zarafshan, H.; Khaleghi, A.; Mohammadi, M.R.; Moeini, M.; Malmir, N. Electroencephalogram complexity analysis in children with attention-deficit/hyperactivity disorder during a visual cognitive task. J. Clin. Exp. Neuropsychol. 2016, 38, 361–369. [Google Scholar] [CrossRef]
- Slater, J.; Joober, R.; Koborsy, B.L.; Mitchell, S.; Sahlas, E.; Palmer, C. Can electroencephalography (EEG) identify ADHD subtypes? A systematic review. medRxiv 2022. preprint. [Google Scholar] [CrossRef]
- Chen, C.; Yang, H.; Du, Y.; Zhai, G.; Xiong, H.; Yao, D.; Xu, P.; Gong, J.; Yin, G.; Li, F. Altered Functional Connectivity in Children with ADHD Revealed by Scalp EEG: An ERP Study. Neural Plast. 2021, 2021, 6615384. [Google Scholar] [CrossRef]
- Brier, M.R.; Ferree, T.C.; Maguire, M.J.; Moore, P.; Spence, J.; Tillman, G.D.; Tillman, J.H., Jr.; Kraut, M.A. Frontal theta and alpha power and coherence changes are modulated by semantic complexity in Go/NoGo tasks. Int. J. Psychophysiol. 2010, 78, 215–224. [Google Scholar] [CrossRef]
- Häger, L.A.; Øgrim, G.; Danielsen, M.; Billstedt, E.; Gillberg, C.; Johnels, J.Å. Indexing Executive Functions with Test Scores, Parent Ratings and ERPs: How Do the Measures Relate in Children versus Adolescents with ADHD? Neuropsychiatr. Dis. Treat. 2020, 16, 465. [Google Scholar] [CrossRef] [Green Version]
- Häger, L.A.; Johnels, J.Å.; Kropotov, J.D.; Weidle, B.; Hollup, S.; Zehentbauer, P.G.; Gillberg, C.; Billstedt, E.; Ogrim, G. Biomarker support for ADHD diagnosis based on Event Related Potentials and scores from an attention test. Psychiatry Res. 2021, 300, 113879. [Google Scholar] [CrossRef]
- Chen, H.; Chen, W.; Song, Y.; Sun, L.; Li, X. EEG characteristics of children with attention-deficit/hyperactivity disorder. Neuroscience 2019, 406, 444–456. [Google Scholar] [CrossRef]
- Smith, S.D.; Crowley, M.J.; Ferrey, A.; Ramsey, K.; Wexler, B.E.; Leckman, J.F.; Sukhodolsky, D.G. Effects of Integrated Brain, Body, and Social (IBBS) intervention on ERP measures of attentional control in children with ADHD. Psychiatry Res. 2019, 278, 248–257. [Google Scholar] [CrossRef]
- Lenartowicz, A.; Loo, S.K. Use of EEG to diagnose ADHD. Curr. Psychiatry Rep. 2014, 16, 1–11. [Google Scholar] [CrossRef] [Green Version]
- Barry, R.J.; Clarke, A.R.; McCarthy, R.; Selikowitz, M.; Johnstone, S.J.; Rushby, J.A. Age and gender effects in EEG coherence: I. Developmental trends in normal children. Clin. Neurophysiol. 2004, 115, 2252–2258. [Google Scholar] [CrossRef] [PubMed]
- Barry, R.J.; Clarke, A.R.; McCarthy, R.; Selikowitz, M. Age and gender effects in EEG coherence: II. Boys with attention-deficit/hyperactivity disorder. Clin. Neurophysiol. 2005, 116, 977–984. [Google Scholar] [CrossRef] [PubMed]
- Barry, R.J.; Clarke, A.R.; McCarthy, R.; Selikowitz, M. Age and gender effects in EEG coherence: III. Girls with attention-deficit/hyperactivity disorder. Clin. Neurophysiol. 2006, 117, 243–251. [Google Scholar] [CrossRef] [PubMed]
- Thatcher, R.W.; North, D.M.; Biver, C.J. Development of cortical connections as measured by EEG coherence and phase delays. Hum. Brain Mapp. 2008, 29, 1400–1415. [Google Scholar] [CrossRef]
- Vysata, O.; Kukal, J.; Prochazka, A.; Pazdera, L.; Simko, J.; Valis, M. Age-related changes in EEG coherence. Neurol. I Neurochir. Pol. 2014, 48, 35–38. [Google Scholar] [CrossRef] [Green Version]
- Babiloni, C.; Blinowska, K.; Bonanni, L.; Cichocki, A.; De Haan, W.; Del Percio, C.; Dubois, B.; Escudero, J.; Fernández, A.; Frisoni, G.; et al. What electrophysiology tells us about Alzheimer’s disease: A window into the synchronization and connectivity of brain neurons. Neurobiol. Aging 2020, 85, 58–73. [Google Scholar] [CrossRef]
- Mehdizadefar, V.; Ghassemi, F.; Fallah, A. Brain Connectivity Reflected in Electroencephalogram Coherence in Individuals with Autism: A Meta-Analysis. Basic Clin. Neurosci. 2019, 10, 409–417. [Google Scholar] [CrossRef] [Green Version]
- Miraglia, F.; Vecchio, F.; Rossini, P.M. Brain electroencephalographic segregation as a biomarker of learning. Neural Netw. 2018, 106, 168–174. [Google Scholar] [CrossRef]
- El’Konin, D.B. Toward the problem of stages in the mental development of children. Vopr. Psikhologii 1971, 4, 6–20. [Google Scholar] [CrossRef]
- Trenado, C.; Mendez-Balbuena, I.; Manjarrez, E.; Huethe, F.; Schulte-Mönting, J.; Feige, B.; Hepp-Reymond, M.C.; Kristeva, R. Enhanced corticomuscular coherence by external stochastic noise. Front. Hum. Neurosci. 2014, 8, 1–10. [Google Scholar] [CrossRef]
- Mendez-Balbuena, I.; Huethe, F.; Schulte-Mönting, J.; Leonhart, R.; Manjarrez, E.; Kristeva, R. Corticomuscular coherence reflects interindividual differences in the state of the corticomuscular network during low-level static and dynamic forces. Cereb. Cortex 2012, 22, 628–638. [Google Scholar] [CrossRef] [Green Version]
- Omlor, W.; Patino, L.; Mendez-Balbuena, I.; Schulte-Mönting, J.; Kristeva, R. Corticospinal beta-range coherence is highly dependent on the pre-stationary motor state. J. Neurosci. 2011, 31, 8037–8045. [Google Scholar] [CrossRef] [Green Version]
- Nunez, P.L.; Srinivasan, R.; Westdorp, A.F.; Wijesinghe, R.S.; Tucker, D.M.; Silberstein, R.B.; Cadusch, P.J. EEG coherency. I: Statistics, reference electrode, volume conduction, Laplacians, cortical imaging, and interpretation at multiple scales. Electroencephalogr. Clin. Neurophysiol. 1997, 103, 499–515. [Google Scholar] [CrossRef]
- Perrin, F.; Pernier, J.; Bertrand, O.; Echallier, J.F. Spherical splines for scalp potential and current density mapping. Electroencephalogr. Clin. Neurophysiol. 1989, 72, 184–187. [Google Scholar] [CrossRef]
- Rosenberg, J.R.; Amjad, A.M.; Breeze, P.; Brillinger, D.R.; Halliday, D.M. The Fourier approach to the identification of functional coupling between neuronal spike trains. Prog. Biophys. Mol. Biol. 1989, 53, 1–31. [Google Scholar] [CrossRef]
- Mendez-Balbuena, I.; Arrieta, P.; Huidobro, N.; Flores, A.; Lemuz-Lopez, R.; Trenado, C.; Manjarrez, E. Augmenting EEG-global-coherence with auditory and visual noise: Multisensory internal stochastic resonance. Medicine 2018, 97, e12008. [Google Scholar] [CrossRef]
- Sayal, K.; Prasad, V.; Daley, D.; Ford, T.; Coghill, D. ADHD in children and young people: Prevalence, care pathways, and service provision. Lancet Psychiatry 2018, 5, 175–186. [Google Scholar] [CrossRef]
- Luria, A.R. The role of language in the formation of temporary connections. In Psychology in the Soviet Union Ils 272; Routledge: Oxfordshire, UK, 2003; pp. 123–138. [Google Scholar] [CrossRef]
- Sehatpour, P.; Molholm, S.; Schwartz, T.H.; Mahoney, J.R.; Mehta, A.D.; Javitt, D.C.; Stanton, P.K.; Foxe, J.J. A human intracranial study of long-range oscillatory coherence across a frontal-occipital-hippocampal brain network during visual object processing. Proc. Natl. Acad. Sci. USA 2008, 105, 4399–4404. [Google Scholar] [CrossRef] [Green Version]
- Brummerloh, B.; Müller, M.M. Time matters: Feature-specific prioritization follows feature integration in visual object processing. NeuroImage 2019, 196, 81–93. [Google Scholar] [CrossRef]
- Plankar, M.; Brežan, S.; Jerman, I. The principle of coherence in multi-level brain information processing. Prog. Biophys. Mol. Biol. 2013, 111, 8–29. [Google Scholar] [CrossRef]
- Duncan, J. Selective attention and the organization of visual information. J. Exp. Psychol. Gen. 1984, 113, 501. [Google Scholar] [CrossRef]
- O’Craven, K.M.; Downing, P.E.; Kanwisher, N. fMRI evidence for objects as the units of attentional selection. Nature 1999, 401, 584–587. [Google Scholar] [CrossRef]
- Rizkallah, J.; Benquet, P.; Kabbara, A.; Dufor, O.; Wendling, F.; Hassan, M. Dynamic reshaping of functional brain networks during visual object recognition. J. Neural Eng. 2018, 15, 056022. [Google Scholar] [CrossRef] [Green Version]
- Gorantla, V.R.; Tedesco, S.; Chandanathil, M.; Maity, S.; Bond, V.; Lewis, C.; Millis, R.M. Associations of alpha and beta interhemispheric EEG coherences with indices of attentional control and academic performance. Behav. Neurol. 2020, 2020, 4672340. [Google Scholar] [CrossRef] [Green Version]
- Aydın, S.; Demirtaş, S.; Yetkin, S. Cortical correlations in wavelet domain for estimation of emotional dysfunctions. Neural Comput. Appl. 2018, 30, 1085–1094. [Google Scholar] [CrossRef]


| Group | Mean Age (SD) | School | Scholarship | Female | Male | Current Drug Use |
|---|---|---|---|---|---|---|
| Control | 11 (0) | Elementary Urban Public | 5th grade | 5 | 3 | NO |
| ADHD | 4 | 4 | NO |
Publisher’s Note: MDPI stays neutral with regard to jurisdictional claims in published maps and institutional affiliations. |
© 2022 by the authors. Licensee MDPI, Basel, Switzerland. This article is an open access article distributed under the terms and conditions of the Creative Commons Attribution (CC BY) license (https://creativecommons.org/licenses/by/4.0/).
Share and Cite
Hernández-Andrade, L.; Hermosillo-Abundis, A.C.; Betancourt-Navarrete, B.L.; Ruge, D.; Trenado, C.; Lemuz-López, R.; Pelayo-González, H.J.; López-Cortés, V.A.; Bonilla-Sánchez, M.d.R.; García-Flores, M.A.; et al. EEG Global Coherence in Scholar ADHD Children during Visual Object Processing. Int. J. Environ. Res. Public Health 2022, 19, 5953. https://doi.org/10.3390/ijerph19105953
Hernández-Andrade L, Hermosillo-Abundis AC, Betancourt-Navarrete BL, Ruge D, Trenado C, Lemuz-López R, Pelayo-González HJ, López-Cortés VA, Bonilla-Sánchez MdR, García-Flores MA, et al. EEG Global Coherence in Scholar ADHD Children during Visual Object Processing. International Journal of Environmental Research and Public Health. 2022; 19(10):5953. https://doi.org/10.3390/ijerph19105953
Chicago/Turabian StyleHernández-Andrade, Loyda, Ana Cristina Hermosillo-Abundis, Brenda Lesly Betancourt-Navarrete, Diane Ruge, Carlos Trenado, Rafael Lemuz-López, Héctor Juan Pelayo-González, Vicente Arturo López-Cortés, María del Rosario Bonilla-Sánchez, Marco Antonio García-Flores, and et al. 2022. "EEG Global Coherence in Scholar ADHD Children during Visual Object Processing" International Journal of Environmental Research and Public Health 19, no. 10: 5953. https://doi.org/10.3390/ijerph19105953
APA StyleHernández-Andrade, L., Hermosillo-Abundis, A. C., Betancourt-Navarrete, B. L., Ruge, D., Trenado, C., Lemuz-López, R., Pelayo-González, H. J., López-Cortés, V. A., Bonilla-Sánchez, M. d. R., García-Flores, M. A., & Méndez-Balbuena, I. (2022). EEG Global Coherence in Scholar ADHD Children during Visual Object Processing. International Journal of Environmental Research and Public Health, 19(10), 5953. https://doi.org/10.3390/ijerph19105953