Abstract
Water resources in arid and semi-arid regions are limited where the demands of agriculture, drinking and industry are increasing, especially in drought areas. These regions are subjected to climate changes (CC) that affect the watershed duration and water supplies. Estimations of flash flooding (FF) volume and discharge are required for future development to meet the water demands in these water scarcity regions. Moreover, FF in hot deserts is characterized by low duration, high velocity and peak discharge with a large volume of sediment. Today, the trends of flash flooding due to CC have become very dangerous and affect water harvesting volume and human life due to flooding hazards. The current study forecasts the peak discharges and volumes in the desert of El-Qaa plain in Southwestern Sinai, Egypt, for drought and wet seasons by studying the influence of recurrence intervals for 2, 5, 10, 25, 50 and 100 years. Watershed modeling system software (WMS) is used and applied for the current study area delineation. The results show that the predictions of peak discharges reached 0, 0.44, 45.72, 195.45, 365.91 and 575.30 cubic meters per s (m3 s−1) while the volumes reached 0, 23, 149.80, 2,896,241.40, 12,664,963.80 and 36,681,492.60 cubic meters (m3) for 2, 5, 10, 25, 50 and 100 years, respectively, which are precipitation depths of 15.20, 35.30, 50.60, 70.70, 85.90 and 101 mm, respectively. Additionally, the average annual precipitation reached 13.37 mm, with peak flow and volume reaching 0 m3 s−1 where all of water harvesting returned losses. Moreover, future charts and equations were developed to estimate the peak flow and volume, which are useful for future rainwater harvesting and the design of protection against flooding hazards in drought regions due to CC for dry and wet seasons. This study provides relevant information for hazard and risk assessment for FF in hot desert regions. The study recommends investigating the impact of recurrence intervals on sediment transport in these regions.
1. Introduction
Flash flooding is becoming more common as a result of extreme weather conditions, and affects on human and animal mortality, accidents, mental health difficulties, vector-borne infections, and waterborne diseases [1,2]. Many coastal areas are effected by freshwater boundary changes due to over-pumping and CC [3]. FF hazards are responsible for economic and human life loss. Estimation of runoff is an important hydrological aspect and plays a vital role in the planning and management of natural processes, such as soil erosion, flood and drought risks. The limitation is the availability of hydrological data in dry valleys [4]. The variation in high-velocity of the rainfall over a short duration is responsible for FF values the heavy sediment load that threatens the lower part of settlements in the wadis and affects the livelihood of the community of the watershed [5].
Rainfall forecasting is critical for providing early warnings before FF events, allowing disasters to be avoided or minimized [6]. The volume of water collected, penetrated, stored, evaporated, transpired and subtracted from the precipitation (i.e., runoff) is calculated using the rainfall-runoff model. Infiltration and evaporation are two types of flood losses. Infiltration is calculated using the Green–Ampt model (GAM), the Horton formula, and the soil conservation service (SCS) curve number (CN) approach [7]. The findings of the two approaches, i.e., the GAM and CN equation, were compared by Smemoe et al. (2004) [8]. The results showed that the GAM was superior to the CN method. Chahinian et al. (2005) [9] applied Philip, Morel-Seytoux, Horton and SCS infiltration models to the test on 14 different events. The mathematical framework and calibration parameters of these models were different, but the input hydrologic data were the same. The results revealed that the Morel-Seytoux model outperformed the others, with the SCS coming in last. Horton’s model performed better than Philip’s in terms of overall consistency.
The runoff discharge could be estimated by several synthetic unit hydrograph (UH) methods including SCS dimensionless UH and Snyder UH, while the peak discharge could be estimated by the rational approach. Jena and Tiwari (2006) [10] employed GIS to investigate two watersheds and associated sub-watersheds in West Bengal’s Midnapore and Bankura districts. Flow data and UH were used to create the runoff hydrographs. Garambois et al. (2014) [11] used statistical analysis to investigate FF storms and the hydrological responses of catchments in the Pyrenean foothills up to the Aude area. The findings showed that increasing initial soil saturation led to faster catchment flood response times, ranging from 3 to 10 h, as well as flooding caused by rainfall near the catchment outlet, where the topography was lower.
Due to severe weather conditions, mostly heavy rainfall, the Sinai Peninsula receives a great deal of rain, which generates a lot of FF in the area. The impact of floods in south Sinai has increased in recent decades, and several researchers, including JICA (1999) [12], Youssef et al. (2011) [13], Nahla (2016) [14] and Maria et al. (2020) [15] have evaluated its impact values. The main cause of FF in the Sinai Peninsula is a short duration of rainfall accompanied by snowmelt runoff and a low infiltration capacity of the soil, among other factors, resulting in an increased overland flow even though total fall rainfall amounts in these areas are relatively small [16]. Awadallah et al. (2011) [17] developed the Intensity Duration Frequency (IDF) of a region in Angola’s north-west, using limited data from ground rainfall stations and TRMM data. Cools et al. (2012) [18] used the best available data to construct and assess an early warning system (EWS) for FF in Egypt’s Sinai Peninsula. According to the data, 90 percent of the entire rainfall volume was lost due to infiltration and transmission losses. Wahid et al. (2016) [19] used GIS to analyze the developed datasets for runoff and potential flash floods, as well as to visualize the spatial distribution of flood and runoff potential in the southwestern Sinai coastal plain. The study concluded that the slope and soil types are the two most important elements in determining runoff levels and FF potential.
According to the Intergovernmental Panel on CC (IPCC, 2013, 2014) [20,21] a significant variations for the regional temperature and precipitation from the global-scale pattern are projected (Christensen et al. 2013) [22]. Climate data from 1970 to 2014 revealed rapid CC in Egypt’s Sinai Peninsula, with decreased rainfall and rising average temperatures. For several years, this tendency resulted in severe droughts that were abruptly interrupted by high and erratic rainfall that varied greatly in locations and duration. Many plant and animal species’ population dynamics will also be badly impacted, with many of them being essential to residents [23]. The El-Qaa Plain in the Sinai Peninsula is a region that is constantly growing in population [24]. Mostafa et al. (2019) [25] estimated the future temperature and precipitation trends in Egypt for 2100 based on the past data from 1950 to 2017; the results showed that, in Northern Egypt, the projected patterns of annual precipitation have been reduction to 0.48 from 1.40 mm yr−1.
The current study was simulated using the Watershed Modeling System (WMS) to forecast the peak flooding in the desert of El-Qaa plain in Southwestern Sinai, Egypt, due to the impact of CC which affect the recurrence intervals for 2, 5, 10, 25, 50, and 100 years. The prediction of future hydrographs for peak discharge and volume will be estimated in the current study with the future recurrence intervals and rainfall depths. Also, the estimation of future flood volumes and depths will help in the development of this desert area which consider the only water resource for its people.
2. Materials and Methods
2.1. Wadi El-Aawag Watershed (Case Study Area)
The southwestern corner of the Sinai Peninsula contains the El-Qaa Plain, located between latitudes 28°15′, 28°45′ north and longitudes 33°20′, 34°00′ east and neighbouring the Gulf of Suez [26]. The watershed of Wadi El-Aawag (WEA) is considered one of the largest basins in the Gulf of Suez’s drainage system with an area of about 1960 km2. The watershed direction extends generally from north and northeast to southwest for about 58 km; the location of the current study is presented in Figure 1a. In addition, it debouches to the Gulf of Suez coastal plain, which is locally named Sahl El-Qaa. This plain stretches for around 3500 km2 along the southwest coast of Sinai. A test site was chosen in the Sinai Peninsula’s El-Qaa Plain as it falls under promising development zones in the Sinai Peninsula, particularly in terms of tourism. These opportunities have already resulted in a progressive growth in the number of people living in the area, as well as an extension of land exploitation [27,28].
WEA watershed’s geology is predominantly composed of Precambrian and Cambrian rocks. The Quaternary deposits (wadi deposits and undifferentiated deposits) occupy mainly the Sahl El-Qaa area (El-Qaa Plain), which is a promising area for groundwater reserves (see Figure 1b).
The hydrogeology of Sahl El-Qaa is drained by several watersheds (wadies), which originate from these granitic mountainous masses. These wadies are buried through different cycles of sedimentation and alluviation during the Quaternary times and become active during the rainy periods [29]. These various drainage networks play an important role in the water supply in the studied area.


Figure 1.
El-Aawag Watershed for (a) location map of the study area (Google earth 2022) and (b) geological map. (after, UNSECO 2004 [30]).
Figure 1.
El-Aawag Watershed for (a) location map of the study area (Google earth 2022) and (b) geological map. (after, UNSECO 2004 [30]).


2.2. Meteorological Data and Hydrological Frequency Analysis
The historical climate data are taken from the weather of El Tur station. The recorded Tmin, annual average temperature (°C); Tmax, annual average maximum temperature (°C); Taver, annual average; V, annual average wind speed (km hr−1); PT, total annual precipitation of snow (mm); RA, number of days with rain (-); Pmax, maximum daily rain or snow precipitation total annual (mm); and Paver, average annual rain or snow precipitation total annual (mm), are used in the current study.
Table 1 presents the annual rainfall at El Tur station from 1995 to 2021, with the maximum value reaching 70.10 mm in a day and 273.31 mm in a year. The data show that the trends of precipitation are variable in that it was increased in 2015 and 2017, also it was decreased from 2018 to 2020 and increased in 2021, which will affect the estimation of recurrence intervals and peak floods.

Table 1.
Historical climate data form weather of El Tur station.
The predicted values of precipitation for different recurrence intervals were estimated using the hydrological frequency analysis (hyfran-plus) software version-v2.1, which is available at this link (http://www.wrpllc.com/books/HyfranPlus/indexhyfranplus3.html accessed on 11 April 2022) for different distributions including exponential, GEV, Gumbel, Weibull, Normal, Gamma and Log-Pearson type III. The data were carried out by the best fitting using the exponential distribution, as shown in Figure 2. The predicted values of precipitation are 11, 26.40, 38.10, 53.50, 65.10, 76.80 and 88.40 mm for 2, 5, 10, 25, 50, 100 and 200 years. The following equation was used to estimate the rainfall frequency to reach 50%, 20%, 10%, 5%, 4%, 2% and 1% for the recurrence intervals of 2, 5, 10, 25, 50 and 100 years.
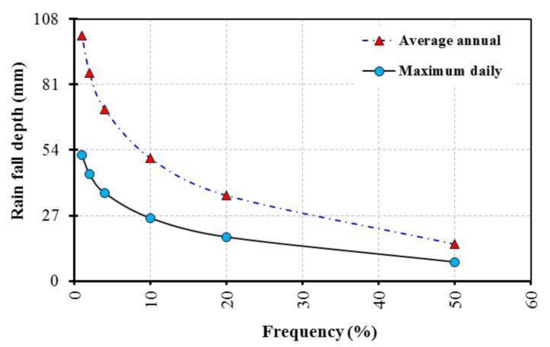
Figure 2.
Relation between rainfall depth and frequency for El Tor station.
The following equation was used to calculate the instantaneous rainfall intensity at any point during the storm duration:
where It = instantaneous rainfall intensity at time (t) from the storm start (mm h−1); Pt is the precipitation depth recorded at time (t) from the storm start (mm); and t is time passed from the storm start (min).
2.3. Watershed Modeling
The watershed modeling system (WMS) (https://www.aquaveo.com/downloads.wms accessed on 11 April 2022) was applied for the current study to delineate the stream flow and discharges based on the key geologic features and rock contacts. The model of the WEA watershed attains the 6th order (see Figure 3).
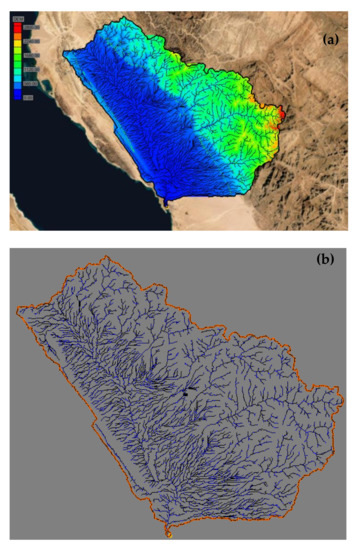
Figure 3.
Study area (a) digital elevation model and (b) watershed characteristics in the study area.
The drainage network of the study area was delineated using the WMS from Digital Elevation Model (DEM) with 30 m resolution (http://gdem.ersdac.jspacesystems.or.jp/search.JSP accessed on 11 April 2022). The losses for the watershed in the WMS were estimated using the SCS Curve Number (CN) method (Soil Conservation Service, 1972) [7]; this method considering the watershed for soil type, land cover and antecedent moisture condition.
SCS (1972) [7] developed the dimensionless UH method, which consists of the lag time (TL) in hr. The peak discharge was estimated using HEC-1 in the WMS based on UH, using the SCS method. The rainfall for the storm distribution was generated using the SCS type II which is applicable to rainfall stations where extreme storms last more than 3 hrs on average, and its distribution is suitable for deriving the 24-h time distribution during extreme events in many regions [17,31]. The WMS uses the time of concentration to estimate the lag time and compute peak flow and time to peak from the following equations used in the calculation of the main flood factors [32]:
where L is length of the overland flow in feet; S is average overland slope in ft/ft (-); Tc is the time of concentration in hours; Tr is storm duration (h); Tp is peak time (h); TL is lag time in hours; QP is peak discharge (m3 s−1); and A is the drainage area (km2). The lag time is the time from the centroid of the excess rainfall to the hydrograph peak, while the time of concentration, which is denoted as Tc, is defined as the time required for a particle of water to flow from the hydraulically most distant point in the watershed to the outlet or design point.
3. Results and Discussion
This section presents the rainfall analysis and the hydrology of the basin results due to the impact of CC on the watershed basin in high-stress regions.
3.1. Impact of the Recurrence Intervals on Rainfall Intensity
Figure 4 presents the intensity duration frequency (IDF) curve for the study area at different storm times of 0, 30, 60, 90 and 120 min and recurrence intervals of 2, 5, 10, 25, 50 and 100 years, respectively. These charts can be used for the design of protection structures and drainage systems for different predictions of storm time and rainfall depths.
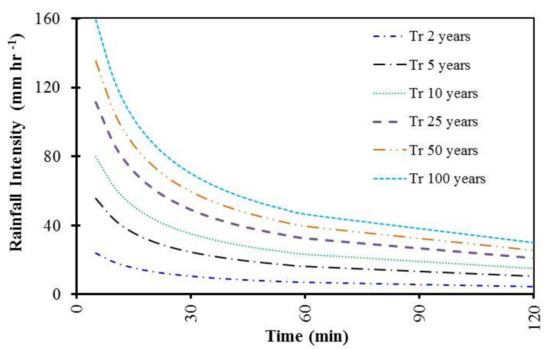
Figure 4.
IDF curve for the study area.
3.2. Estimation of a Watershed Hydrograph
The WMS results were presented in Table 1 for the differences between 2, 5, 10, 25, 50, 100 and 200 years.
3.2.1. The Peak Discharge Value
The results showed that the peak discharge reached 0, 0.44, 45.72, 195.45, 365.91 and 575.30 m3 s−1 at recurrence intervals of 2, 5, 10, 25, 50, and 100 years, with time to peak of 0, 2010, 1710, 1590, 1560 and 1530 min and precipitation of 15.20, 35.30, 50.60, 70.70, 85.90, and 101 mm, respectively, as shown in Figure 5. Moreover, the annual peak discharge reached 0 m3 s−1 at average annual precipitation of 13.37 mm; the 0 m3 s−1 value of runoff indicates that all precipitation goes as losses in the study area.
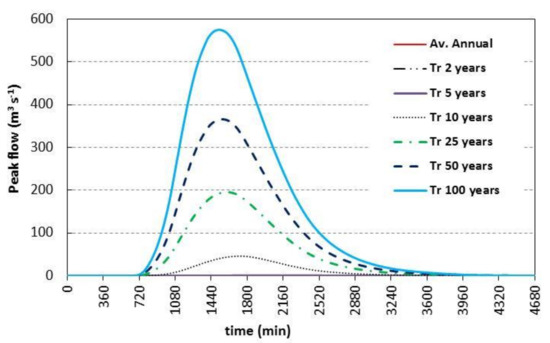
Figure 5.
Runoff discharge for W. El Aawag watershed for different recurrence interval.
3.2.2. The Flood Volume Value
The flood volume reached 0, 23,149.80, 2,896,241.40, 12,664,963.80 and 36,681,492.60 m3 at recurrence intervals of 2, 5, 10, 25, 50, and 100 years, respectively (see Figure 5). Additionally, the flood volume reached 0 at average annual precipitation of 13.37 mm, meaning all precipitation goes as losses, as presented in Table 2.
Table 2.
Runoff discharge for W. El Aawag watershed.
4. Discussion
Water resources for floods, droughts, severe summers, extreme heatwaves, mild cool weather occurrences, storms and other extreme weather events are all caused by CC [33,34,35]. Drought ranks top among CC-induced natural hazards in terms of the impact on the livelihood of the community [25,36,37,38]. Droughts are one of nature’s most harmful and destructive events. A drought is defined as a time when an area or region receives insufficient or below-normal precipitation. Reduced soil moisture, as well as surface and groundwater storages, are the results. A meteorological drought is defined as a scenario in which rainfall falls below 75% of the climatological normal in a certain area [39]. Increased warmth, water stress, the frequency of El Nino occurrences and the absence of available moisture in the sky all cause precipitation to decrease, resulting in fewer rainy days and more droughts, particularly in arid and semi-arid agro-ecologies [40,41]. Droughts have dramatically affected crop productivity and the quality of pastoral ecosystems in arid and semi-arid areas. Reduced and uneven rainfall during the monsoon season causes crop failure in early-season droughts and production losses in mid-season and late-season droughts in arid and semi-arid regions, according to reports [42,43].
From the analysis of rainfall at El Tur stations from 1995 to 2021 using Hyfran-plus software, the results showed the depths of predicted precipitation as 15.20, 35.30, 50.60, 70.70, 85.90 and 101 mm, respectively, at recurrence intervals of 2, 5, 10, 25, 50 and 100 years with an annual depth of 13.37mm. The rainfall intensity was also estimated at different duration of the storms. Moreover, the WMS results showed that the flood volume reached 0, 23149.80, 2,896,241.40, 12,664,963.80 and 36,681,492.60 m3 and the peak discharge reached 0, 0.44, 45.72, 195.45, 365.91 and 575.30 m3 s−1 at the recurrence intervals of 2, 5, 10, 25, 50 and 100 years, respectively. The average annual yearly discharge and volume reached 0 m3 s−1 and 0 m3, respectively. Figure 6 showed the relation between the predicted precipitation depths and hydrograph volume and discharge in the study area. Furthermore, Equation (6) is useful to get the predicted hydrograph volume while the Equation (7) estimates the predicted discharge in the study area at diffrent depths of precipitation that is will change due to CC for drought.
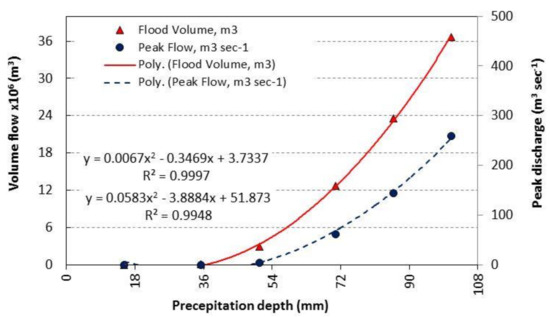
Figure 6.
Relation between the projection precipitation depths and watershed hydrograph.
Modrick et al. (2015) [44] showed that the increasing in FF occurrences for the mountainous in small basins of Southern California due to projected CC between 30% and 40%. Overall, a decrease in the total number of precipitation events was found, although with increased precipitation intensity, increased event duration and higher soil saturation conditions for the 21st century. This combination could signify more hazardous conditions, with fewer precipitation events but higher rainfall intensity and over soils with higher initial soil moisture saturation, leading to the more frequent occurrence of FF. Esposito et al. (2018) [45] showed that increased frequency of FF events occurred on the coastline of the Campi Flegrei Volcanic Area, Italy. The variation in FF frequency is likely not related to urbanization changes, as no increase in the urban area occurred after the year 2000. The observed increase of FF events in recent years (2000–2014) can be reasonably ascribed to variations in the rainfall regime. Ragettli et al. (2021) [46] studied the impact of CC on summer flood frequencies in two mountainous catchments in China and Switzerland. The study recalibrated the weather generator with the climate statistics for 2021–2050 which it obtained from ensembles of bias-corrected regional climate models. Across all assessed return periods (10–100 years) and two emission scenarios, nearly all model chains indicate an intensification of flood extremes. According to the ensemble averages, the potential flood magnitudes increase by more than 30% in both catchments.
5. Conclusions
Water resources in desert regions are highly sensitive to CC, water demand and FF. The current study was developed in the desert of El-Qaa plain in Southwestern Sinai, Egypt, using the watershed modeling system software (WMS) to study the influence of CC considering different recurrence intervals of 2, 5, 10, 25, 50, 100 and 200 years. The results showed that the flood volume reached 0, 23,149.80, 2,896,241.40, 12,664,963.80 and 36,681,492.60 m3 while the peak discharge reached 0, 0.44, 45.72, 195.45, 365.91 and 575.30 m3 s−1 at recurrence intervals of 2, 5, 10, 25, 50 and 100 years, respectively. The annual volume and discharge reached 0 m3 and m3/s, respectively.
The prediction results of FF hazards for figures and equations at different recurrence intervals are useful for the decision-makers and engineers to consider in the future planning, development and design of rainwater harvesting and protection structures to keep the people living and safe in this desert area. Moreover, the study recommends estimating the sediment transport volume due to the influence of recurrence intervals under CC in desert regions around the world.
Author Contributions
Conceptualization I.A.-E., H.S. and O.W.E.-D.; methodology, H.S., I.A.-E. and O.W.E.-D.; software, H.S., I.A.-E.; validation, H.S., I.A.-E. and O.W.E.-D.; formal analysis, H.S., I.A.-E. and O.W.E.-D.; investigation, H.S., I.A.-E. and O.W.E.-D.; resources H.S., I.A.-E. and O.W.E.-D.; data curation, H.S., I.A.-E. and O.W.E.-D.; writing—original draft preparation, H.S.; writing—review and editing, H.S., I.A.-E., O.W.E.-D., N.L.K. and M.Z.; visualization H.S., I.A.-E., O.W.E.-D., N.L.K. and M.Z.; supervision I.A.-E., O.W.E.-D., N.L.K. and M.Z.; project administration, M.Z.; funding acquisition, M.Z. All authors have read and agreed to the published version of the manuscript.
Funding
This work was supported by the Slovak Research and Development Agency under the Contract no. APVV-20-0281 a project funded by the Ministry of Education of the Slovak Republic. This work was supported by project of the Ministry of Education of the Slovak Republic VEGA 1/0308/20 Mitigation of hydrological hazards, floods and droughts by exploring extreme hydroclimatic phenomena in river basins.
Data Availability Statement
Not applicable.
Acknowledgments
The authors wish to express their sincere appreciation to the Department of Water and Water Structures Engineering, Faculty of Engineering, Zagazig University Egypt, for the instruments and software facilities.
Conflicts of Interest
The authors declare no conflict of interest.
References
- Alderman, K.; Turner, L.R.; Tong, S. Floods and human health: A systematic review. Environ. Int. 2012, 47, 37–47. [Google Scholar] [CrossRef] [PubMed]
- Hall, J.; Arheimer, B.; Borga, M.; Brázdil, R.; Claps, P.; Kiss, A.; Kjeldsen, T.R.; Kriaučiūnienė, J.; Kundzewicz, Z.W.; Lang, M.; et al. Understanding flood regime changes in Europe: A state-of-the-artassessment. Hydrol. Earth Syst. Sci. 2014, 18, 2735–2772. [Google Scholar] [CrossRef]
- Abd-Elaty, I.; Straface, S.; Kuriqi, A. Sustainable Saltwater Intrusion Management in Coastal Aquifers under Climatic Changes for Humid and Hyper-Arid Regions. Ecol. Eng. 2021, 171, 106382. [Google Scholar] [CrossRef]
- El-Fakharany, M.A.; Mansour, N.M. Morphometric analysis and FF hazards assessment for Wadi Al Aawag drainage Basins, southwest Sinai, Egypt. Environ. Earth Sci. 2021, 80, 168. [Google Scholar] [CrossRef]
- EL-Nefary, I.F. Storm Water Hydrological Modeling for Arid and Semi-Arid Regions (Case Study: Wadi Sudr—Sinai). Ph.D. Thesis, Faculty of Engineering, Zagazig University, Hong Kong, China, 2014. [Google Scholar]
- El Afandi, G.; Morsy, M.; El Hussieny, F. Heavy Rainfall Simulation over Sinai Peninsula Using the Weather Research and Forecasting Model. Int. J. Atmos. Sci. 2013, 2013, 11. [Google Scholar] [CrossRef]
- Soil Conservation Service (SCS). Snow Survey and Water Supply Forecasting, National Engineering Handbook; Section 22; Soil Conservation Service: Washington, DC, USA, 1972.
- Smemoe, C.M.; Nelson, E.J.; Zhao, B. Spatial averaging of land use and soil properties to develop the physically-based Green and Ampt parameters for HEC-1. Environ. Model. Softw. 2004, 19, 525–535. [Google Scholar] [CrossRef]
- Chahinian, N.; Moussa, R.; Andrieux, P.; Voltz, M. Comparison of infiltration models to simulate flood events at the field scale. J. Hydrol. 2005, 306, 191–214. [Google Scholar] [CrossRef]
- Jena, S.; Tiwari, K. Modeling synthetic unit hydrograph parameters with geomorphologic parameters of watersheds. J. Hydrol. 2006, 319, 1–14. [Google Scholar] [CrossRef]
- Garambois, P.-A.; Larnier, K.; Roux, H.; Labat, D.; Dartus, D. Analysis of flash flood-triggering rainfall for a process-oriented hydrological model. Atmos. Res. 2014, 137, 14–24. [Google Scholar] [CrossRef]
- Japan International Cooperation Agency (JICA). South Sinai Groundwater Resources Study in the Arab Republic of Egypt, Main Report Submitted to the Water Resources Research Institute, Ministry of Public Works and Water Resources, Cairo, Egypt; JICA: Tokyo, Japan, 1999.
- Youssef, A.M.; Pradhan, B.; Hassan, A.M. Flash flood risk estimation along the St. Katherine road, southern Sinai, Egypt using GIS based morphometry and satellite imagery. Environ. Earth Sci. 2011, 62, 611–623. [Google Scholar] [CrossRef]
- Nahla, A.M. Assessment of the rainfall storm events of events of January 2010 and March 2014 for the catchment modeling of Wadi El Arish and Wadi Wardan basins, Sinai Egypt. Egypt. J. Desert Res. 2016, 66, 137–168. [Google Scholar] [CrossRef][Green Version]
- Maria, P.; Adel, O.; Dietrich, S.; Abdou, A. Vulnerability assessment of FF in Wadi Dahab Basin, Egypt. Environ. Earth Sci. 2020, 79, 114. [Google Scholar] [CrossRef]
- Alrikabi, A.; Elmewafey, M.; Beshr, A.; Elnaggar, A.A. Using GIS based morphometry estimation of flood hazard impacts on desert roads in South Sinai, Egypt. Int. J. Sci. Eng. Res. 2015, 6, 1593–1599. [Google Scholar]
- Awadallah, A.G.; Younan, N.S. Conservative design rainfall distribution for application in arid regions with sparse data. J. Arid. Environ. 2012, 79, 66–75. [Google Scholar] [CrossRef]
- Cools, J.; Vanderkimpen, P.; El Afandi, G.; Abdelkhalek, A.; Fockedey, S.; El Sammany, M.; Abdallah, G.; El Bihery, M.; Bauwens, W.; Huygens, M. An early warning system for FF in hyper-arid Egypt. Nat. Hazards Earth Syst. Sci. 2012, 12, 443–457. [Google Scholar] [CrossRef]
- Wahid, A.; Marguerite, M.; Fikry, K.; Ibtehal, F. Geospatial analysis for the determination of hydro-morphological characteristics and assessment of flash flood potentiality in arid coastal plains: A case in Southwestern Sinai, Egypt. Earth Sci. Res. J. 2016, 20, E1–E9. [Google Scholar] [CrossRef]
- IPCC. Climate Change 2013: The Physical Science Basis. In Contribution of Working Group I to the Fifth Assessment Report of the Intergovernmental Panel on Climate Change; Stocker, T.F., Qin, D., Plattner, G.-K., Tignor, M., Allen, S.K., Boschung, J., Nauels, A., Xia, Y., Bex, V., Midgley, P.M., Eds.; Cambridge University Press: Cambridge, UK; New York, NY, USA, 2013; p. 1535. [Google Scholar]
- IPCC. Climate Change 2014: Synthesis Report. In Contribution of Working Groups I, II and III to the Fifth Assessment Report of the Intergovernmental Panel on Climate Change; Pachauri, R.K., Meyer, L.A., Eds.; IPCC: Geneva, Switzerland, 2014; p. 151. [Google Scholar]
- Christensen, J.H.; Kumar, K.K.; Aldrian, E.; An, S.-I.; Cavalcanti, I.F.A.; de Castro, M.; Dong, W.; Goswami, P.; Hall, A.; Kanyanga, J.K.; et al. Climate Phenomena and their Relevance for Future Regional Climate Change; Cambridge University Press: Cambridge, UK, 2013. [Google Scholar]
- Dadamouny, M.A.; Schnittler, M. Trends of climate with rapid change in Sinai, Egypt. J. Water Clim. Chang. 2015, 7, 393–414. [Google Scholar] [CrossRef]
- Morsy, M.; Scholten, T.; Michaelides, S.; Borg, E.; Sherief, Y.; Dietrich, P. Comparative Analysis of TMPA and IMERG Precipitation Datasets in the Arid Environment of El-Qaa Plain, Sinai. Remote Sens. 2021, 13, 588. [Google Scholar] [CrossRef]
- Mostafa, A.N.; Wheida, A.; Nazer, M.E.; Adel, M.; Leithy, L.E.; Siour, G.; Coman, A.; Borbon, A.; Magdy, A.W.; Omar, M.; et al. Past (1950–2017) and future (−2100) temperature and precipitation trends in Egypt. Weather. Clim. Extrem. 2019, 26, 100225. [Google Scholar] [CrossRef]
- Sayed, M.A.A.; El-Fakharany, M.A.; Hamed, M.F. Integrated geophysical and hydrogeological studies on the Quaternary aquifer at the middle part of El Qaa plain, SW Sinai, Egypt. Egypt. Geophys. Soc. J. 2004, 2, 135–145. [Google Scholar]
- EL-Refai, A.A. Water Resources of Southern Sinai, Egypt. Geomorphological and Hydrogeological Studies. Ph.D. Thesis, Faculty of Science, University of Cairo, Giza, Egypt, 1992; p. 357. [Google Scholar]
- El-Fakharany, M.A. Geophysical and hydrogeochemical investigations of the Quaternary aquifer at the middle part of El Qaa Plain SW Sinai, Egypt. Egypt. J. Geol. 2016, 47, 1003–1022. [Google Scholar]
- Hammad, F.A. Geomorphological and Hydrogeological Aspects of Sinai Peninsula, A.R.E. 1980. Available online: https://pascal-francis.inist.fr/vibad/index.php?action=getRecordDetail&idt=PASCALGEODEBRGM8320208437 (accessed on 11 April 2022).
- UNSECO Cairo Office. Geologic Map of Sinai, Egypt, Scale 1:500,000, Project for the Capacity Building of the Egyptian Geological Survey and Mining Authority and the National Authority Forremote Sensing and Space Science in Cooperation with UNDP and UNESCO, Geological Survey of Egypt; UNESCO: Paris, France, 2004. [Google Scholar]
- Howard, W.; Soroosh, S.; Sharma, K.D. Hydrological Modelling in Arid and Semi-Arid Areas; Cambridge University Press: Cambridge, UK, 2008. [Google Scholar]
- US Army Corps of Engineers (USACE). Hydrologic Modeling System HEC-HMS Technical Reference Manual; Hydrologic Engineering Center: Davis, CA, USA, 2000. [Google Scholar]
- Abd-Elaty, I.; Zelenakova, M.; Straface, S.; Vranayová, Z.; Abu-hashim, M. Integrated Modelling for Groundwater Contamination from Polluted Streams Using New Protection Process Techniques. Water 2019, 11, 2321. [Google Scholar] [CrossRef]
- Abd-Elaty, I.; Pugliese, L.; Zelenakova, M.; Mesaros, P.; Shinawi, A.E. Simulation-Based Solutions Reducing Soil and Groundwater Contamination from Fertilizers in Arid and Semi-Arid Regions: Case Study the Eastern Nile Delta, Egypt, 2020. Int. J. Environ. Res. Public Health 2020, 17, 9373. [Google Scholar] [CrossRef] [PubMed]
- Swaminathan, M.S.; Kesavan, P.C. Agricultural research in an era of climate change. Agric. Res. 2012, 1, 3–11. [Google Scholar] [CrossRef]
- Lal, R. Carbon management in agricultural soils. Mitig. Adapt. Strateg. Glob. Chang. 2007, 12, 303–322. [Google Scholar] [CrossRef]
- Abd-Elaty, I.; Shahawy, A.E.L.; Santoro, S.; Curcio, E.; Straface, S. Effects of groundwater abstraction and desalination brine deep injection on a coastal aquifer. Sci. Total Environ. 2021, 795, 148928. [Google Scholar] [CrossRef]
- Abd-Elaty, I.; Kushwaha, N.L.; Mark, E.G.; Elbeltagi, A.; Kuriq, A. Cost-effective management measures for coastal aquifers affected by saltwater intrusion and climate change. Sci. Total Environ. 2022, 836, 155656. [Google Scholar] [CrossRef]
- Bana, R.S.; Rana, K.S.; Choudhary, A.K.; Pooniya, V. Agricultural drought and its mitigation strategies. IFFCO Found. Bull. 2014, 2, 12–26. [Google Scholar]
- IPCC. Climate Change and Land: An IPCC Special Report on Climate Change, Desertification, Land Degradation, Sustainable Land Management, Food Security, and Greenhouse Gas Fluxes in Terrestrial Ecosystems. 2019. Available online: https://www.ipcc.ch/srccl (accessed on 2 September 2020).
- Zeleňáková, M.; Jothiprakash, V.; Arjun, S.; Káposztásová, D.; Hlavatá, H. Dynamic Analysis of Meteorological Parameters in Košice Climatic Station in Slovakia. Water 2018, 10, 702. [Google Scholar] [CrossRef]
- Kubiak-Wójcicka, K.; Nagy, P.; Zeleňáková, M.; Hlavatá, H.; Abd-Elhamid, H.F. Identification of Extreme Weather Events Using Meteorological and Hydrological Indicators in the Laborec River Catchment, Slovakia. Water 2021, 13, 1413. [Google Scholar] [CrossRef]
- FAO. The State of the World’s Land and Water Resources for Food and Agriculture (SOLAW)-Managing Systems at Risk; FAO: Rome, Italy, 2011. [Google Scholar]
- Modrick, M.T.; Georgakakos, K.P. The character and causes of flash flood occurrence changes in mountainous small basins of Southern California under projected climatic change. J. Hydrol. Reg. Stud. 2015, 3, 312–336. [Google Scholar] [CrossRef][Green Version]
- Esposito, G.; Matano, F.; Scepi, G. Analysis of Increasing Flash Flood Frequency in the Densely Urbanized Coastline of the Campi Flegrei Volcanic Area, Italy. Front. Earth Sci. 2018, 6, 63. [Google Scholar] [CrossRef]
- Ragettli, S.; Tong, X.; Zhang, G.; Wang, H.; Zhang, P.; Stähli, M. Climate change impacts on summer flood frequencies in two mountainous catchments in China and Switzerland. Hydrol. Res. 2021, 52, 4–25. [Google Scholar] [CrossRef]


Publisher’s Note: MDPI stays neutral with regard to jurisdictional claims in published maps and institutional affiliations. |
© 2022 by the authors. Licensee MDPI, Basel, Switzerland. This article is an open access article distributed under the terms and conditions of the Creative Commons Attribution (CC BY) license (https://creativecommons.org/licenses/by/4.0/).