
The Effects of Meteorological Factors on Dengue Cases in Malaysia

 , , ,
, , , 
Abstract
:1. Introduction
2. Materials and Methods
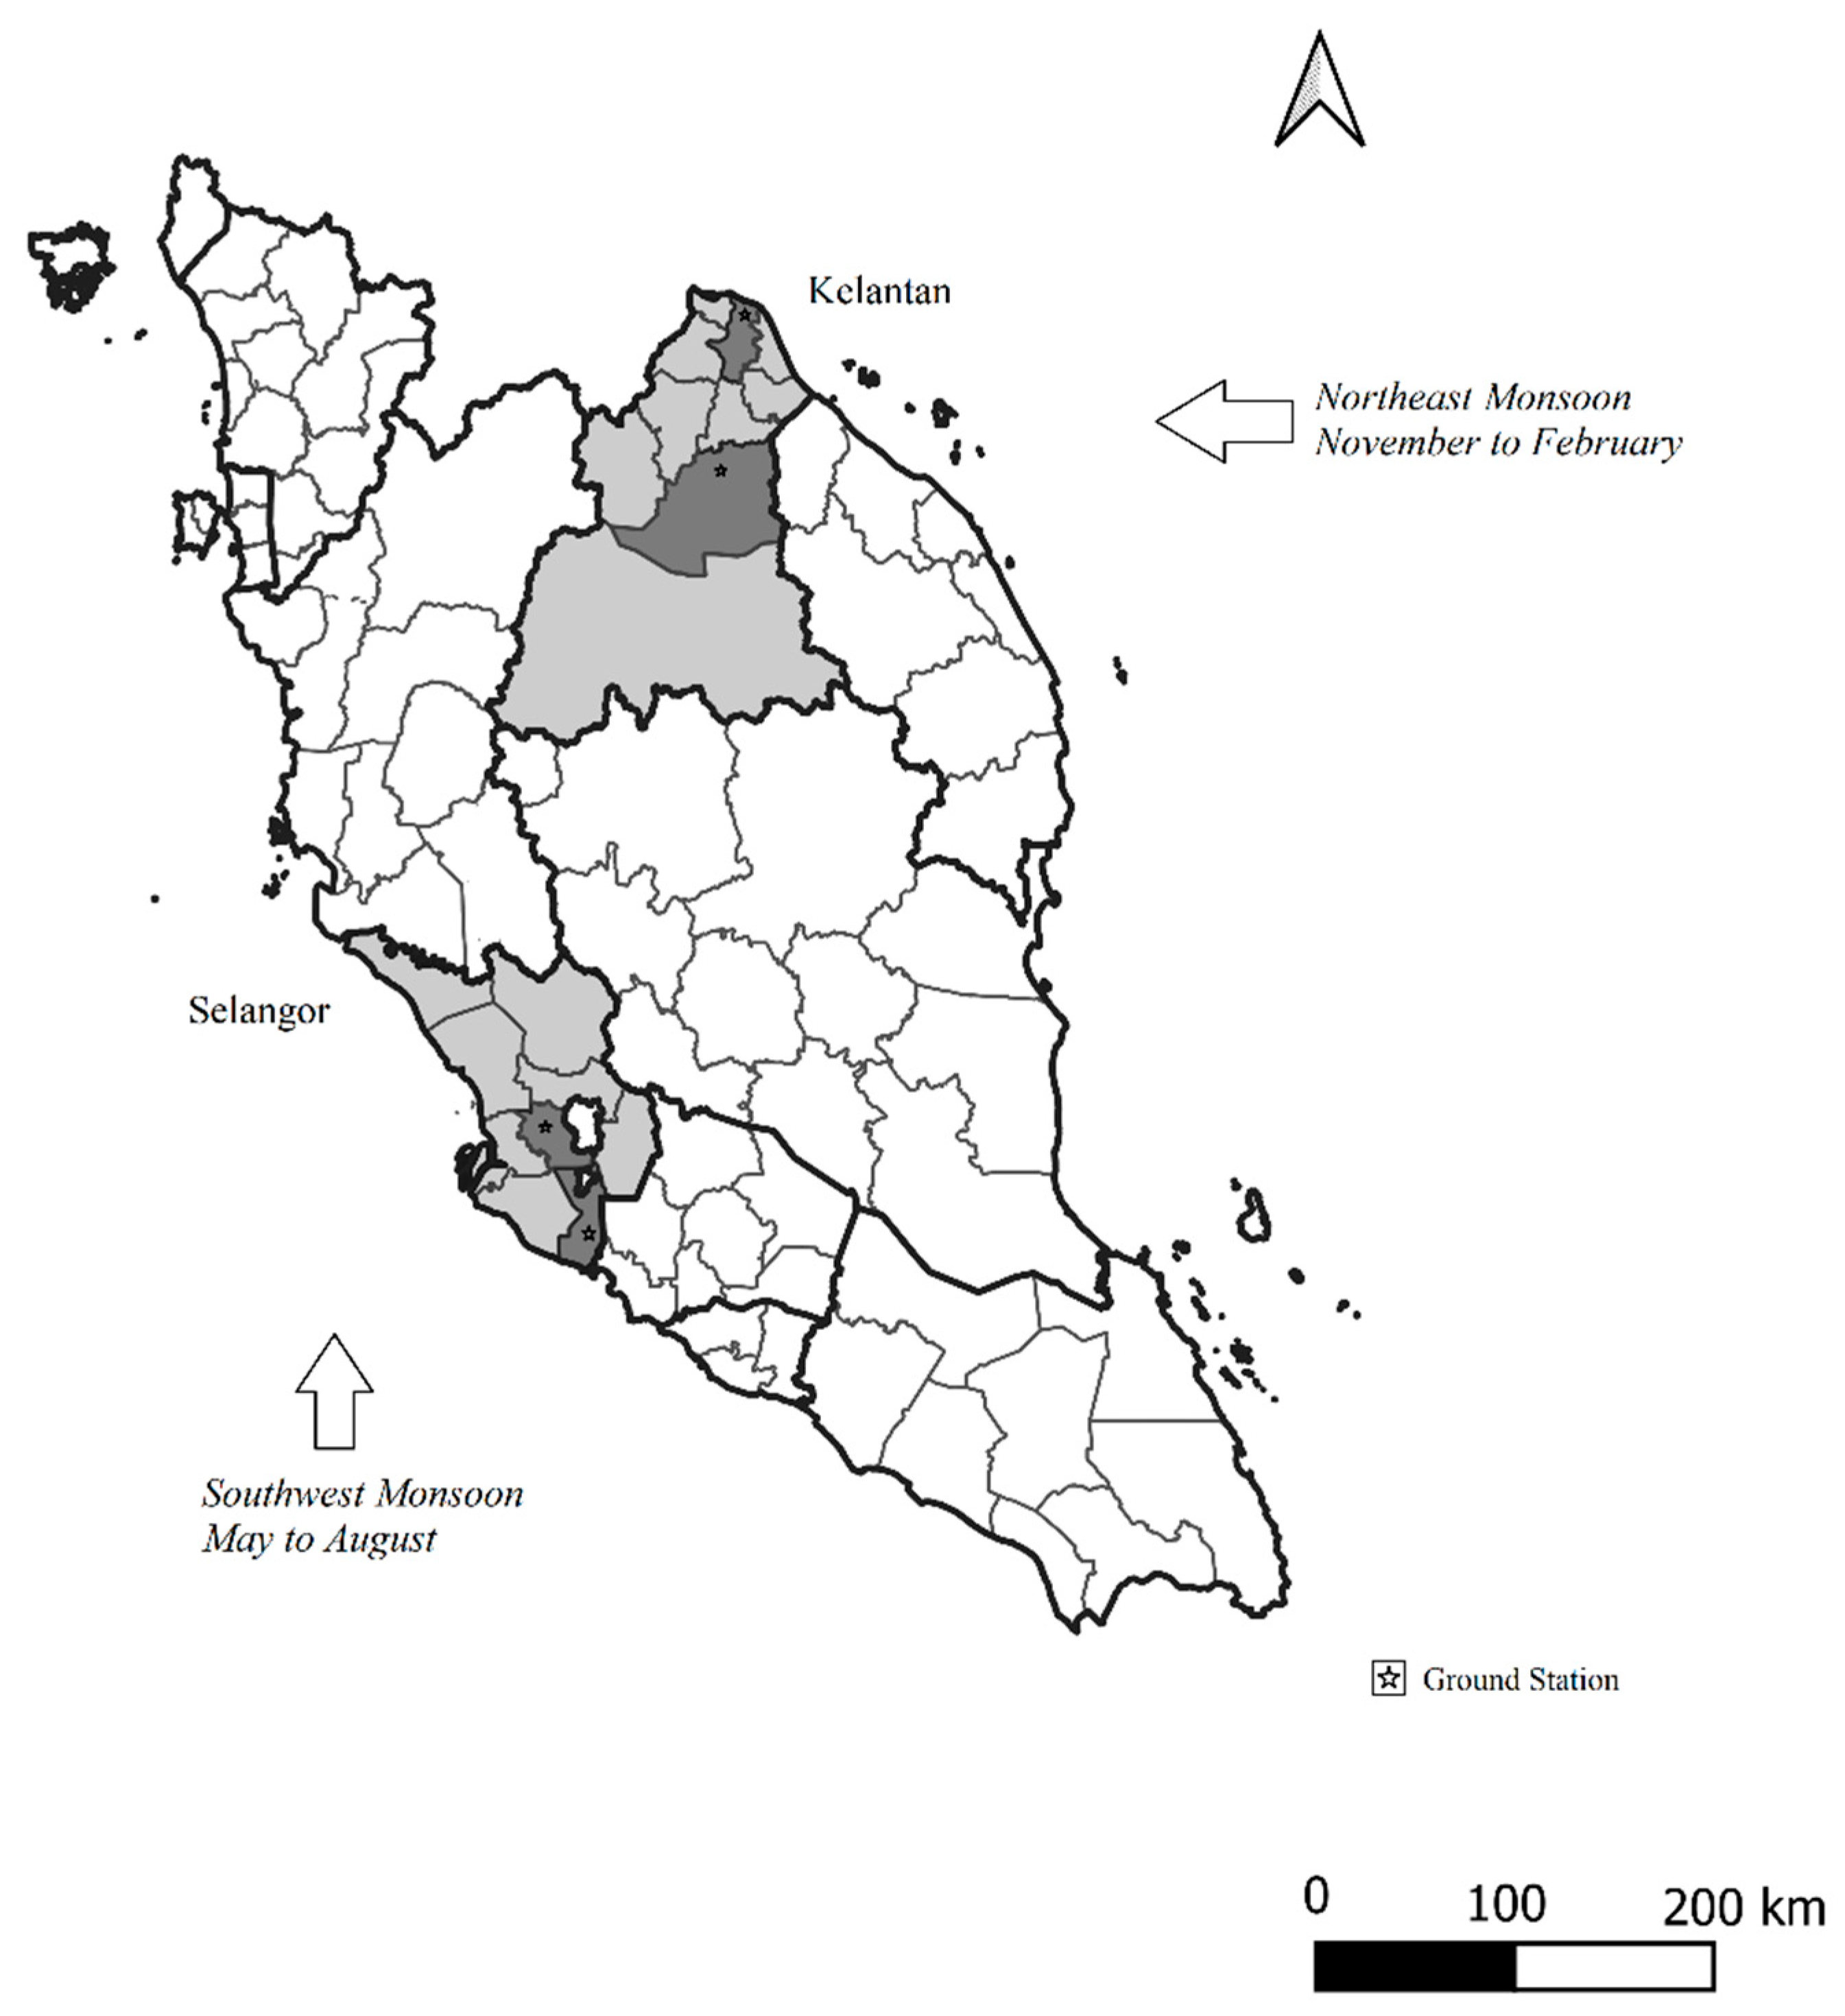
2.1. Study Location
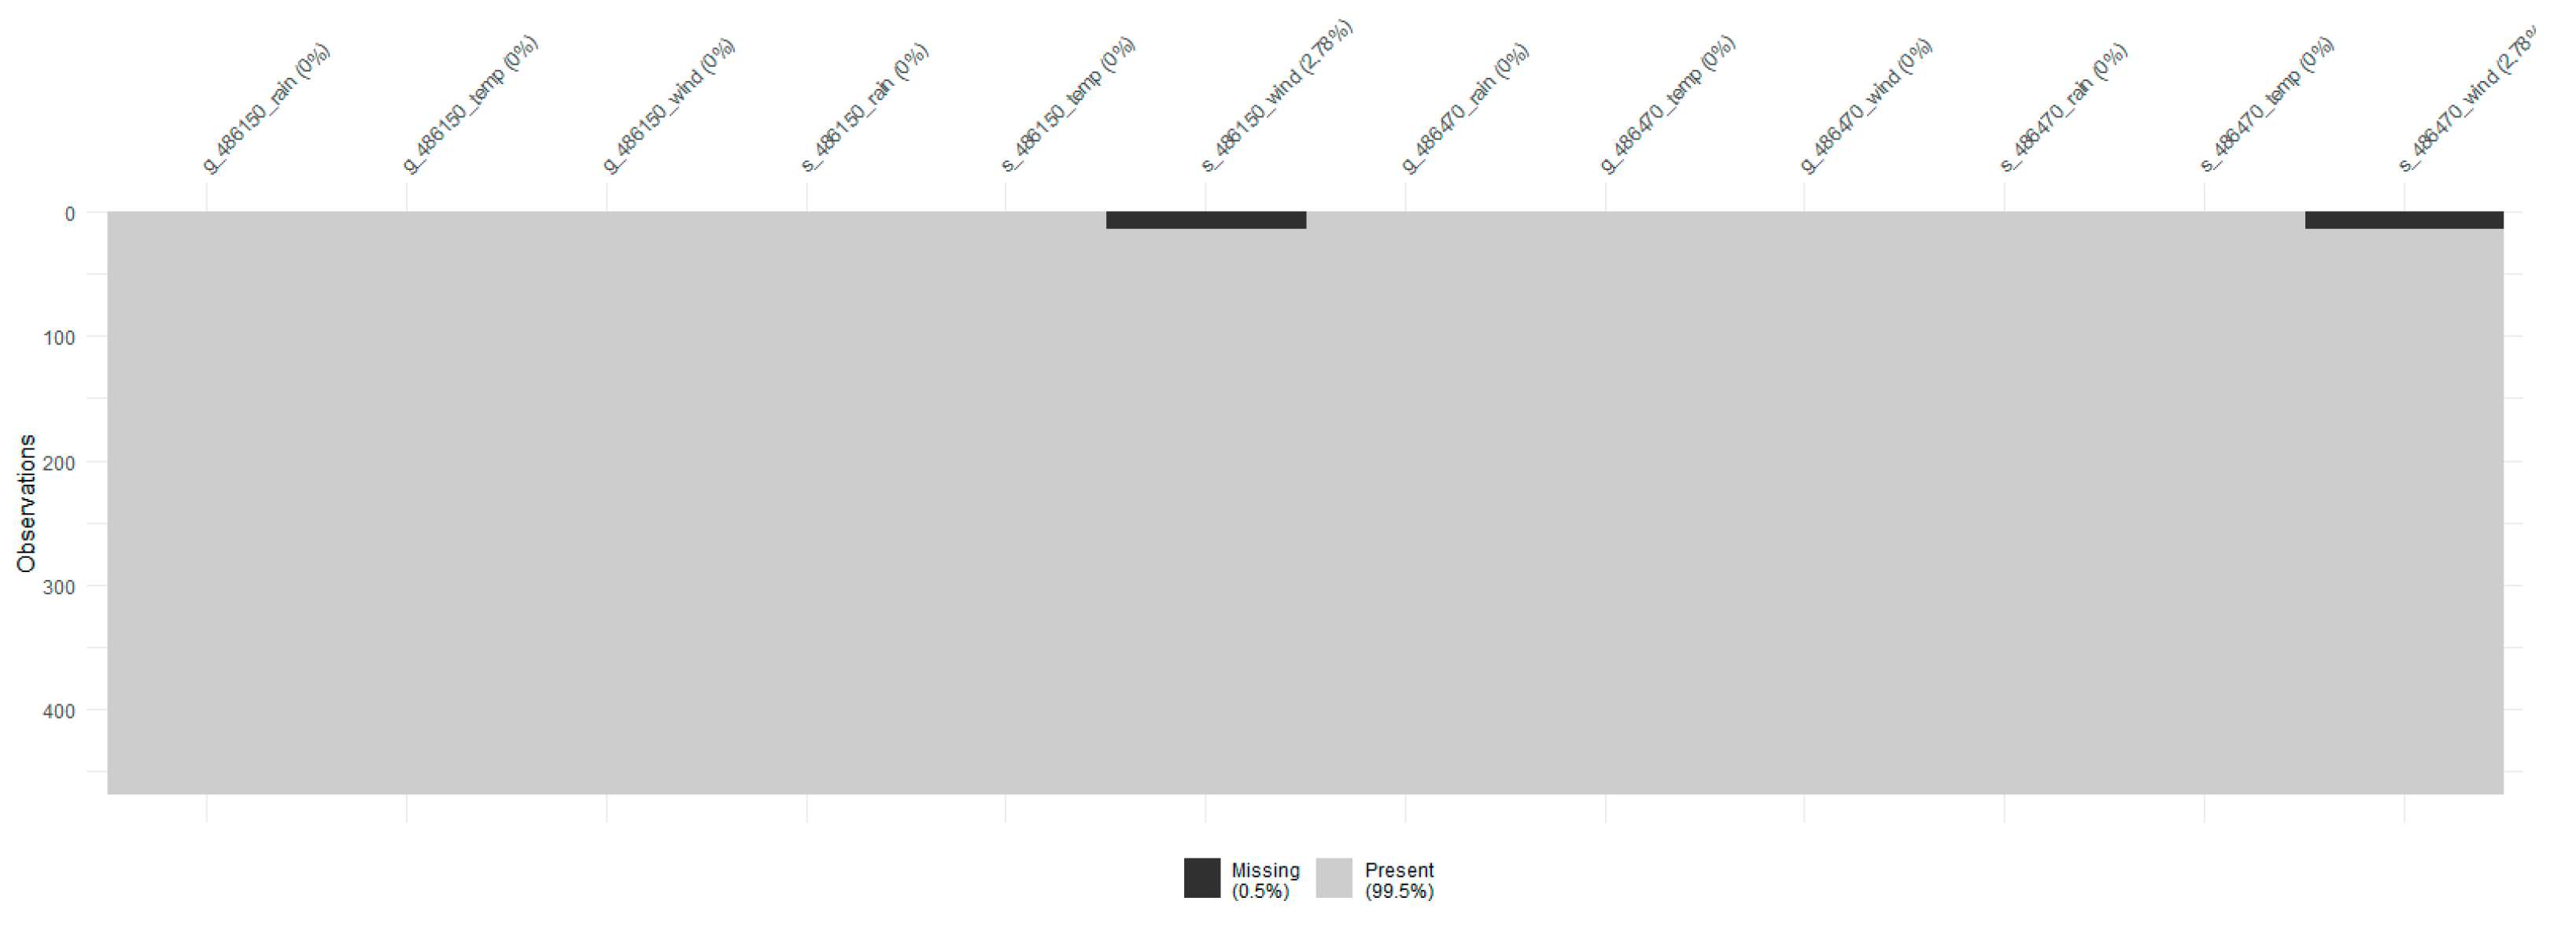
2.2. Study Data
- (a)
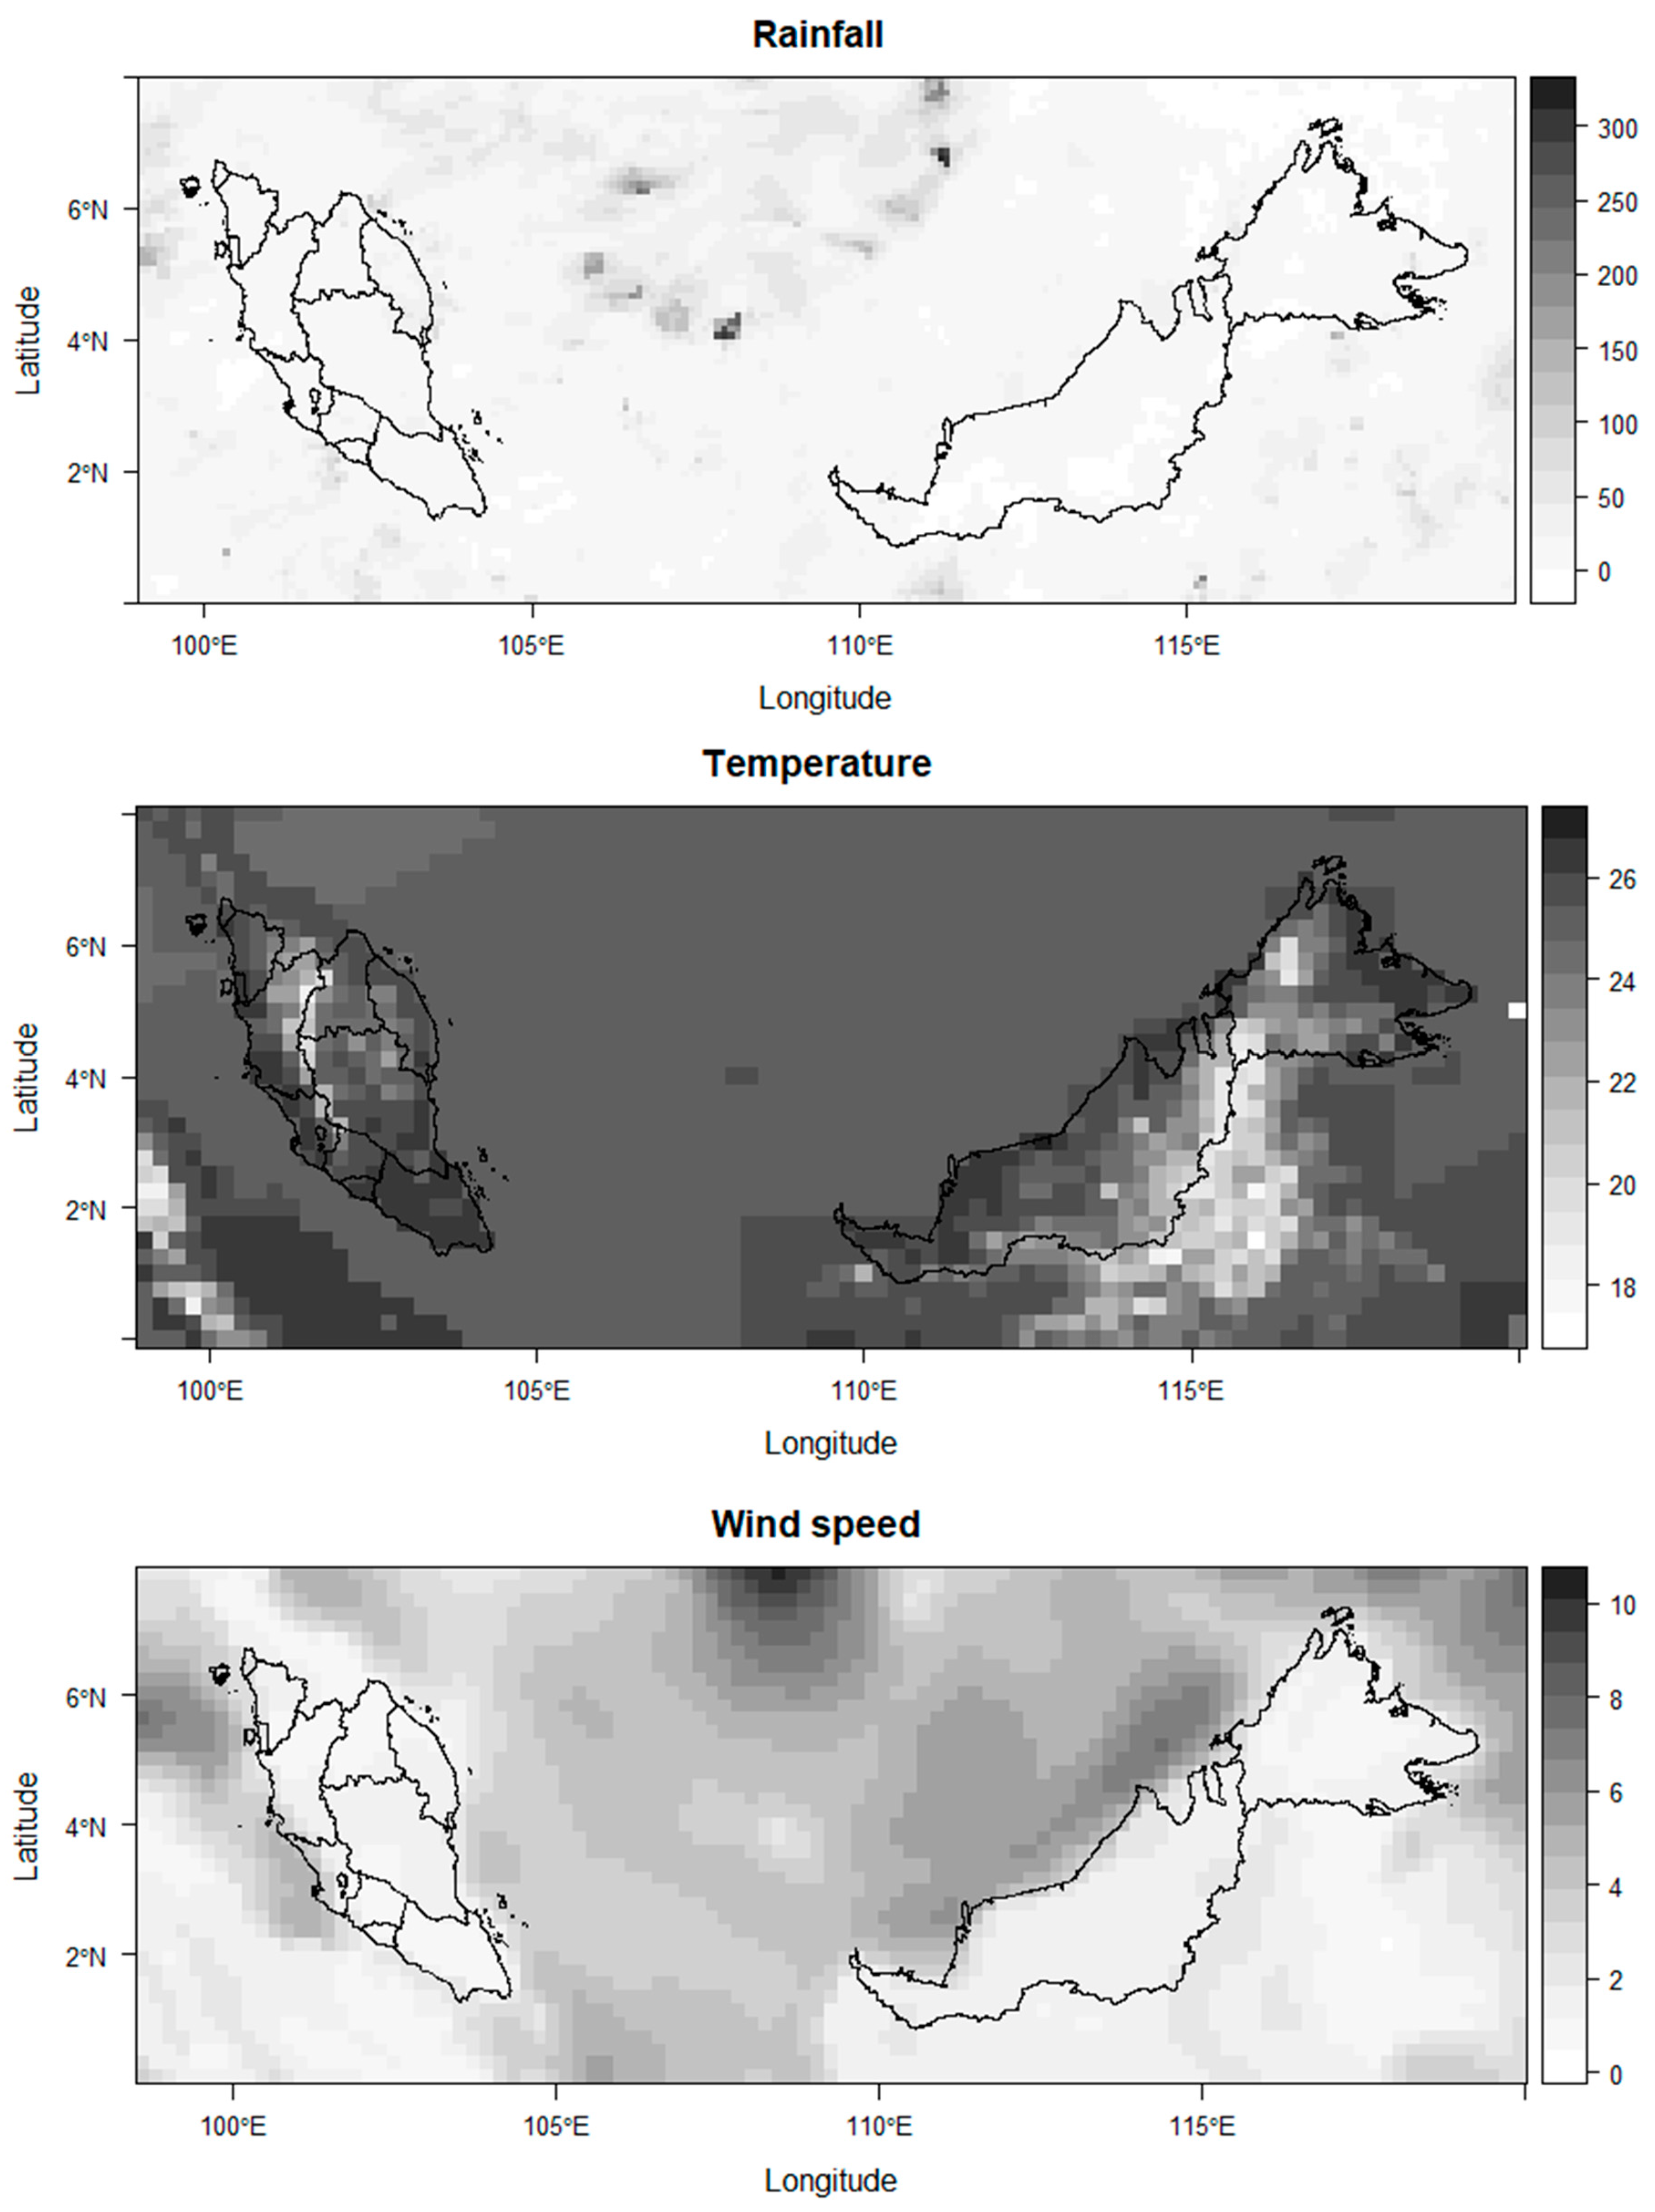
- EO-based meteorological data
- (b)
- Ground-based station meteorological data
- (c)
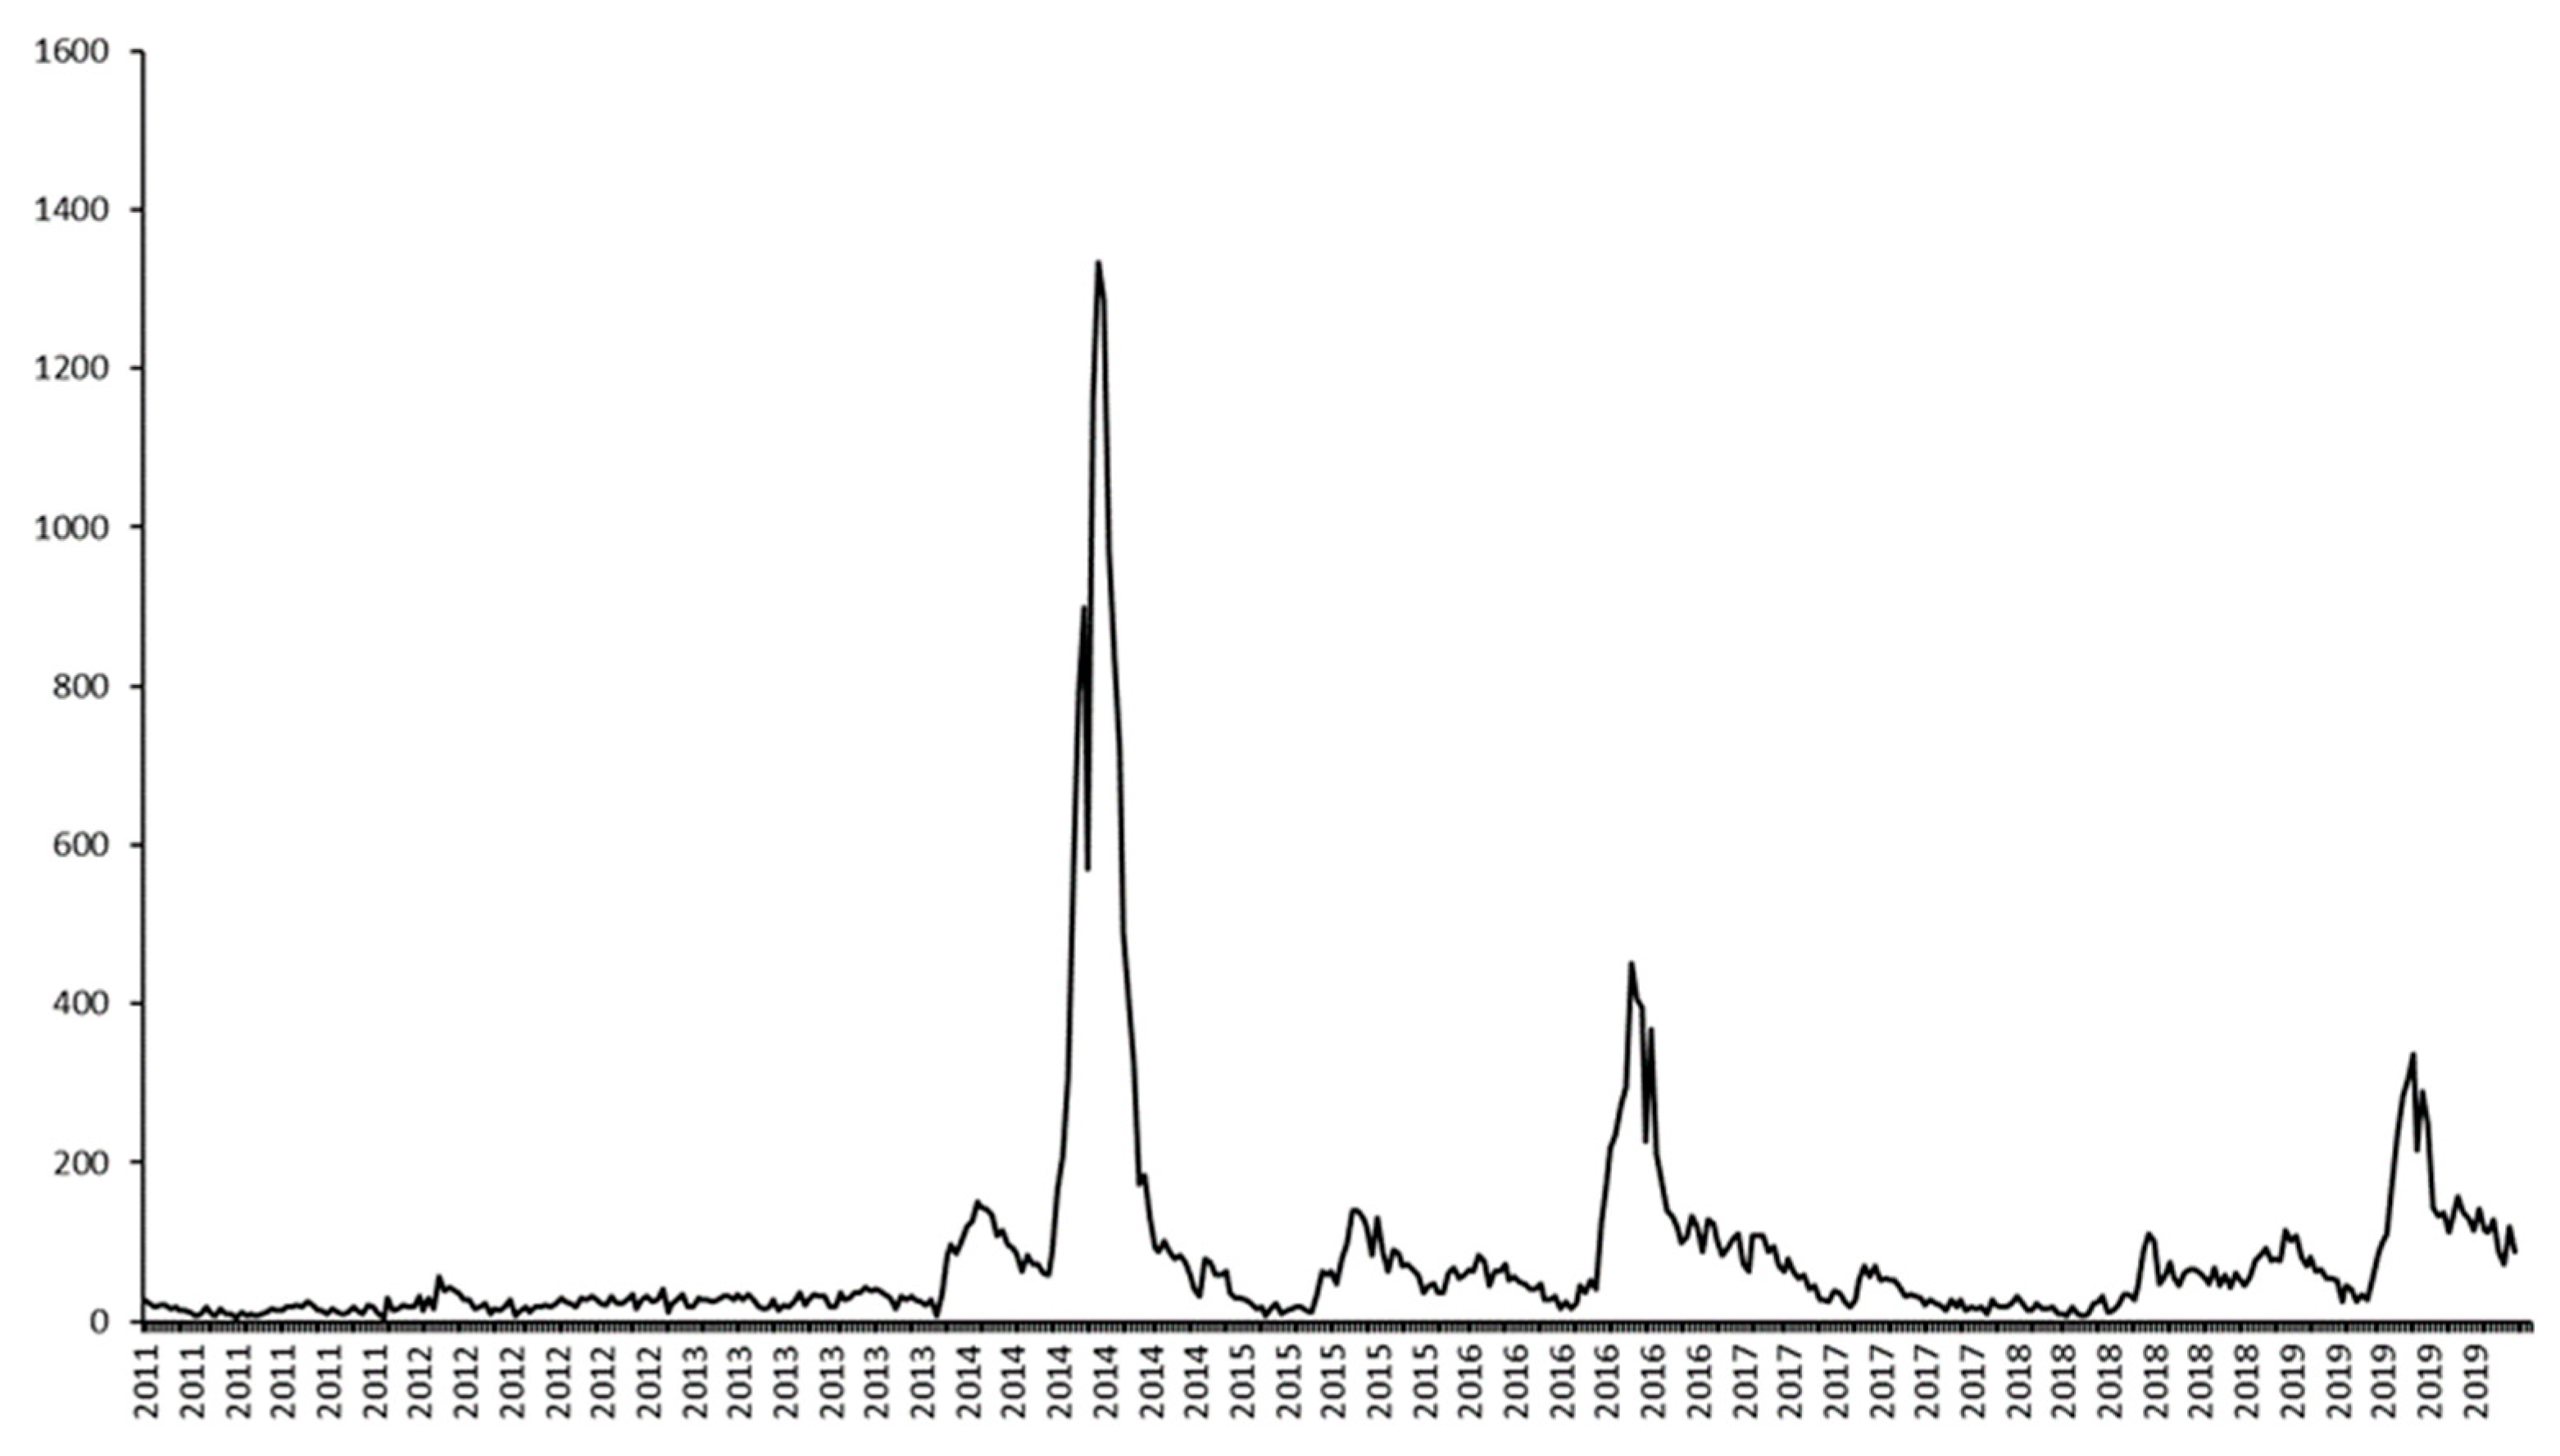
- Dengue case data
2.3. Data Analysis
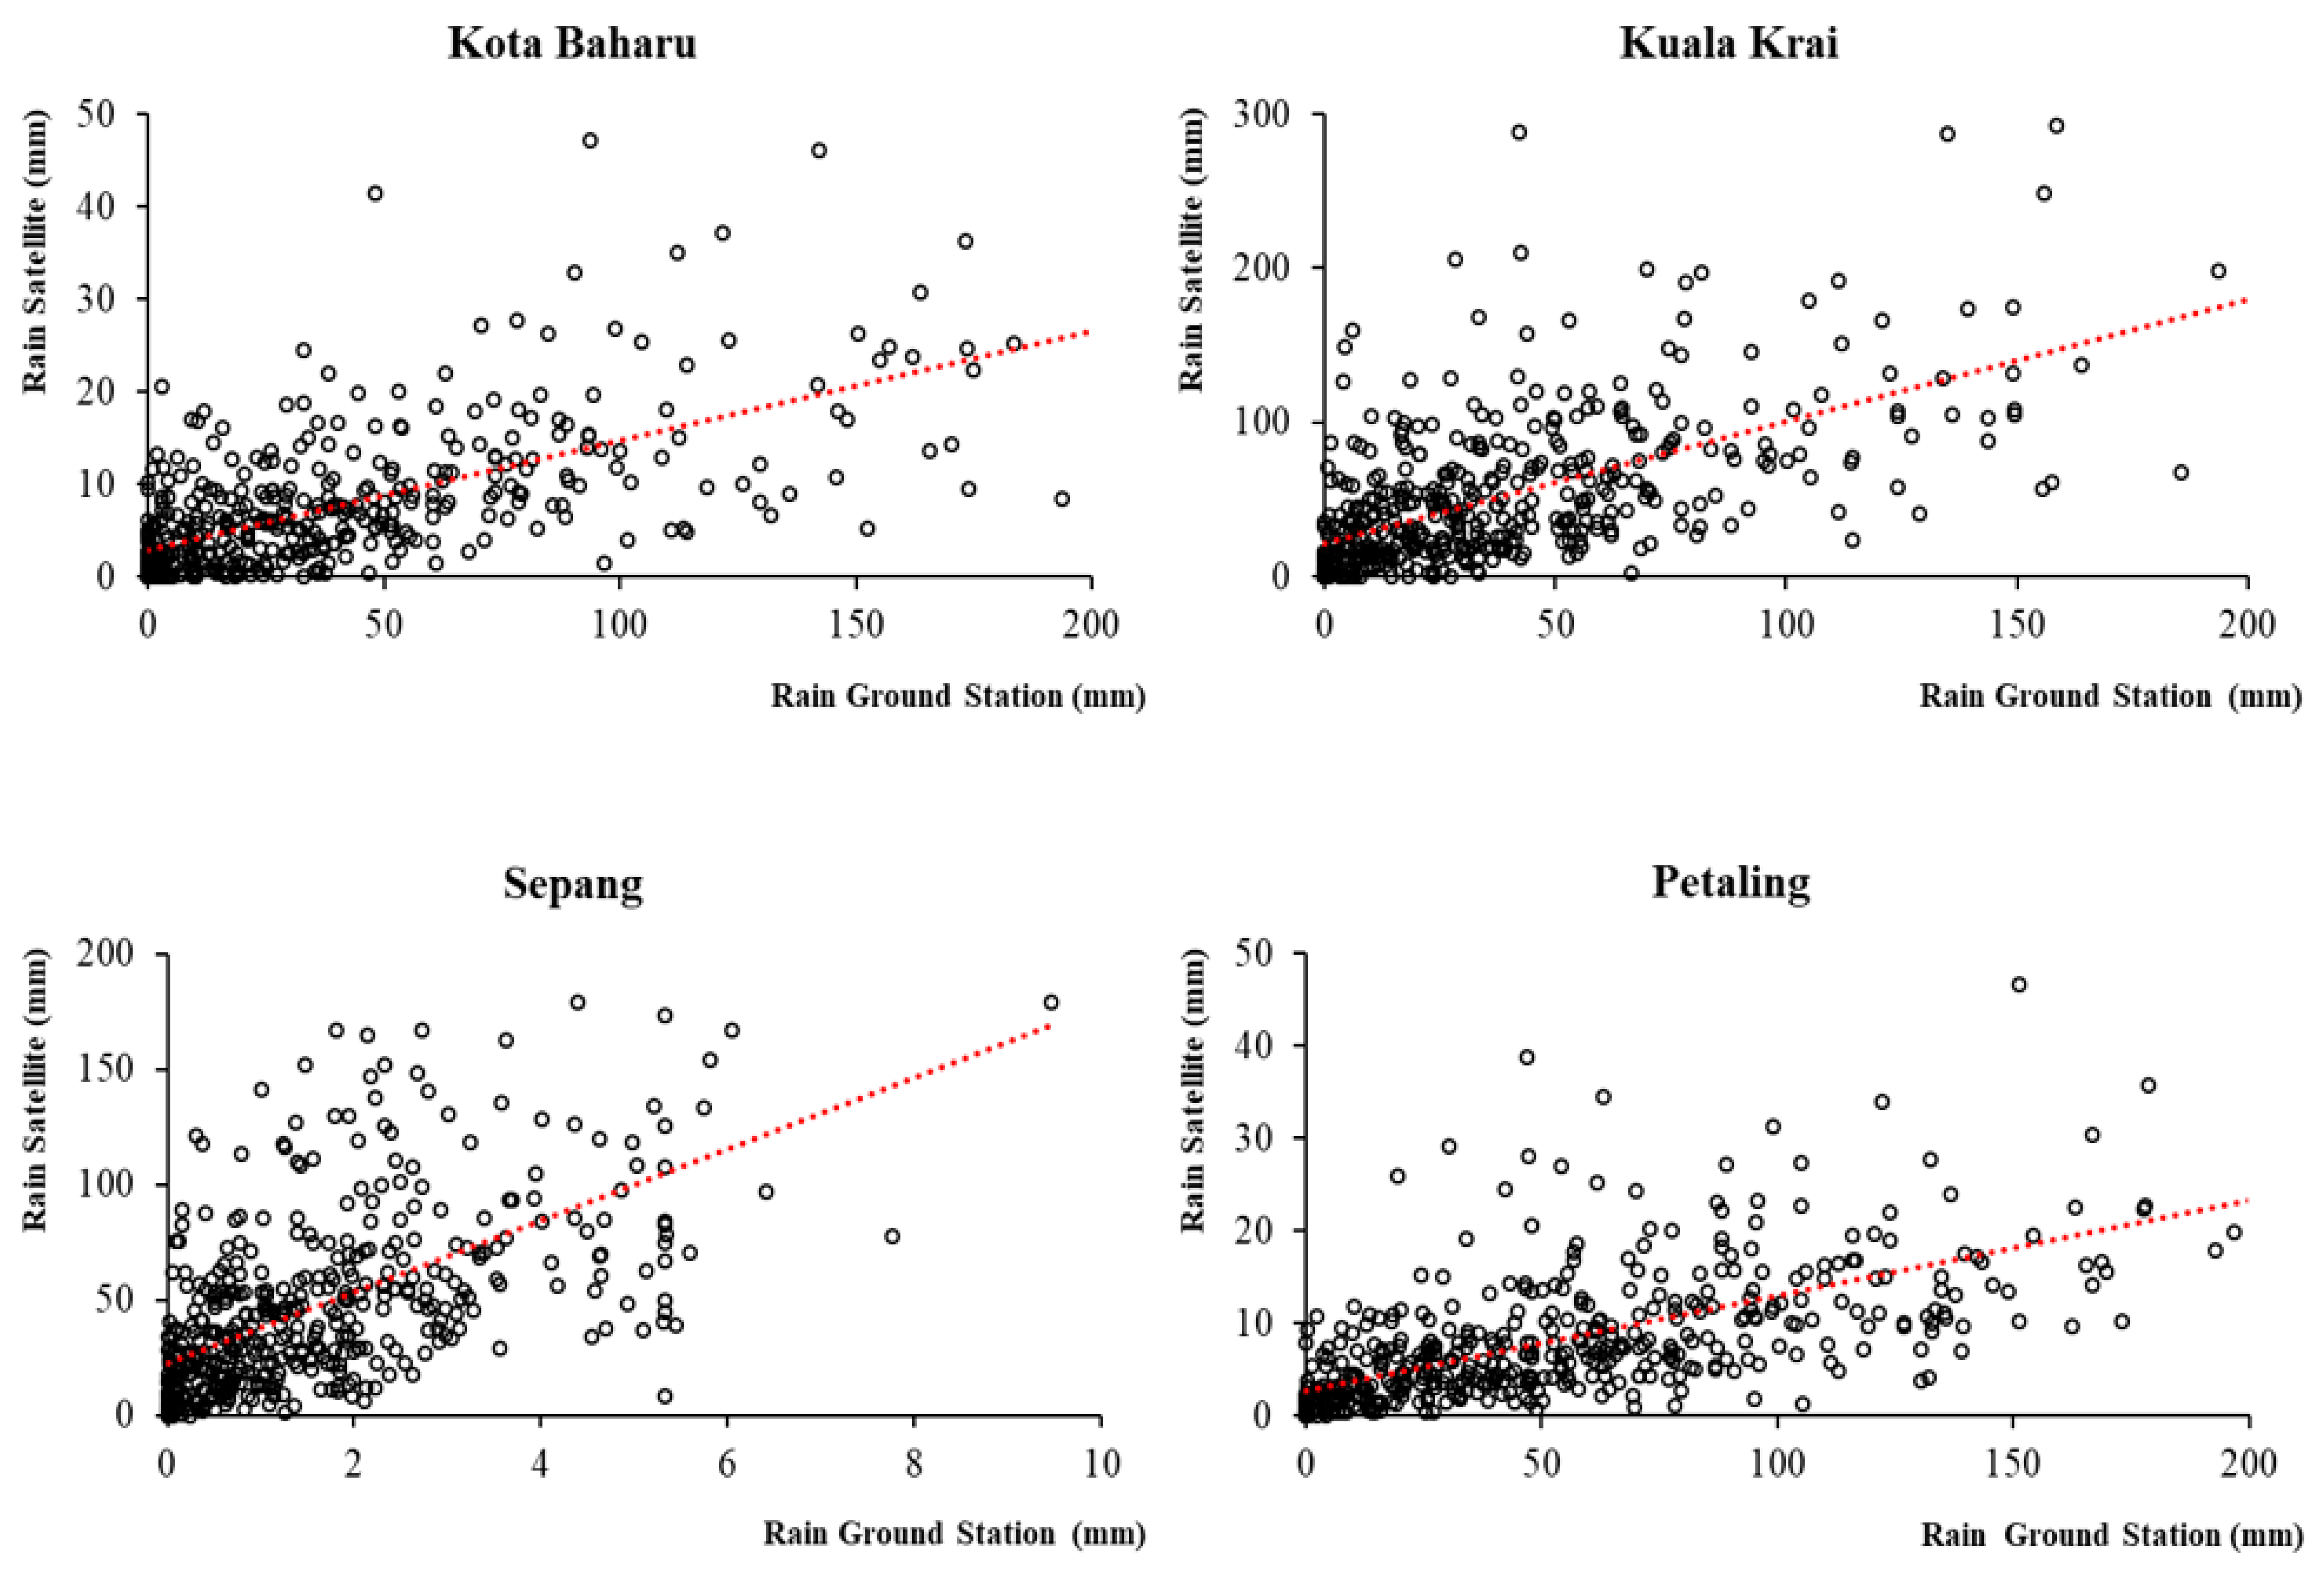
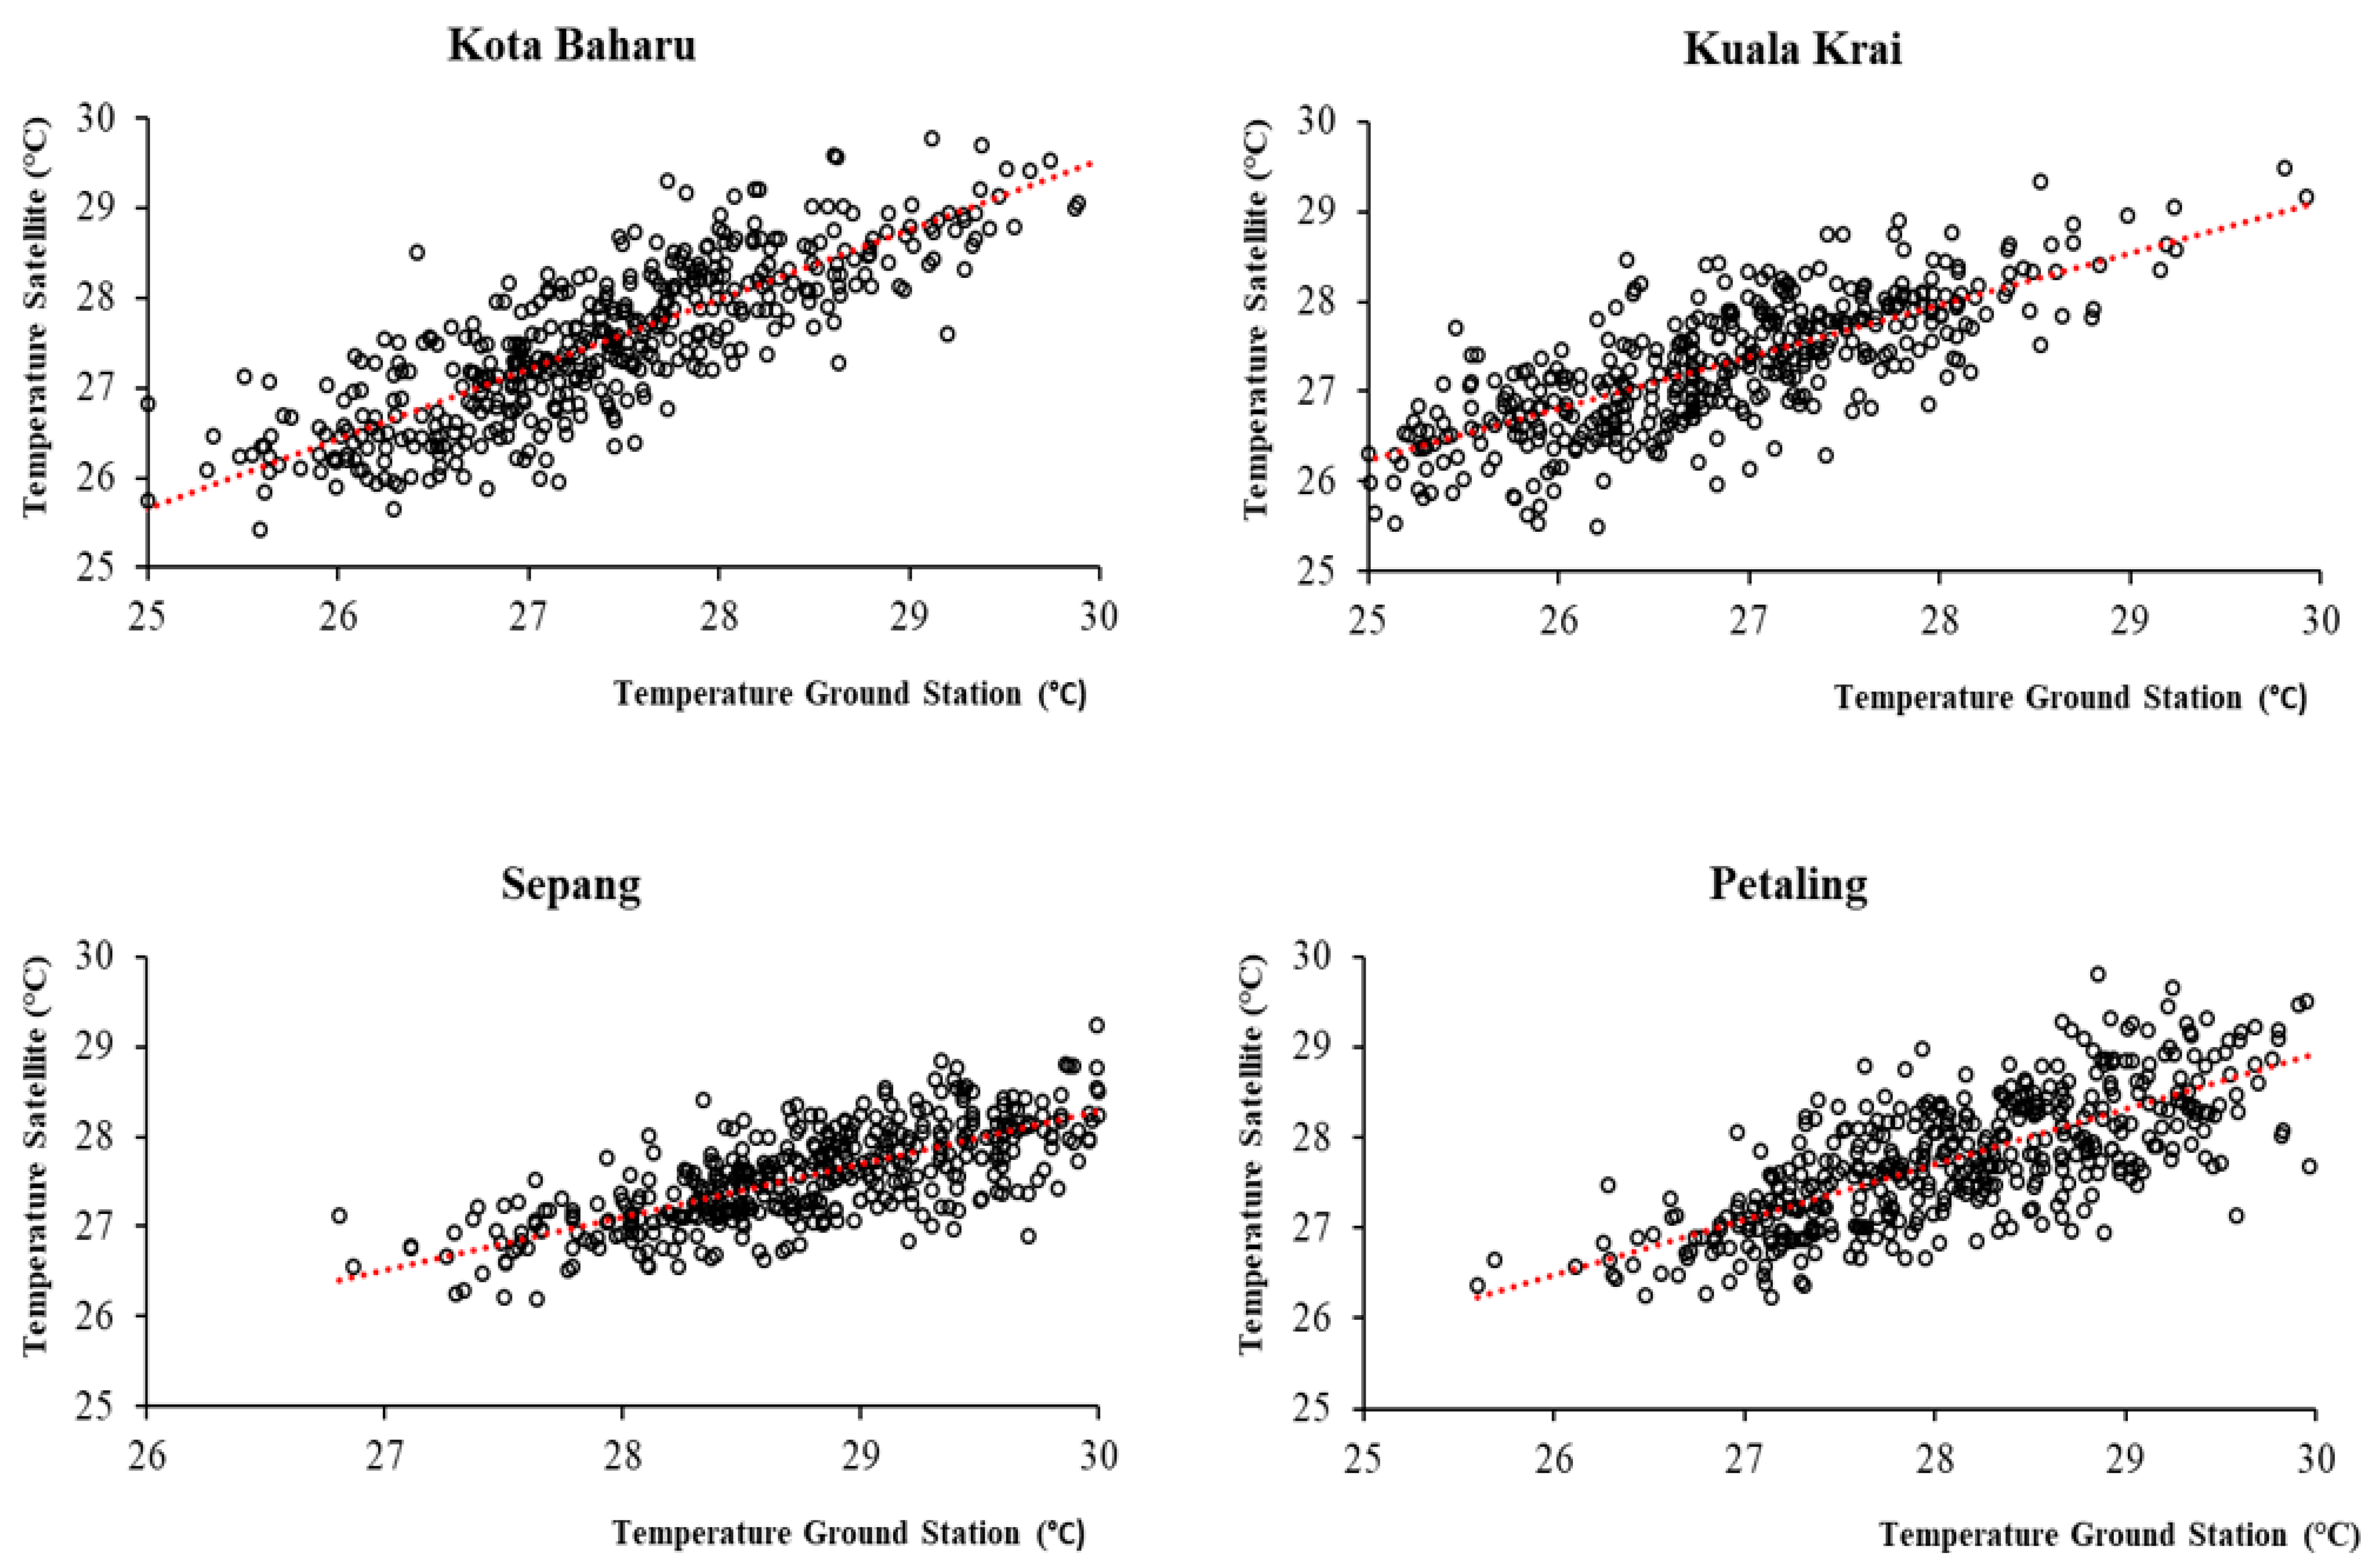
2.3.1. Correlation Analysis between EO-Based and Station-Based Meteorological Data
2.3.2. Correlation Analysis between Meteorological Data and Dengue Cases
2.3.3. Multivariate Linear Regression Analysis between Meteorological Variables and Dengue Cases
3. Results
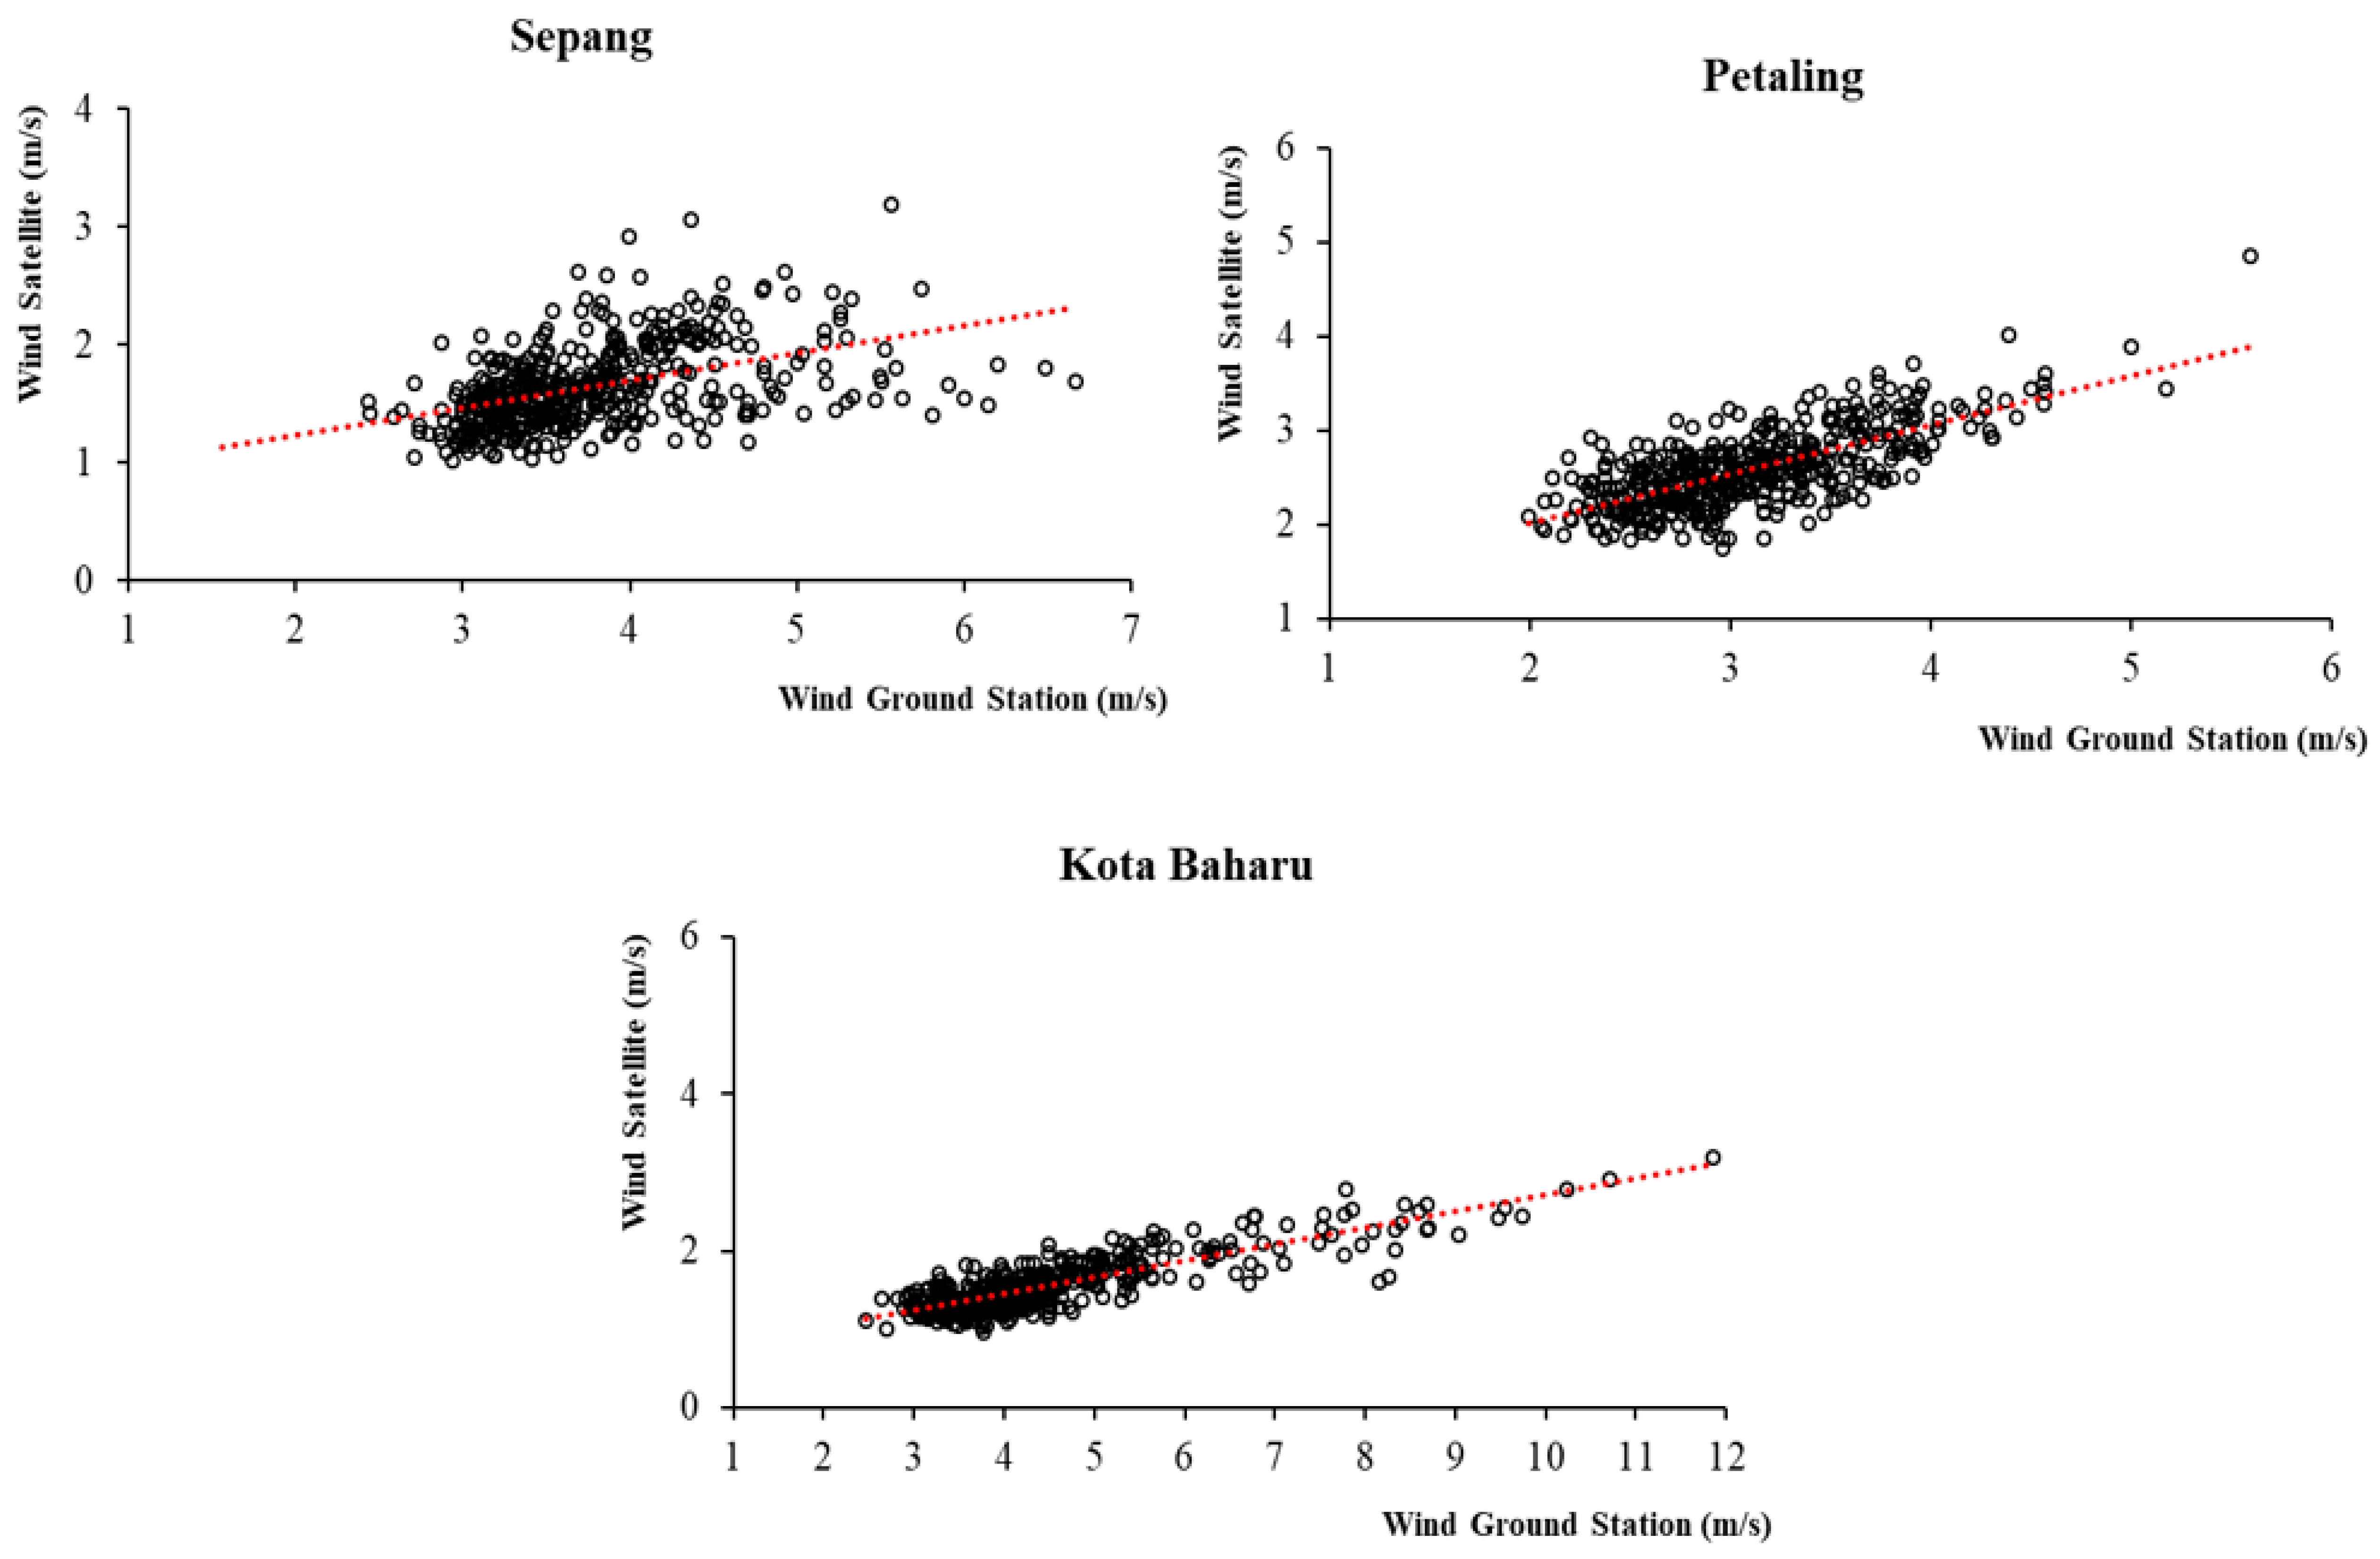
3.1. Correlation between EO and Station-Based Meteorological Data
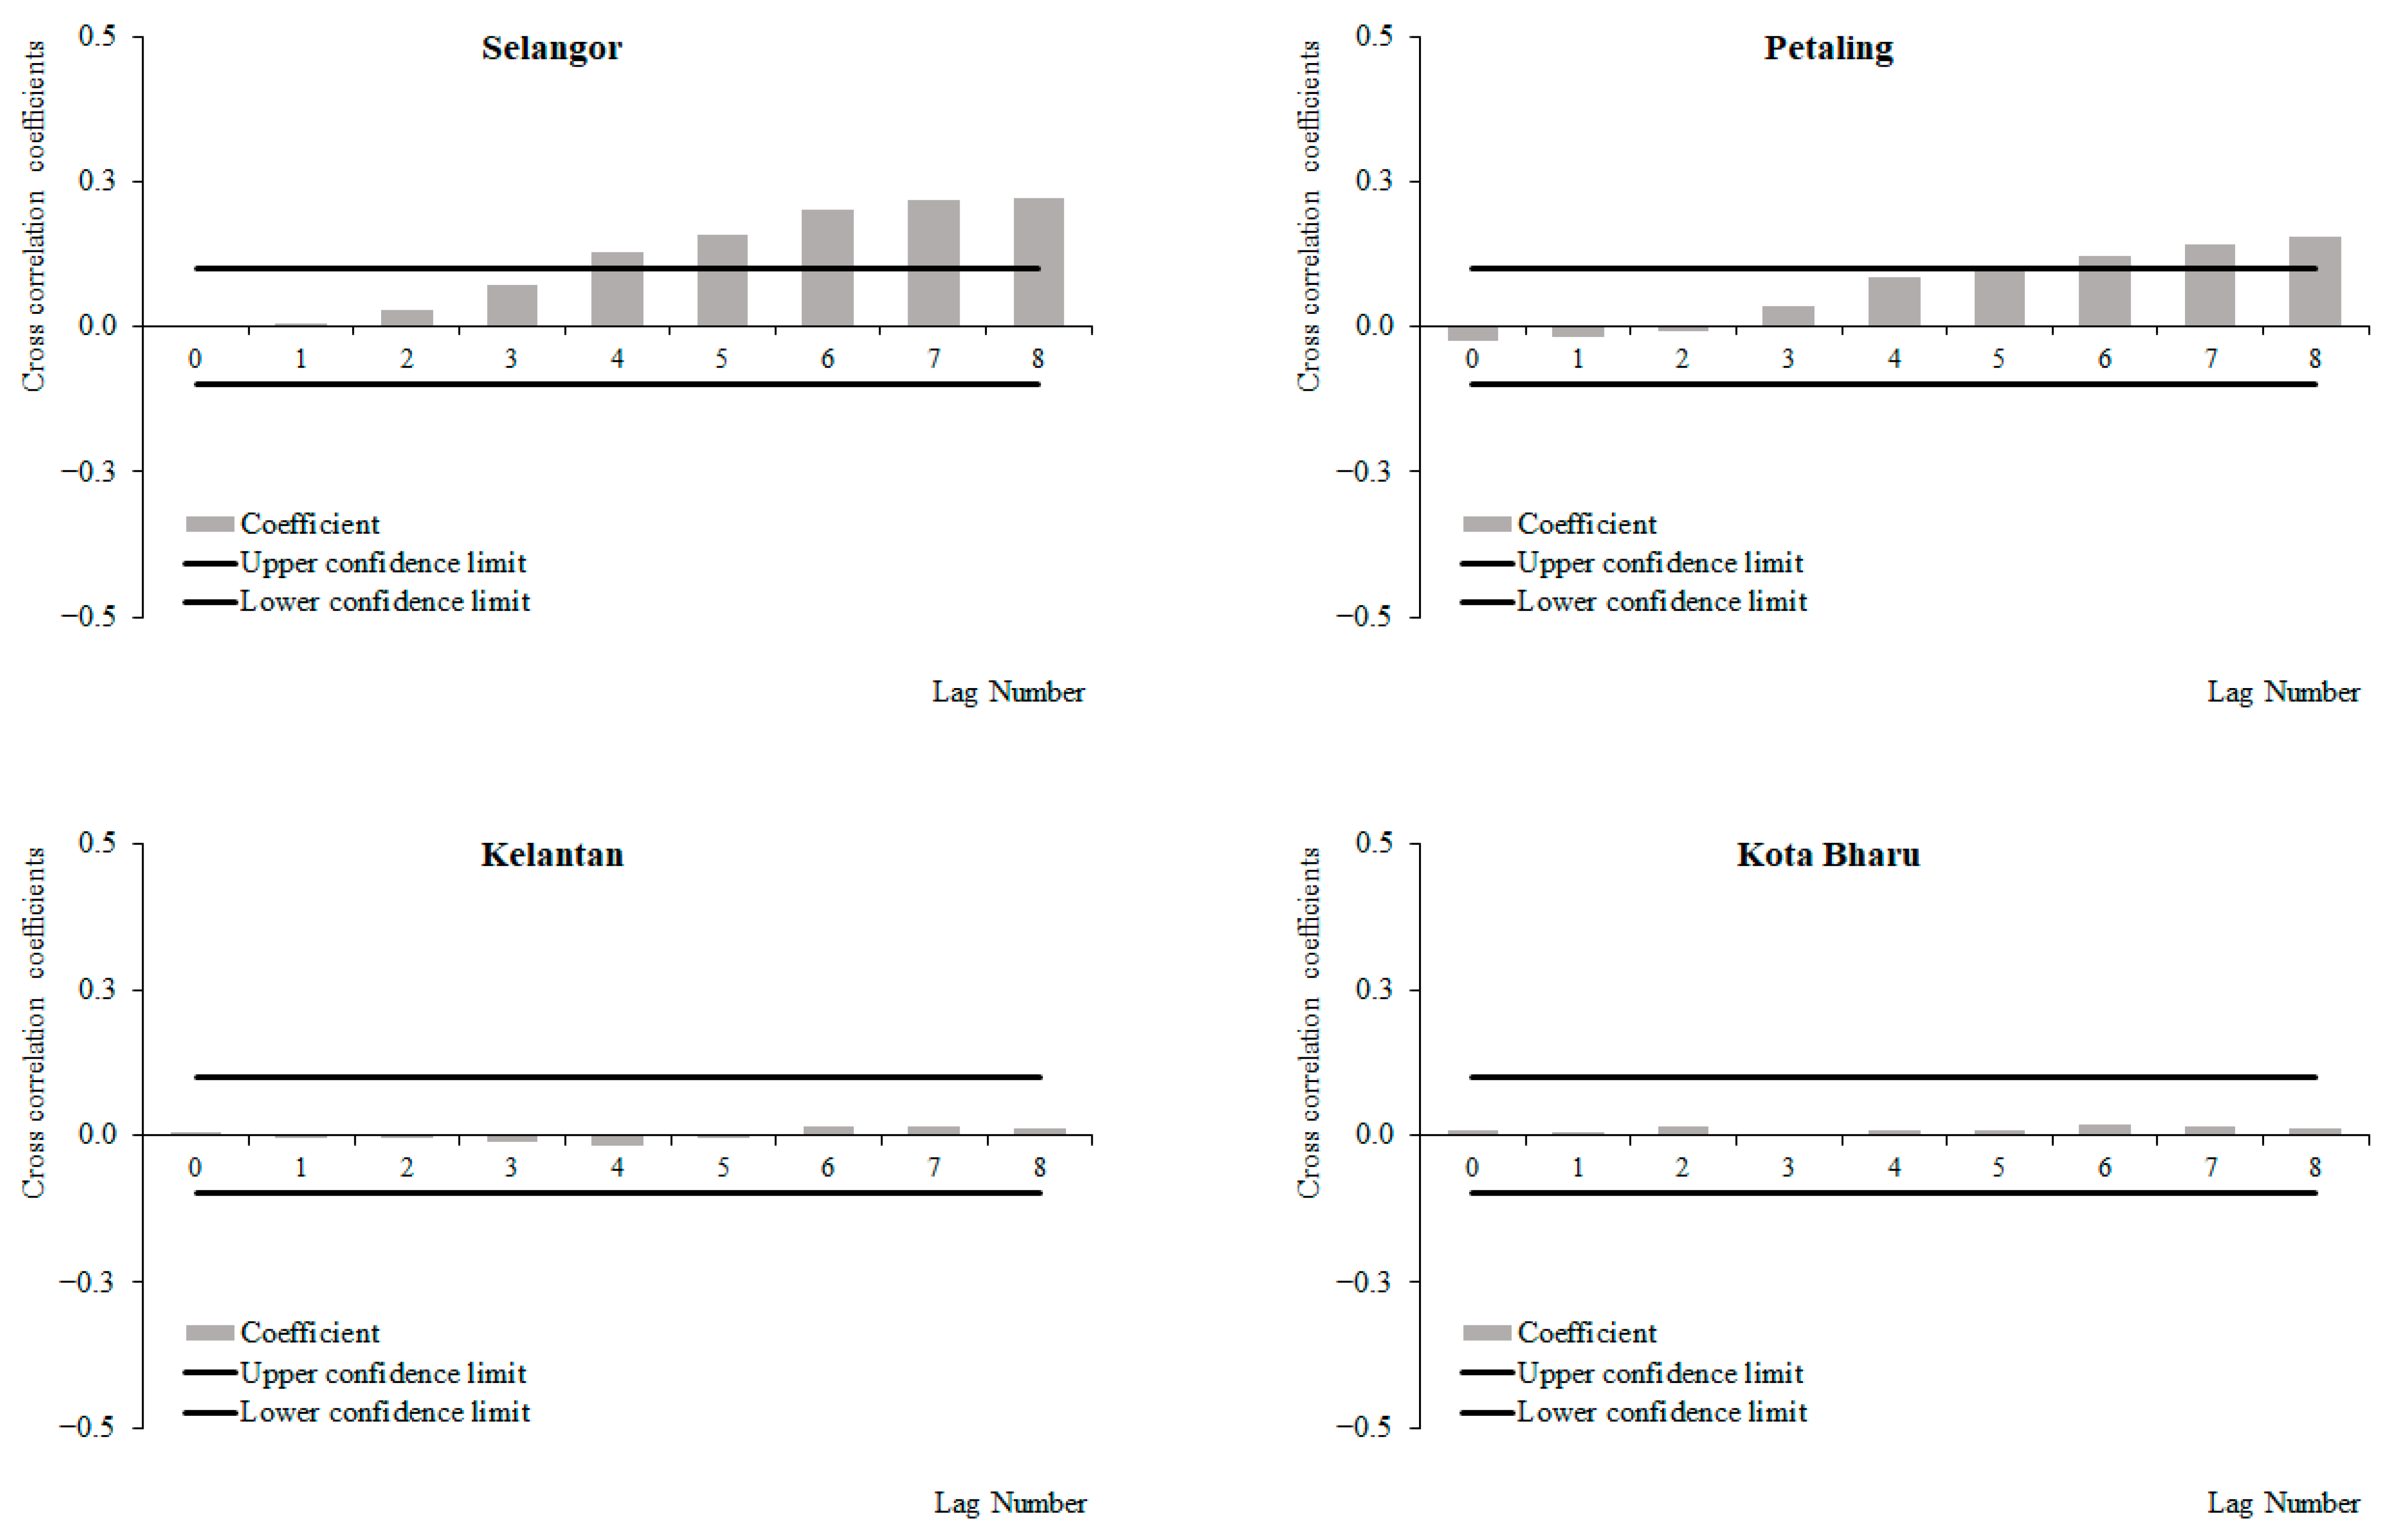
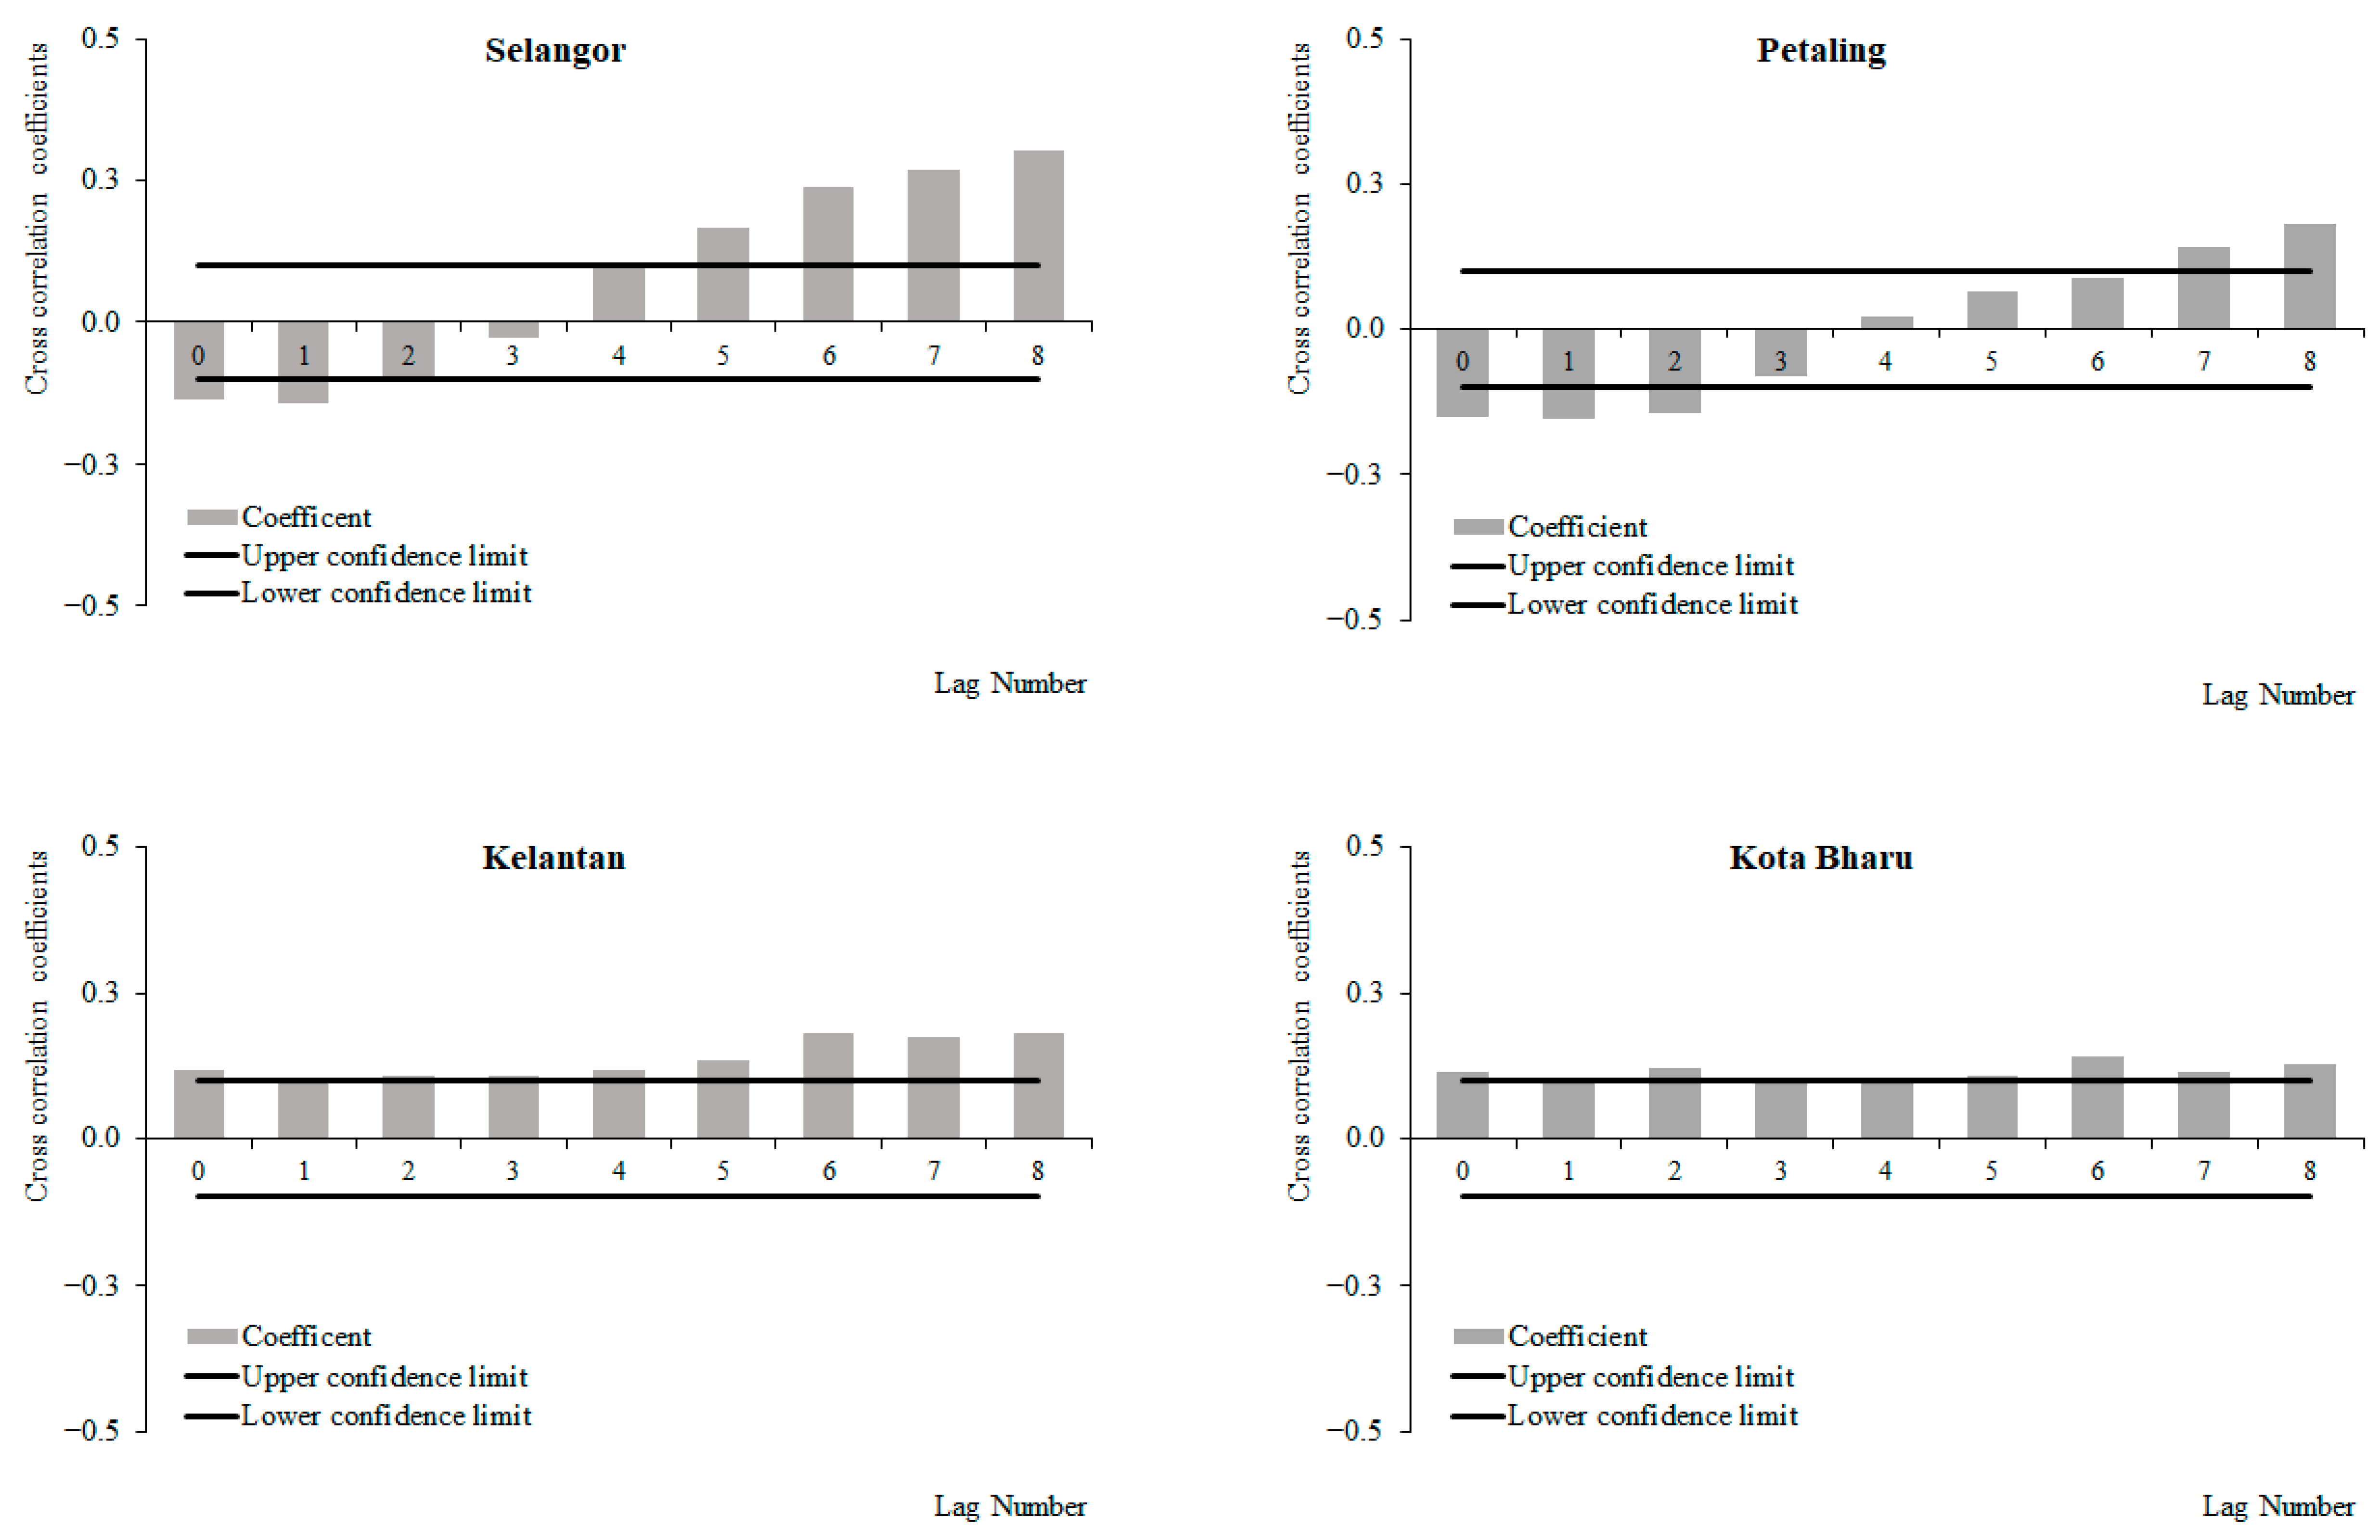
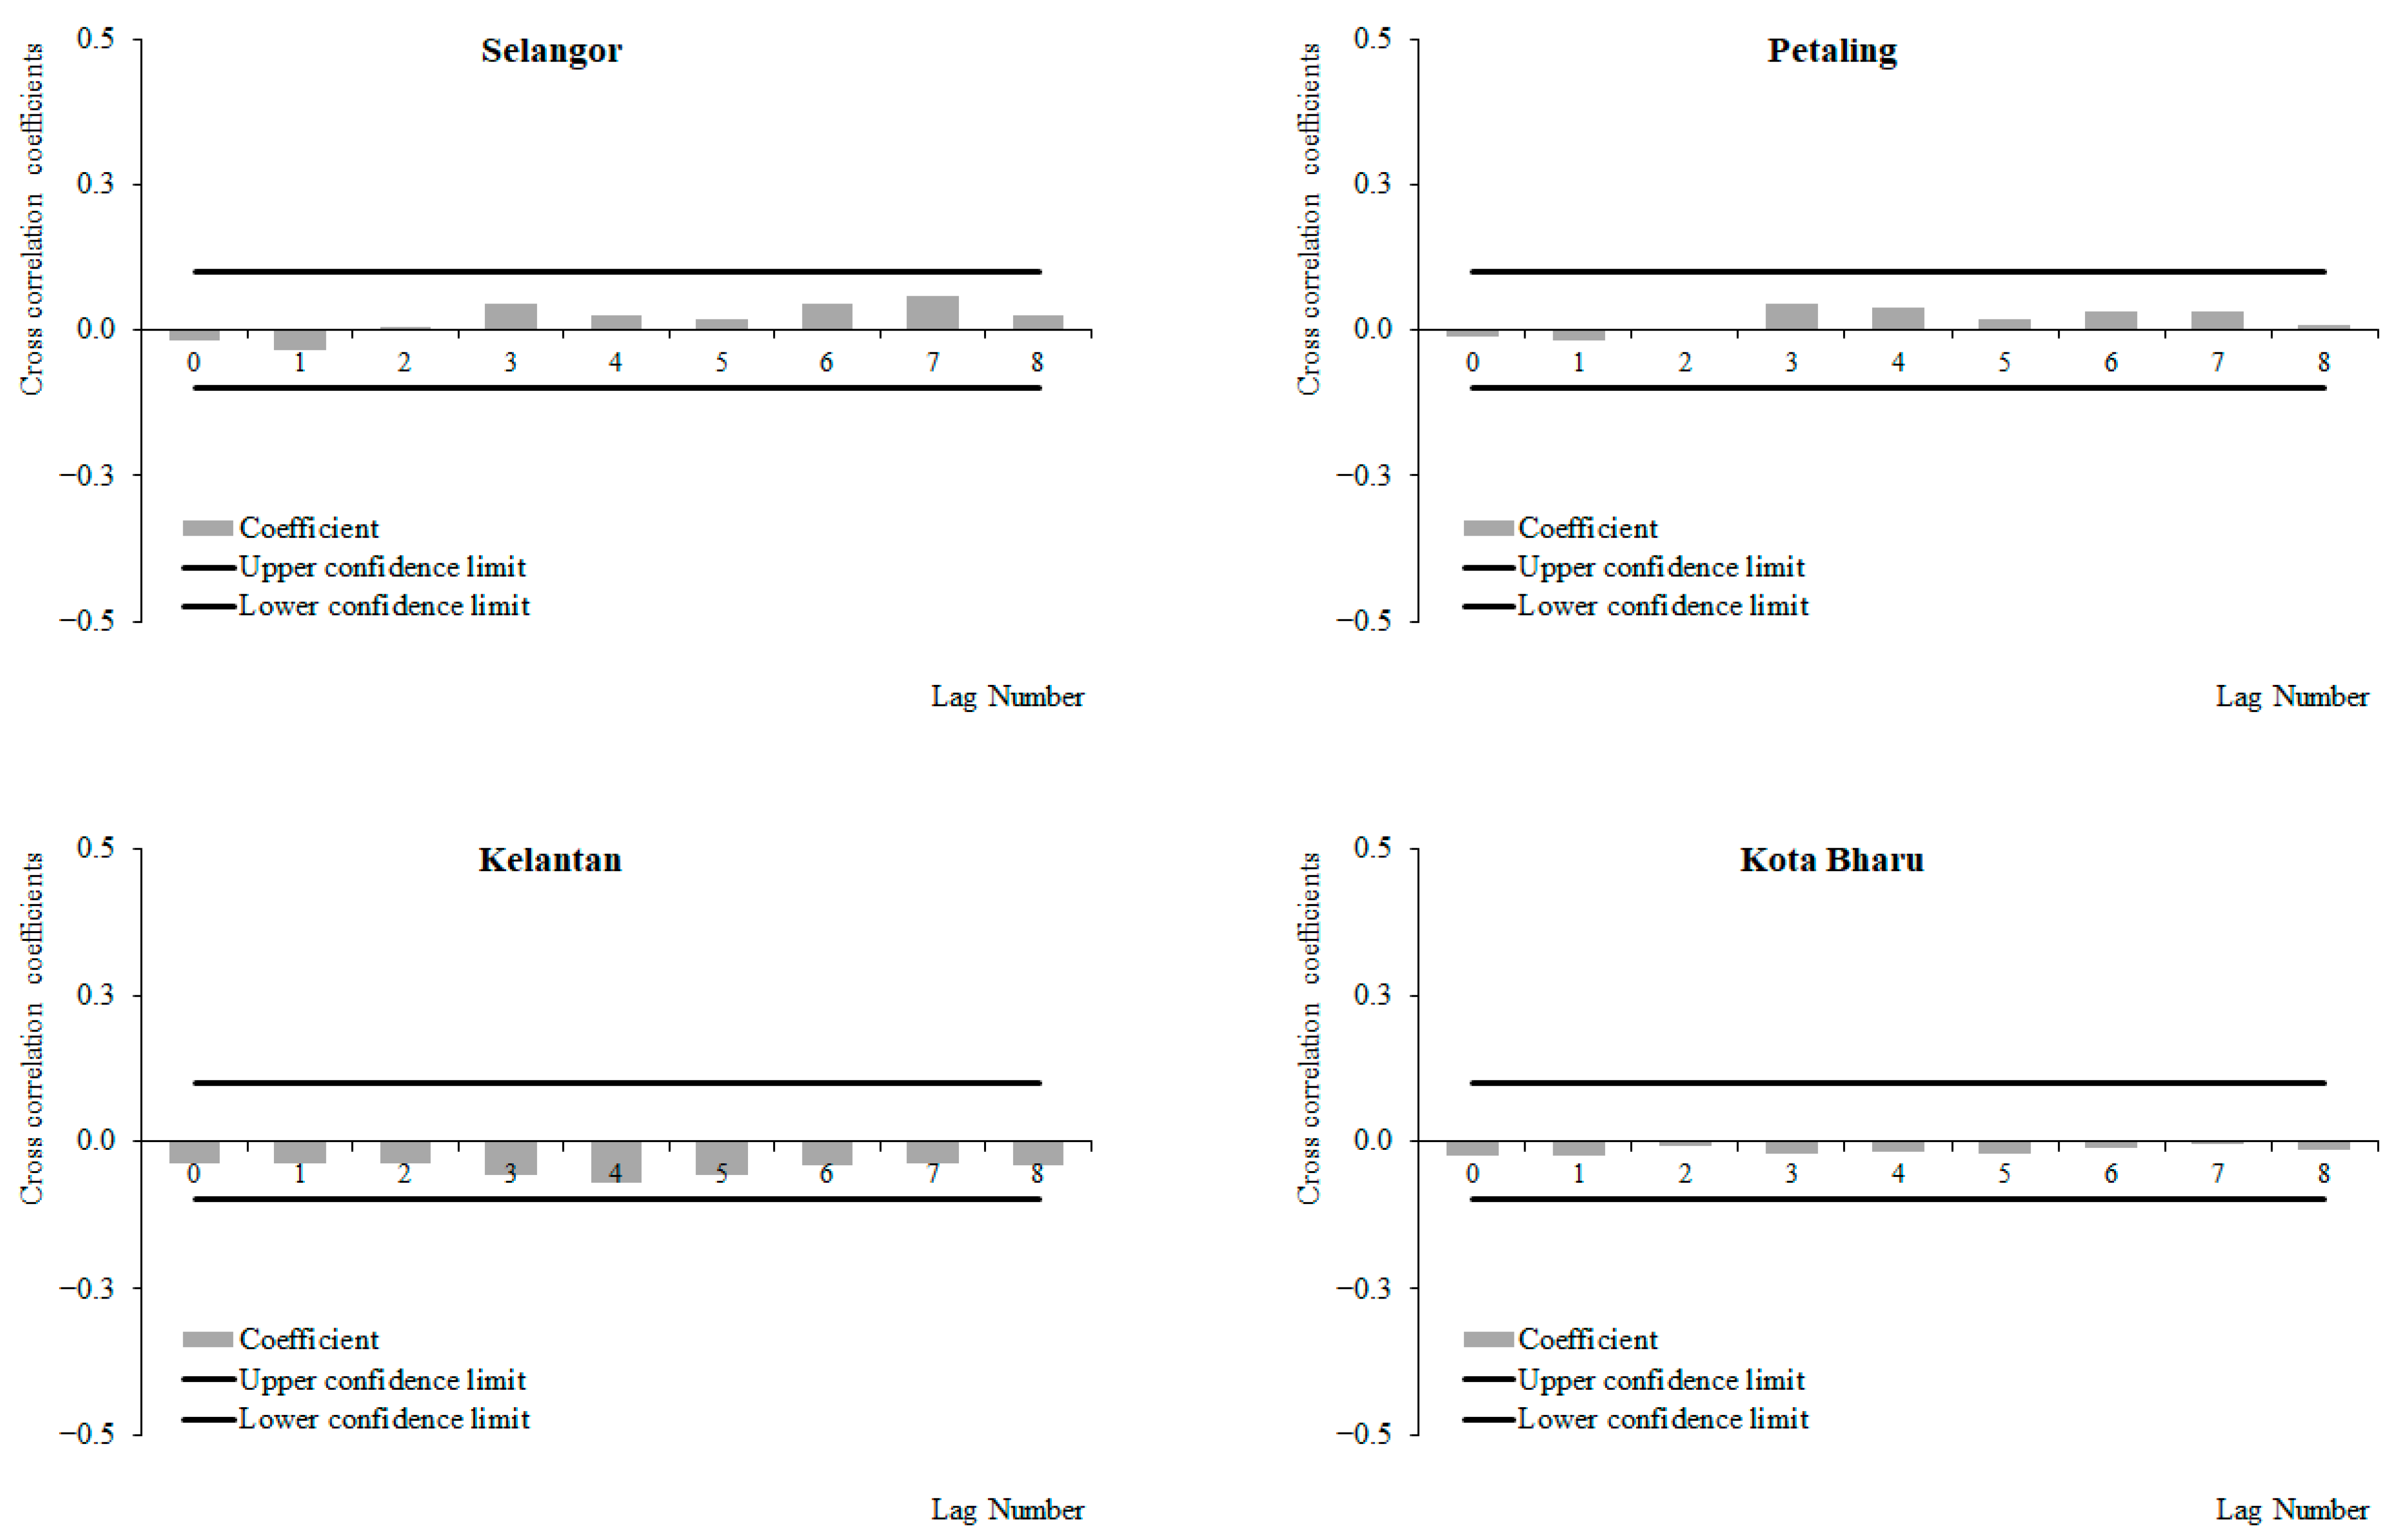
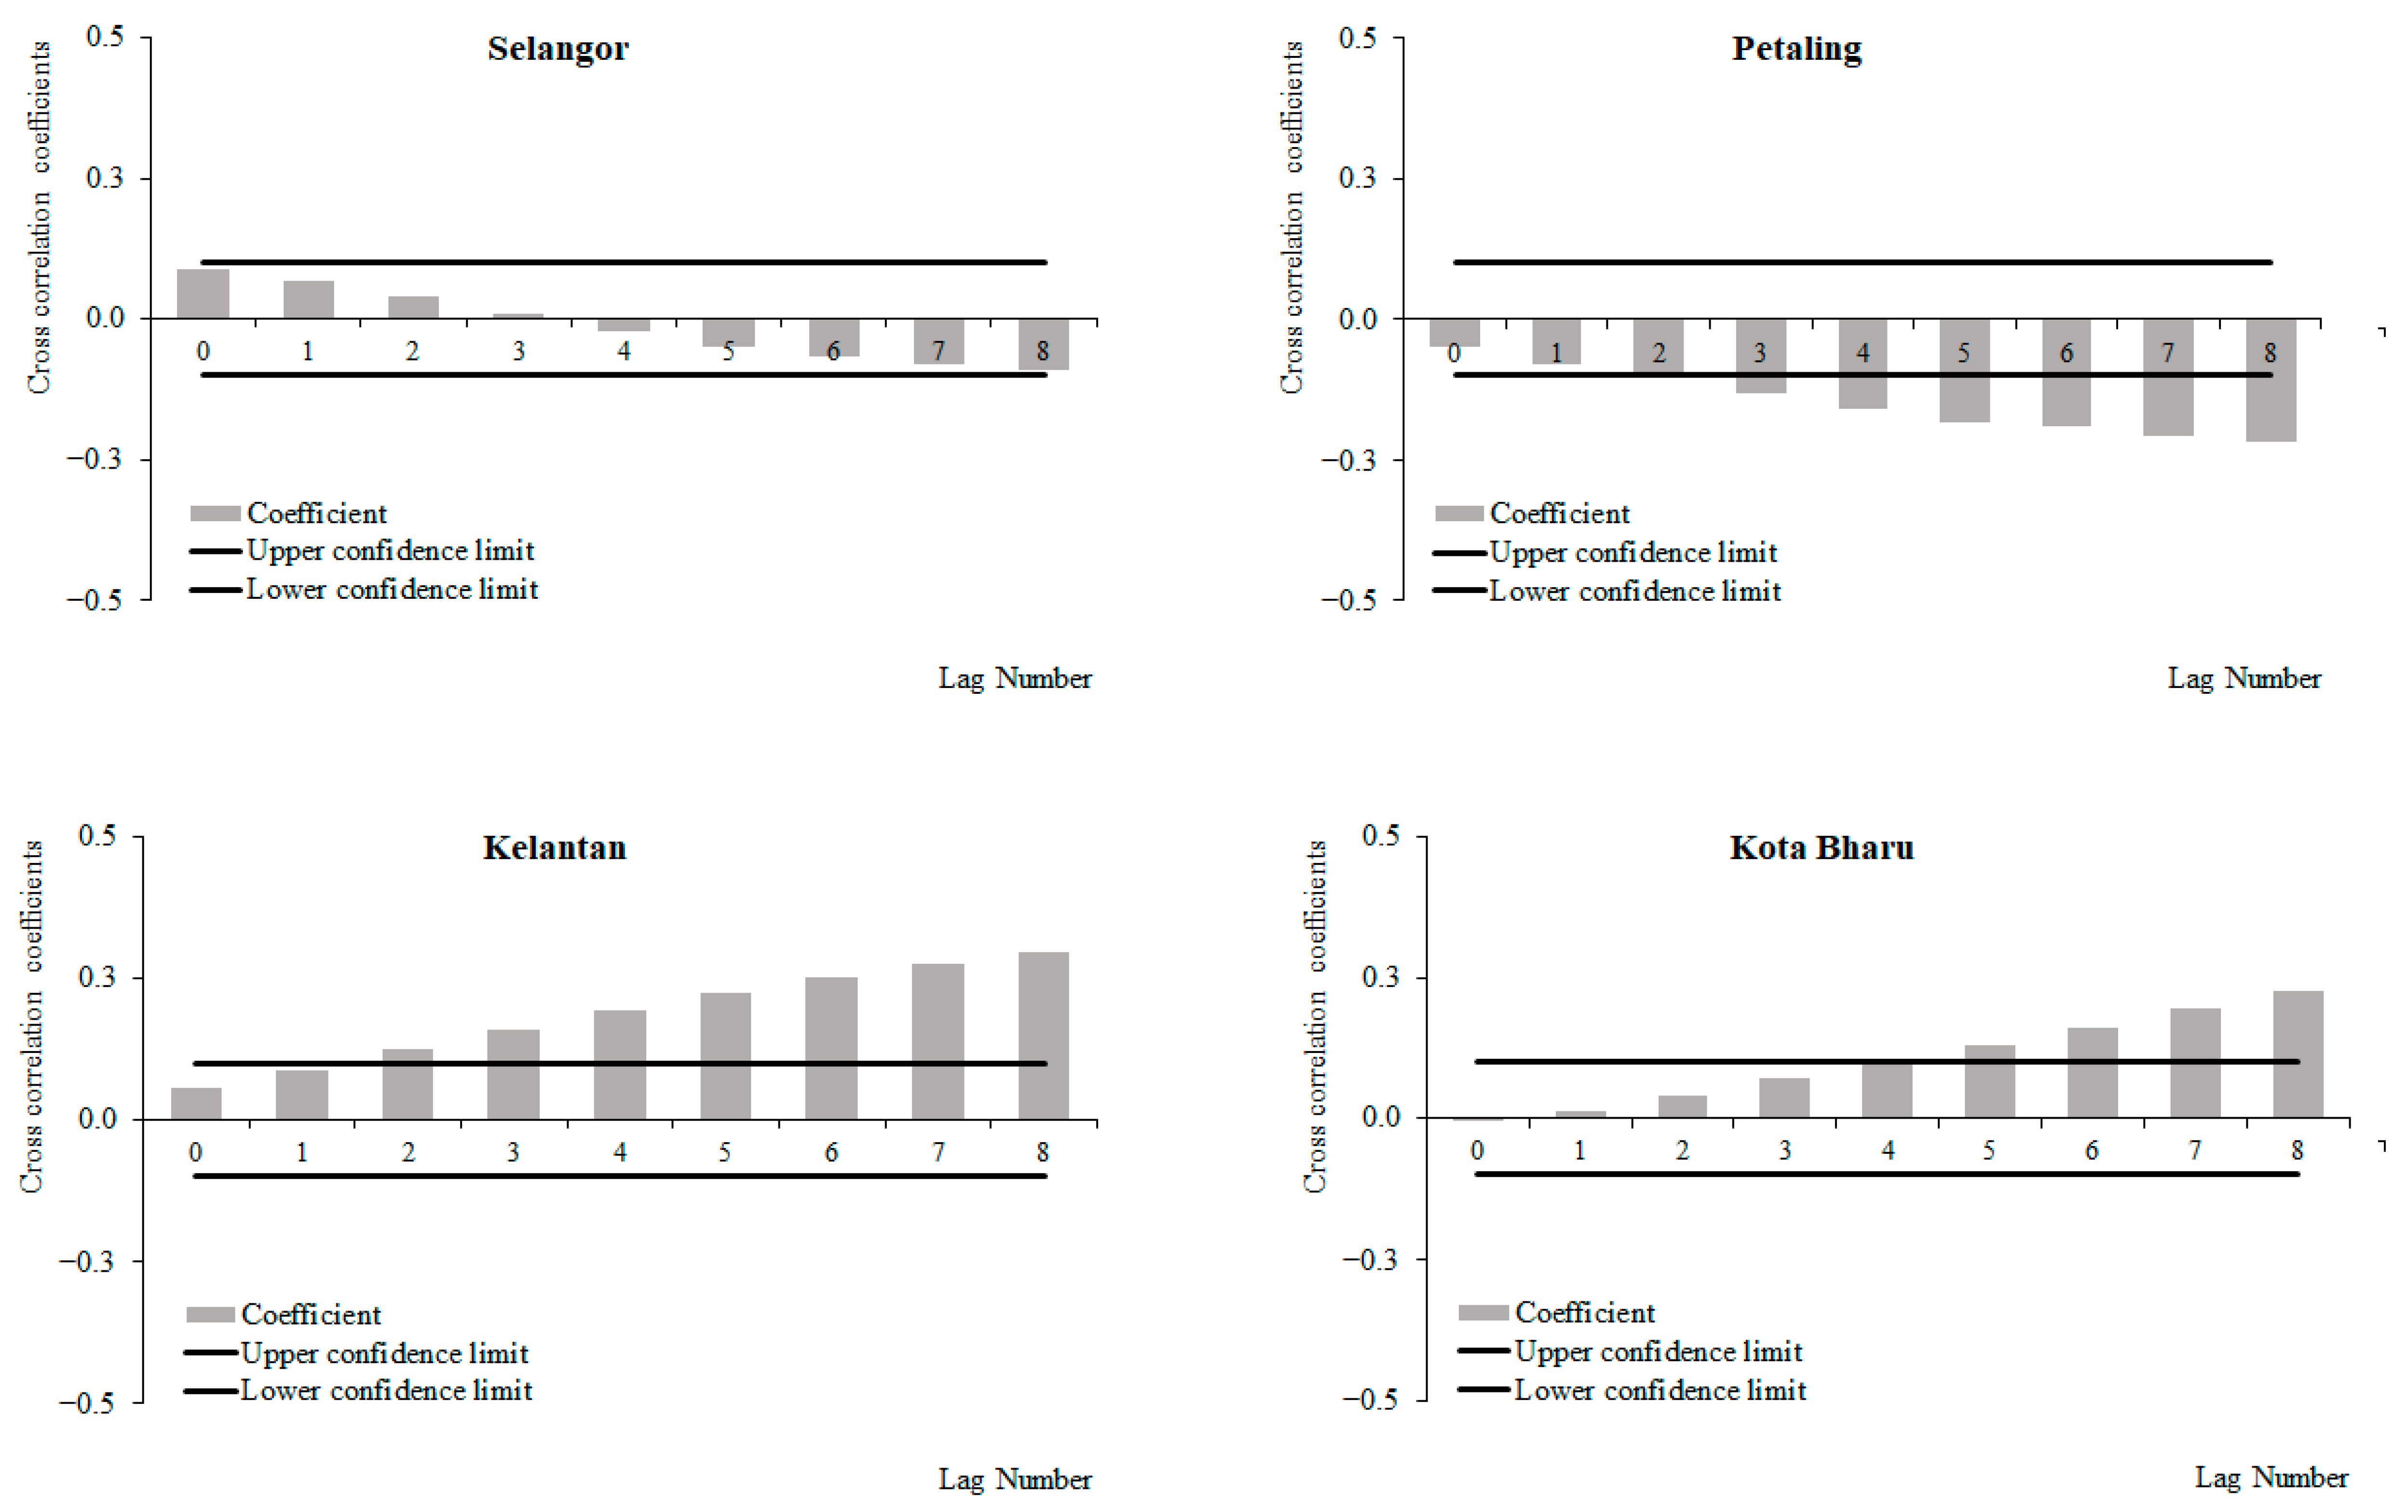
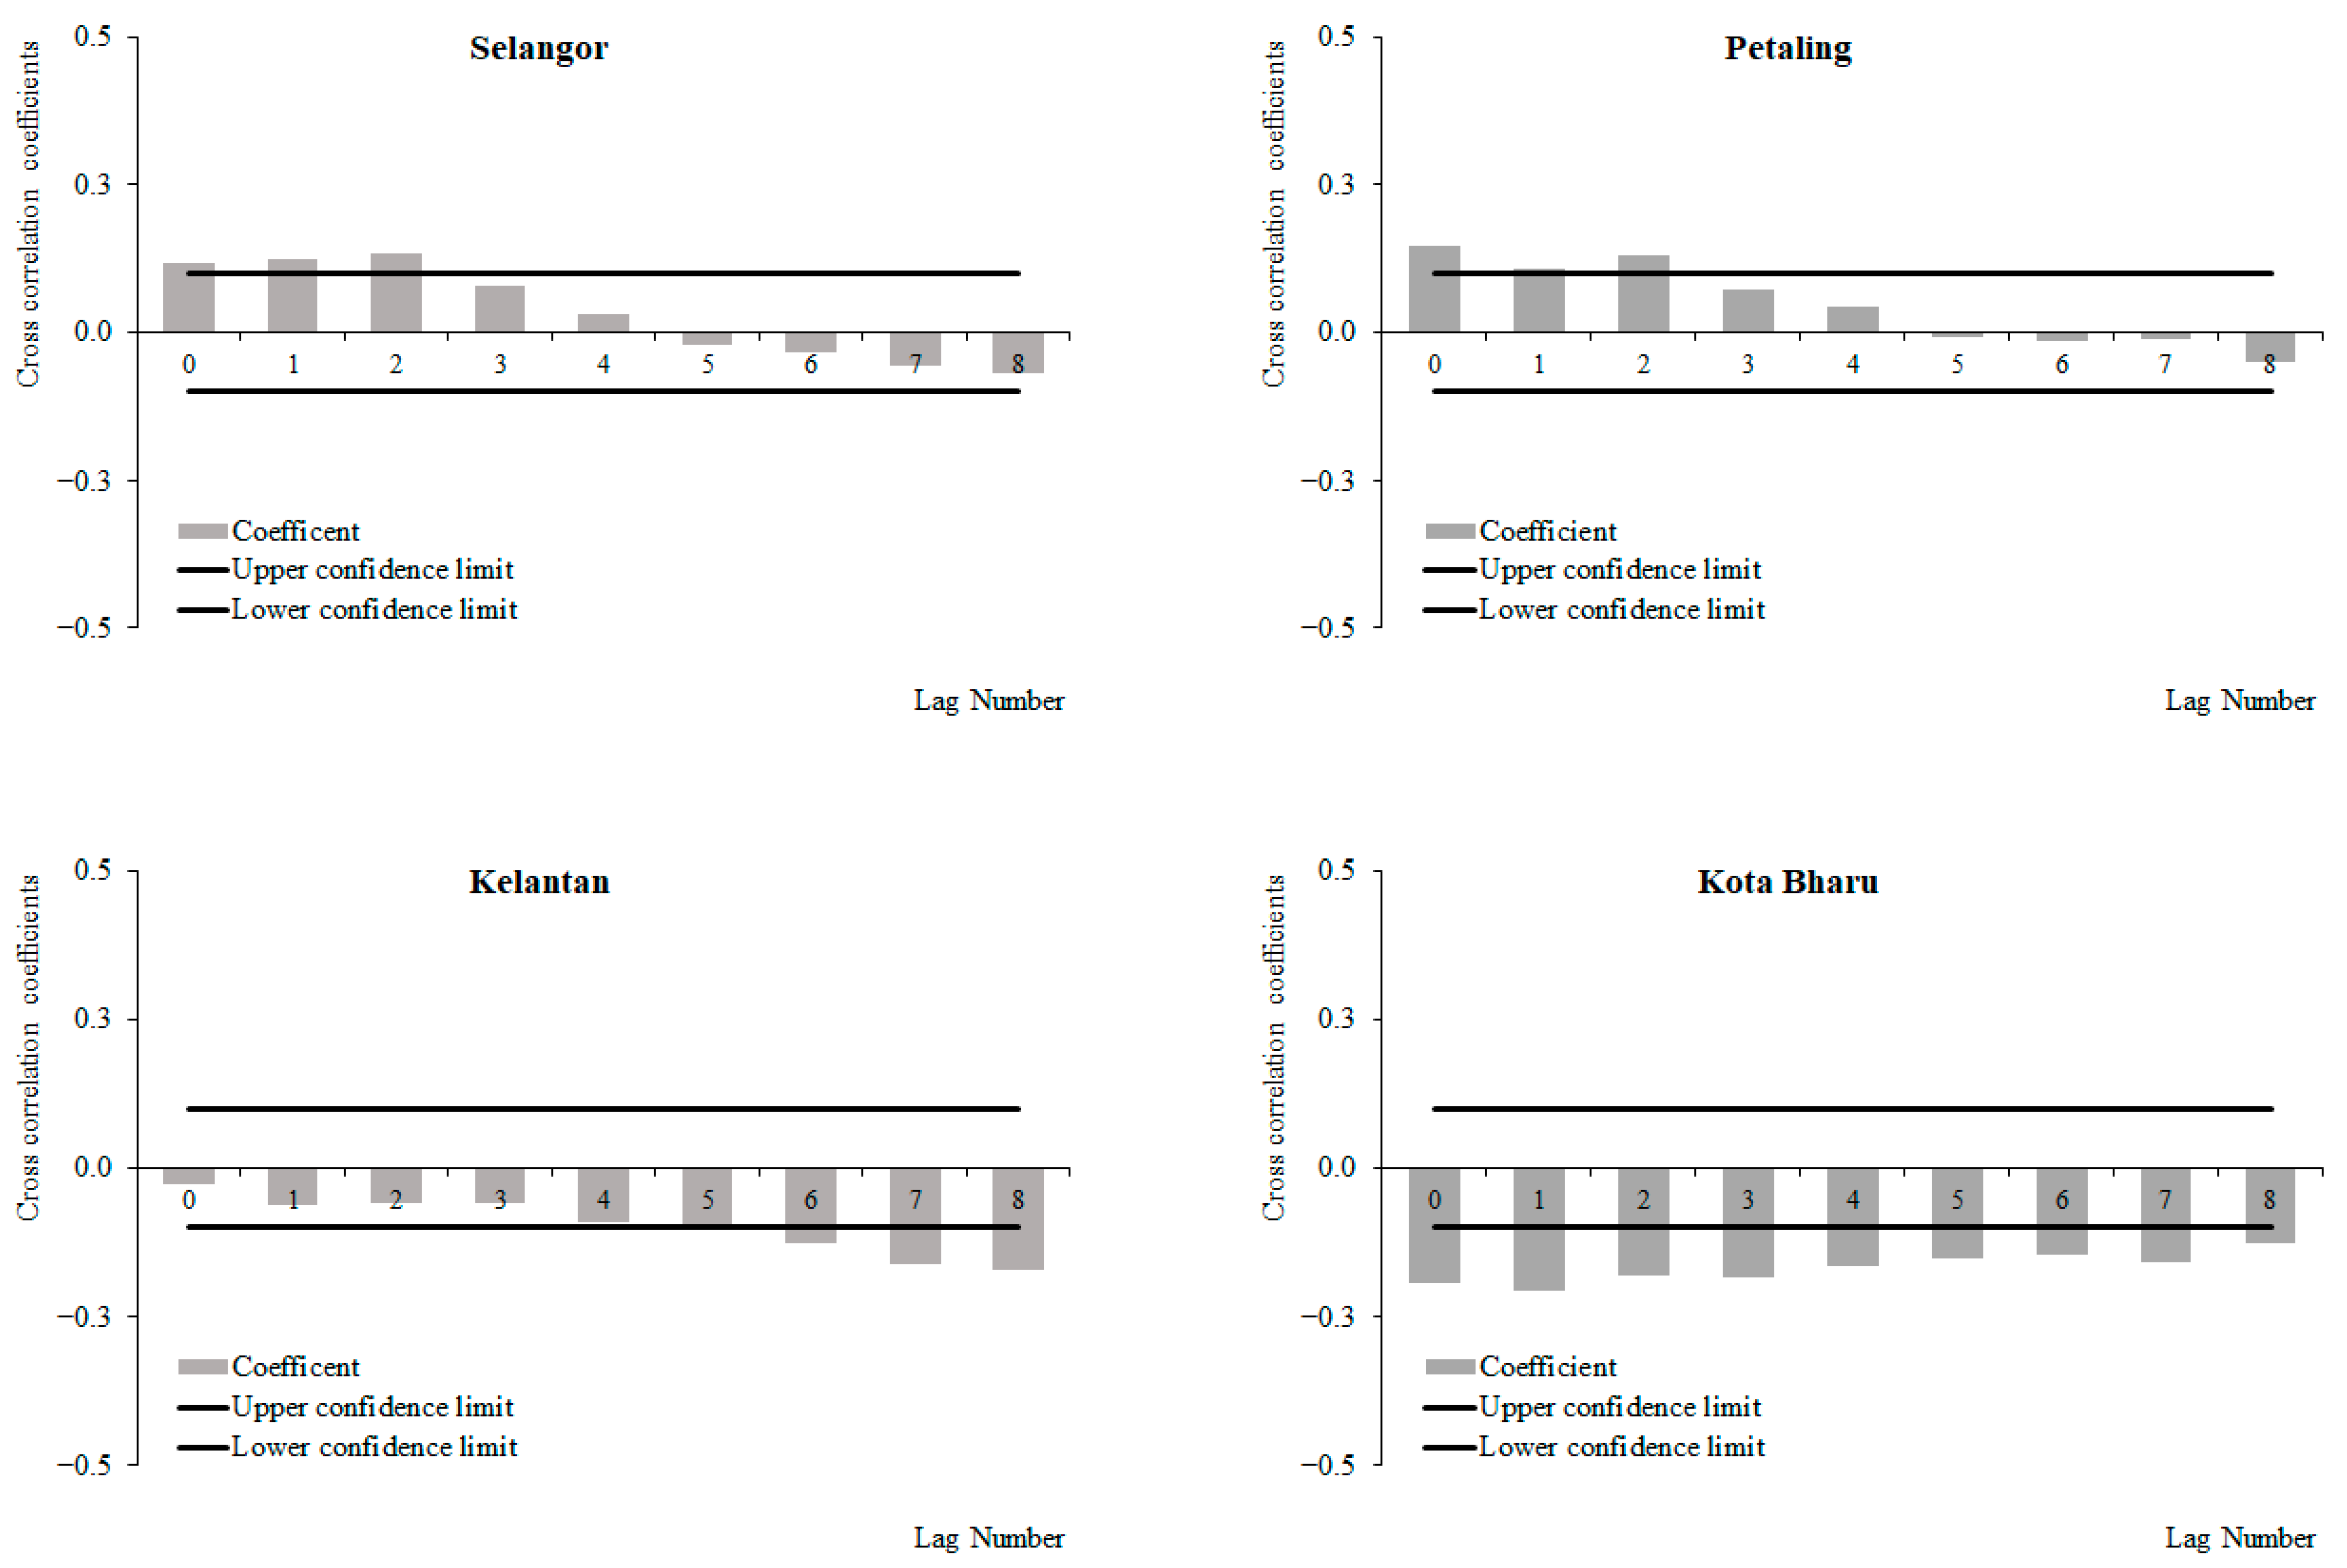
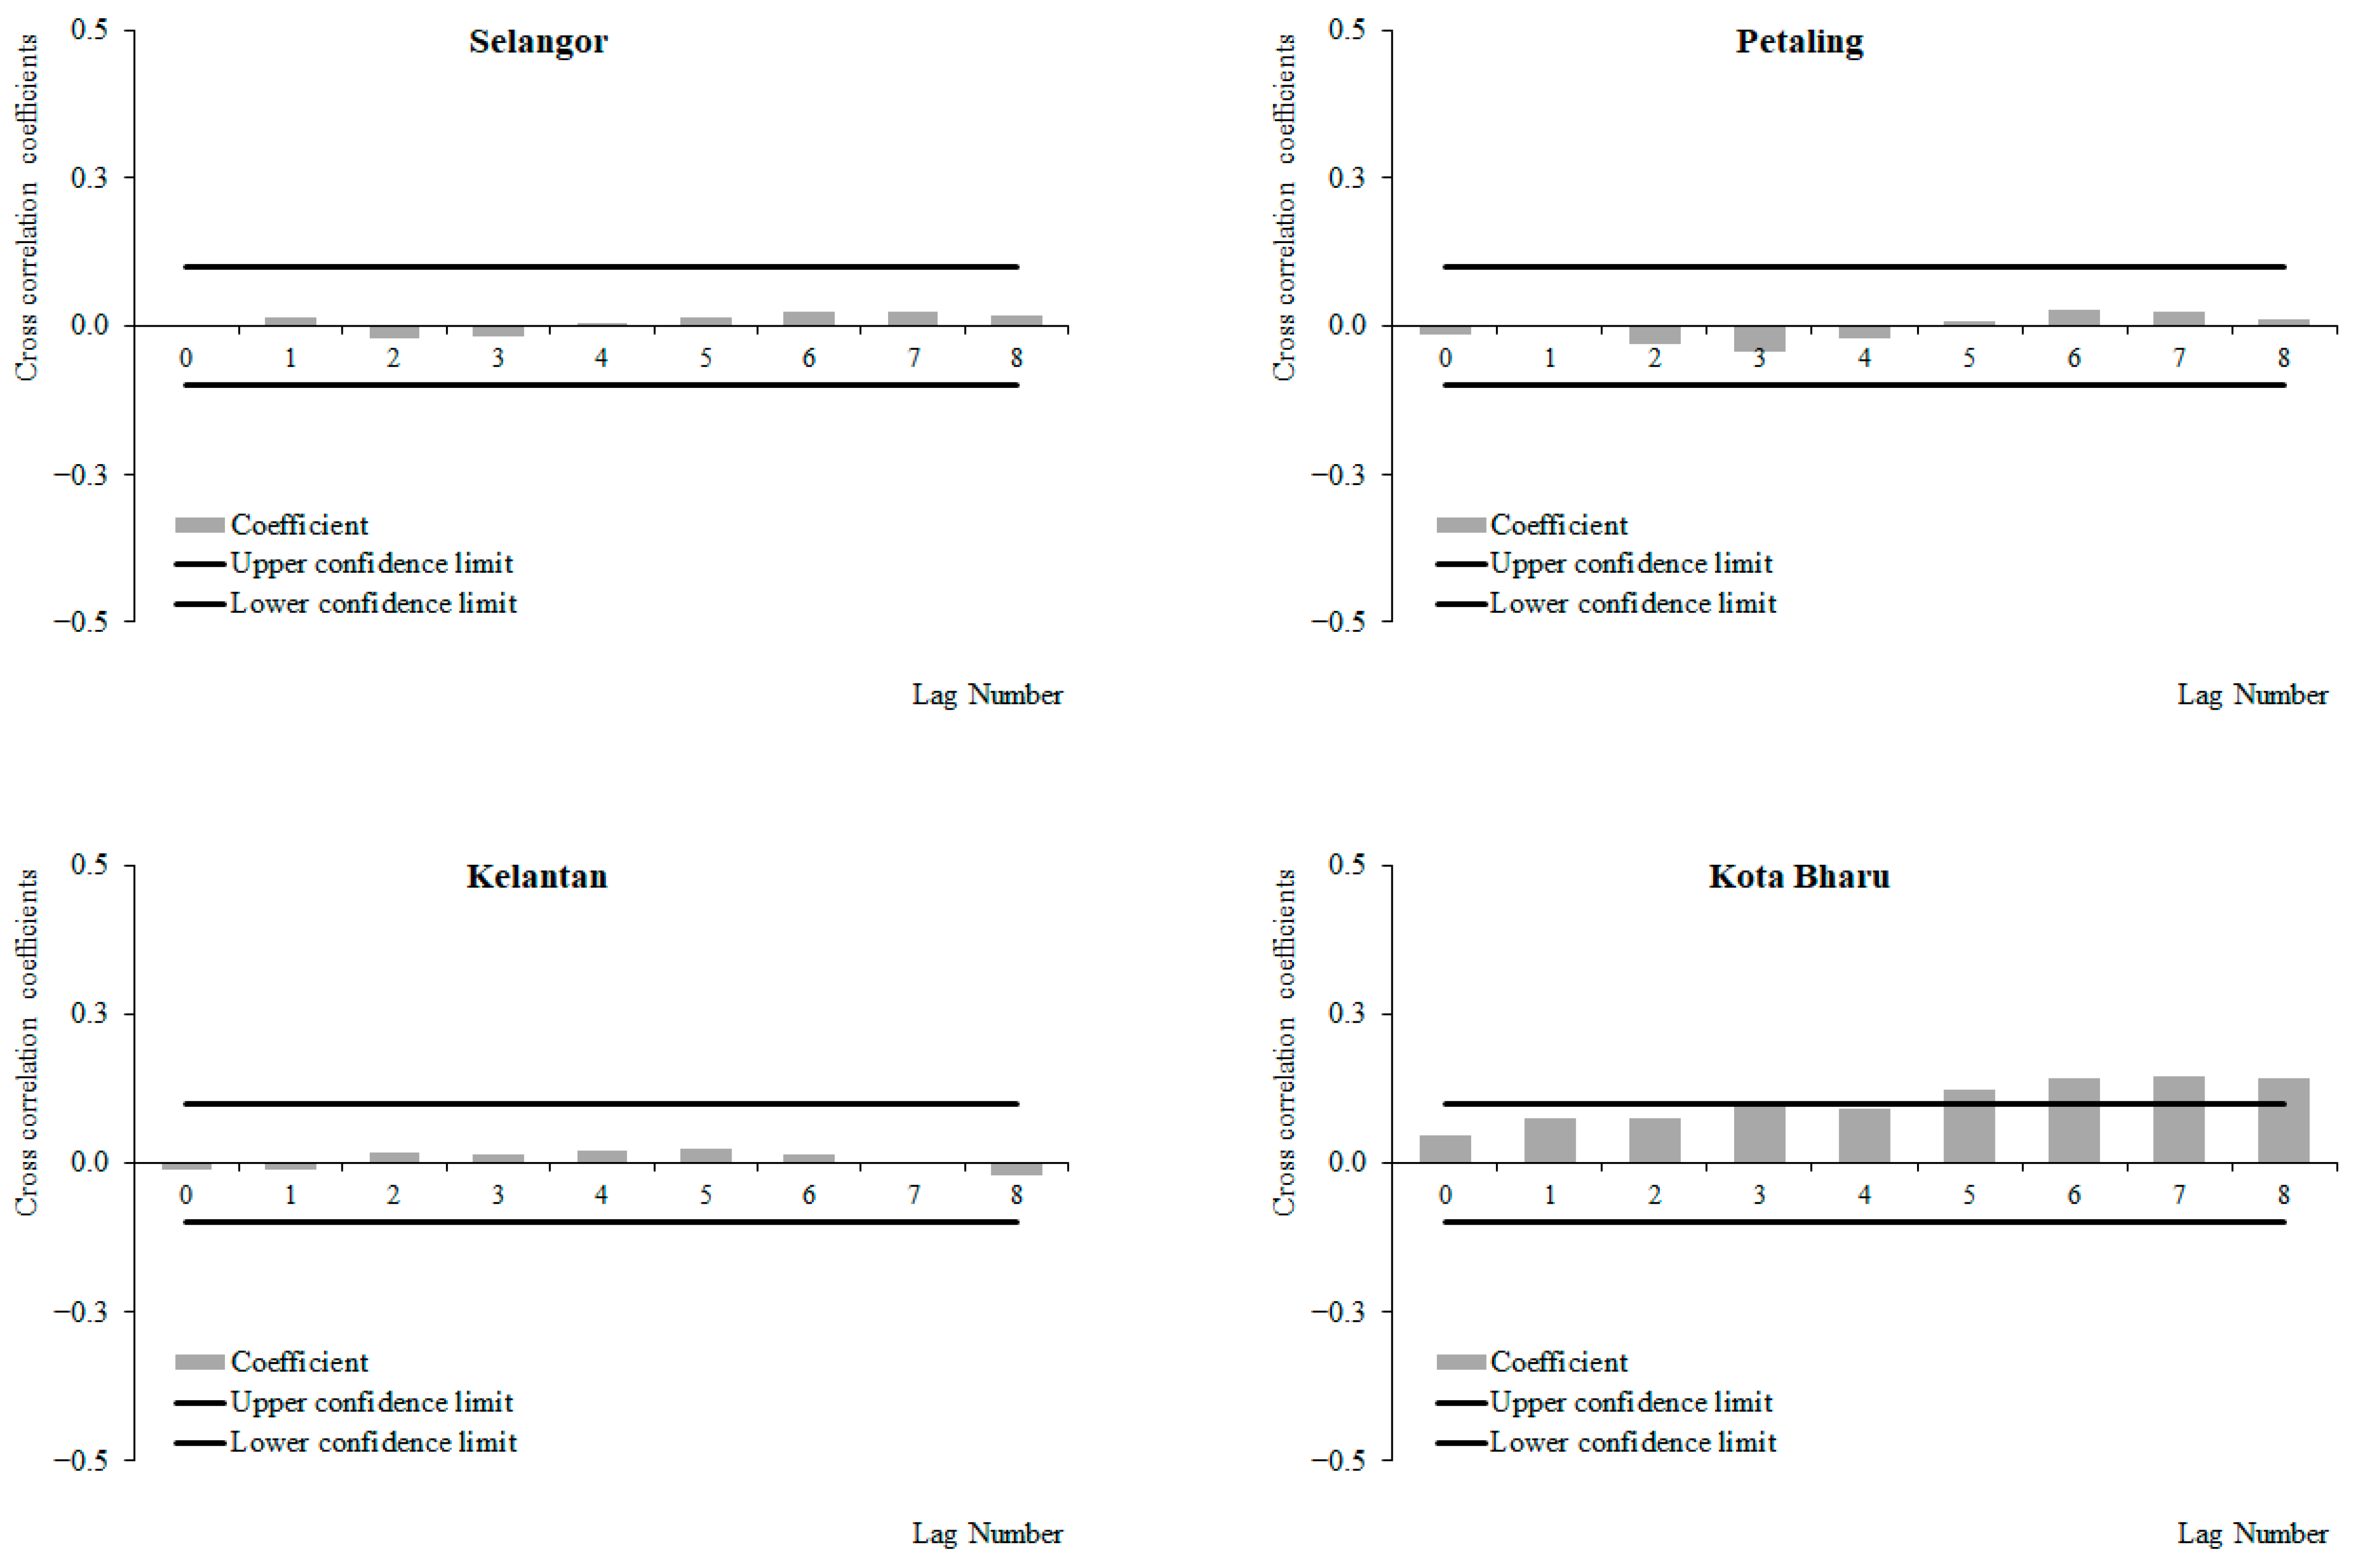
3.2. Cross-Correlation between EO Data (Temperature, Rainfall and Wind Speed) and Dengue Cases
- (a)
- Rainfall and dengue cases
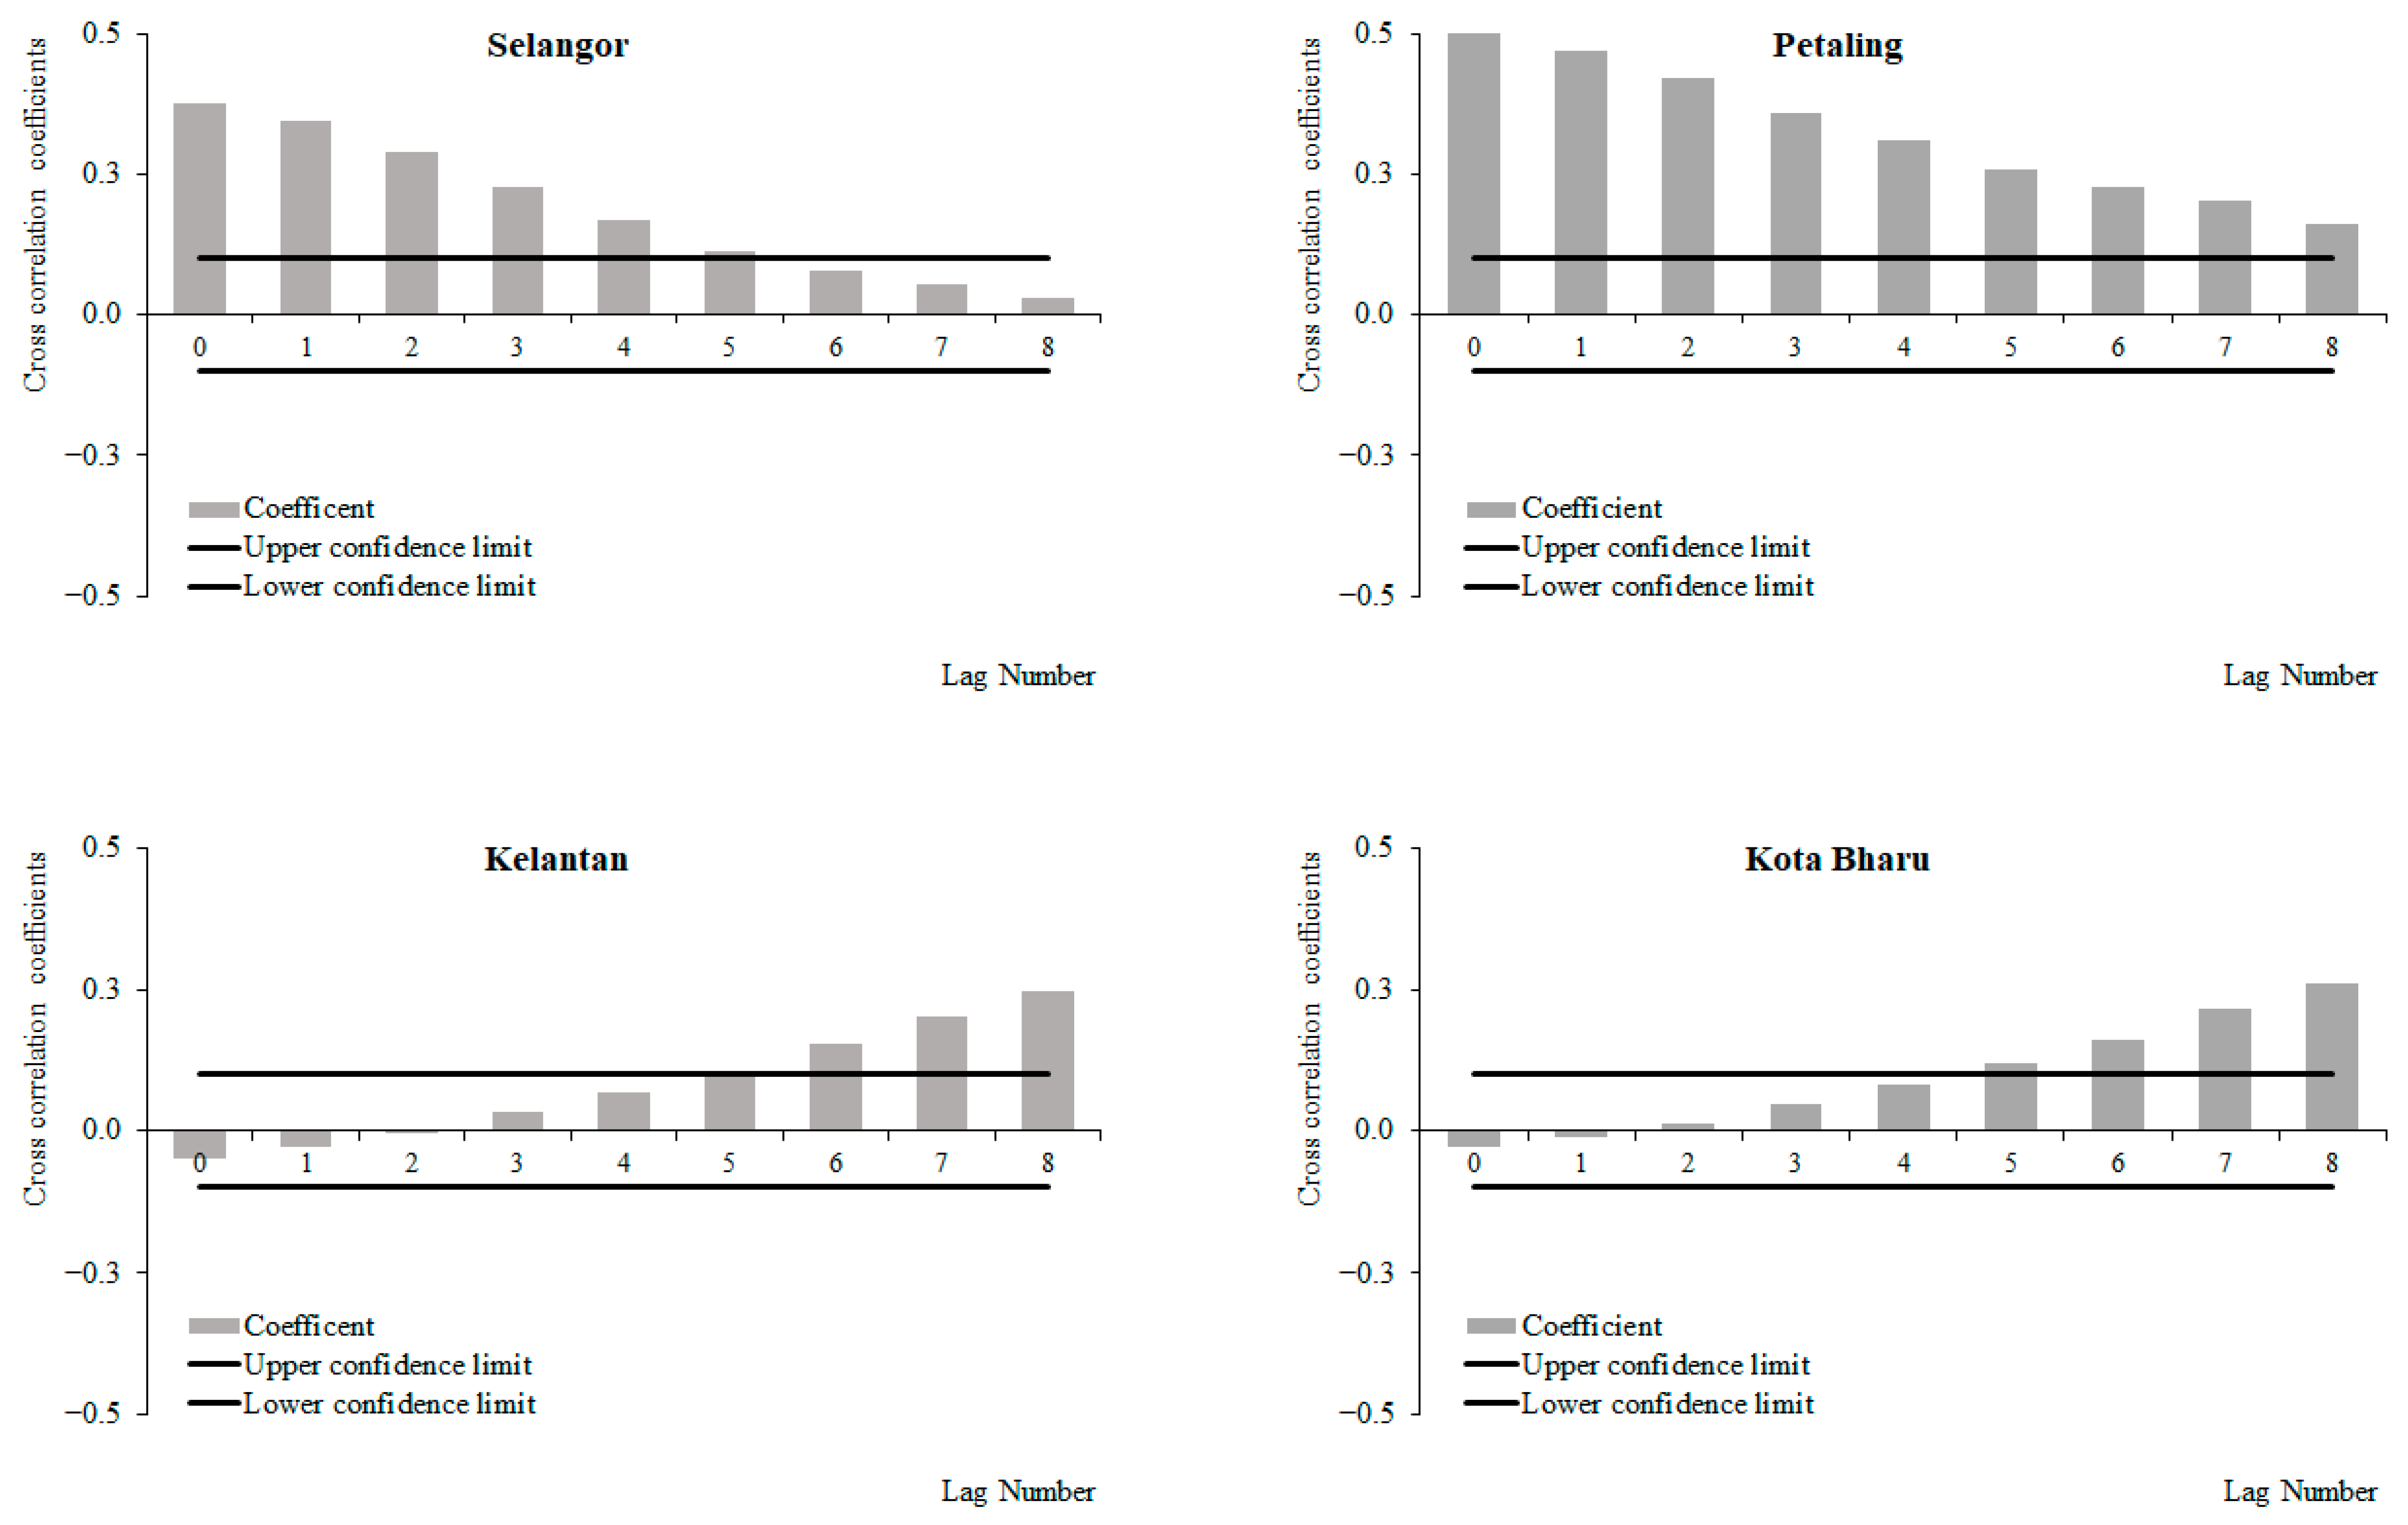
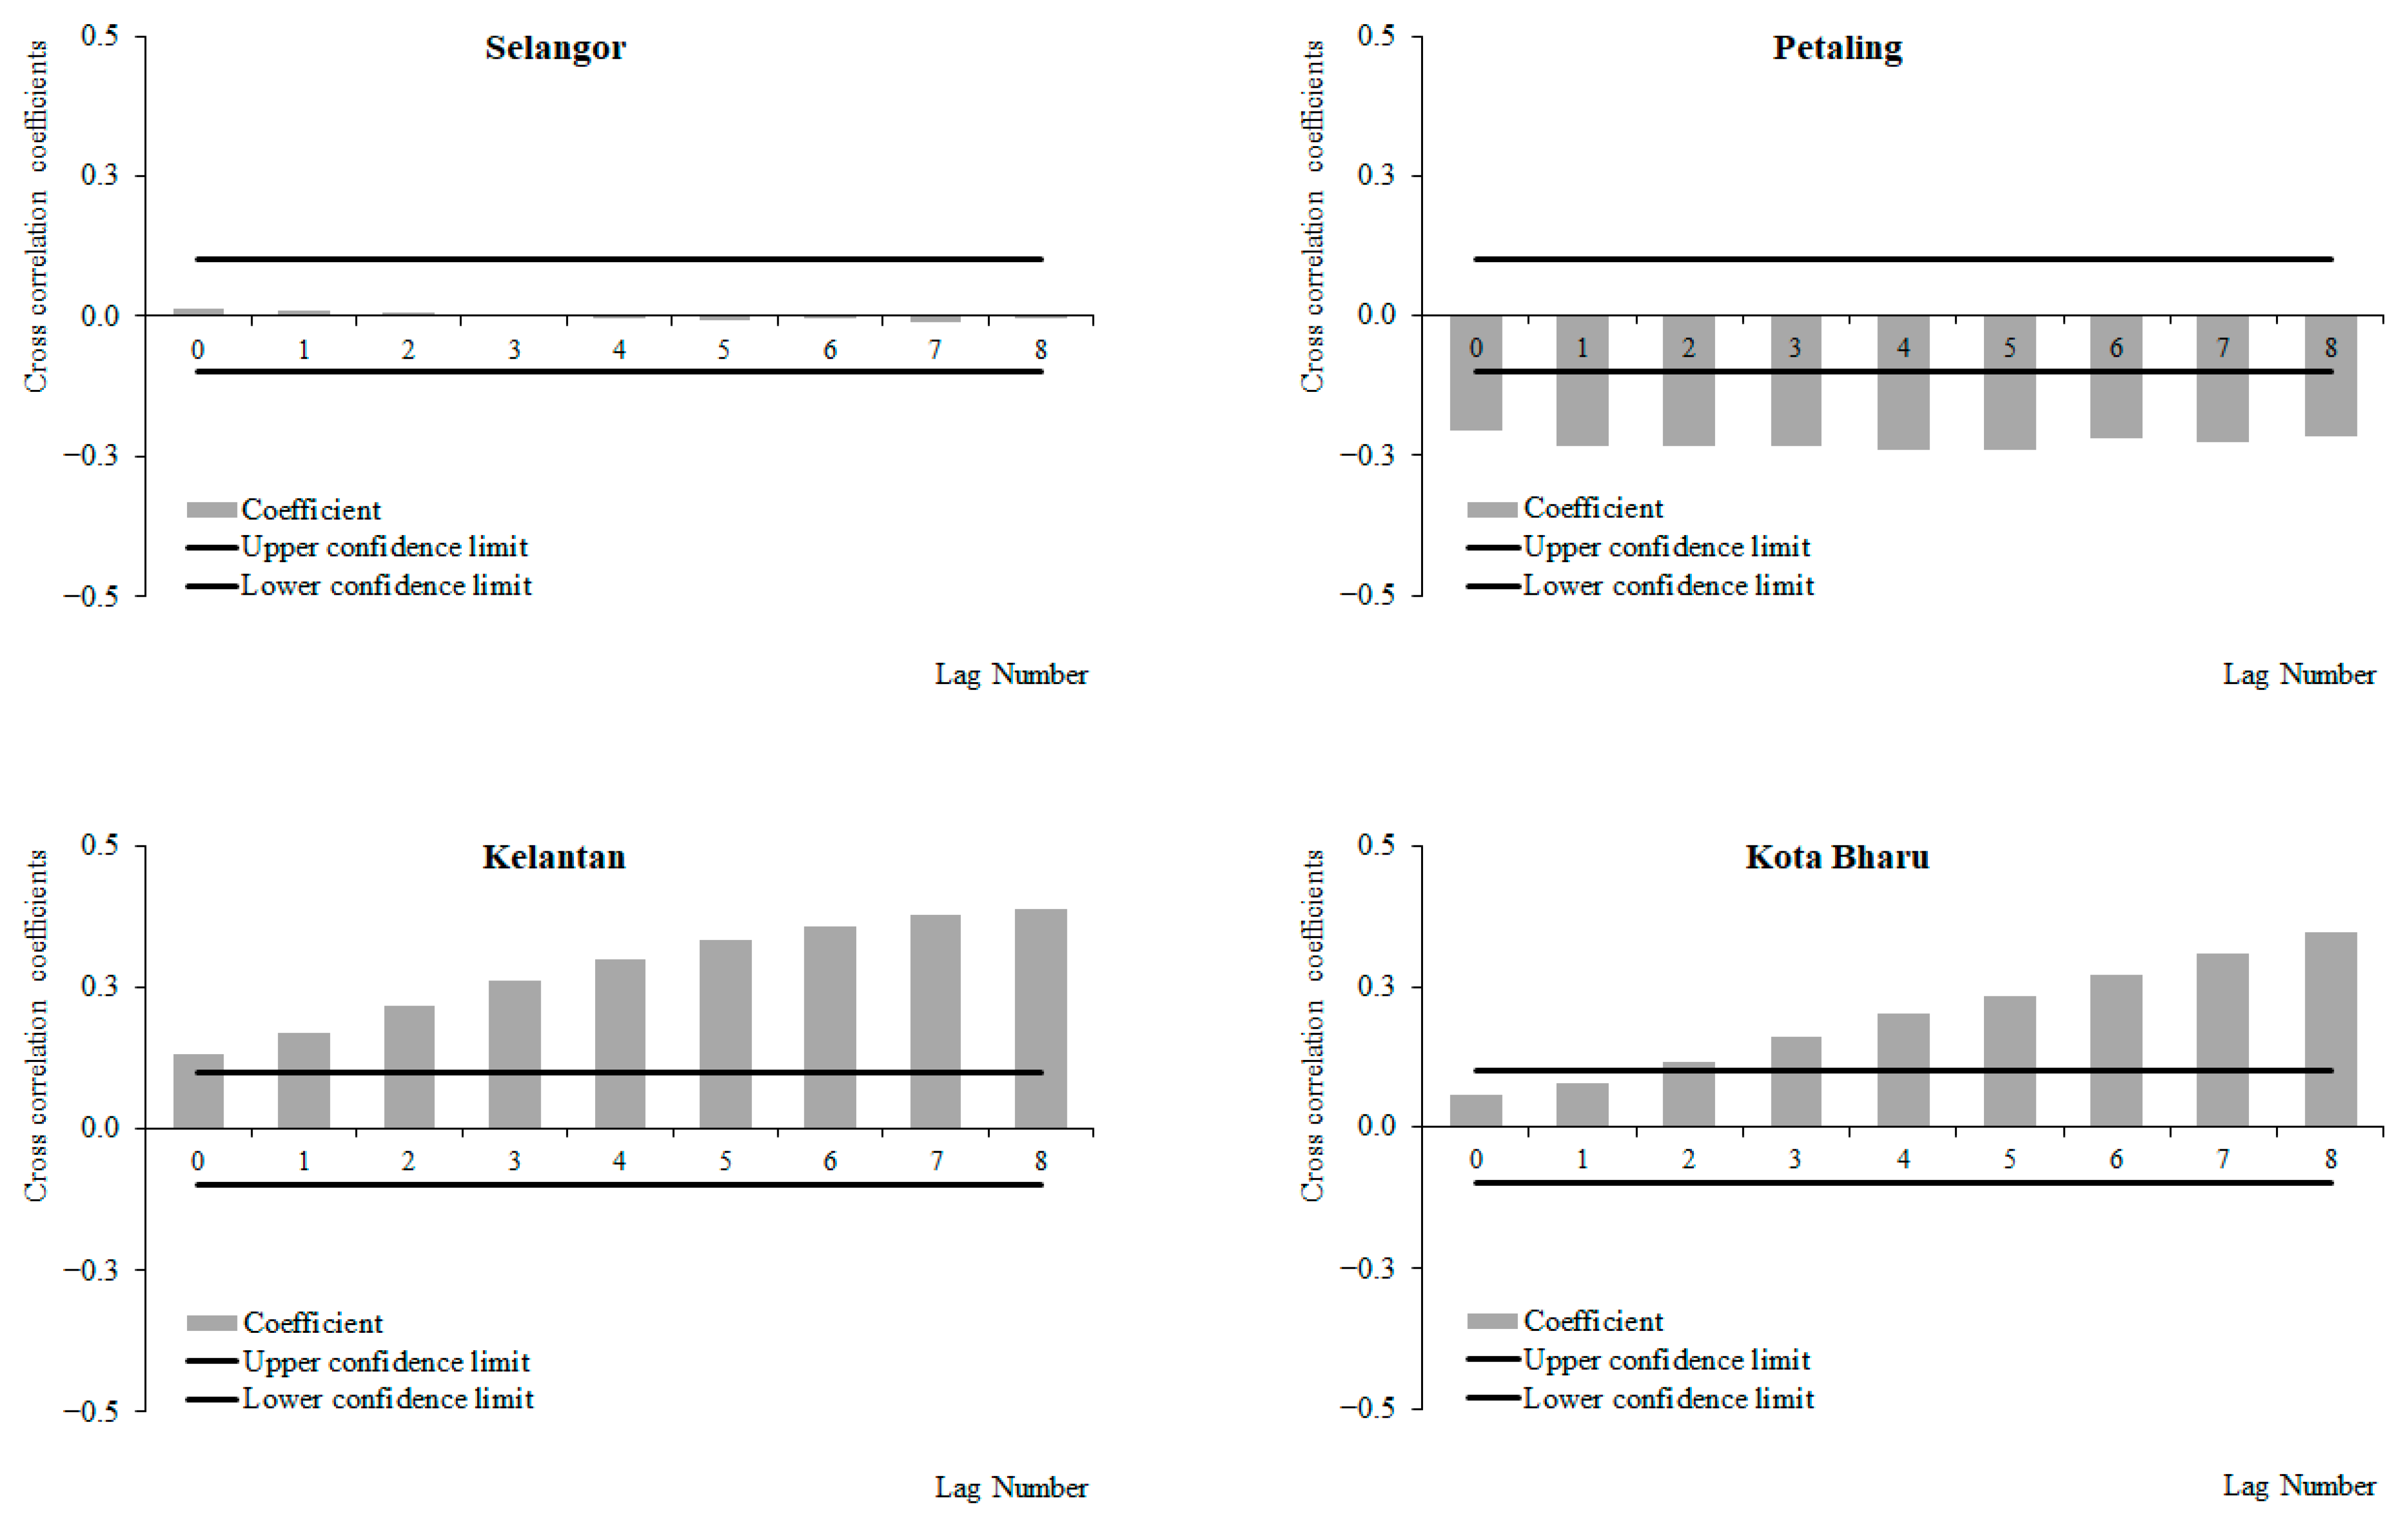
- (b)
- Temperature and dengue cases
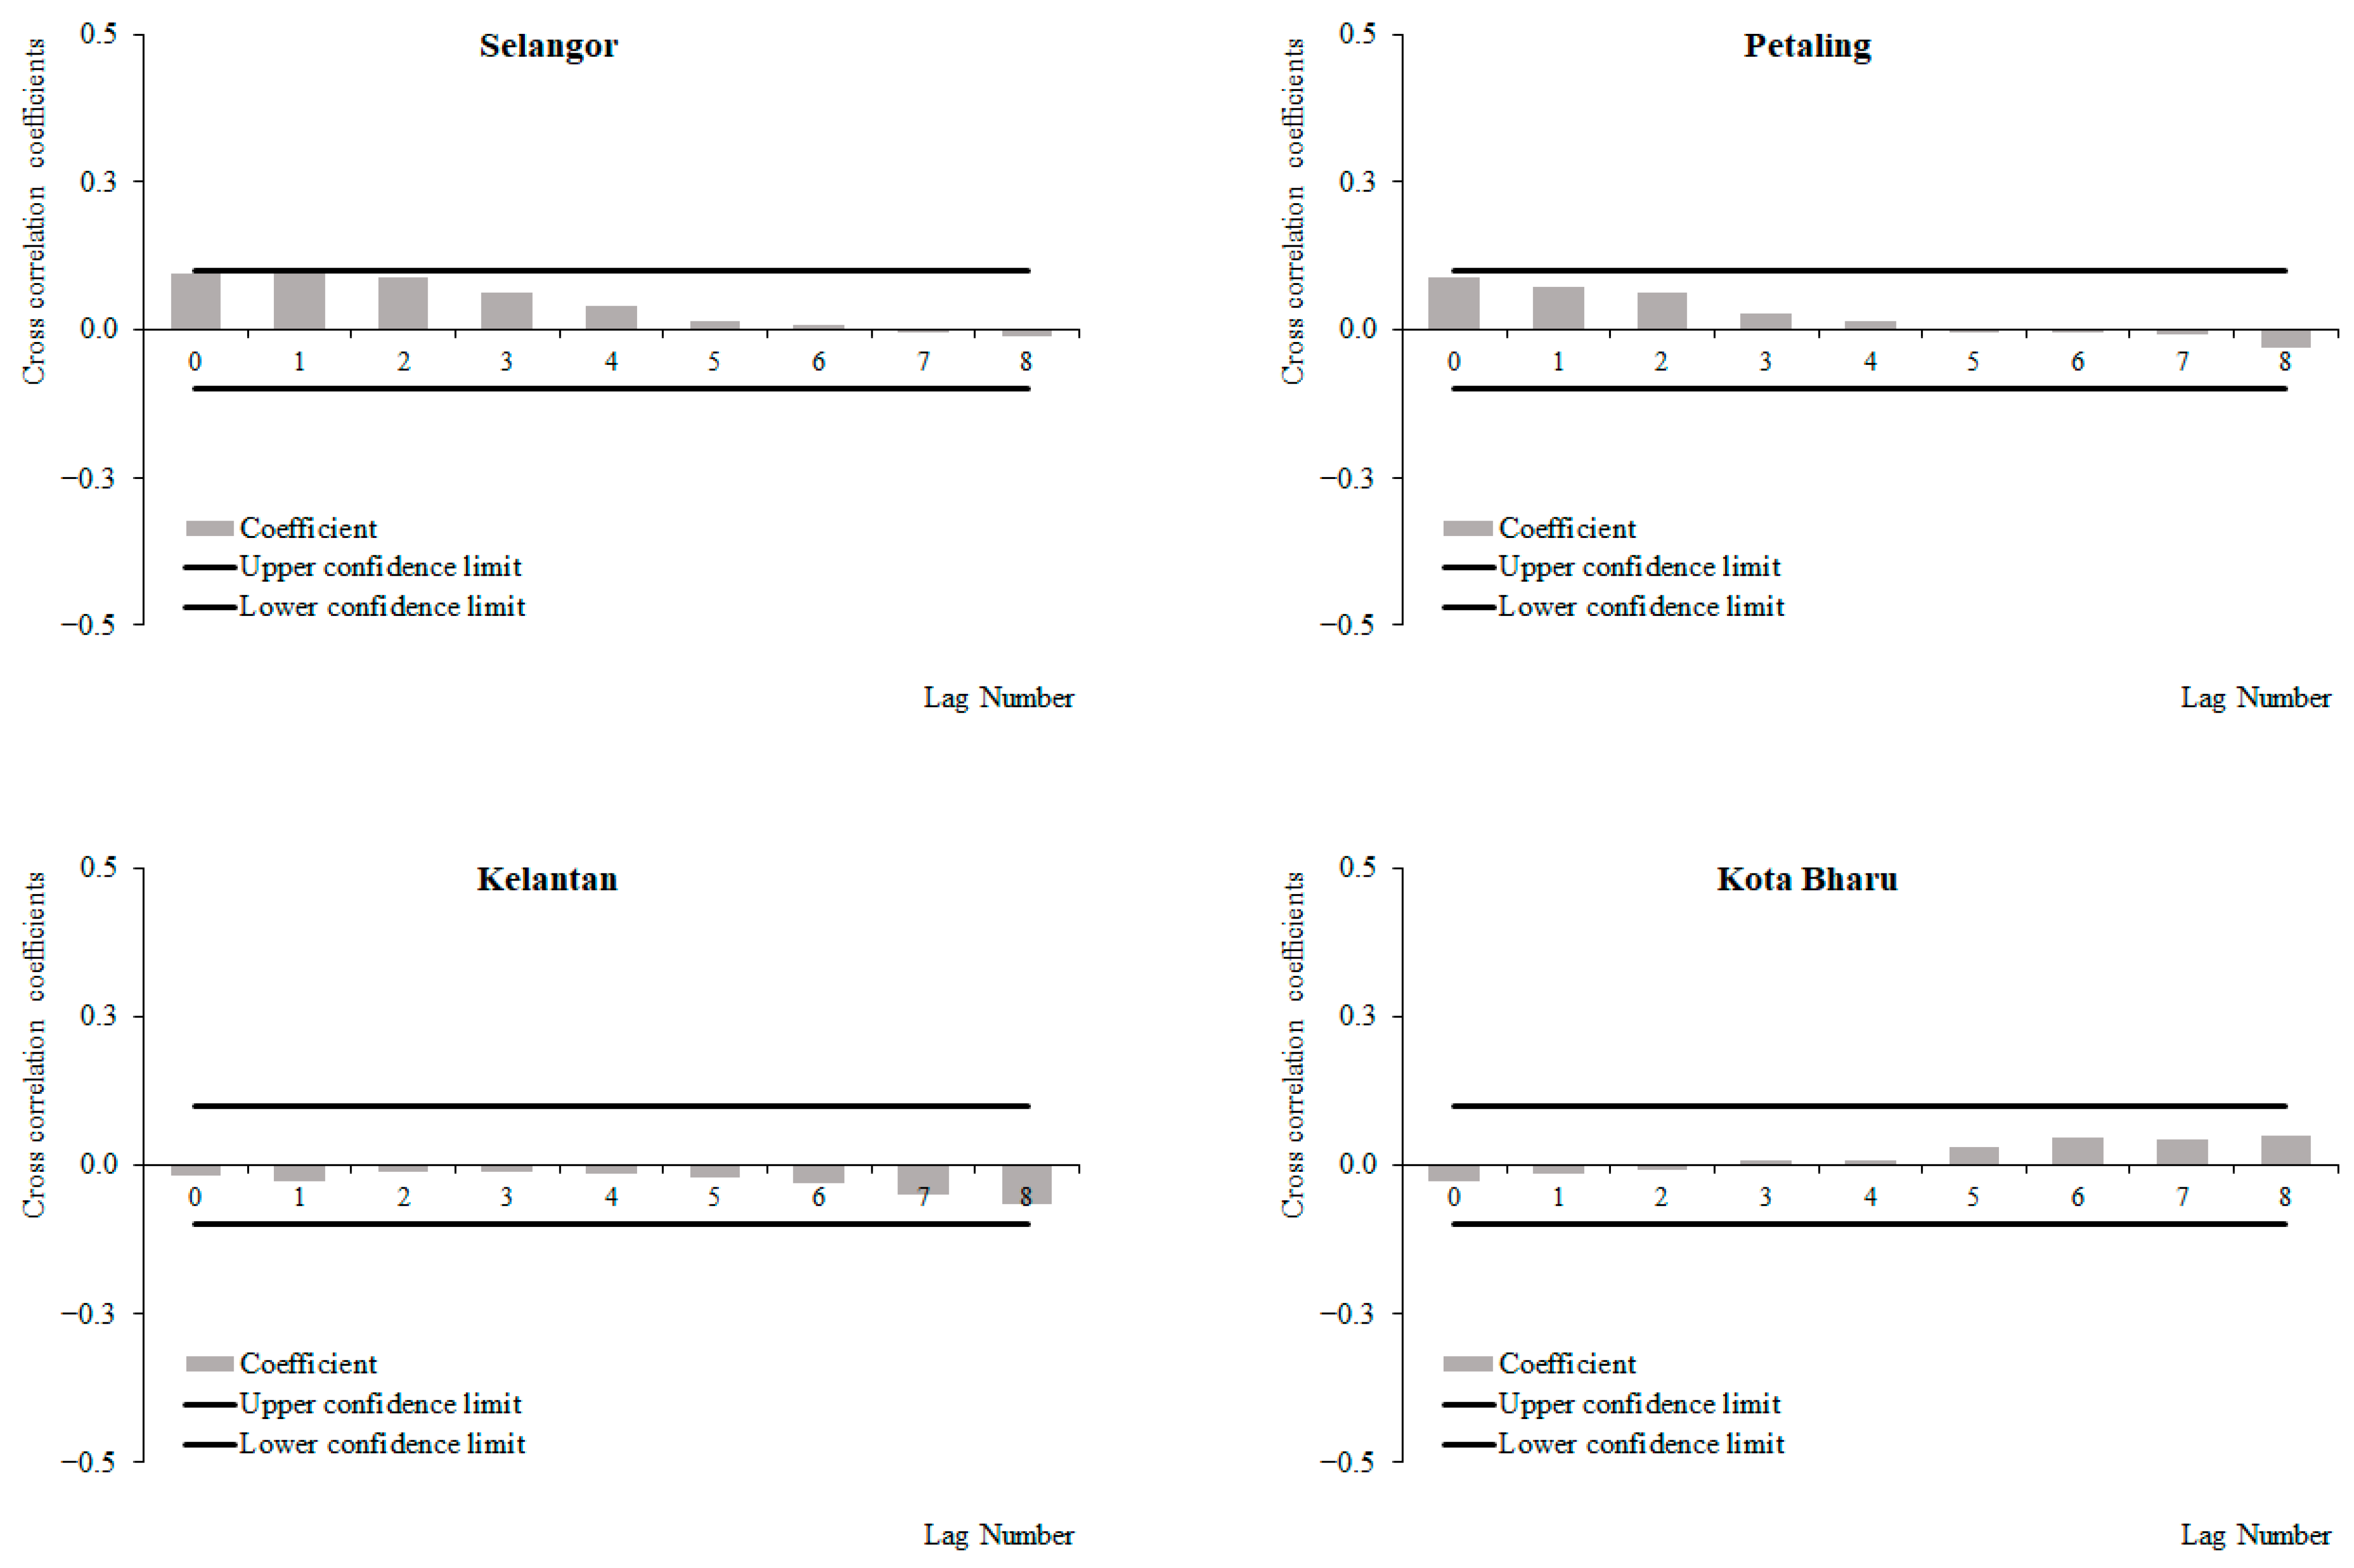
- (c)
- Wind speed and dengue cases
3.3. Multivariate Linear Regression Analysis between Meteorological Variables and Dengue Cases
4. Discussion
4.1. EO-Based and Ground Station Data Correlations
4.2. Correlation between EO-Derived Meteorological Data and Dengue Cases
5. Conclusions
Author Contributions
Funding
Institutional Review Board Statement
Informed Consent Statement
Data Availability Statement
Acknowledgments
Conflicts of Interest
Appendix A


References
- Williams, C.R.; Gill, B.S.; Mincham, G.; Mohd Zaki, A.H.; Abdullah, N.; Mahiyuddin, W.R.W.; Ahmad, R.; Shahar, M.K.; Harley, D.; Viennet, E.; et al. Testing the impact of virus importation rates and future climate change on dengue activity in Malaysia using a mechanistic entomology and disease model. Epidemiol. Infect. 2015, 143, 2856–2864. [Google Scholar] [CrossRef]
- World Health Organization. Dengue and Severe Dengue [Internet]. 2020. Available online: https://www.who.int/news-room/fact-sheets/detail/dengue-and-severe-dengue (accessed on 28 April 2021).
- Cheong, Y.L.; Burkart, K.; Leitão, P.J.; Lakes, T. Assessing weather effects on dengue disease in Malaysia. Int. J. Environ. Res. Public Health 2013, 10, 6319–6334. [Google Scholar] [CrossRef] [PubMed]
- Barbazan, P.; Guiserix, M.; Boonyuan, W.; Tuntaprasart, W.; Pontier, D.; Gonzalez, J.P. Modelling the effect of temperature on transmission of dengue. Med. Vet. Entomol. 2010, 24, 66–73. [Google Scholar] [CrossRef]
- Stewart Ibarra, A.M.; Ryan, S.J.; Beltrán, E.; Mejía, R.; Silva, M.; Muñoz, Á. Dengue vector dynamics (Aedes aegypti) influenced by climate and social factors in ecuador: Implications for targeted control. PLoS ONE 2013, 8, e78263. [Google Scholar]
- Hii, Y.L.; Zaki, R.A.; Aghamohammadi, N.; Rocklöv, J. Research on Climate and Dengue in Malaysia: A Systematic Review. Curr. Environ. Health Rep. 2016, 3, 81–90. [Google Scholar] [CrossRef] [PubMed] [Green Version]
- Colston, J.M.; Ahmed, T.; Mahopo, C.; Kang, G.; Kosek, M.; de Sousa Junior, F.; Shrestha, P.S.; Svensen, E.; Turab, A.; Zaitchik, B.; et al. Evaluating meteorological data from weather stations, and from satellites and global models for a multi-site epidemiological study. Environ. Res. 2018, 165, 91–109. [Google Scholar] [CrossRef] [PubMed]
- World Meteorological Organization (WMO). World Meteorological Organization [Internet]. 2021. Available online: https://public.wmo.int/en (accessed on 28 October 2021).
- Tan, M.L.; Ibrahim, A.L.; Duan, Z.; Cracknell, A.P.; Chaplot, V. Evaluation of six high-resolution satellite and ground-based precipitation products over Malaysia. Remote Sens. 2015, 7, 1504–1528. [Google Scholar] [CrossRef] [Green Version]
- Fatkhuroyan, F.; Wati, T.; Sukmana, A.; Kurniawan, R. Validation of Satellite Daily Rainfall Estimates over Indonesia. Forum Geogr. 2018, 32, 170–180. [Google Scholar] [CrossRef] [Green Version]
- Colón-González, F.J.; Bastos, L.S.; Hofmann, B.; Hopkin, A.; Harpham, Q.; Crocker, T.; Amato, R.; Ferrario, I.; Moschini, F.; James, S.; et al. Probabilistic seasonal dengue forecasting in Vietnam: A modelling study using superensembles. PLoS Med. 2021, 18, e1003542. [Google Scholar] [CrossRef]
- Mudele, O.; Frery, A.C.; Zanandrez, L.F.R.; Eiras, A.E.; Gamba, P. Modeling dengue vector population with earth observation data and a generalized linear model. Acta Trop. 2021, 215, 105809. [Google Scholar] [CrossRef]
- Wong, C.L.; Venneker, R.; Uhlenbrook, S.; Jamil, A.B.M.; Zhou, Y. Variability of rainfall in Peninsular Malaysia. Hydrol. Earth Syst. Sci. Discuss. 2009, 6, 5471–5503. [Google Scholar]
- Gill, B.S. History and Epidemiology of Dengue [Internet]. MOH. 2017. Available online: http://denggi.myhealth.gov.my/history-and-epidemiology-of-dengue/?lang=en (accessed on 4 August 2021).
- DOSM. Current Population Estimates; DOSM: Sibu, Malaysia, 2021. [Google Scholar]
- Earth Engine Data Catalog. GPM: Global Precipitation Measurement (GPM) v6 [Internet]. NASA GES DISC at NASA Goddard Space Flight Center. 2021. Available online: https://developers.google.com/earth-engine/datasets/catalog/NASA_GPM_L3_IMERG_V06 (accessed on 30 June 2021).
- Shannell, F. Moderate Resolution Imaging Spectroradiometer (MODIS) [Internet]. National Aeronautics and Space Administration. 2021. Available online: https://modis.gsfc.nasa.gov/ (accessed on 30 June 2021).
- National Weather Service. The NCEP Climate Forecast System Version 2 (CFSv2) [Internet]. National Centres for Environmental Prediction. 2013. Available online: https://cfs.ncep.noaa.gov/ (accessed on 30 June 2021).
- Gill, B.S. Epidemiology of Dengue in Malaysia from 2005–2010 and Factors Contributing to Its Emergence. Ph.D. Thesis, University of Western Australia, Perth, Australia, 2016. [Google Scholar]
- Arias, J. Central Mass Mosquito Control Project [Internet]. CDC. 2021. Available online: https://www.cmmcp.org/mosquito-surveillance-data/pages/epi-week-calendars-2008-2021 (accessed on 4 August 2021).
- Jurečková, J.; Picek, J. Shapiro-Wilk-type test of normality under nuisance regression and scale. Comput. Stat. Data Anal. 2007, 51, 5184–5191. [Google Scholar] [CrossRef]
- Schober, P.; Schwarte, L.A. Correlation coefficients: Appropriate use and interpretation. Anesth. Analg. 2018, 126, 1763–1768. [Google Scholar] [CrossRef] [PubMed]
- Mudin, R.N. Dengue Incidence and the Prevention and Control Program in Malaysia. Int. Med. J. Malays. 2015, 14, 5–10. [Google Scholar] [CrossRef]
- Malvern, S.F.; Maurice, C. Comparison of Satellite Data and Ground Based Weather Data in Masvingo, Zimbabwe. Environ. Sci. Nat. Resour. 2018, 8, 102–107. [Google Scholar]
- Mohamad, Z.; Bakar, M.Z.A.; Norman, M. Evaluation of satellite based rainfall estimation. IOP Conf. Ser. Earth Environ. Sci. 2021, 620, 2–18. [Google Scholar] [CrossRef]
- Kambi, M.O.C.; Wang, Z.; Gulemvuga, G. Determination of the Correlation between the Air Temperature Measured in Situ and Remotely Sensed Data from MODIS and SEVIRI in Congo-Brazzaville. Atmos. Clim. Sci. 2018, 8, 192–211. [Google Scholar] [CrossRef] [Green Version]
- Benedum, C.M.; Seidahmed, O.M.E.; Eltahir, E.A.B.; Markuzon, N. Statistical modeling of the effect of rainfall flushing on dengue transmission in Singapore. PLoS Negl. Trop. Dis. 2018, 12, e0006935. [Google Scholar] [CrossRef]
- Earnest, A.; Tan, S.B.; Wilder-Smith, A.; MacHin, D. Comparing statistical models to predict dengue fever notifications. Comput. Math. Methods Med. 2012, 2012, 758674. [Google Scholar] [CrossRef]
- Gratz, N.G. Critical review of the vector status of Aedes albopictus. Med. Vet. Entomol. 2004, 18, 215–227. [Google Scholar] [CrossRef]
- Focks, D.; Haile, D.; Daniels, E.; Mount, G. Dynamic life table model for Aedes aegypti (Diptera: Culicidae): Simulation results and validation. J. Med. Entomol. 1993, 30, 1018–1028. [Google Scholar] [CrossRef] [PubMed]
- Lai, Y.H. The climatic factors affecting dengue fever outbreaks in southern Taiwan: An application of symbolic data analysis. Biomed. Eng. Online 2018, 17, 148. [Google Scholar] [CrossRef] [PubMed] [Green Version]
- Seah, A.; Aik, J.; Ng, L.C.; Tam, C.C. The effects of maximum ambient temperature and heatwaves on dengue infections in the tropical city-state of Singapore—A time series analysis. Sci. Total Environ. 2021, 775, 145117. [Google Scholar] [CrossRef]
- Sivan, A.; Shriram, A.N.; Muruganandam, N.; Thamizhmani, R. Expression of heat shock proteins (HSPs) in Aedes aegypti (L.) and Aedes albopictus (Skuse) (Diptera: Culicidae) larvae in response to thermal stress. Acta Trop. 2017, 167, 121–127. [Google Scholar] [CrossRef] [PubMed]
- Tangang, F.T.; Juneng, L.; Ahmad, S. Trend and interannual variability of temperature in Malaysia: 1961–2002. Theor. Appl. Climatol. 2007, 89, 127–141. [Google Scholar] [CrossRef]
- Pham, H.V.; Doan, H.T.M.; Phan, T.T.T.; Tran Minh, N.N. Ecological factors associated with dengue fever in a central highlands province, Vietnam. BMC Infect Dis. 2011, 11, 172. [Google Scholar] [CrossRef]
- Choi, Y.; Tang, C.S.; McIver, L.; Hashizume, M.; Chan, V.; Abeyasinghe, R.R.; Iddings, S.; Huy, R. Effects of weather factors on dengue fever incidence and implications for interventions in Cambodia. BMC Public Health 2016, 16, 241. [Google Scholar] [CrossRef] [PubMed] [Green Version]
- Asia-Pacific Wind Industry. Asia Energy Wind Association-Malaysia [Internet]. 2021. Available online: https://www.asiawind.org/research-data/market-overview/malaysia/ (accessed on 7 December 2021).
- Lu, L.; Lin, H.; Tian, L.; Yang, W.; Sun, J.; Liu, Q. Time series analysis of dengue fever and weather in Guangzhou, China. BMC Public Health 2009, 9, 395–400. [Google Scholar] [CrossRef]
- Yasuoka, J.; Levins, R. Ecology of vector mosquitoes in Sri Lanka—Suggestions for future mosquito control in rice ecosystems. Southeast Asian J. Trop. Med. Public Health 2007, 38, 646–657. [Google Scholar]


| Meteorological Data | Source | Measurement Unit | Resolution (Degrees, Longitude, Latitude) | Ground Area (km) |
|---|---|---|---|---|
| Rainfall | Global Precipitation Measurement (GPM) | Millimetres (mm) | 0.10° × 0.10° | 11.11 × 11.11 |
| Temperature | Moderate Resolution Imaging Spectroradiometer (MODIS) | Celsius (°C) | 0.05° × 0.05° | 5.55 × 5.55 |
| Wind speed | Climate Forecast System version 2 (CFSv2) | Meter per second (m/s) | 0.205° × 0.205° | 22.77 × 22.77 |
| Ground Station | Satellite Coordinate (Lat, Long) | Spearman Correlation | p-Value |
|---|---|---|---|
| Rainfall | |||
| Kota Baharu * | 6.17, 102.29 | 0.736 | <0.001 |
| Kuala Krai ** | 5.53, 102.20 | 0.669 | <0.001 |
| Subang *** | 3.13, 101.55 | 0.702 | <0.001 |
| Sepang **** | 2.74, 101.71 | 0.641 | <0.001 |
| Temperature | |||
| Kota Baharu * | 6.17, 102.29 | 0.838 | <0.001 |
| Kuala Krai ** | 5.53, 102.20 | 0.797 | <0.001 |
| Subang *** | 3.13, 101.55 | 0.724 | <0.001 |
| Sepang **** | 2.74, 101.71 | 0.757 | <0.001 |
| Wind speed | |||
| Kota Baharu * | 6.17, 102.29 | 0.742 | <0.001 |
| Subang *** | 3.13, 101.55 | 0.658 | <0.001 |
| Sepang **** | 2.74, 101.71 | 0.519 | <0.001 |
| Dengue Cases and Rainfall | ||||
|---|---|---|---|---|
| Area/Duration | Highest Correlation | Lag | Direction of Correlation | Significance |
| 2011 to 2019 | ||||
| Selangor | 0.223 | 8 | Positive, increasing with increasing lags | Significant at lag 4 onwards |
| Petaling | 0.155 | 8 | Positive, increasing with increasing lags | Significant at lag 6 onwards |
| Kelantan | 0.015 | 6 | No obvious pattern | Non-significant |
| Kota Baharu | 0.018 | 6 | No obvious pattern | Non-significant |
| 2011 to 2014 | ||||
| Selangor | 0.060 | 7 | Positive with increasing lags | Non-significant |
| Petaling | 0.045 | 3 | Positive with increasing lags | Non-significant |
| Kelantan | −0.069 | 4 | Negative with increasing lags | Non-significant |
| Kota Baharu | −0.024 | 0 | Negative with increasing lags | Non-significant |
| 2015 to 2019 | ||||
| Selangor | 0.304 | 8 | Positive with increasing lags | Significant at lag 5 onwards |
| Petaling | 0.181 | 8 | Positive with increasing lags | Significant at lag 7 onwards |
| Kelantan | 0.181 | 8 | Positive with increasing lags | Significant at lag 4 onwards |
| Kota Baharu | 0.142 | 6 | Positive with increasing lags | Significant at lag 2 onwards |
| Dengue Cases and Temperature | ||||
| Area/Duration | Highest Correlation | Lag | Direction of Correlation | Significance |
| 2011 to 2019 | ||||
| Selangor | −0.090 | 8 | Negative with increasing lags | Non-significant |
| Petaling | −0.217 | 8 | Negative with increasing lags | Significant at lag 3 |
| Kelantan | 0.294 | 8 | Positive with increasing lags | Significant at lag 2 |
| Kota Baharu | 0.227 | 8 | Positive with increasing lags | Significant at lag 5 |
| 2011 to 2014 | ||||
| Selangor | −0.01 | 7 | Negative with increasing lags | Non-significant |
| Petaling | −0.240 | 4 | Negative with increasing lags | Significant at lag 0 |
| Kelantan | 0.388 | 8 | Positive with increasing lags | Significant at lag 0 |
| Kota Baharu | 0.346 | 8 | Positive with increasing lags | Significant at lag 2 |
| 2015 to 2019 | ||||
| Selangor | 0.376 | 0 | Positive, decreasing with increasing lags | Significant at lag 0 |
| Petaling | 0.511 | 0 | Positive, decreasing with increasing lags | Significant at lag 0 |
| Kelantan | 0.247 | 8 | Positive with increasing lags | Significant at lag 6 |
| Kota Baharu | 0.260 | 8 | Positive with increasing lags | Significant at lag 5 |
| Dengue Cases and Wind Speed | ||||
| Area/Duration | Highest Correlation | Lag | Direction of Correlation | Significance |
| 2011 to 2019 | ||||
| Selangor | 0.096 | 0 | Positive, decreasing with increasing lags | Non-significant |
| Petaling | 0.088 | 0 | Positive, decreasing with increasing lags | Non-significant |
| Kelantan | −0.065 | 8 | Negative with increasing lags | Non-significant |
| Kota Baharu | 0.049 | 8 | Negative with increasing lags | Non-significant |
| 2011 to 2014 | ||||
| Selangor | 0.025 | 7 | No obvious pattern | Non-significant |
| Petaling | −0.042 | 3 | No obvious pattern | Non-significant |
| Kelantan | 0.022 | 4 | No obvious pattern | Non-significant |
| Kota Baharu | 0.146 | 7 | Positive with increasing lags | Significant at lag 5 |
| 2015 to 2019 | ||||
| Selangor | 0.134 | 2 | Positive, decreasing with increasing lags | Significant at lag 0 |
| Petaling | 0.148 | 0 | Positive, decreasing with increasing lags | Significant at lag 0 |
| Kelantan | −0.172 | 8 | Negative with increasing lags | Significant at lag 6 |
| Kota Baharu | −0.206 | 1 | Negative with increasing lags | Significant at lag 0 |
| Model | Unstandardized Coefficients | Standardized Coefficients | t | Sig. | |
|---|---|---|---|---|---|
| B | Std. Error | Beta | |||
| (Constant) | 5.249 | 0.626 | 8.384 | 0.000 | |
| Selangor_Rain | −0.008 | 0.001 | −0.806 | −6.339 | 0.000 * |
| Selangor_Temp | −0.076 | 0.023 | −0.409 | −3.243 | 0.002 * |
| Selangor_Wind | 0.014 | 0.037 | 0.046 | 0.389 | 0.699 |
Publisher’s Note: MDPI stays neutral with regard to jurisdictional claims in published maps and institutional affiliations. |
© 2022 by the authors. Licensee MDPI, Basel, Switzerland. This article is an open access article distributed under the terms and conditions of the Creative Commons Attribution (CC BY) license (https://creativecommons.org/licenses/by/4.0/).
Share and Cite
Singh, S.; Herng, L.C.; Sulaiman, L.H.; Wong, S.F.; Jelip, J.; Mokhtar, N.; Harpham, Q.; Tsarouchi, G.; Gill, B.S. The Effects of Meteorological Factors on Dengue Cases in Malaysia. Int. J. Environ. Res. Public Health 2022, 19, 6449. https://doi.org/10.3390/ijerph19116449
Singh S, Herng LC, Sulaiman LH, Wong SF, Jelip J, Mokhtar N, Harpham Q, Tsarouchi G, Gill BS. The Effects of Meteorological Factors on Dengue Cases in Malaysia. International Journal of Environmental Research and Public Health. 2022; 19(11):6449. https://doi.org/10.3390/ijerph19116449
Chicago/Turabian StyleSingh, Sarbhan, Lai Chee Herng, Lokman Hakim Sulaiman, Shew Fung Wong, Jenarun Jelip, Norhayati Mokhtar, Quillon Harpham, Gina Tsarouchi, and Balvinder Singh Gill. 2022. "The Effects of Meteorological Factors on Dengue Cases in Malaysia" International Journal of Environmental Research and Public Health 19, no. 11: 6449. https://doi.org/10.3390/ijerph19116449