
Predictive Utility of Composite Child Feeding Indices (CCFIs) for Child Nutritional Status: Comparative Analyses for the Most Suitable Formula for Constructing an Optimum CCFI


Abstract
:1. Introduction
2. Methods
2.1. Study Setting
2.2. Study Design and Population of Interest
2.3. Sample Size and Sampling Procedures
2.4. Data Collection Procedures and Instrument
2.5. Construction of Various Composite Child Feeding Indices (CCFIs)
2.6. Measures of Child Nutritional Status
2.7. Independent Variables
2.8. Measurement of Infant and Young Child Feeding (IYCF) Practices
2.9. Statistical Analyses
2.10. Ethical Clearance and Community Entry Protocols
3. Results
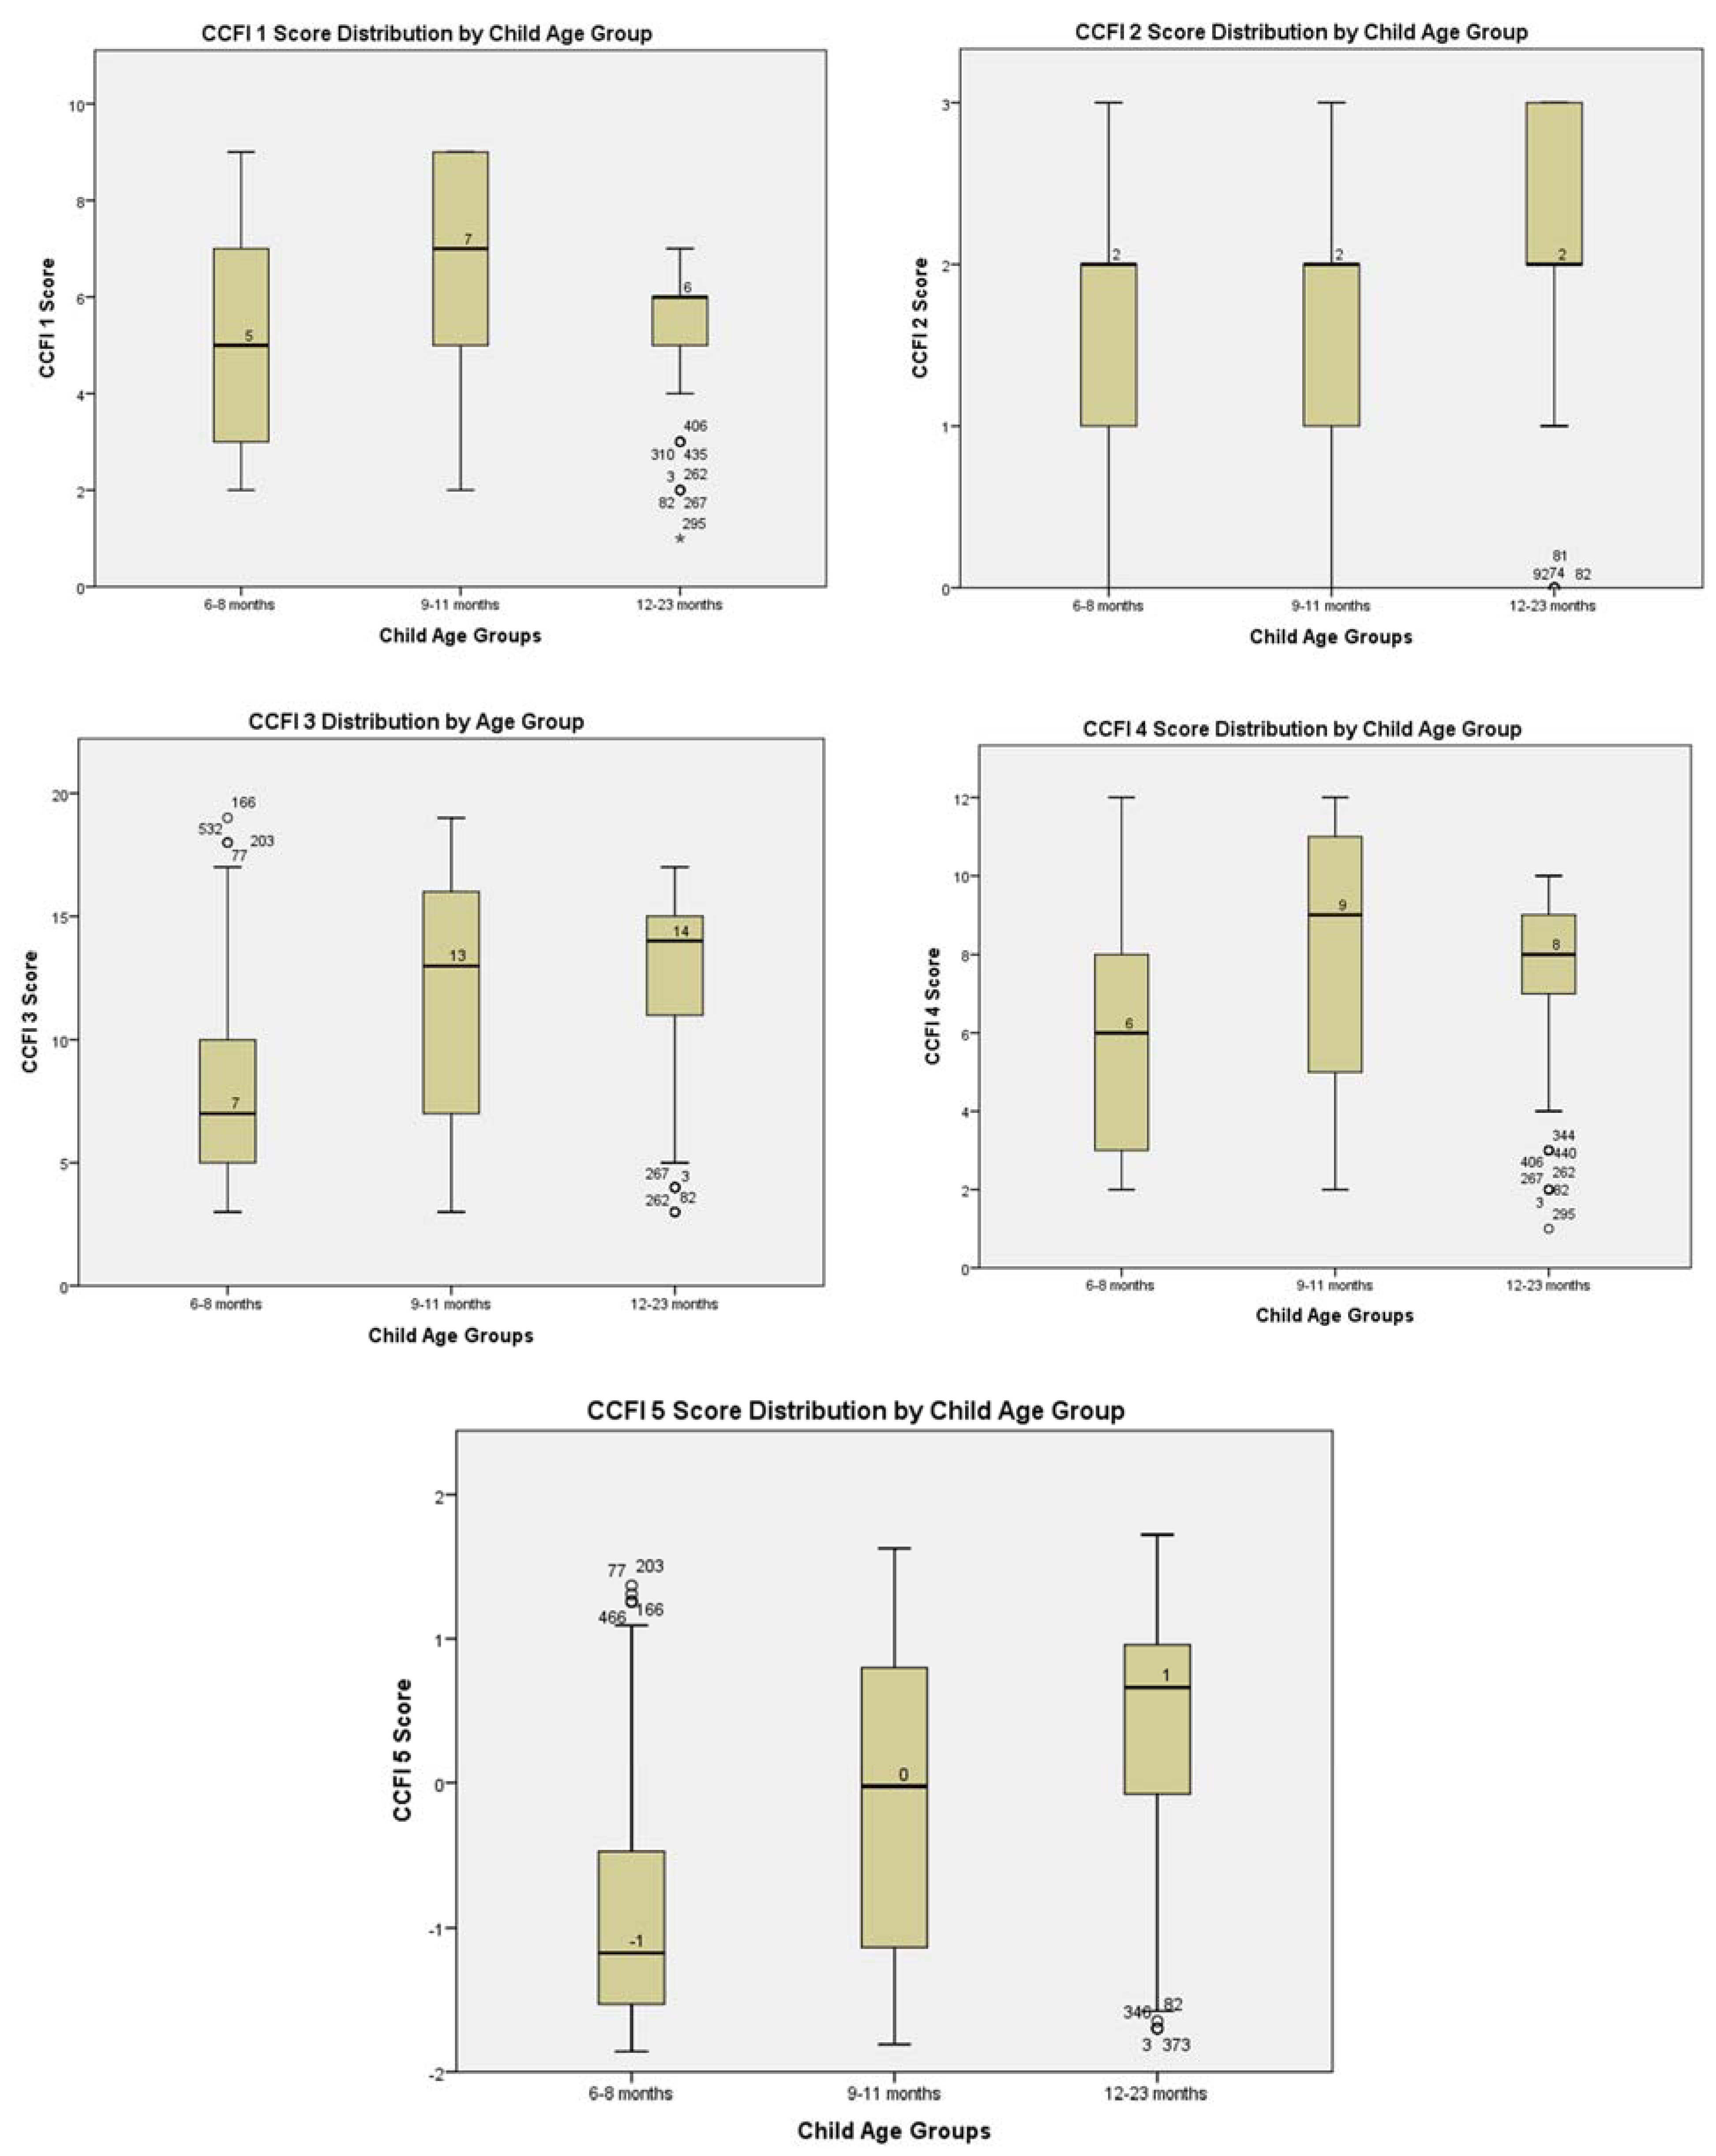
3.1. Distribution of the CFFI Scores
3.2. Comparative Analyses of the Predictive Utility of CCFIs for Child Nutritional Status
3.3. Validity and Reliability Analyses of the Statistically Significant CCFIs
3.4. Sensitivity Analyses and Model Predictive Performance of Statistically Significant CCFIs
4. Discussion
4.1. Validity and Reliability of Significantly Predictive CCFIs
4.2. Strengths and Limitations
5. Conclusions and Recommendations
Supplementary Materials
Author Contributions
Funding
Institutional Review Board Statement
Informed Consent Statement
Data Availability Statement
Acknowledgments
Conflicts of Interest
Appendix A

| CCFI | Components | Age Group Scoring | Remarks | ||
|---|---|---|---|---|---|
| 6–8 | 9–11 | 12–23 | |||
| CCFI 5 | 1, 2, 3, 4, 5, 6, 7, 8, 9,10, 11, 12, 13 | Same as CCFI 3 plus ACF (yes = 1, no = 0); CoF (yes = 1, no = 0), PLF α(Yes = 0, No = 2), β(Yes = 0, No = 3); 13TIBF/EIBF (Yes = 1, No = 0) | Same as CCFI 3 plus ACF (yes = 1, no = 0); CoF (yes = 1, no = 0), PLF α(Yes = 0, No = 2), β(Yes = 0, No = 3); 13TIBF/EIBF (Yes = 1, No = 0) | Same as CCFI 3 plus ACF (yes = 1, no = 0); CoF (yes = 1, no = 0), PLF α(Yes = 0, No = 2), β(Yes = 0, No = 3); 13TIBF/EIBF (Yes = 1, No = 0) | Child food intake components that exhibited collinearity with other components were excluded. |
| Maximum Total Score | Eigenvalues | Eigenvalues | Eigenvalues | ||
References
- Black, R.E.; Victora, C.G.; Walker, S.P.; Bhutta, Z.A.; Christian, P.; de Onis, M.; Ezzati, M.; Grantham-McGregor, S.; Katz, J.; Martorell, R.; et al. Maternal and child undernutrition and overweight in low-income and middle-income countries. Lancet 2013, 382, 427–451. [Google Scholar] [CrossRef]
- Prentice, A.M.; Ward, K.A.; Goldberg, G.R.; Jarjou, L.M.; Moore, S.E.; Fulford, A.J.; Prentice, A. Critical windows for nutritional interventions against stunting. Am. J. Clin. Nutr. 2013, 97, 911–918. [Google Scholar] [CrossRef] [PubMed] [Green Version]
- Prendergast, A.J.; Humphrey, J.H. The stunting syndrome in developing countries. Paediatr. Int. Child Health 2014, 34, 250–265. [Google Scholar] [CrossRef] [PubMed] [Green Version]
- Victora, C.G.; de Onis, M.; Hallal, P.C.; Blössner, M.; Shrimpton, R. Worldwide timing of growth faltering: Revisiting implications for interventions. Pediatrics 2010, 125, e473–e780. [Google Scholar] [CrossRef] [Green Version]
- Shrimpton, R.; Victora, C.G.; de Onis, M.; Lima, R.C.; Blössner, M.; Clugston, G. Worldwide timing of growth faltering: Implications for nutritional interventions. Pediatrics 2001, 107, E75. [Google Scholar] [CrossRef] [Green Version]
- WHO; UNICEF; IFPRI; UCDavis; FANTA; AED; USAID. Indicators for Assessing Infants and Young Child Feeding Practices: Part 1—Definitions; USAID: Washington DC, USA, 2008.
- WHO; UNICEF; IFPRI; UCDavis; FANTA; AED/USAID. Indicators for Assessing Infant and Young Child Feeding Practices. Part 2: Measurement; World Health Organization: Geneva, Switzerland, 2010.
- Daelmans, B.; Dewey, K.; Arimond, M. New and updated indicators for assessing infant and young child feeding. Food Nutr. Bull. 2009, 30, S256–S262. [Google Scholar] [CrossRef] [Green Version]
- Croft, T.N.; Aileen, M.J.M.; Courtney, K.A. Guide to DHS Statistic: DHS-7; ICF: Rockville, MD, USA, 2018. [Google Scholar]
- Ruel, M.T. Measuring Infant and Young Child Complementary Feeding Practices: Indicators, Current Practice, and Research Gaps. Nestle Nutr. Inst. Workshop Ser. 2017, 87, 73–87. [Google Scholar] [CrossRef]
- Anin, S.K.; Saaka, M.; Fischer, F.; Kraemer, A. Association between Infant and Young Child Feeding (IYCF) Indicators and the Nutritional Status of Children (6–23 Months) in Northern Ghana. Nutrients 2020, 12, 2565. [Google Scholar] [CrossRef]
- Wondafrash, M.; Huybregts, L.; Lachat, C.; Bouckaert, K.P.; Kolsteren, P. Feeding practices and growth among young children during two seasons in rural Ethiopia. BMC Nutr. 2017, 3, 39. [Google Scholar] [CrossRef] [Green Version]
- Campbell, R.K.; Aguayo, V.M.; Kang, Y.; Dzed, L.; Joshi, V.; Waid, J.; Gupta, S.D.; Haselow, N.; West, K.P. Infant and young child feeding practices and nutritional status in Bhutan. Matern. Child Nutr. 2018, 14, e12580. [Google Scholar] [CrossRef]
- Ruel, M.T.; Menon, P. Child feeding practices are associated with child nutritional status in Latin America: Innovative uses of the demographic and health surveys. J. Nutr. 2002, 132, 1180–1187. [Google Scholar] [CrossRef] [PubMed] [Green Version]
- Lohia, N.; Udipi, S.A. Infant and child feeding index reflects feeding practices, nutritional status of urban slum children. BMC Pediatr. 2014, 14, 290. [Google Scholar] [CrossRef] [PubMed] [Green Version]
- Ma, J.-Q.; Zhou, L.-L.; Hu, Y.-Q.; Liu, J.-R.; Liu, S.-S.; Zhang, J.; Sheng, X.-Y. A summary index of infant and child feeding practices is associated with child growth in urban Shanghai. BMC Public Health 2012, 12, 568. [Google Scholar] [CrossRef] [PubMed] [Green Version]
- Sawadogo, P.S.; Martin-Prével, Y.; Savy, M.; Kameli, Y.; Traissac, P.; Traoré, A.S.; Delpeuch, F. An infant and child feeding index is associated with the nutritional status of 6- to 23-month-old children in rural Burkina Faso. J. Nutr. 2006, 136, 656–663. [Google Scholar] [CrossRef] [PubMed] [Green Version]
- Archer, E.; Lavie, C.J.; Hill, J.O. The Failure to Measure Dietary Intake Engendered a Fictional Discourse on Diet-Disease Relations. Front. Nutr. 2018, 5, 105. [Google Scholar] [CrossRef] [PubMed] [Green Version]
- Raiten, D.J.; Bremer, A.A. Exploring the Nutritional Ecology of Stunting: New Approaches to an Old Problem. Nutrients 2020, 12, 371. [Google Scholar] [CrossRef] [Green Version]
- Fardet, A.; Rock, E. From a Reductionist to a Holistic Approach in Preventive Nutrition to Define New and More Ethical Paradigms. Healthcare 2015, 3, 1054–1063. [Google Scholar] [CrossRef] [Green Version]
- Fardet, A.; Rock, E. Toward a new philosophy of preventive nutrition: From a reductionist to a holistic paradigm to improve nutritional recommendations. Adv. Nutr. 2014, 5, 430–446. [Google Scholar] [CrossRef]
- Hoffmann, I. Transcending reductionism in nutrition research. Am. J. Clin. Nutr. 2003, 78, 514S–516S. [Google Scholar] [CrossRef] [Green Version]
- Jacobs, D.R.; Tapsell, L.C. Food synergy: The key to a healthy diet. Proc. Nutr. Soc. 2013, 72, 200–206. [Google Scholar] [CrossRef] [Green Version]
- Jacobs, D.R.; Tapsell, L.C.; Temple, N.J. Food Synergy: The Key to Balancing the Nutrition Research Effort. Public Health Rev. 2011, 33, 507–529. [Google Scholar] [CrossRef] [Green Version]
- Haq, I.U.; Asra, M.; Tian, Q.; Ahmed, B.; Khan, N.; Ijaz Ahmad, M.; Ji, C.; Luo, J. Association of Infant and Child Feeding Index with Undernutrition in Children Aged 6-59 Months: A Cross-Sectional Study in the Maldives. Am. J. Trop. Med. Hyg. 2020, 103, 515–519. [Google Scholar] [CrossRef] [PubMed]
- Chaudhary, S.R.; Govil, S.; Lala, M.K.; Yagnik, H.B. Infant and Young Child Feeding Index and its association with nutritional status: A cross-sectional study of urban slums of Ahmedabad. J. Family Community Med. 2018, 25, 88–94. [Google Scholar] [CrossRef]
- Qu, P.; Mi, B.; Wang, D.; Zhang, R.; Yang, J.; Liu, D.; Dang, S.; Yan, H. Association between the Infant and Child Feeding Index (ICFI) and nutritional status of 6- to 35-month-old children in rural western China. PLoS ONE 2017, 12, e0171984. [Google Scholar] [CrossRef] [PubMed]
- Chowdhury, M.R.K.; Rahman, M.S.; Khan, M.M.H. Levels and determinants of complementary feeding based on meal frequency among children of 6 to 23 months in Bangladesh. BMC Public Health 2016, 16, 944. [Google Scholar] [CrossRef] [Green Version]
- Saaka, M.; Larbi, A.; Mutaru, S.; Hoeschle-Zeledon, I. Magnitude and factors associated with appropriate complementary feeding among children 6–23 months in Northern Ghana. BMC Nutr. 2016, 2, 243. [Google Scholar] [CrossRef] [Green Version]
- Kassa, T.; Meshesha, B.; Haji, Y.; Ebrahim, J. Appropriate complementary feeding practices and associated factors among mothers of children age 6-23 months in Southern Ethiopia, 2015. BMC Pediatr. 2016, 16, 131. [Google Scholar] [CrossRef] [Green Version]
- Reinbott, A.; Kuchenbecker, J.; Herrmann, J.; Jordan, I.; Muehlhoff, E.; Kevanna, O.; Krawinkel, M. A child feeding index is superior to WHO IYCF indicators in explaining length-for-age Z-scores of young children in rural Cambodia. Paediatr. Int. Child Health 2015, 35, 124–134. [Google Scholar] [CrossRef] [Green Version]
- Bork, K.; Cames, C.; Barigou, S.; Cournil, A.; Diallo, A. A summary index of feeding practices is positively associated with height-for-age, but only marginally with linear growth, in rural Senegalese infants and toddlers. J. Nutr. 2012, 142, 1116–1122. [Google Scholar] [CrossRef] [Green Version]
- Khatoon, T.; Mollah, M.A.H.; Choudhury, A.M.; Islam, M.M.; Rahman, K.M. Association between infant- and child-feeding index and nutritional status: Results from a cross-sectional study among children attending an urban hospital in Bangladesh. J. Health Popul. Nutr. 2011, 29, 349–356. [Google Scholar] [CrossRef] [Green Version]
- Zhang, J.; Shi, L.; Wang, J.; Wang, Y. An infant and child feeding index is associated with child nutritional status in rural China. Early Hum. Dev. 2009, 85, 247–252. [Google Scholar] [CrossRef] [PubMed]
- Garg, A.; Chadha, R. Index for Measuring the Quality of Complementary Feeding Practices in Rural India. J. Health Popul. Nutr. 2009, 27, 763–771. [Google Scholar] [CrossRef] [PubMed] [Green Version]
- Moursi, M.M.; Trèche, S.; Martin-Prével, Y.; Maire, B.; Delpeuch, F. Association of a summary index of child feeding with diet quality and growth of 6-23 months children in urban Madagascar. Eur. J. Clin. Nutr. 2009, 63, 718–724. [Google Scholar] [CrossRef] [PubMed] [Green Version]
- Moursi, M.M.; Martin-Prével, Y.; Eymard-Duvernay, S.; Capon, G.; Trèche, S.; Maire, B.; Delpeuch, F. Assessment of child feeding practices using a summary index: Stability over time and association with child growth in urban Madagascar. Am. J. Clin. Nutr. 2008, 87, 1472–1479. [Google Scholar] [CrossRef] [Green Version]
- Ntab, B.; Simondon, K.B.; Milet, J.; Cissé, B.; Sokhna, C.; Boulanger, D.; Simondon, F. A young child feeding index is not associated with either height-for-age or height velocity in rural Senegalese children. J. Nutr. 2005, 135, 457–464. [Google Scholar] [CrossRef] [Green Version]
- Ghana Statistical Service (GSS); Ghana Health Service (GHS); ICF International. Ghana Demographic and Health Survey 2014; GSS, GHS, and ICF International: Rockville, MD, USA, 2015.
- Ghana Statistical Service. Multiple Indicator Cluster Survey (MICS 217/2018), Survey Findings Report; GSS: Accra, Ghana, 2018.
- Kranjac-Berisavljevic, G.; Abdul-Ghanyu, S.; Gandaa, B.Z.; Abagale, F.K. Dry Spells Occurrence in Tamale, Northern Ghana—Review of Available Information. J. Disaster Res. 2014, 9, 468–474. [Google Scholar] [CrossRef]
- Baffour-Ata, F.; Antwi-Agyei, P.; Nkiaka, E.; Dougill, A.J.; Anning, A.K.; Kwakye, S.O. Effect of climate variability on yields of selected staple food crops in northern Ghana. J. Agric. Food Res. 2021, 6, 100205. [Google Scholar] [CrossRef]
- Glover-Amengor, M.; Agbemafle, I.; Hagan, L.L.; Mboom, F.P.; Gamor, G.; Larbi, A.; Hoeschle-Zeledon, I. Nutritional status of children 0-59 months in selected intervention communities in northern Ghana from the africa RISING project in 2012. Arch. Public Health 2016, 74, 12. [Google Scholar] [CrossRef] [Green Version]
- Saaka, M.; Oladele, J.; Larbi, A.; Hoeschle-Zeledon, I. Dietary Diversity Is Not Associated with Haematological Status of Pregnant Women Resident in Rural Areas of Northern Ghana. J. Nutr. Metab. 2017, 2017, 8497892. [Google Scholar] [CrossRef]
- Rousson, V.; Gasser, T.; Seifert, B. Assessing intrarater, interrater and test-retest reliability of continuous measurements. Stat. Med. 2002, 21, 3431–3446. [Google Scholar] [CrossRef]
- McHugh, M.L. Interrater reliability: The kappa statistic. Biochem. Med. 2012, 22, 276–282. [Google Scholar] [CrossRef]
- Ali, Z.; Saaka, M.; Adams, A.-G.; Kamwininaang, S.K.; Abizari, A.-R. The effect of maternal and child factors on stunting, wasting and underweight among preschool children in Northern Ghana. BMC Nutr. 2017, 3, 1992. [Google Scholar] [CrossRef] [PubMed] [Green Version]
- FAO. Dietary Assessment: A Resource Guide to Method Selection and Application in Low Resource Settings; FAO: Rome, Italy, 2018; ISBN 978-92-5-130635-2. [Google Scholar]
- Thabane, L.; Mbuagbaw, L.; Zhang, S.; Samaan, Z.; Marcucci, M.; Ye, C.; Thabane, M.; Giangregorio, L.; Dennis, B.; Kosa, D.; et al. A tutorial on sensitivity analyses in clinical trials: The what, why, when and how. BMC Med. Res. Methodol. 2013, 13, 92. [Google Scholar] [CrossRef] [Green Version]
- Saaka, M.; Takyi, S.A.; Maxwell, T. An Investigation of Patterns and Factors Associated with Exclusive Breast Feeding in Northern Ghana. Int. J. Child Health Nutr. 2012, 1, 92–103. [Google Scholar] [CrossRef] [Green Version]
- Mekonnen, T.C.; Workie, S.B.; Yimer, T.M.; Mersha, W.F. Meal frequency and dietary diversity feeding practices among children 6-23 months of age in Wolaita Sodo town, Southern Ethiopia. J. Health Popul. Nutr. 2017, 36, 18. [Google Scholar] [CrossRef] [PubMed]
- Semba, R.D.; Shardell, M.; Sakr Ashour, F.A.; Moaddel, R.; Trehan, I.; Maleta, K.M.; Ordiz, M.I.; Kraemer, K.; Khadeer, M.A.; Ferrucci, L.; et al. Child Stunting is Associated with Low Circulating Essential Amino Acids. EBioMedicine 2016, 6, 246–252. [Google Scholar] [CrossRef] [PubMed] [Green Version]
- Tang, M.; Hendricks, A.E.; Krebs, N.F. A meat- or dairy-based complementary diet leads to distinct growth patterns in formula-fed infants: A randomized controlled trial. Am. J. Clin. Nutr. 2018, 107, 734–742. [Google Scholar] [CrossRef]
- Tang, M. Protein Intake during the First Two Years of Life and Its Association with Growth and Risk of Overweight. Int. J. Environ. Res. Public Health 2018, 15, 1742. [Google Scholar] [CrossRef] [Green Version]
- Heinze, G.; Dunkler, D. Five myths about variable selection. Transpl. Int. 2017, 30, 6–10. [Google Scholar] [CrossRef]
- Smith, A.D.A.C.; Emmett, P.M.; Newby, P.K.; Northstone, K. Dietary patterns obtained through principal components analysis: The effect of input variable quantification. Br. J. Nutr. 2013, 109, 1881–1891. [Google Scholar] [CrossRef] [Green Version]
- Ali, A.; Margetts, B.M.; Zainuddin, A.A. Exploration of the Principal Component Analysis (PCA) Approach in Synthesizing the Diet Quality of the Malaysian Population. Nutrients 2020, 13, 70. [Google Scholar] [CrossRef] [PubMed]
- Zeraatkar, D.; Cheung, K.; Milio, K.; Zworth, M.; Gupta, A.; Bhasin, A.; Bartoszko, J.J.; Kiflen, M.; Morassut, R.E.; Noor, S.T.; et al. Methods for the Selection of Covariates in Nutritional Epidemiology Studies: A Meta-Epidemiological Review. Curr. Dev. Nutr. 2019, 3, nzz104. [Google Scholar] [CrossRef] [PubMed]
- Winship, C.; Western, B. Multicollinearity and Model Misspecification. SocScience 2016, 3, 627–649. [Google Scholar] [CrossRef]
- Johnston, R.; Jones, K.; Manley, D. Confounding and collinearity in regression analysis: A cautionary tale and an alternative procedure, illustrated by studies of British voting behaviour. Qual. Quant. 2018, 52, 1957–1976. [Google Scholar] [CrossRef] [PubMed] [Green Version]
- Onis, M. WHO Child Growth Standards based on length/height, weight and age. Acta Paediatrica 2006, 95, 76–85. [Google Scholar] [CrossRef]
- Lutter, C.K.; Grummer-Strawn, L.; Rogers, L. Complementary feeding of infants and young children 6 to 23 months of age. Nutr. Rev. 2021, 79, 825–846. [Google Scholar] [CrossRef] [PubMed]
- Field, A.P. Discovering Statistics Using IBM SPSS Statistics, 4th ed.; SAGE: London, UK, 2013; ISBN 978-1-4462-4917-8. [Google Scholar]
- Hair, J.F.; Black, W.C.; Babin, B.J.; Anderson, R.E. Multivariate Data Analysis, 7th ed.; Prentice Hall: Upper Saddle River, NJ, USA, 2014; ISBN 9780138132637. [Google Scholar]
- Ughade, S. Statistical modeling in epidemiologic research: Some basic concepts. Clin. Epidemiol. Glob. Health 2013, 1, 32–36. [Google Scholar] [CrossRef] [Green Version]
- Bewick, V.; Cheek, L.; Ball, J. Statistics review 7: Correlation and regression. Crit. Care 2003, 7, 451–459. [Google Scholar] [CrossRef] [Green Version]
- Sainani, K.L. Explanatory versus predictive modeling. PM R 2014, 6, 841–844. [Google Scholar] [CrossRef]
- Shmueli, G. To Explain or to Predict? Statist. Sci. 2010, 25, 289–310. [Google Scholar] [CrossRef]
- Sun, G.-W.; Shook, T.L.; Kay, G.L. Inappropriate use of bivariable analysis to screen risk factors for use in multivariable analysis. J. Clin. Epidemiol. 1996, 49, 907–916. [Google Scholar] [CrossRef]
- Tabachnick, G.B.; Fidell, S.L. Using Multivariate Statistics, 5th ed.; Allyn & Bacon: Boston, MA, USA, 2007. [Google Scholar]
- Symonds, M.R.E.; Moussalli, A. A brief guide to model selection, multimodel inference and model averaging in behavioural ecology using Akaike’s information criterion. Behav. Ecol. Sociobiol. 2011, 65, 13–21. [Google Scholar] [CrossRef]
- Pallant, J.F. SPSS Survival Manual: A Step by Step Guide to Data Analysis Using SPSS, 4th ed.; Allen & Unwin: Crows Nest, NSW, Australia, 2011; ISBN 9781742373928. [Google Scholar]
- Heale, R.; Twycross, A. Validity and reliability in quantitative studies. Evid. Based Nurs. 2015, 18, 66–67. [Google Scholar] [CrossRef] [PubMed] [Green Version]
- de Souza, A.C.; Alexandre, N.M.C.; Guirardello, E.d.B. Propriedades psicométricas na avaliação de instrumentos: Avaliação da confiabilidade e da validade. Epidemiol. Serv. Saude 2017, 26, 649–659. [Google Scholar] [CrossRef]
- Sauzet, O.; Breckenkamp, J.; Borde, T.; Brenne, S.; David, M.; Razum, O.; Peacock, J.L. A distributional approach to obtain adjusted comparisons of proportions of a population at risk. Emerg. Themes Epidemiol. 2016, 13, 8. [Google Scholar] [CrossRef] [Green Version]
- de Souza, R.J.; Eisen, R.B.; Perera, S.; Bantoto, B.; Bawor, M.; Dennis, B.B.; Samaan, Z.; Thabane, L. Best (but oft-forgotten) practices: Sensitivity analyses in randomized controlled trials. Am. J. Clin. Nutr. 2016, 103, 5–17. [Google Scholar] [CrossRef] [Green Version]
- Porta, M.S.; Greenland, S.; Hernán, M.; Silva, I.d.S.; Last, J.M. A Dictionary of Epidemiology, 6th ed.; The International Epidemiological Association, Ed.; Oxford University Press: Oxford, UK, 2014; ISBN 978-0-19-997673-7. [Google Scholar]
- Zhao, J.; Li, Z.; Gao, Q.; Zhao, H.; Chen, S.; Huang, L.; Wang, W.; Wang, T. A review of statistical methods for dietary pattern analysis. Nutr. J. 2021, 20, 37. [Google Scholar] [CrossRef]
- Serge, A.; Quiroz Montoya, J.; Alonso, F.; Montoro, L. Socioeconomic Status, Health and Lifestyle Settings as Psychosocial Risk Factors for Road Crashes in Young People: Assessing the Colombian Case. Int. J. Environ. Res. Public Health 2021, 18. [Google Scholar] [CrossRef]
- Zhang, F.; Tapera, T.M.; Gou, J. Application of a new dietary pattern analysis method in nutritional epidemiology. BMC Med. Res. Methodol. 2018, 18, 119. [Google Scholar] [CrossRef]
- Miller, P.E.; Lazarus, P.; Lesko, S.M.; Muscat, J.E.; Harper, G.; Cross, A.J.; Sinha, R.; Ryczak, K.; Escobar, G.; Mauger, D.T.; et al. Diet index-based and empirically derived dietary patterns are associated with colorectal cancer risk. J. Nutr. 2010, 140, 1267–1273. [Google Scholar] [CrossRef] [Green Version]
- Streiner, D.L.; Kottner, J. Recommendations for reporting the results of studies of instrument and scale development and testing. J. Adv. Nurs. 2014, 70, 1970–1979. [Google Scholar] [CrossRef] [PubMed]
- Streiner, D.L. Starting at the beginning: An introduction to coefficient alpha and internal consistency. J. Pers. Assess. 2003, 80, 99–103. [Google Scholar] [CrossRef] [PubMed]
- Thaweekul, P.; Sinlapamongkolkul, P.; Tonglim, J.; Sritipsukho, P. Associations between the infant and young child feeding index and nutritional status. Pediatr. Int. 2021, 63, 958–964. [Google Scholar] [CrossRef] [PubMed]
- Sauerbrei, W.; Perperoglou, A.; Schmid, M.; Abrahamowicz, M.; Becher, H.; Binder, H.; Dunkler, D.; Harrell, F.E.; Royston, P.; Heinze, G. State of the art in selection of variables and functional forms in multivariable analysis-outstanding issues. Diagn. Progn. Res. 2020, 4, 3. [Google Scholar] [CrossRef] [PubMed] [Green Version]
- Lachat, C.; Hawwash, D.; Ocké, M.C.; Berg, C.; Forsum, E.; Hörnell, A.; Larsson, C.L.; Sonestedt, E.; Wirfält, E.; Åkesson, A.; et al. Strengthening the Reporting of Observational Studies in Epidemiology—nutritional epidemiology (STROBE-nut): An extension of the STROBE statement. Nutr Bull. 2016, 41, 240–251. [Google Scholar] [CrossRef] [PubMed] [Green Version]
- Liang, W.; Zhao, Y.; Lee, A.H. An investigation of the significance of residual confounding effect. Biomed Res. Int. 2014, 2014, 658056. [Google Scholar] [CrossRef]
- Berg, G.D.; Mansley, E.C. Endogeneity bias in the absence of unobserved heterogeneity. Ann. Epidemiol. 2004, 14, 561–565. [Google Scholar] [CrossRef]

| Reference | CCFI Formulation Components | Age Range (Months)/Sample Size | CCFI Scoring Age Groups (Months) | Geography | Study Design/Statistical Analysis | Multivariable Study Findings | Remarks: Predictive Utility |
|---|---|---|---|---|---|---|---|
| Haq et al., 2020 [25] | 1, 2, 4, 5 | 6–59/n = 800 | 6–8, 9–11, 12–36, 37–59 | SEA/Rural/ Maldives | Cross-sectional/φ Multiple Linear Regression | HAZ/LAZ *, WAZ *, WLZ ** | Yes |
| Chaudhary et al., 2019 [26] | 1 π, 2 π, 3, 4 π | 6–36/n = 210 | 6–9, 10–12, 13–36 | SEA/Urban Slum/India | Cross-sectional/φ Multiple Linear Regression | HAZ/LAZ *, WAZ *, WLZ * | Yes |
| Qu et al., 2017 [27] | 1, 2, 3, 5, 9 | 6–35/ n = 12, 146 | 6–8.99, 9–11.99, 12–35.99 | SEA/Rural/ China | Cross-sectional/φφ Quantile Regression (Generalized Estimation Equation) and φφ Multiple Linear Regression | HAZ/LAZ *, WAZ * | Yes |
| Wondafrash et al., 2017 [12] | 2, 3, 4, 5 | 6–18/n = 320 | 6–8, 9–12 | SSA/Rural/ Ethiopia | Repeated Cross-sectional and Longitudinal/φφ Multiple Linear Regression and ANCOVA | HAZ/LAZ **, WAZ **, WLZ ** | No |
| Chowdhury, Rahman, and Khan, 2016 [28] | 10a | 6–23/n = 2373 | 6–11,12–17, 18–23 | SEA/Urban and Rural/ Bangladesh | Cross-sectional/φφ Multiple Binary Logistic Regression/ φφ Multivariable Multinomial Logistic Regression | Association with undernutrition not examined | Not examined |
| Saaka et al., 2016 [29] | 10b | 6–23/n = 778 | 6–11, 12–17, 18–23 | SSA/Rural and Urban/Ghana | Cross-sectional/φφ Multiple Binary Logistic Regression | Association with undernutrition not examined | Not examined |
| Kassa et al., 2016 [30] | 10b | 6–23/n = 611 | 6–11, 12–17, 18–23 | SSA/Rural/ Ethiopia | Cross-sectional/φφ Multiple Binary Logistic Regression | Association with undernutrition not examined | Not examined |
| Reinbott et al., 2015 [31] | 1 π, 2, 3, 4 π, 5 π | 6–23/n = 803 | 6–8, 9–11, 12–23 | SEA/Rural/ Cambodia | Cross-sectional/φ Multiple Linear Regression and Non-linear Regression (Quadratic model) | HAZ/LAZ * | Yes, but weak |
| Lohia and Udipi, 2014 [15] | 1 π, 2, 3, 4, 5 | 6–24/n = 446 | 6–8.99, 9–11.99, 12–17.99, 18–24 | SEA/Urban slum/India | Cross-sectional/φ Multiple Linear Regression | HAZ/LAZ *, WAZ **, WLZ **, BAZ *, MUAC ** | Yes |
| Ma et al., 2012 [16] | 1, 4, 5, 11, 12 | 5–7/n = 180 | 6 (5–7), 12 (10–14), 18 (16–20) | SEA/Urban affluent city/ China | Longitudinal/φφ Multiple Linear Regression and Stability Analysis | HAZ/LAZ *, WAZ *, WLZ ** | Yes |
| Bork et al., 2012 [32] | 1 π, 3 π, 4 π, 14 π | 6–36/n = 1060 | 6–9, 9–12, 12–18, 24–36 | SSA/Rural/ Senegal | Longitudinal/φφ Multiple Linear Regression (Mixed Model) | HAZ/LAZ * | Yes |
| Khatoon et al., 2011 [33] | 1, 2, 3, 4, 5 | 6–23/n = 259 | 6–8, 9–11, 12–23 | SEA/Urban Hospital/ Bangladesh | Cross-sectional/φφ Multiple Linear Regression | HAZ/LAZ *, WAZ **, WLZ ** | Yes |
| Zhang et al., 2009 [34] | 1, 2 π, 3 π, 4 π, 5 | 6–11/n = 501 | 6–8, 9–11 | SEA/Rural/ China | Cross-sectional/φφ Multiple Linear Regression | HAZ/LAZ **, WAZ *, WLZ * | Yes |
| Garg et al., 2009 [35] | 1, 2, 3 π, 4 π, 5, 9 | 6–12/n = 151 | 6–8, 9–12 | SEA/Rural/ India | Cross-sectional/φφ Multiple Linear Regression | HAZ/LAZ *, WAZ **, WLZ ** | Yes |
| Moursi et al., 2009 [36] | 1 π, 2, 3 π, 4 π, 5 | 6–23/n = 1589 | 6–8, 9–11, 12–23 | SSA/Urban/ Madagascar | Cross-sectional/φφ Multiple Linear Regression | HAZ/LAZ **,WAZ **, WLZ ** | No |
| Moursi et al., 2008 [37] | 1 π, 2, 3, 4, 5 π | 6–17/n = 363 | 6–8, 9–11, 12–17 | SSA/Urban/ Madagascar | Longitudinal/φφ Multiple Linear Regression | HAZ/LAZ **, WLZ ** | No |
| Sawadogo et al., 2006 [17] | 1 π, 2 π, 3 π, 4 π, 13 π, 14 π | 6–35/n = 2466 | 6–11, 12–23, 24–35 | SSA/Rural/ Burkina Faso | Cross-sectional/φφ Multiple Linear Regression | HAZ/LAZ *, WLZ * | Yes |
| Ntab et al., 2005 [38] | 1, 2, 3, 4, 15, 16, 17 | 12–42/n = 500 | 12–42 | SSA/Rural/ Senegal | Cross-sectional/φφ Multiple Linear Regression | HAZ/LAZ ** | No |
| Ruel and Menon, 2002 [14] | 1, 2, 3, 4, 5 | 6–36/n = (257, 341, 234, 459, 203, 303, 709) | 6–9, 9–12, 12–36 | LA/Rural and Urban/Bolivia, Colombia, Guatemala, Nicaragua, Peru | Cross-sectional/φφ Multiple Linear Regression | HAZ/LAZ * | Yes, first study to construct such an index |
| CCFIs | Components | Age Group Scoring | Remarks | ||
|---|---|---|---|---|---|
| 6–8 | 9–11 | 12–23 | |||
| CCFI 1 | 1, 2, 3, 4, 5 | 1 (Yes = 2, No = 0), 2 (Yes = 0, No = 1), 3 (0 fdg = 0, 1–3 fdgs = 1, ≥4 fdgs = 2), 4 (0 meal/day = 0, 1 meal/day = 1, 2+/day = 2), 5 (ASP, Yes = 2, No = 0; PSP, Yes = 1, No = 0) | 1 (Yes = 2, No = 0), 2 (Yes = 0, No = 1), 3 (0 fdg = 0, 1–3 fdgs = 1, ≥4 fdgs = 2), 4 (0 meal/day = 0, 1–2 meals/day = 1, 3+/day = 2), 5 (ASP, Yes = 2, No = 0; PSP, Yes = 1, No = 0) | 1 (Yes = 1, No = 0), 2 (Yes = 0, No = 1), 3 (0 fdg = 0, 1–3 fdgs = 1, ≥4 fdgs = 2),4 (0–1 meal/day = 0, 2–3 meals/day = 1, 4+/day = 2), 5 (ASP, Yes = 1, No = 0; PSP, Yes = 3, No = 0) | FFQ I (7-day recall: diverse food intake) was substituted with 5 FFQ II instead, unlike the classical formula used by Ruel and Menon. |
| Maximum total score | 10 points | 10 points | 10 points | ||
| CCFI 2 | 9 | ACF (yes = 1, no = 0) if TICF, MDD, and MMF are all yes | ACF (yes = 1, no = 0) if TICF, MDD, and MMF are all yes | ACF (yes = 1, no = 0) if TICF, MDD, and MMF are all yes | Only CF-related core IYCF indices were used. |
| Maximum total score | 1 point | 1 point | 1 point | ||
| CCFI 3 | 1, 2, 3, 4, 5, 6, 7, 8, 10 | Same as CCFI 1 plus 6 Fe (AFS (yes = 2, no = 0), α IFF, PFS (yes = 1, no = 0)), 7 Fruits and Vegetables (VitA-rich (yes = 2, no = 0), Other F and V (yes = 1, no = 0)), 8 TICF (0 or 1), 10 FVI (0, 1 or 2) | Same as CCFI 1 plus 6 Fe (AFS (yes = 2, no = 0), α IFF, PFS (yes = 1, no = 0)), 7 Fruits and Vegetables (VitA-rich (yes = 2, no = 0), Other F and V (yes = 1, no = 0)), 8 TICF (0 or 1), 10 FVI (0, 1 or 2) | Same as CCFI 1 plus 6 Fe (AFS (yes = 2, no = 0), α IFF, PFS (yes = 1, no = 0)), 7 Fruits and Vegetables (VitA-rich (yes = 2, no = 0), Other F and V (yes = 1, no = 0)), 8 TICF (0 or 1), 10 FVI (0, 1 or 2) | CCFI 1 plus intake of micronutrient-rich foods (MRF), TICF, and intake of varieties of foods (FVI). |
| Maximum total score | 20 points | 20 points | 20 points | ||
| CCFI 4 | 1, 2, 3, 4, 5, 6 | Same as CCFI 1 plus 6 Fe (AFS (yes = 2, no = 0), PFS (yes = 1, no = 0)) | Same as CCFI 1 plus 6 Fe (AFS (yes = 2, no = 0), PFS (yes = 1, no = 0)) | Same as CCFI 1 plus 6 Fe (AFS (yes = 2, no = 0), PFS (yes = 1, no = 0)) | CCFI 1 plus predominant source of iron intake (animal or plant) |
| Maximum total score | 13 points | 13 points | 13 points | ||
| CCFI 5 | All possible CCFI components | CCFI 3 plus all the other possible components not exhibiting multicollinearity. | CCFI 3 plus all the other possible components not exhibiting multicollinearity. | CCFI 3 plus all the other possible components not exhibiting multicollinearity. | Excluded collinear components. 1st principal component used. |
| Maximum total score | Eigenvalue (Appendix A) | Eigenvalue (Appendix A) | Eigenvalue (Appendix A) | ||
| Characteristics | Frequency (n) | % |
|---|---|---|
| Maternal age ** | ||
| 15–24 years | 136 | 23.4 |
| 25–34 years | 321 | 55.2 |
| 35–49 years | 124 | 21.3 |
| Marital status | ||
| Unmarried | 16 | 2.8 |
| Married | 565 | 97.2 |
| Maternal height | ||
| 160 cm and above | 282 | 48.5 |
| Below 160 cm | 299 | 51.5 |
| Occupation | ||
| Trader/vendor/manual laborer | 166 | 28.6 |
| Farmer | 323 | 55.6 |
| Vocational/skilled service worker | 48 | 8.3 |
| Unemployed | 44 | 7.6 |
| Currently breastfeeding | ||
| Yes | 560 | 96.4 |
| No | 21 | 3.6 |
| Child age * | ||
| 6–11 months | 242 | 41.7 |
| 12–17 months | 185 | 31.8 |
| 18–23 months | 154 | 26.5 |
| Child gender | ||
| Male | 301 | 51.8 |
| Female | 280 | 48.2 |
| Child’s nutritional status | ||
| Stunting | 193 | 33.2 |
| Wasting | 82 | 14.1 |
| Underweight | 157 | 27.0 |
| Child’s birth weight (n = 274) | ||
| Less than 2.5 kg | 246 | 89.8 |
| More than 2.5 kg | 28 | 10.2 |
| CCFIs (Continuous) | Child Nutritional Status | ||
|---|---|---|---|
| Stunting | Wasting | Underweight | |
| CCFI 1 | * HAZα, * HAZβ, * HAZπ, * HAZΣ | ** WHZα, * WHZβ, * WHZπ, * WHZΣ | * WAZα, * WAZβ, * WAZπ, * WAZΣ |
| CCFI 2 | * HAZα, * HAZβ, * HAZπ, ** HAZΣ | * WHZα, * WHZβ, * WHZπ, * WHZΣ | * WAZα, * WAZβ, ** WAZπ, * WAZΣ |
| CCFI 3 | * HAZα, * HAZβ, ** HAZπ, ** HAZΣ | * WHZα, * WHZβ, ** WHZπ, * WHZΣ | * WAZα, * WAZβ, ** WAZπ, * WAZΣ |
| CCFI 4 | * HAZα, * HAZβ, * HAZπ, * HAZΣ | ** WHZα, * WHZβ, ** WHZπ, * WHZΣ | * WAZα, * WAZβ, ** WAZπ, * WAZΣ |
| CCFI 5 | * HAZα, * HAZβ, ** HAZπ, ** HAZΣ | ** WHZα, * WHZβ, ** WHZπ, * WHZΣ | * WAZα, * WAZβ, ** WAZπ, ** WAZΣ |
| CCFIs (Categorical) | Child Nutritional Status | ||
|---|---|---|---|
| Stunting | Wasting | Underweight | |
| CCFI 1 | * HAZα, * HAZβ, ** HAZπ, ** HAZΣ | * WHZα, * WHZβ, * WHZπ, * WHZΣ | * WAZα, * WAZβ, ** WAZπ, ** WAZΣ |
| CCFI 2 | * HAZα, * HAZβ, * HAZπ, * HAZΣ | * WHZα, * WHZβ, * WHZπ, * WHZΣ | * WAZα, * WAZβ, ** WAZπ, * WAZΣ |
| CCFI 3 | * HAZα, * HAZβ, ** HAZπ, ** HAZΣ | * WHZα, * WHZβ, ** WHZπ, * WHZΣ | * WAZα, * WAZβ, ** WAZπ, * WAZΣ |
| CCFI 4 | * HAZα, * HAZβ, ** HAZπ, ** HAZΣ | * WHZα, * WHZβ, * WHZπ, * WHZΣ | * WAZα, * WAZβ, * WAZπ, ** WAZΣ |
| CCFI 5 | * HAZα, * HAZβ, ** HAZπ, ** HAZΣ | * WHZα, * WHZβ, ** WHZπ, * WHZΣ | * WAZα, * WAZβ, ** WAZπ, * WAZΣ |
| CCFIs | Reliability | Validity | |||
|---|---|---|---|---|---|
| Cronbach’s α | α If Item # Deleted | Face | Content | Criterion @ (Wasting) | |
| CCFI 1 | 0.40 | 0.56 | Good | Medium | Fairly good |
| CCFI 4 | 0.60 | 0.71 | Very good | High | Good |
| CCFI 5 | 0.80 | 0.86 | Excellent | Very high | Very good |
| Significant CCFIs | Effect Size | F-Statistic | p-Value | 95% CI | |
|---|---|---|---|---|---|
| R2 | adjR2 | ||||
| CCFI 1 | 0.098 | 0.067 | 3.994 | 0.046 | −0.126, −0.001 |
| CCFI 4 | 0.102 | 0.075 | 6.996 | 0.008 | −0.095, −0.014 |
| CCFI 5 | 0.102 | 0.075 | 7.007 | 0.008 | −0.265, −0.039 |
Publisher’s Note: MDPI stays neutral with regard to jurisdictional claims in published maps and institutional affiliations. |
© 2022 by the authors. Licensee MDPI, Basel, Switzerland. This article is an open access article distributed under the terms and conditions of the Creative Commons Attribution (CC BY) license (https://creativecommons.org/licenses/by/4.0/).
Share and Cite
Anin, S.K.; Ansong, R.S.; Fischer, F.; Kraemer, A. Predictive Utility of Composite Child Feeding Indices (CCFIs) for Child Nutritional Status: Comparative Analyses for the Most Suitable Formula for Constructing an Optimum CCFI. Int. J. Environ. Res. Public Health 2022, 19, 6621. https://doi.org/10.3390/ijerph19116621
Anin SK, Ansong RS, Fischer F, Kraemer A. Predictive Utility of Composite Child Feeding Indices (CCFIs) for Child Nutritional Status: Comparative Analyses for the Most Suitable Formula for Constructing an Optimum CCFI. International Journal of Environmental Research and Public Health. 2022; 19(11):6621. https://doi.org/10.3390/ijerph19116621
Chicago/Turabian StyleAnin, Stephen Kofi, Richard Stephen Ansong, Florian Fischer, and Alexander Kraemer. 2022. "Predictive Utility of Composite Child Feeding Indices (CCFIs) for Child Nutritional Status: Comparative Analyses for the Most Suitable Formula for Constructing an Optimum CCFI" International Journal of Environmental Research and Public Health 19, no. 11: 6621. https://doi.org/10.3390/ijerph19116621