
Spatiotemporal Distribution of Continuous Air Pollution and Its Relationship with Socioeconomic and Natural Factors in China


Abstract
:1. Introduction
2. Materials and Methods
2.1. Data Source
2.2. Continuous Air Pollution Measurement
2.3. Spatial Analysis Methods
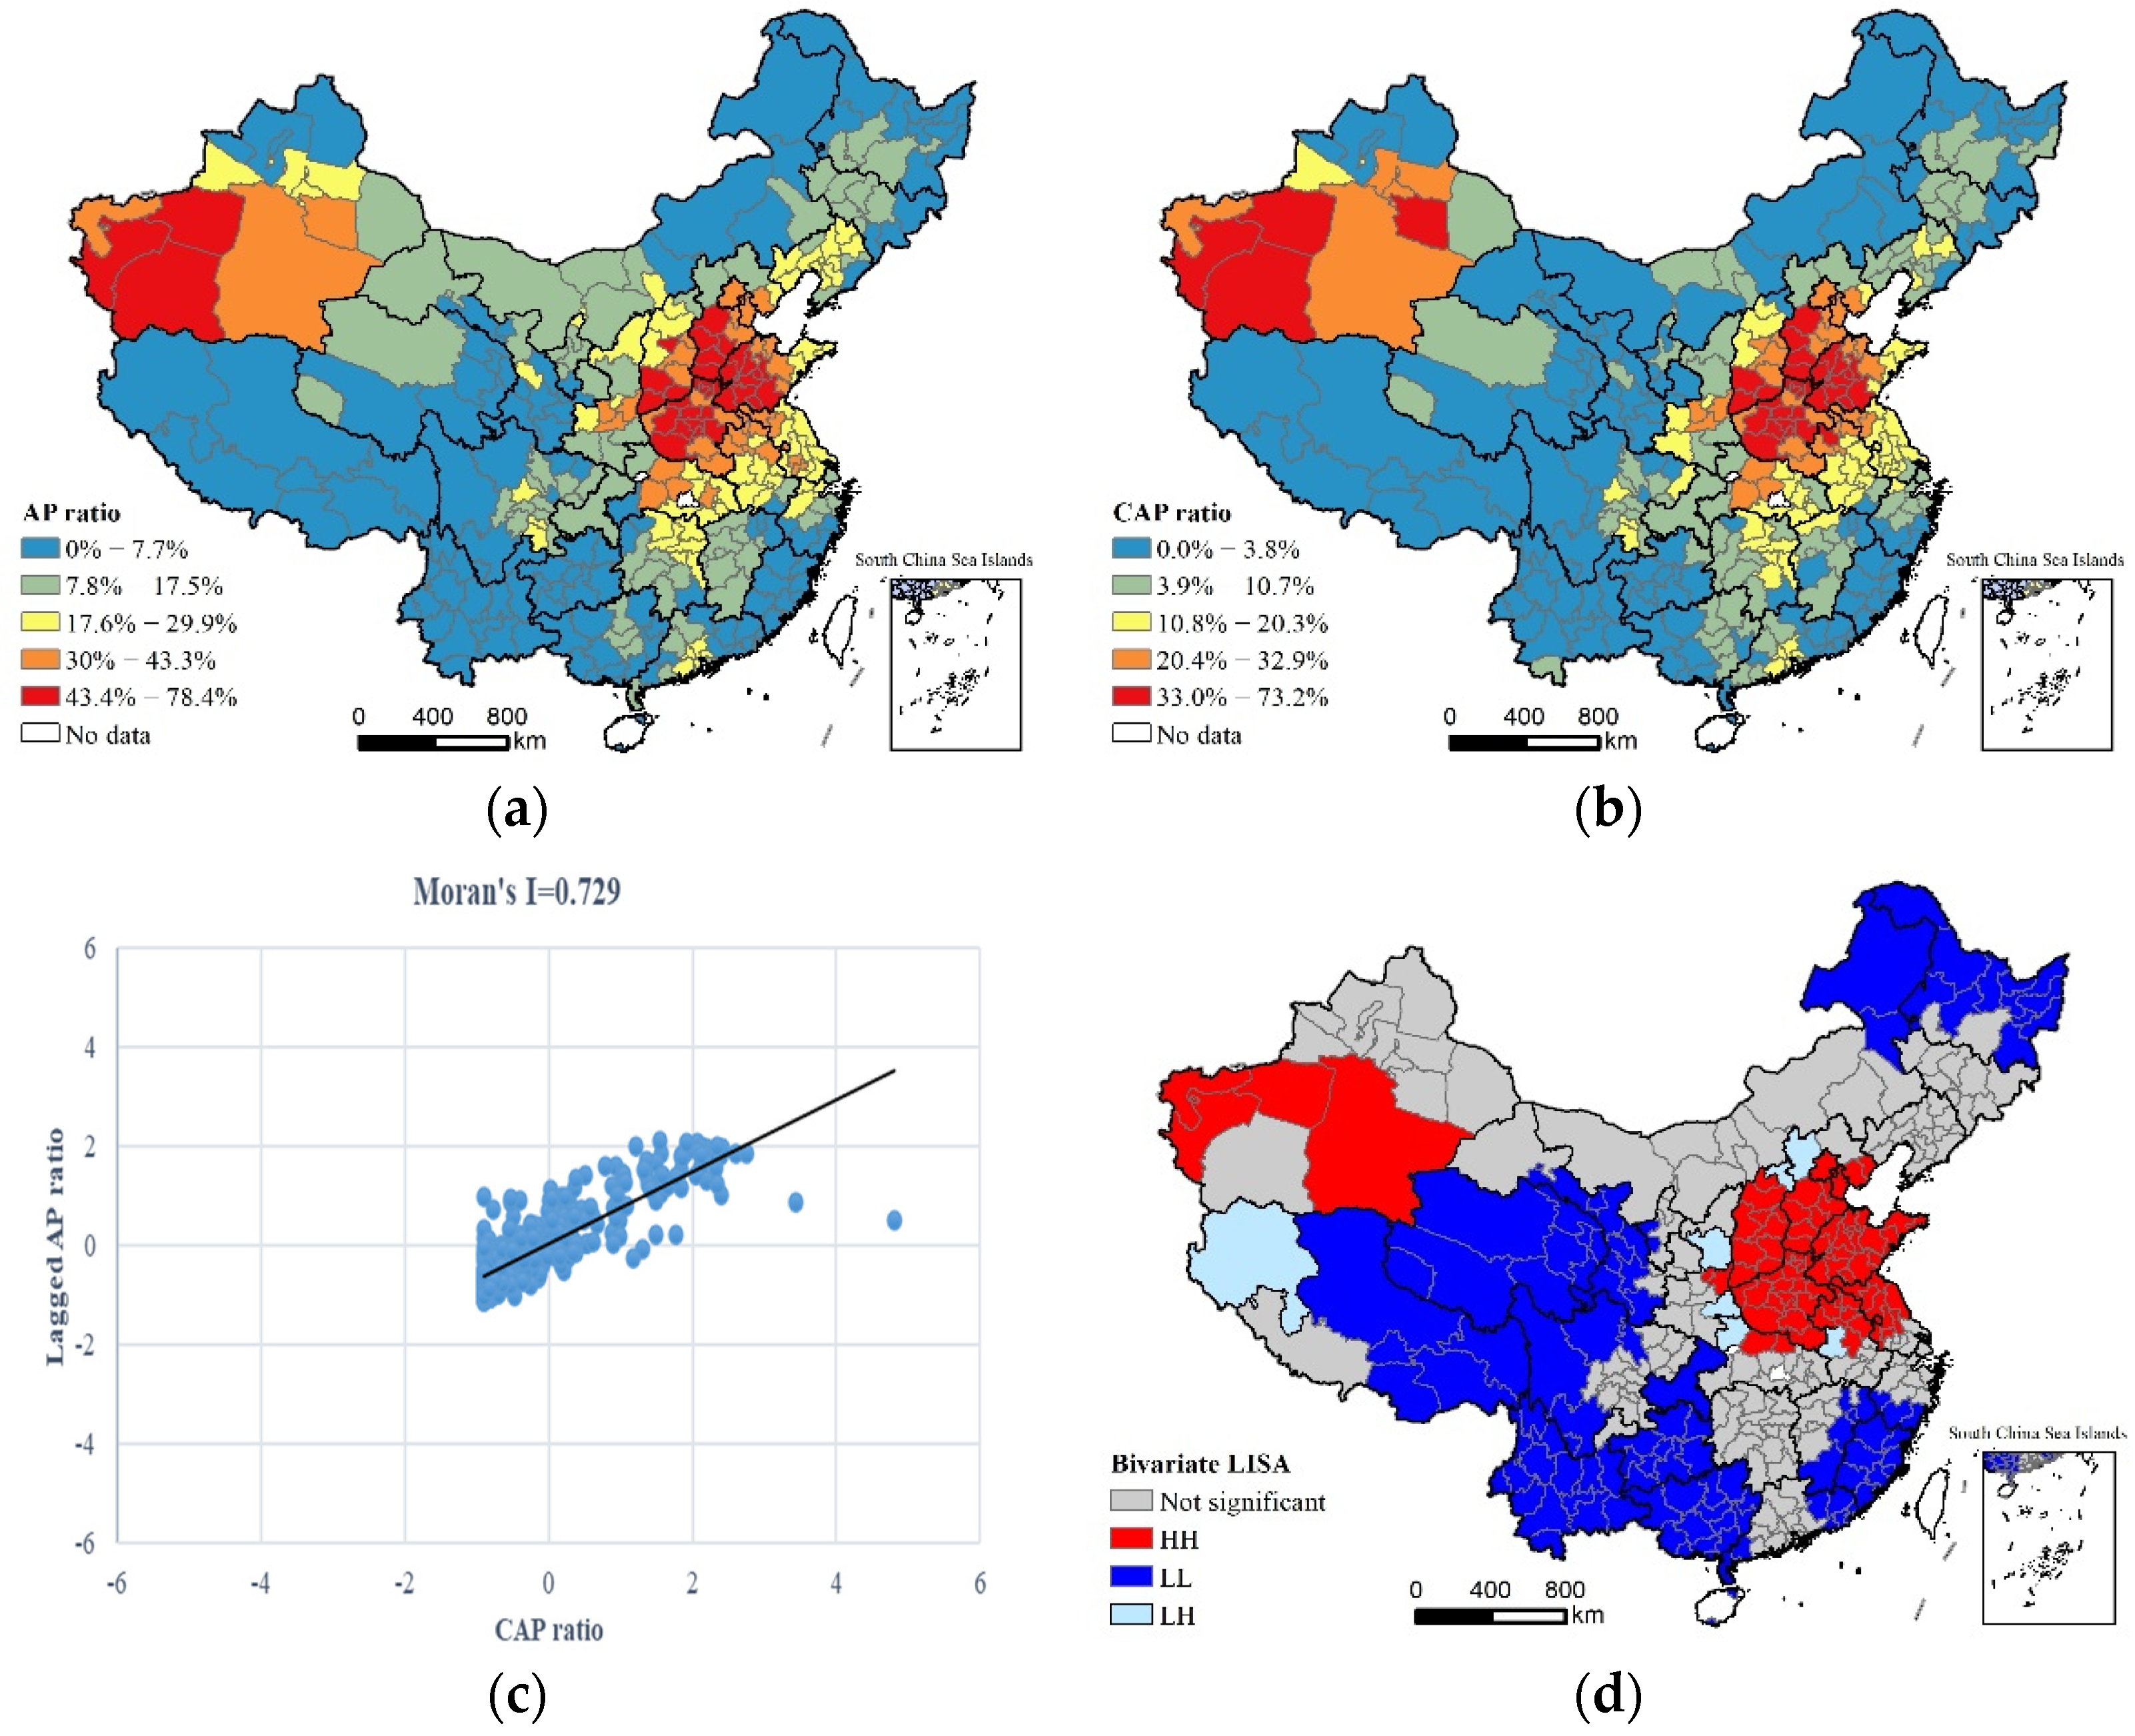
2.3.1. Bivariate Spatial Autocorrelation
2.3.2. Grouping Analysis
2.3.3. Multiscale Geographically Weighted Regression (MGWR)
3. Results
3.1. Descriptive Statistical
3.2. Spatial Distribution Characteristics of CAP
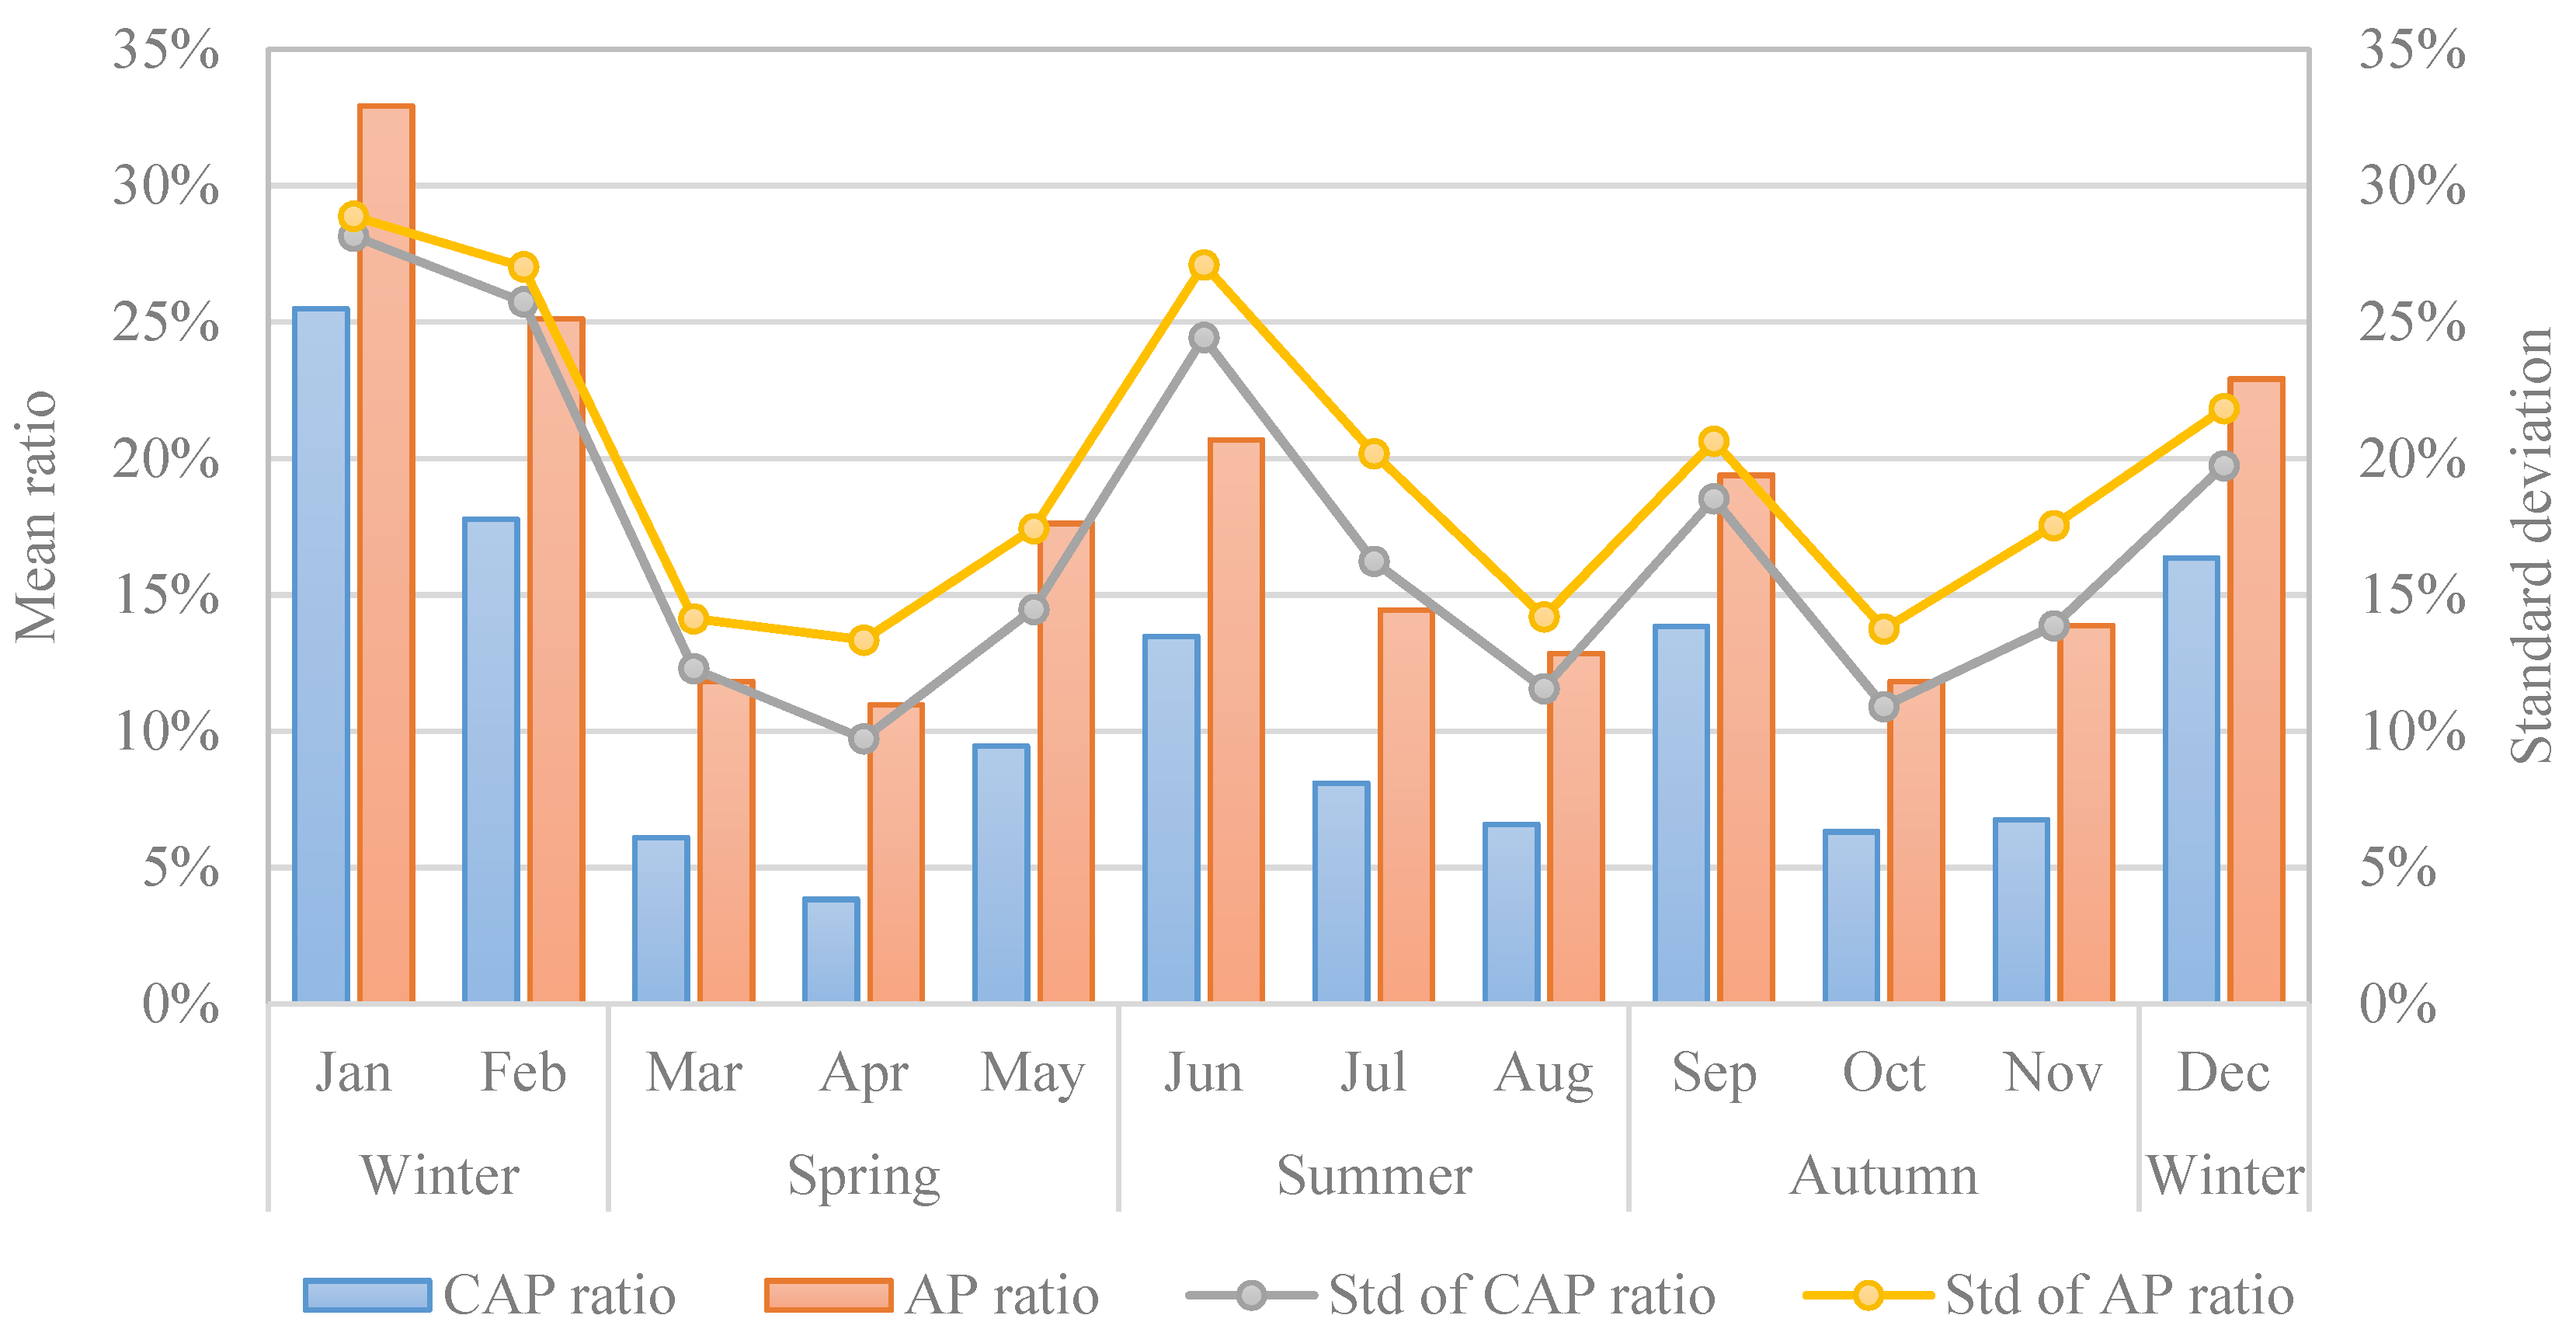
3.3. Temporal Distribution Characteristics of CAP
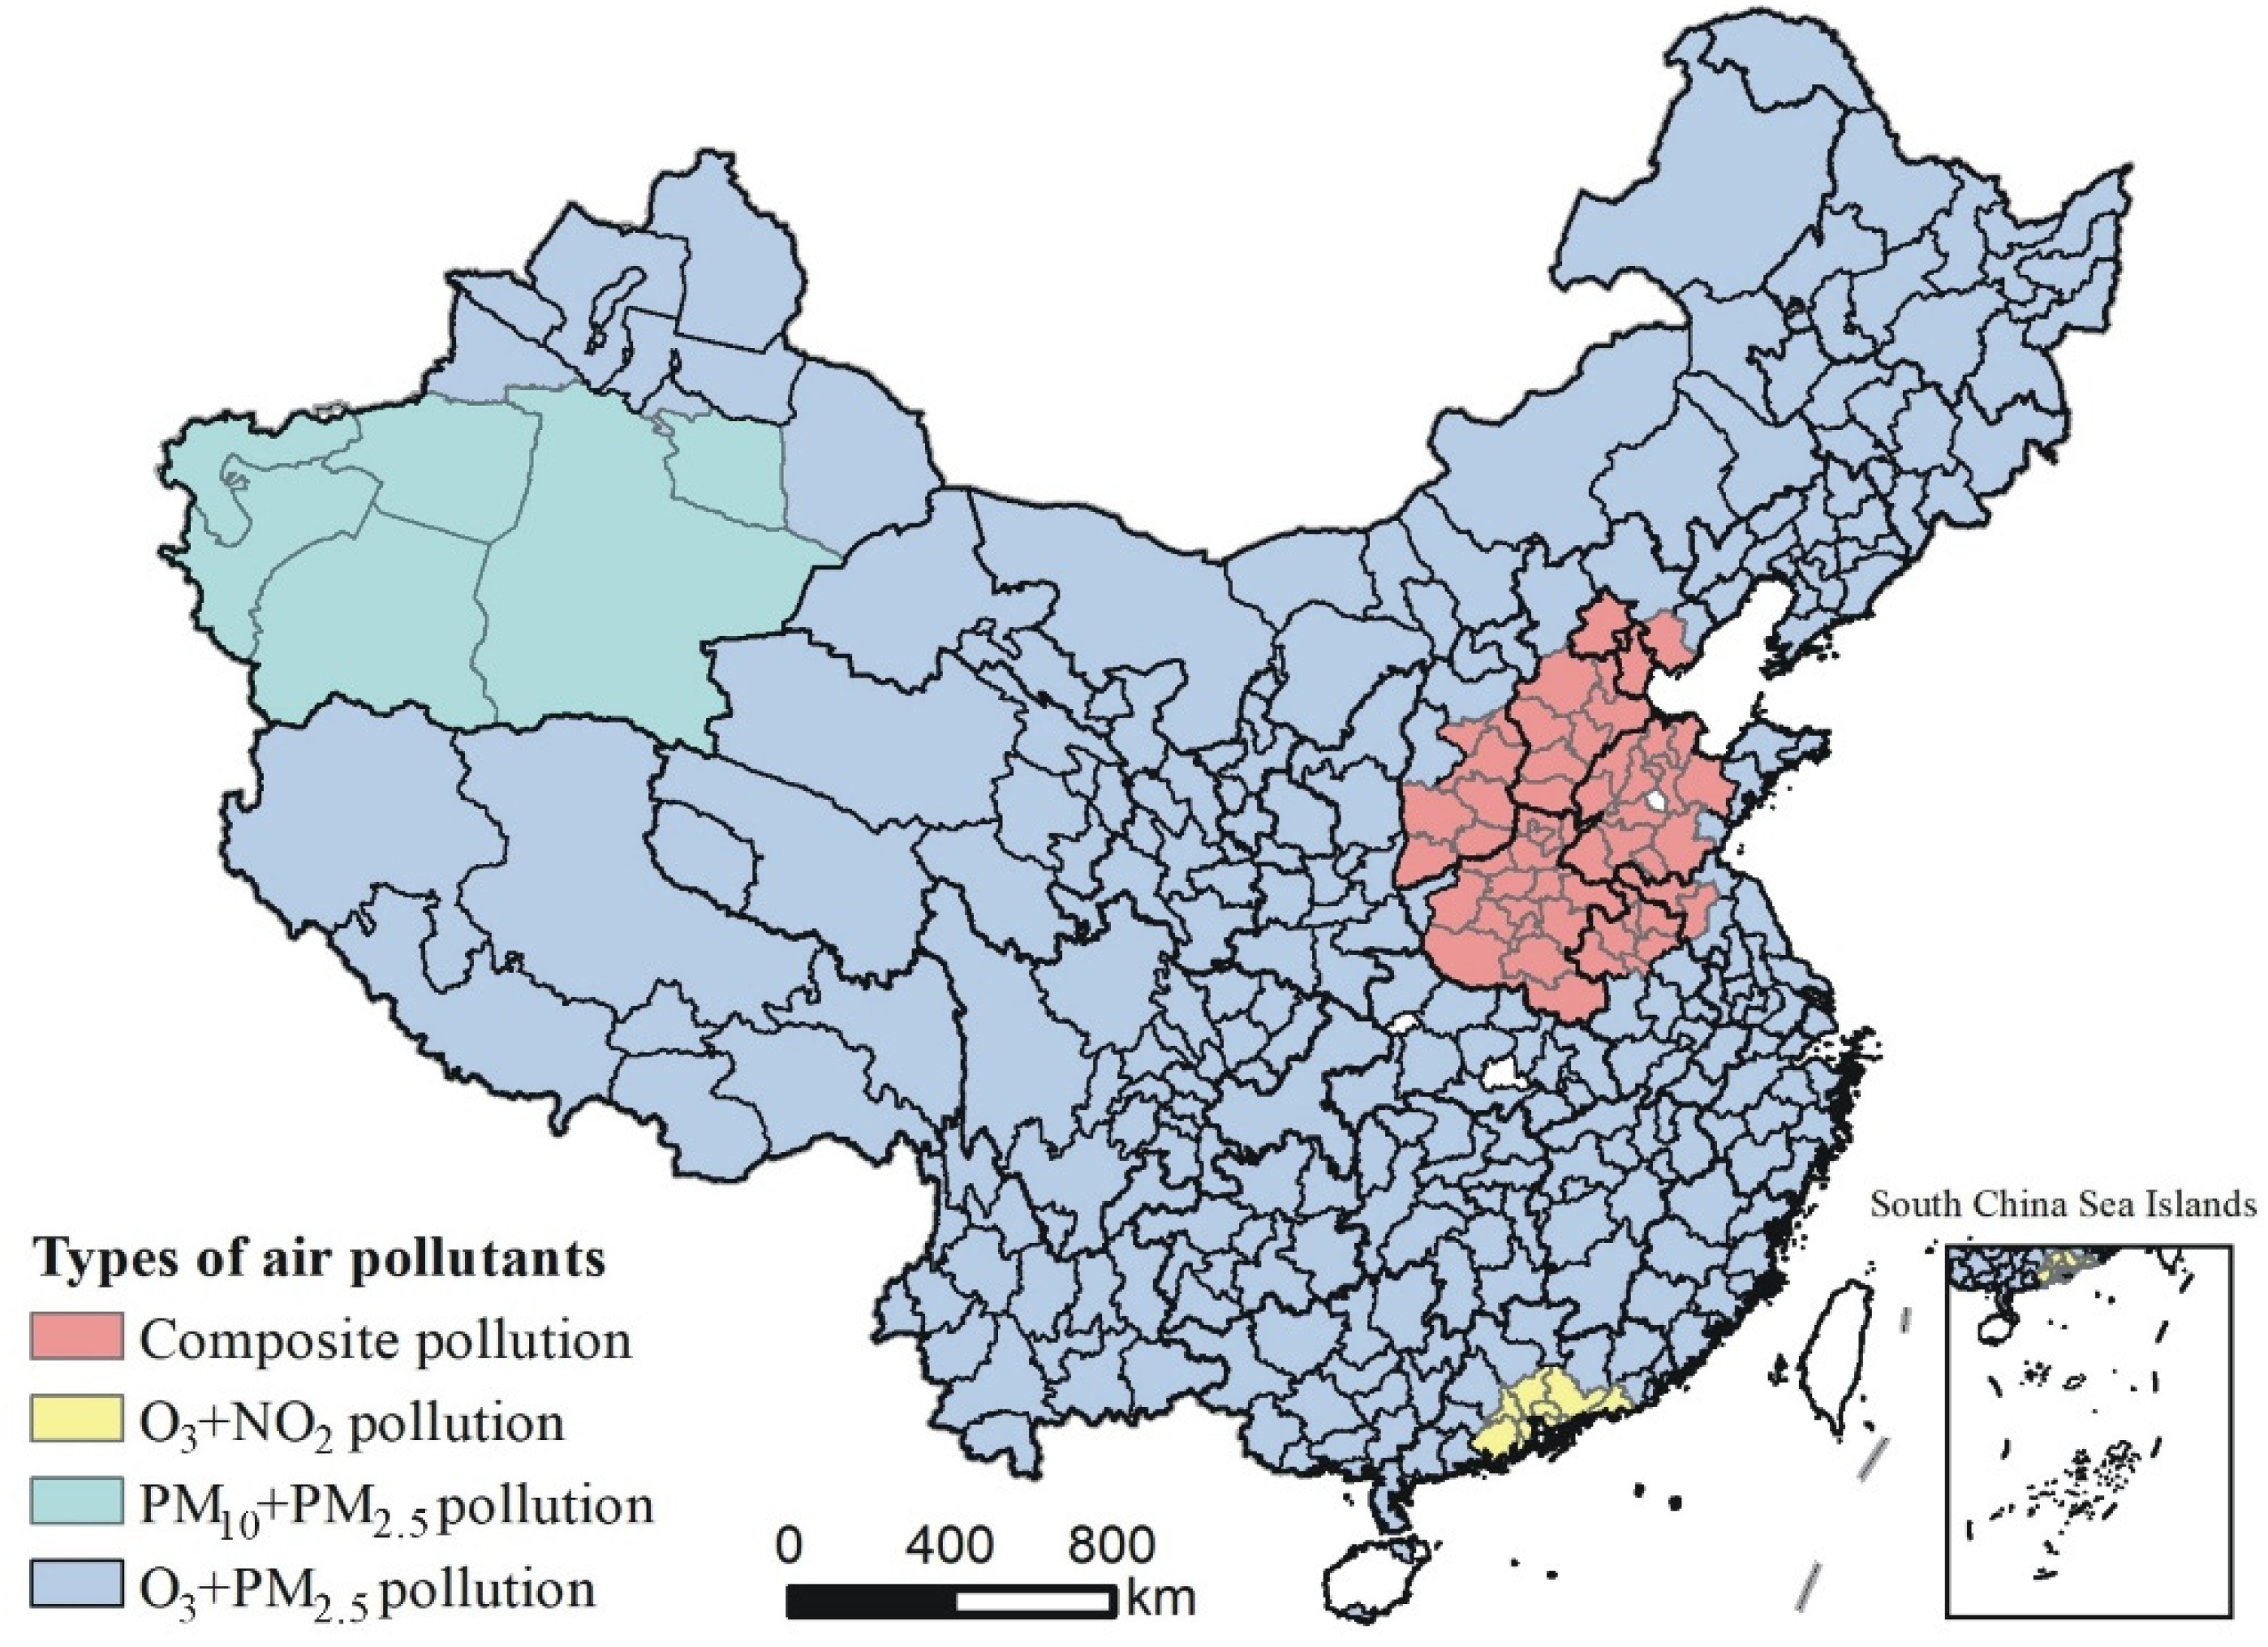
3.4. Region Types of the Major Pollutants during the CAP Periods
3.5. Spatial Heterogeneous Effects of the Driving Forces on CAP
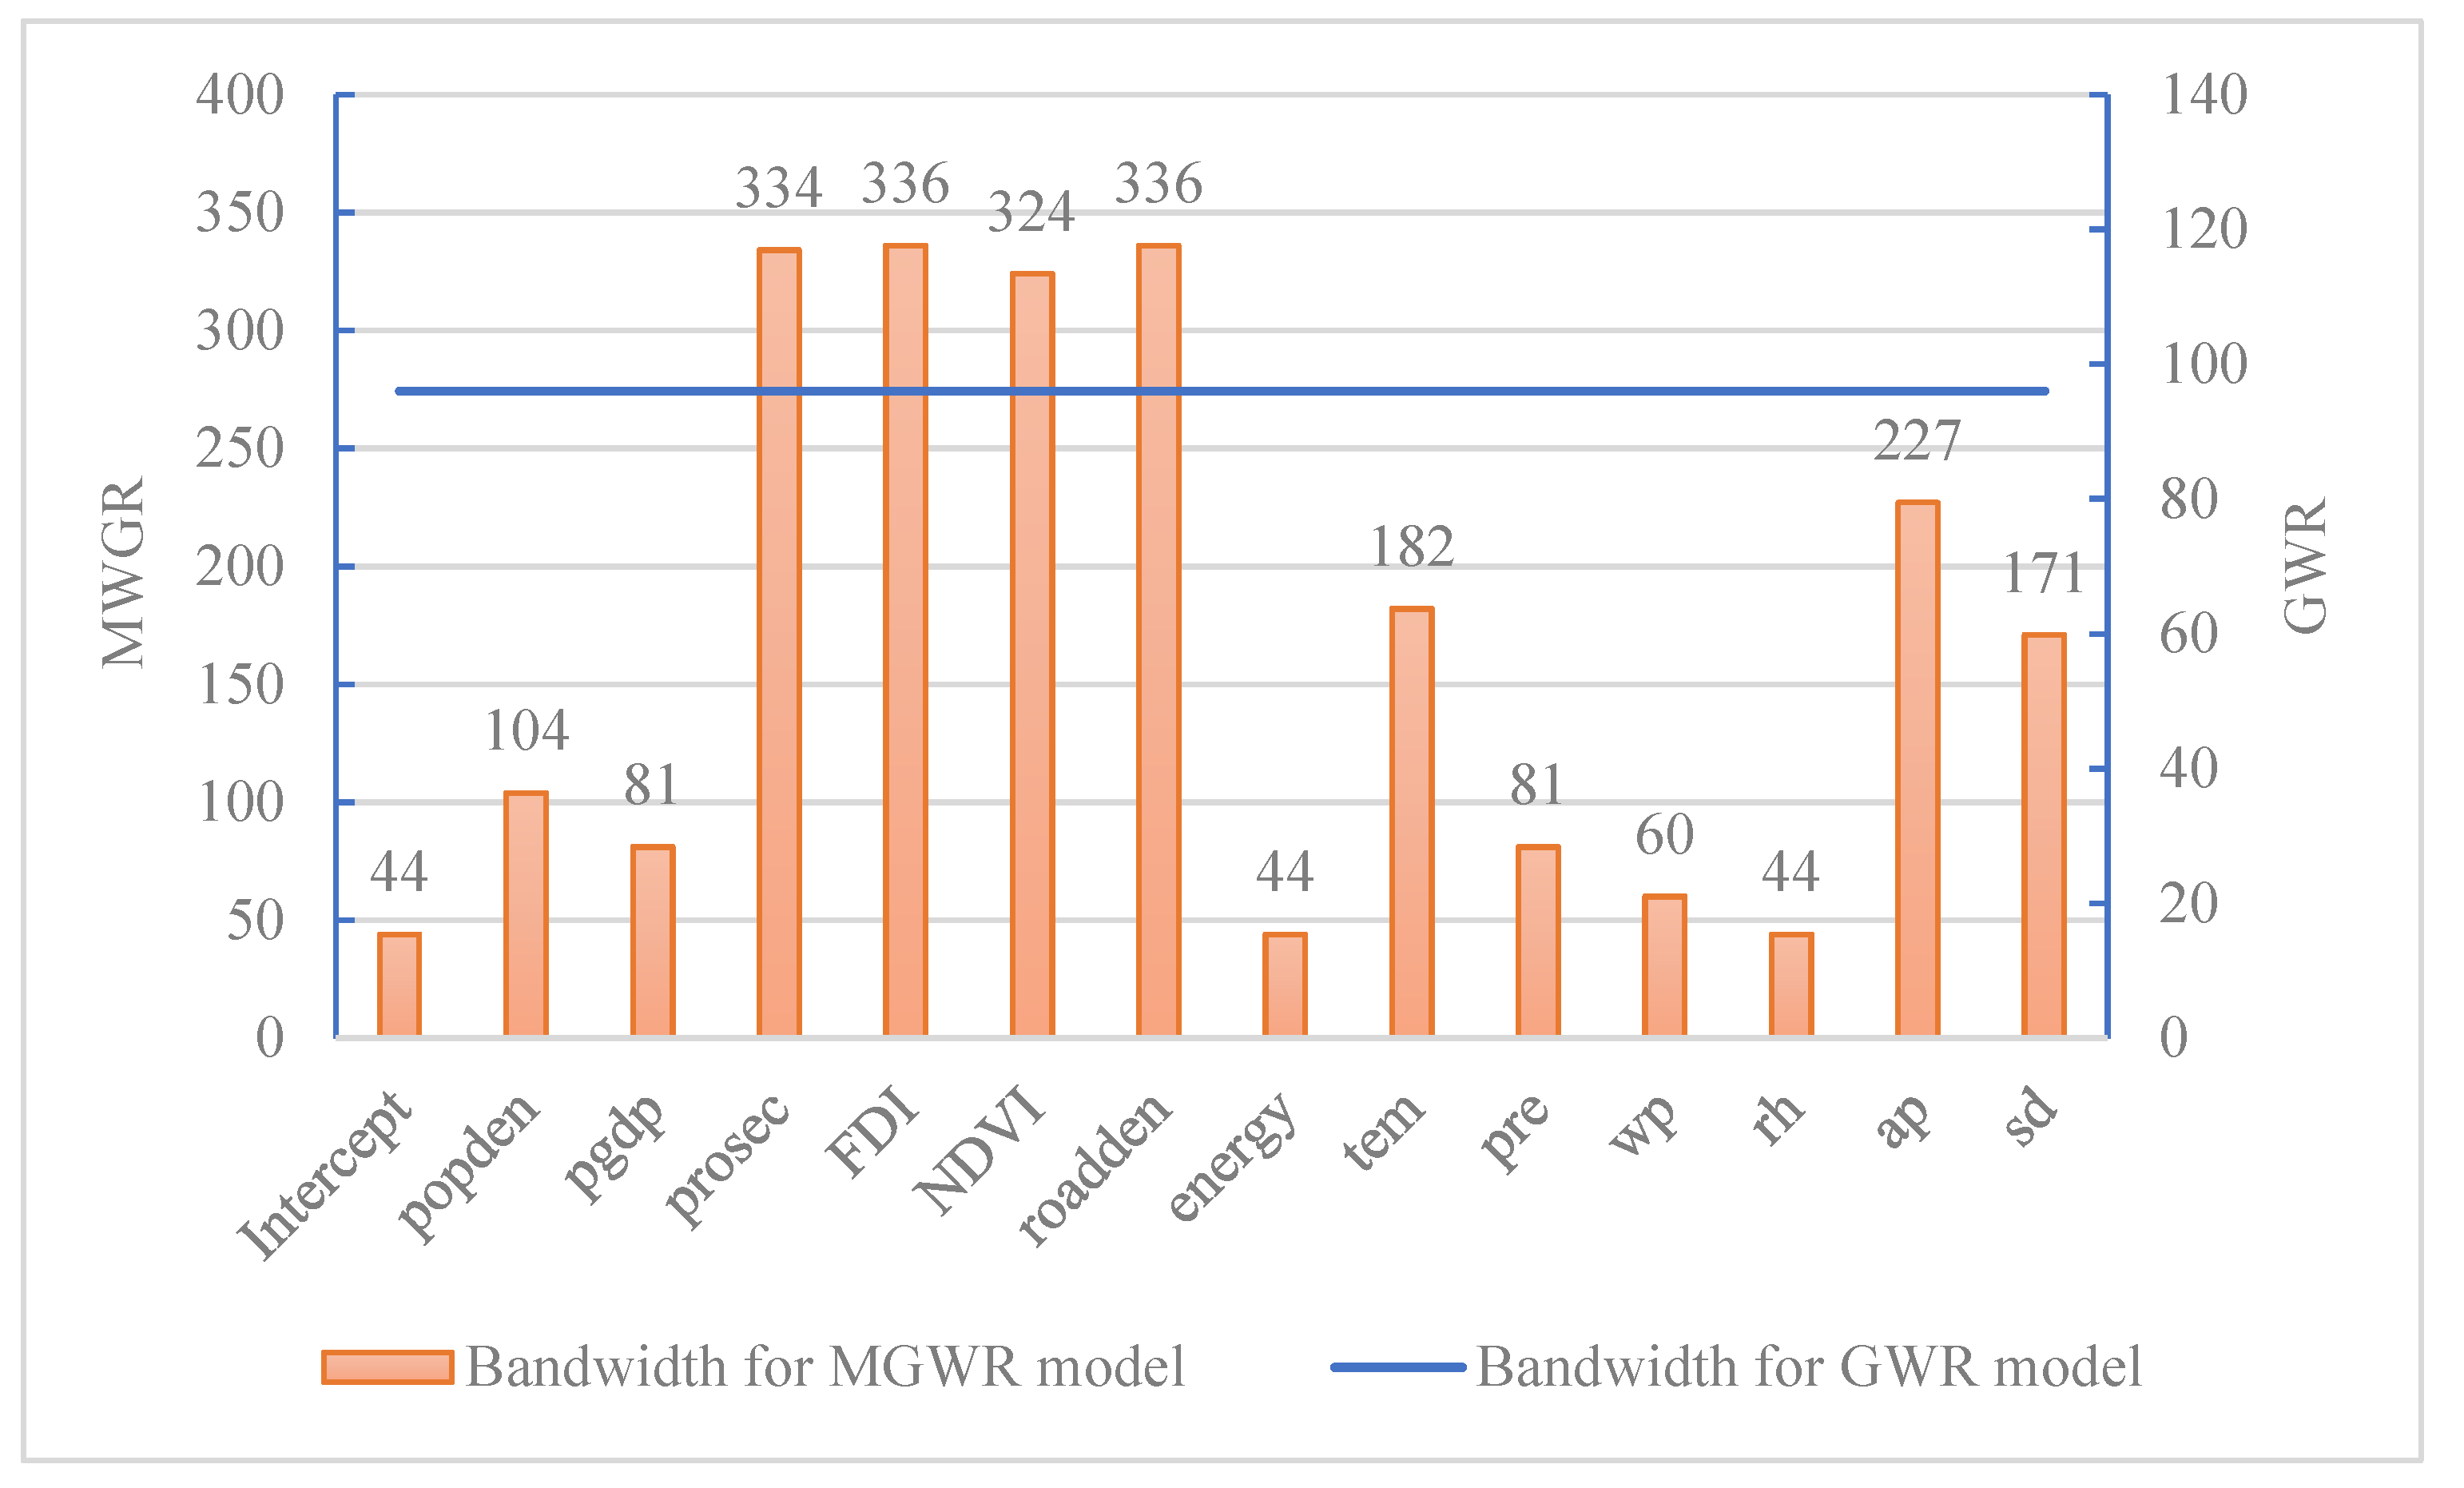
3.5.1. Goodness of Fit and Bandwidth
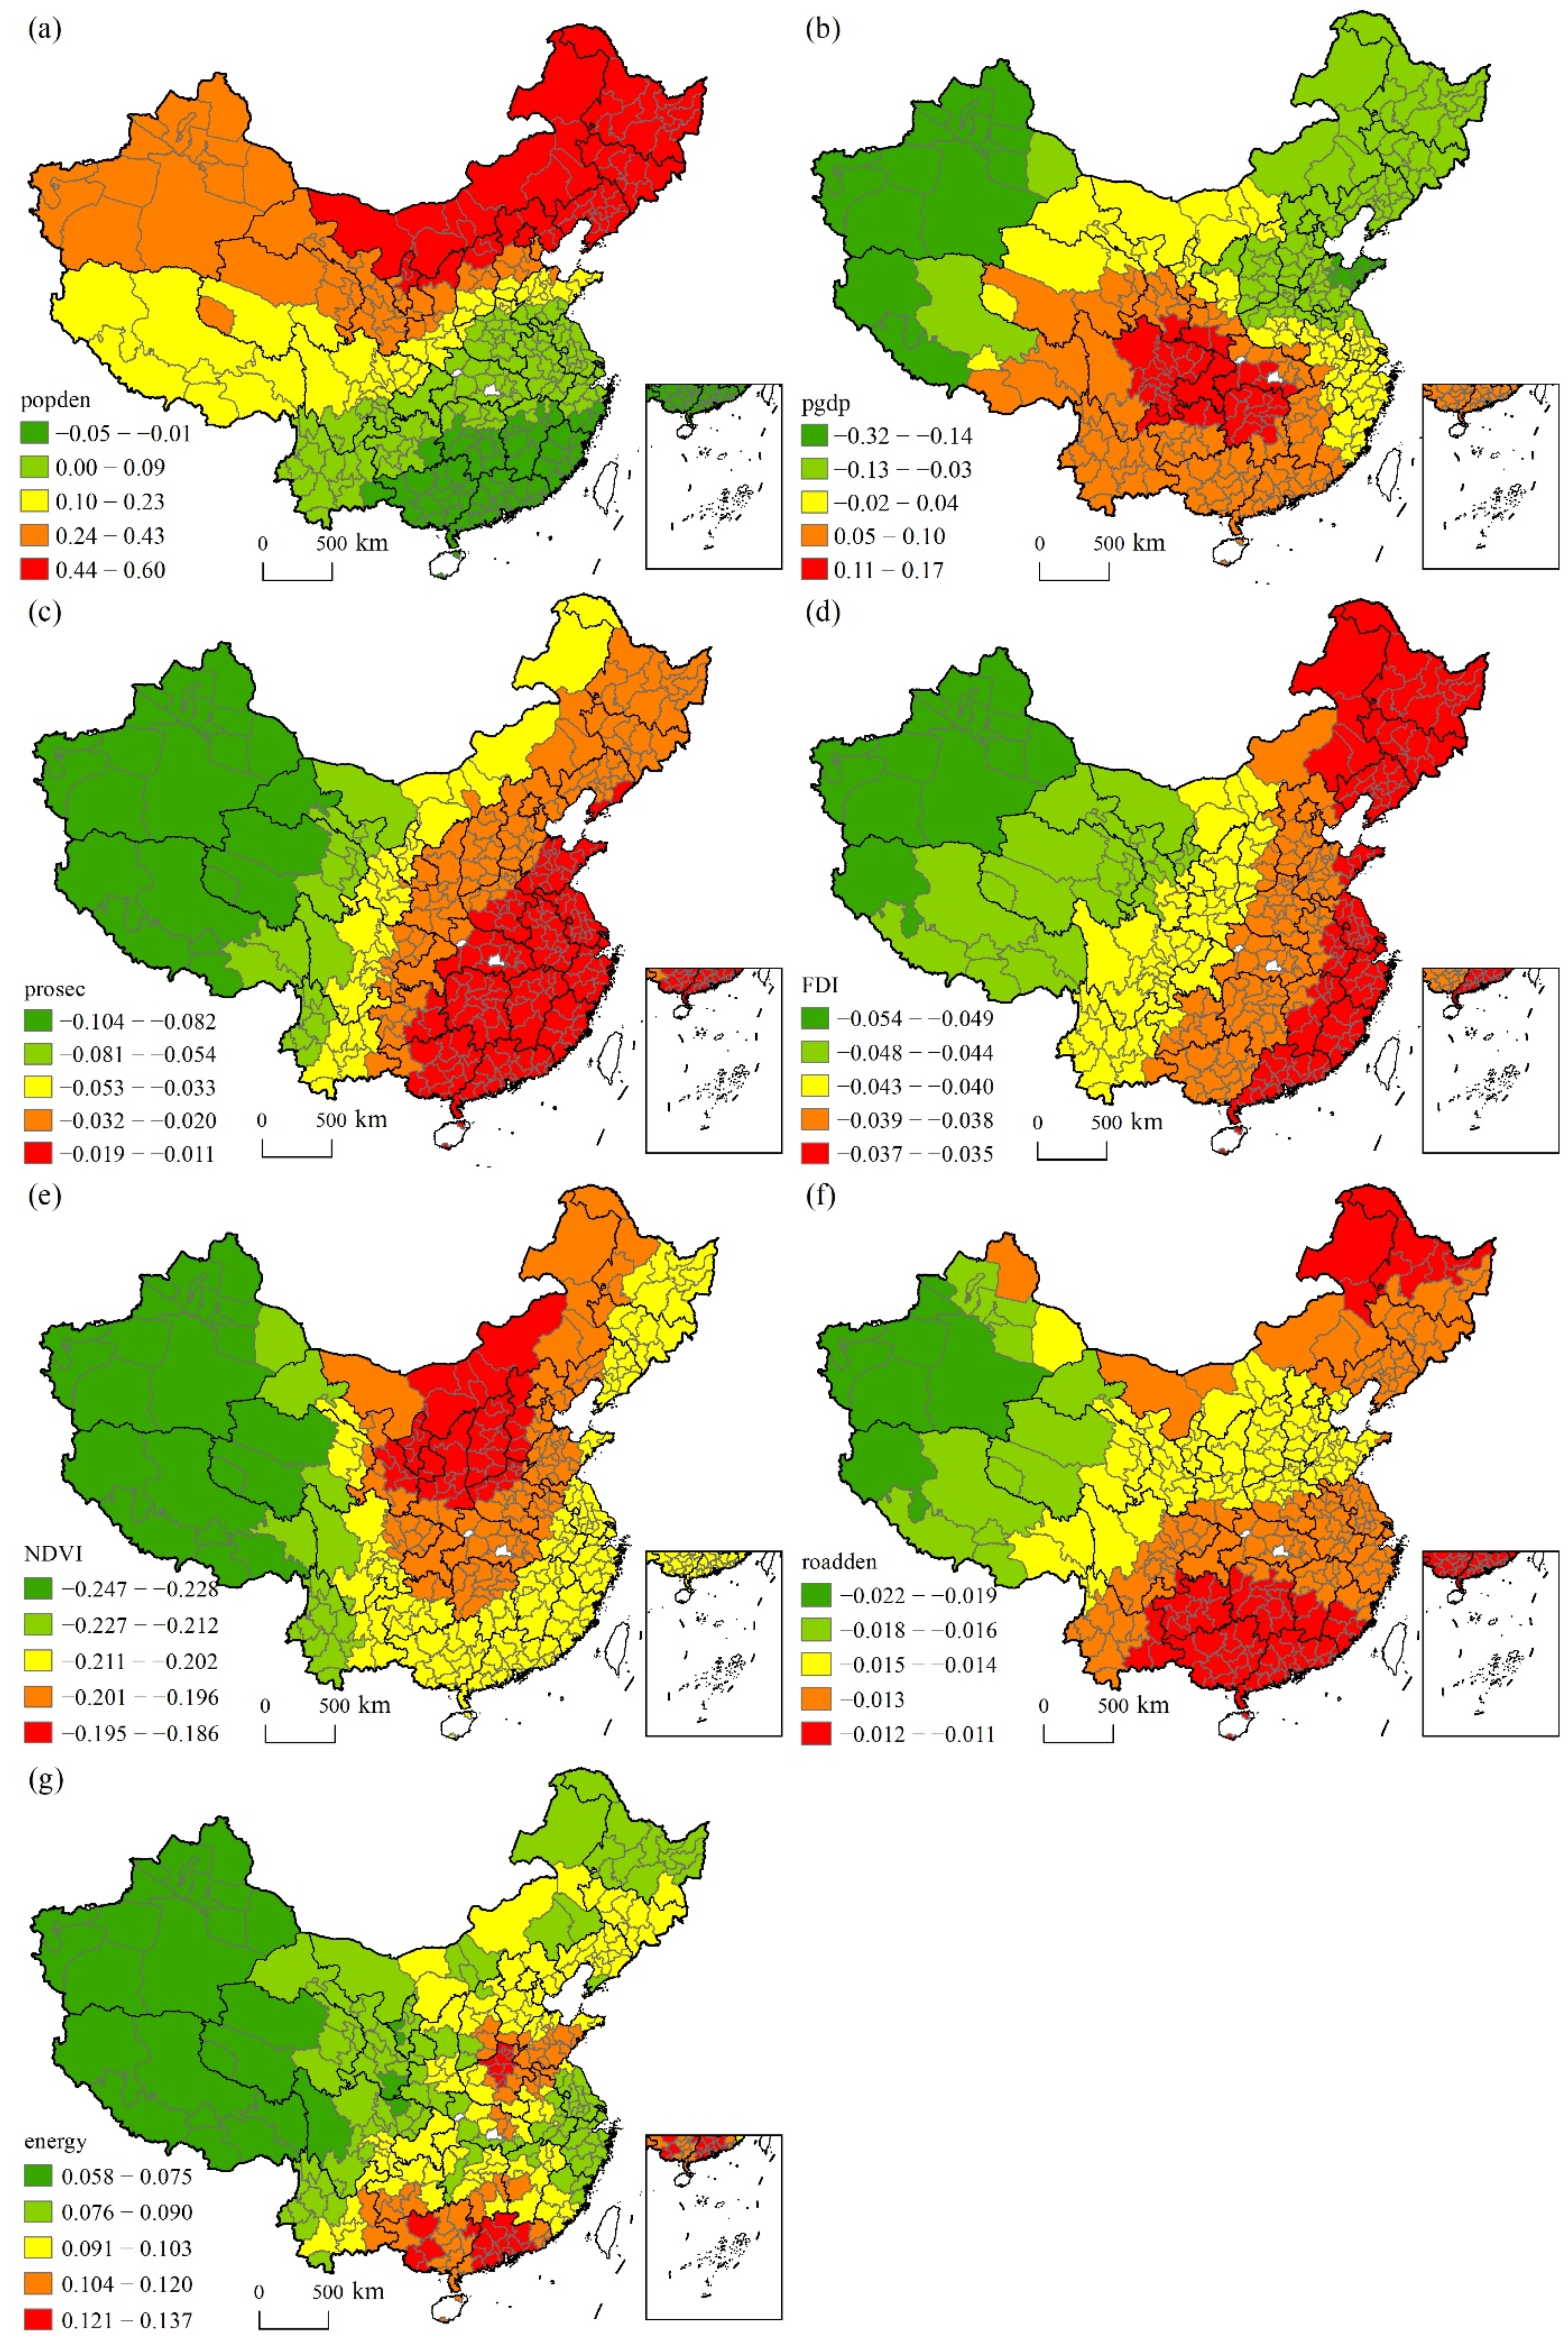
3.5.2. Estimated Parameter Results
4. Discussion
5. Conclusions
Author Contributions
Funding
Institutional Review Board Statement
Informed Consent Statement
Data Availability Statement
Conflicts of Interest
References
- China Statistical Yearbook 2020; China Statistics Press: Beijing, China, 2020.
- Zhan, D.S.; Kwan, M.P.; Zhang, W.Z.; Yu, X.F.; Meng, B.; Liu, Q.Q. The driving factors of air quality index in China. J. Clean. Prod. 2018, 197, 1342–1351. [Google Scholar] [CrossRef]
- Wang, S.J.; Zhou, C.S.; Wang, Z.B.; Feng, K.S.; Hubacek, K. The characteristics and drivers of fine particulate matter (PM2.5) distribution in China. J. Clean. Prod. 2017, 142, 1800–1809. [Google Scholar] [CrossRef]
- World Bank. Pollution. Available online: https://www.worldbank.org/en/topic/pollution#1 (accessed on 20 January 2022).
- Liu, B.M.; Ma, Y.Y.; Gong, W.; Zhang, M.; Yang, J. Study of continuous air pollution in winter over Wuhan based on ground-based and satellite observations. Atmos. Pollut. Res. 2018, 9, 156–165. [Google Scholar] [CrossRef]
- Wang, Y.S.; Yao, L.; Wang, L.L.; Liu, Z.R.; Ji, D.S.; Tang, G.Q.; Zhang, J.K.; Sun, Y.; Hu, B.; Xin, J.Y. Mechanism for the formation of the January 2013 heavy haze pollution episode over central and eastern China. Sci. China Earth Sci. 2014, 57, 14–25. [Google Scholar] [CrossRef]
- Cai, W.Y.; Xu, X.D.; Cheng, X.H.; Wei, F.Y.; Qiu, X.F.; Zhu, W.H. Impact of “blocking” structure in the troposphere on the wintertime persistent heavy air pollution in northern China. Sci. Total Environ. 2020, 741, 140325. [Google Scholar] [CrossRef]
- Hu, C.-Y.; Gao, X.; Fang, Y.; Jiang, W.; Huang, K.; Hua, X.-G.; Yang, X.-J.; Chen, H.-B.; Jiang, Z.-X.; Zhang, X.-J. Human epidemiological evidence about the association between air pollution exposure and gestational diabetes mellitus: Systematic review and meta-analysis. Environ. Res. 2020, 180, 108843. [Google Scholar] [CrossRef]
- Chen, Y.; Ebenstein, A.; Greenstone, M.; Li, H. Evidence on the impact of sustained exposure to air pollution on life expectancy from China’s Huai River policy. Proc. Natl. Acad. Sci. USA 2013, 110, 12936–12941. [Google Scholar] [CrossRef]
- Shen, Y.; Wu, Y.Y.; Chen, G.D.; Van Grinsven, H.J.M.; Wang, X.F.; Gu, B.J.; Lou, X.M. Non-linear increase of respiratory diseases and their costs under severe air pollution. Environ. Pollut. 2017, 224, 631–637. [Google Scholar] [CrossRef]
- Chen, R.; Zhao, Z.; Kan, H. Heavy smog and hospital visits in Beijing, China. Am. J. Respir. Crit. Care Med. 2013, 188, 1170–1171. [Google Scholar] [CrossRef]
- Bai, L.; Yang, J.; Zhang, Y.; Zhao, D.; Su, H. Durational effect of particulate matter air pollution wave on hospital admissions for schizophrenia. Environ. Res. 2020, 187, 109571. [Google Scholar] [CrossRef]
- Xiao, Q.Y.; Geng, G.N.; Liang, F.C.; Wang, X.; Lv, Z.; Lei, Y.; Huang, X.M.; Zhang, Q.; Liu, Y.; He, K.B. Changes in spatial patterns of PM2.5 pollution in China 2000-2018: Impact of clean air policies. Environ. Int. 2020, 141, 105776. [Google Scholar] [CrossRef] [PubMed]
- Wei, G.E.; Zhang, Z.K.; Ouyang, X.; Shen, Y.; Jiang, S.N.; Liu, B.L.; He, B.J. Delineating the spatial-temporal variation of air pollution with urbanization in the Belt and Road Initiative area. Environ. Impact Assess. Rev. 2021, 91, 106646. [Google Scholar] [CrossRef]
- Ye, W.F.; Ma, Z.Y.; Ha, X.Z.; Yang, H.C.; Weng, Z.X. Spatiotemporal patterns and spatial clustering characteristics of air quality in China: A city level analysis. Ecol. Indic. 2018, 91, 523–530. [Google Scholar] [CrossRef]
- Ma, G.Z.; Hofmann, E.T. Immigration and environment in the U.S.: A spatial study of air quality. Soc. Sci. J. 2019, 56, 94–106. [Google Scholar] [CrossRef]
- Li, J.; Garshick, E.; Hart, J.E.; Li, L.X.; Shi, L.H.; Al-Hemoud, A.; Huang, S.D.; Koutrakis, P. Estimation of ambient PM2.5 in Iraq and Kuwait from 2001 to 2018 using machine learning and remote sensing. Environ. Int. 2021, 151, 106445. [Google Scholar] [CrossRef] [PubMed]
- Jiang, W.; Gao, W.D.; Gao, X.M.; Ma, M.C.; Zhou, M.M.; Du, K.; Ma, X. Spatio-temporal heterogeneity of air pollution and its key influencing factors in the Yellow River Economic Belt of China from 2014 to 2019. J. Environ. Manag. 2021, 296, 113172. [Google Scholar] [CrossRef]
- Xu, L.J.; Zhou, J.X.; Guo, Y.; Wu, T.M.; Chen, T.T.; Zhong, Q.J.; Yuan, D.; Chen, P.Y.; Ou, C.Q. Spatiotemporal pattern of air quality index and its associated factors in 31 Chinese provincial capital cities. Air Qual. Atmos. Health 2017, 10, 601–609. [Google Scholar] [CrossRef]
- Shen, Y.; Zhang, L.P.; Fang, X.; Ji, H.Y.; Li, X.; Zhao, Z.W. Spatiotemporal patterns of recent PM2.5 concentrations over typical urban agglomerations in China. Sci. Total Environ. 2019, 655, 13–26. [Google Scholar] [CrossRef]
- Shen, F.Z.; Zhang, L.; Jiang, L.; Tang, M.Q.; Gai, X.Y.; Chen, M.D.; Ge, X.L. Temporal variations of six ambient criteria air pollutants from 2015 to 2018, their spatial distributions, health risks and relationships with socioeconomic factors during 2018 in China. Environ. Int. 2020, 137, 105556. [Google Scholar] [CrossRef]
- Lin, X.Q.; Wang, D. Spatiotemporal evolution of urban air quality and socioeconomic driving forces in China. J. Geogr. Sci. 2016, 26, 1533–1549. [Google Scholar] [CrossRef]
- Yuan, M.; Huang, Y.P.; Shen, H.F.; Li, T.W. Effects of urban form on haze pollution in China: Spatial regression analysis based on PM2.5 remote sensing data. Appl. Geogr. 2018, 98, 215–223. [Google Scholar] [CrossRef]
- Luo, J.Q.; Du, P.J.; Samat, A.; Xia, J.S.; Che, M.Q.; Xue, Z.H. Spatiotemporal Pattern of PM2.5 Concentrations in Mainland China and Analysis of Its Influencing Factors using Geographically Weighted Regression. Sci. Rep. 2017, 7, 40607. [Google Scholar] [CrossRef] [PubMed]
- Yang, J.H.; Ji, Z.M.; Kang, S.C.; Zhang, Q.G.; Chen, X.T.; Lee, S.Y. Spatiotemporal variations of air pollutants in western China and their relationship to meteorological factors and emission sources. Environ. Pollut. 2019, 254, 112952. [Google Scholar] [CrossRef] [PubMed]
- Wang, S.J.; Liu, X.P.; Yang, X.; Zou, B.; Wang, J.Y. Spatial variations of PM2.5 in Chinese cities for the joint impacts of human activities and natural conditions: A global and local regression perspective. J. Clean. Prod. 2018, 203, 143–152. [Google Scholar] [CrossRef]
- Hao, Y.; Liu, Y.M. The influential factors of urban PM2.5 concentrations in China: A spatial econometric analysis. J. Clean. Prod. 2016, 112, 1443–1453. [Google Scholar] [CrossRef]
- Abdo, A.-B.; Li, B.; Zhang, X.; Lu, J.; Rasheed, A. Influence of FDI on environmental pollution in selected Arab countries: A spatial econometric analysis perspective. Environ. Sci. Pollut. Res. 2020, 27, 28222–28246. [Google Scholar] [CrossRef]
- Yu, M.Y.; Xu, Y.; Li, J.Q.; Lu, X.C.; Xing, H.Q.; Ma, M.L. Geographic Detector-Based Spatiotemporal Variation and Influence Factors Analysis of PM2.5 in Shandong, China. Pol. J. Environ. Stud. 2021, 30, 463–475. [Google Scholar] [CrossRef]
- Xu, G.Y.; Ren, X.D.; Xiong, K.N.; Li, L.Q.; Bi, X.C.; Wu, Q.L. Analysis of the driving factors of PM2.5 concentration in the air: A case study of the Yangtze River Delta, China. Ecol. Indic. 2020, 110, 105889. [Google Scholar] [CrossRef]
- Liu, H.M.; Fang, C.L.; Zhang, X.L.; Wang, Z.Y.; Bao, C.; Li, F.Z. The effect of natural and anthropogenic factors on haze pollution in Chinese cities: A spatial econometrics approach. J. Clean. Prod. 2017, 165, 323–333. [Google Scholar] [CrossRef]
- Liu, Q.Q.; Wu, R.; Zhang, W.Z.; Li, W.; Wang, S.J. The varying driving forces of PM2.5 concentrations in Chinese cities: Insights from a geographically and temporally weighted regression model. Environ. Int. 2020, 145, 106168. [Google Scholar] [CrossRef]
- Guo, B.; Wang, X.X.; Pei, L.; Su, Y.; Zhang, D.M.; Wang, Y. Identifying the spatiotemporal dynamic of PM2.5 concentrations at multiple scales using geographically and temporally weighted regression model across China during 2015–2018. Sci. Total Environ. 2021, 751, 141765. [Google Scholar] [CrossRef] [PubMed]
- Zhan, D.; Kwan, M.-P.; Zhang, W.; Wang, S.; Yu, J. Spatiotemporal Variations and Driving Factors of Air Pollution in China. Int. J. Environ. Res. Public Health 2017, 14, 1538. [Google Scholar] [CrossRef] [PubMed] [Green Version]
- Zhou, C.S.; Li, S.J.; Wang, S.J. Examining the Impacts of Urban Form on Air Pollution in Developing Countries: A Case Study of China’s Megacities. Int. J. Env. Res. Pubulic Health 2018, 15, 1565. [Google Scholar] [CrossRef] [PubMed] [Green Version]
- Anselin, L. Under the hood issues in the specification and interpretation of spatial regression models. Agric. Econ. 2002, 27, 247–267. [Google Scholar] [CrossRef]
- Moore, T.W.; Dixon, R.W. A Spatiotemporal Analysis and Description of Hurricane Ivan’s (2004) Tornado Clusters. Pap. Appl. Geogr. 2015, 1, 192–196. [Google Scholar] [CrossRef]
- Brunsdon, C.; Fotheringham, S.; Charlton, M. Geographically weighted regression. J. R. Stat. Soc. Ser. D 1998, 47, 431–443. [Google Scholar] [CrossRef]
- Fotheringham, A.S.; Yang, W.; Kang, W. Multiscale geographically weighted regression (MGWR). Ann. Am. Assoc. Geogr. 2017, 107, 1247–1265. [Google Scholar] [CrossRef]
- Wang, X.; Zhou, D.Q. Spatial agglomeration and driving factors of environmental pollution: A spatial analysis. J. Clean. Prod. 2021, 279, 123839. [Google Scholar] [CrossRef]
- Jiang, H.Y.; Li, H.R.; Yang, L.S.; Li, Y.H.; Wang, W.Y.; Yan, Y.C. Spatial and Seasonal Variations of the Air Pollution Index and a Driving Factors Analysis in China. J. Environ. Qual. 2014, 43, 1853–1863. [Google Scholar] [CrossRef]


| Air Quality Index (AQI) | Air Quality Index Level | Air Quality Index Category | Major Pollutants |
|---|---|---|---|
| 0–50 | Level 1 | Excellent | SO2, NO2, CO, O3, PM10, PM2.5 |
| 51–100 | Level 2 | Good | |
| 101–150 | Level 3 | Light pollution | |
| 151–200 | Level 4 | Moderate pollution | |
| 201–300 | Level 5 | Heavy pollution | |
| >300 | Level 6 | Serious pollution |
| Measurement Indicators | Mean | Std. Dev. | Min | Max |
|---|---|---|---|---|
| Proportion of air pollution days (%) | 17.80 | 16 | 0.00 | 78.36 |
| Proportion of CAP days (%) | 11.50 | 13 | 0.00 | 73.15 |
| Frequency of CAP (times) | 8.02 | 8.06 | 0.00 | 29.00 |
| Maximum of CAP days (days) | 7.85 | 6.96 | 0.00 | 64.00 |
| Average of CAP days (days) | 4.20 | 2.41 | 0.00 | 16.69 |
| Types of Regions | PM10 | O3 | PM2.5 | NO2 | Count | Types |
|---|---|---|---|---|---|---|
| Group 1 | 7.28 | 58.17 | 56.58 | 0.06 | 53 | Composite pollution |
| Group 2 | 0.00 | 32.11 | 0.22 | 3.11 | 9 | O3 + NO2 pollution |
| Group 3 | 130.33 | 0.67 | 28.83 | 0.00 | 6 | PM10 + PM2.5 pollution |
| Group 4 | 1.20 | 8.46 | 13.87 | 0.14 | 269 | O3 + PM2.5 pollution |
| Mean | 4.43 | 16.77 | 20.49 | 0.20 | 337 |
| Goodness of Fit Statistic | OLS | GWR | MGWR |
|---|---|---|---|
| Residual sum of squares | 168.862 | 34.963 | 35.712 |
| Log likelihood | −362.321 | −96.184 | −99.764 |
| AIC | 752.642 | 388.233 | 358.079 |
| AICc | 756.133 | 469.288 | 407.464 |
| R2 | 0.5 | 0.897 | 0.894 |
| Adj. R2 | 0.48 | 0.855 | 0.862 |
| BIC | 762.635 | 661.153 | |
| Degree of Dependency (DoD) | 0.668 | 0.704 |
| Variable | OLS Model | MGWR Model | ||||
|---|---|---|---|---|---|---|
| Est. | Mean | STD | Min | Median | Max | |
| Intercept | 0.000 | 0.885 | 0.356 | 0.396 | 0.772 | 1.779 |
| popden | −0.006 | 0.173 | 0.213 | −0.055 | 0.068 | 0.596 |
| pgdp | −0.173 *** | 0.008 | 0.095 | −0.320 | 0.019 | 0.166 |
| prosec | −0.015 | −0.030 | 0.023 | −0.104 | −0.021 | −0.011 |
| FDI | 0.115 ** | −0.040 | 0.004 | −0.054 | −0.039 | −0.035 |
| NDVI | −0.141 ** | −0.204 | 0.011 | −0.247 | −0.203 | −0.186 |
| roadden | 0.208 *** | −0.014 | 0.001 | −0.022 | −0.014 | −0.011 |
| energy | 0.069 | 0.022 | 0.154 | −0.392 | 0.013 | 0.417 |
| tem | 0.230 *** | −0.437 | 0.324 | −0.833 | −0.466 | 0.079 |
| pre | −0.541 *** | 0.015 | 0.183 | −0.236 | −0.036 | 0.361 |
| ws | −0.149 ** | 0.056 | 0.223 | −0.571 | 0.085 | 0.443 |
| rh | −0.461 *** | −0.080 | 0.287 | −0.810 | −0.088 | 0.490 |
| ap | 0.435 *** | 0.535 | 0.089 | 0.403 | 0.518 | 0.658 |
| sd | −0.315 *** | −0.019 | 0.127 | −0.271 | 0.050 | 0.103 |
Publisher’s Note: MDPI stays neutral with regard to jurisdictional claims in published maps and institutional affiliations. |
© 2022 by the authors. Licensee MDPI, Basel, Switzerland. This article is an open access article distributed under the terms and conditions of the Creative Commons Attribution (CC BY) license (https://creativecommons.org/licenses/by/4.0/).
Share and Cite
Zhan, D.; Zhang, Q.; Xu, X.; Zeng, C. Spatiotemporal Distribution of Continuous Air Pollution and Its Relationship with Socioeconomic and Natural Factors in China. Int. J. Environ. Res. Public Health 2022, 19, 6635. https://doi.org/10.3390/ijerph19116635
Zhan D, Zhang Q, Xu X, Zeng C. Spatiotemporal Distribution of Continuous Air Pollution and Its Relationship with Socioeconomic and Natural Factors in China. International Journal of Environmental Research and Public Health. 2022; 19(11):6635. https://doi.org/10.3390/ijerph19116635
Chicago/Turabian StyleZhan, Dongsheng, Qianyun Zhang, Xiaoren Xu, and Chunshui Zeng. 2022. "Spatiotemporal Distribution of Continuous Air Pollution and Its Relationship with Socioeconomic and Natural Factors in China" International Journal of Environmental Research and Public Health 19, no. 11: 6635. https://doi.org/10.3390/ijerph19116635