
The Monetary Benefits of Reducing Emissions of Dioxin-like Compounds—Century Poisons—Over Half a Century: Evaluation of the Benefit per Ton Method


Abstract
:1. Introduction
2. Materials and Methods
2.1. Monetary BPT According to the Impact Path Approach
2.2. The Steps of the Simulations Used to Compute the Monetary BPT from Dioxin Emission Reductions
2.3. Data for Dioxin Settling Flux and Dioxin Emissions for Simulation in Each Region
2.4. Data for the LADD and CSF and the Simulated Risk of Cancer in Each Region
2.5. Data on the Projected Total Population for 2021–2070 in Each Region
2.6. Simulation of the Expected Number of People at Risk for Cancer and Expected Cancer Mortality
2.7. Monetization of the Cancer Mortality Risk by Conversion to Current Values
3. Results
3.1. Monetization of Expected Cancer Mortality
3.2. Computation of the BPT from the Elimination of Dioxin Emissions by Age Group, Region, and Time Period
3.3. Net BPT When Dioxin Emissions Have Been Reduced
4. Discussions
4.1. Policy Implications from the Results
4.2. BPT Comparison among Regions and across Age Groups
4.3. Uncertainty Analyses of Key Parameters
5. Conclusions
Author Contributions
Funding
Data Availability Statement
Acknowledgments
Conflicts of Interest
References
- Fuster, G.; Schuhmacher, M.; Domingo, J.L. Cost-benefit analysis as a tool for decision making in environmental projects: Application to a reduction of dioxin emissions in Tarragona Province, Spain. Environ. Sci. Pollut. Res. 2004, 11, 307–312. [Google Scholar] [CrossRef] [PubMed]
- Bröker, G.; Oehme, M.; Bollmacher, H.; Coleman, P.; Fraisse, D.; de Jong, A.; Knoche, M.; Lüitzke, K.; Marklund, S. Standardisation of dioxin measurement procedures for incinerator waste gases according to the European Standard EN 1948. Gefahrst. Reinhalt. L. 1998, 4, 141–147. [Google Scholar]
- Bernard, A.; Broeckaert, F.; De Poorter, G.; De Cock, A.; Hermans, C.; Saegerman, C.; Houins, G. The Belgian PCB/dioxin incident: Analysis of the food chain contamination and health risk evaluation. Environ. Res. 2002, 88, 1–18. [Google Scholar] [CrossRef] [PubMed] [Green Version]
- Hays, S.M.; Aylward, L.L. Dioxin risks in perspective: Past, present, and future. Regul. Toxicol. Pharm. 2003, 37, 202–217. [Google Scholar] [CrossRef]
- Environmental Protection Administration, Executive Yuan, R.O.C. (Taiwan). Waste Incinerator Dioxin Control and Emission Standards. 2020. Available online: https://law.moj.gov.tw/ENG/LawClass/LawAll.aspx?pcode=O0020031 (accessed on 10 October 2021).
- Karademir, A. Health risk assessment of PCDD/F emissions from a hazardous and medical waste incinerator in Turkey. Environ. Int. 2004, 30, 1027–1038. [Google Scholar] [CrossRef]
- Nguyen, H.M.; Tu, B.M.; Watanabe, M.; Kunisue, T.; Monirith, I.; Tanabe, S.; Sakai, S.; Subramanian, A.; Sasikumar, K.; Pham, H.V.; et al. Open dumping site in Asian developing countries: A potential source of polychlorinated dibenzo-p-dioxins and polychlorinated dibenzofurans. Environ. Sci. Technol. 2003, 37, 1493–1502. [Google Scholar]
- Liu, G.; Zheng, M.; Jiang, X.; Jin, R.; Zhao, Y.; Zhan, J. Insights into the emission reductions of multiple unintentional persistent organic pollutants from industrial activities. Chemosphere 2016, 144, 420–424. [Google Scholar] [CrossRef]
- Ayodele, T.R.; Ogunjuyigbe, A.S.O.; Alao, M.A. Life cycle assessment of waste-to-energy (WtE) technologies for electricity generation using municipal solid waste in Nigeria. Appl. Energy 2017, 201, 200–218. [Google Scholar] [CrossRef]
- Nadal, M.; Schuhmacher, M.; Domingo, J.L. Cost–benefit analysis of using sewage sludge as alternative fuel in a cement plant: A case study. Environ. Sci. Pollut. Res. Int. 2009, 16, 322–328. [Google Scholar] [CrossRef]
- Bates, M.E.; Sparrevik, M.; de Lichy, N.; Linkov, I. The value of information for managing contaminated sediments. Environ. Sci. Technol. 2014, 48, 9478–9485. [Google Scholar] [CrossRef]
- Sundqvist, K.L.; Tysklind, M.; Cato, I.; Bignert, A.; Wiberg, K. Levels and homologue profiles of PCDD/Fs in sediments along the Swedish coast of the Baltic Sea. Environ. Sci. Pollut. Res. 2009, 16, 396–409. [Google Scholar] [CrossRef] [PubMed]
- Lascano-Alcoser, V.H.; Velthuis, A.G.J.; van der Fels-Klerx, H.J.; Hoogenboom, L.A.P.; Oude Lansink, A.G.J.M. Optimizing bulk milk dioxin monitoring based on costs and effectiveness. J. Dairy Sci. 2013, 96, 4125–4141. [Google Scholar] [CrossRef] [PubMed] [Green Version]
- Nakao, T.; Aozasa, O.; Ohta, S.; Miyata, H. Assessment of human exposure to PCDDs, PCDFs and Co-PCBs using hair as a human pollution indicator sample I: Development of analytical method for human hair and evaluation for exposure. Chemosphere 2002, 48, 885–896. [Google Scholar] [CrossRef]
- Schuhmacher, M.; Maria, M.; Nadal, M.; Domingo, J.L. Concentrations of Dioxins and furans in breast milk of women living near a hazardous waste incinerator in Catalonia, Spain. Environ. Int. 2019, 125, 334–345. [Google Scholar] [CrossRef]
- Food and Agriculture Organization of the United Nations (FAO). The State of World Fisheries and Aquaculture 2018: Meeting the Sustainable Development Goals; FAO: Rome, Italy, 2018. [Google Scholar]
- Bell, J.G.; Waagbø, R. Safe and nutritious aquaculture produce: Benefits and risks of alternative sustainable aquafeeds. In Aquaculture in the Ecosystem; Holmer, M., Black, K., Duarke, C.M., Marbà, N., Karakassis, I., Eds.; Springer: Dordrecht, The Netherlands, 2008; pp. 185–226. [Google Scholar]
- Leino, O.; Tainio, M.; Tuomisto, J.T. Comparative risk analysis of dioxins in fish and fine particles from heavy-duty vehicles. Risk Anal. 2008, 28, 127–140. [Google Scholar] [CrossRef]
- Rheinberger, C.M.; Hammitt, J.K. Risk trade-offs in fish consumption: A public health perspective. Environ. Sci. Technol. 2012, 46, 12337–12346. [Google Scholar] [CrossRef]
- Thomsen, S.T.; Pires, S.M.; Devleesschauwer, B.; Poulsen, M.; Fagt, S.; Ygil, K.H.; Andersen, R. Investigating the risk-benefit balance of substituting red and processed meat with fish in a Danish diet. Food Chem. Toxicol. 2018, 120, 50–63. [Google Scholar] [CrossRef] [Green Version]
- Turyk, M.E.; Bhavsar, S.P.; Bowerman, W.; Boysen, E.; Clark, M.; Diamond, M.; Mergler, D.; Pantazopoulos, P.; Schantz, S.; Carpenter, D.O. Risks and benefits of consumption of great lakes fish. Environ. Health Perspect. 2012, 120, 11–18. [Google Scholar] [CrossRef] [Green Version]
- Scito, S.; Prearo, M.; Desiato, R.; Bulfon, C.; Burioli, E.A.V.; Esposito, G.; Guglielmetti, C.; Dell’atti, L.; Ru, G.; Volpatti, D.; et al. Dioxin-like compounds in lake fish species: Evaluation by DR-CALUX bioassay. J. Food Prot. 2018, 81, 842–847. [Google Scholar] [CrossRef]
- Rovira, J.; Mari, M.; Nadal, M.; Schuhmacher, M.; Domingo, J.L. Environmental monitoring of metals, PCDD/Fs and PCBs as a complementary tool of biological surveillance to assess human health risks. Chemosphere 2010, 80, 1183–1189. [Google Scholar] [CrossRef]
- Fuster, G.; Schuhmacher, M.; Domingo, J.L. Human exposure to dioxins and furans: Application of the substance flow analysis to health risk assessment. Environ. Sci. Pollut. Res. 2002, 9, 241–249. [Google Scholar] [CrossRef] [PubMed]
- Nadal, M.; Schuhmacher, M.; Domingo, J.L. Probabilistic human health risk of PCDD/F exposure: A socioeconomic assessment. J. Environ. Monit. 2004, 6, 926–931. [Google Scholar] [CrossRef] [PubMed]
- Abreu, G.C.; de Carvalho, J.A., Jr.; da Silva, B.E.C.; Pedrini, R.H. Operational and environmental assessment on the use of charcoal in iron ore sinter production. J. Clean. Prod. 2015, 101, 387–394. [Google Scholar] [CrossRef]
- Zhang, G.; Huang, X.; Liao, W.; Kang, S.; Ren, M.; Hai, J. Measurement of dioxin emissions from a small-scale waste incinerator in the absence of air pollution controls. Int. J. Environ. Res. Public Health 2019, 16, 1267. [Google Scholar] [CrossRef] [Green Version]
- Melnick, R.L.; Kohn, M.C.; Portier, C.J. Implications for risk assessment of suggested nongenotoxic mechanisms of chemical carcinogenesis. Environ. Health Perspect. 1996, 104, 123–134. [Google Scholar]
- Clewell, R.A.; Thompson, C.M.; Clewell, H.J., III. Dose-dependence of chemical carcinogenicity: Biological mechanisms for thresholds and implications for risk assessment. Chem.-Biol. Interact. 2019, 301, 112–127. [Google Scholar] [CrossRef]
- Riahi, K.; van Vuuren, D.P.; Kriegler, E.; Edmonds, J.; O’Neill, B.C.; Fujimori, S.; Bauer, N.; Calvin, K.; Dellink, R.; Fricko, O.; et al. The shared socioeconomic pathways and their energy, land use, and greenhouse gas emissions implications: An overview. Global Environ. Chang. 2017, 42, 153–168. [Google Scholar] [CrossRef] [Green Version]
- Domingo, J.L.; Agramunt, M.C.; Nadal, M.; Schuhmacher, M.; Corbella, J. Health risk assessment of PCDD/PCDF exposure for the population living in the vicinity of a municipal waste incinerator. Arch. Environ. Contam. Toxicol. 2002, 43, 461–465. [Google Scholar] [CrossRef]
- Schuhmacher, M.; Rodriguez-Larena, M.C.; Agramunt, M.C.; Diaz-Ferrero, J.; Domingo, J.L. Environmental impact of a new hazardous waste incinerator in Catalonia, Spain: PCDD/PCDF levels in herbage samples. Chemosphere 2002, 48, 187–193. [Google Scholar] [CrossRef]
- Wigle, D.T.; Arbuckle, T.E.; Turner, M.C.; Bérubé, A.; Yang, Q.; Liu, S.; Krewski, D. Epidemiologic evidence of relationships between reproductive and child health outcomes and environmental chemical contaminants. J. Toxicol. Environ. Health B Crit. Rev. 2008, 11, 373–517. [Google Scholar] [CrossRef]
- Burns, C.J.; Collins, J.J.; Humphry, N.; Bodner, K.M.; Aylward, L.L.; McBride, D. Correlates of serum dioxin to self-reported exposure factors. Environ. Res. 2010, 110, 131–136. [Google Scholar] [PubMed]
- Shih, Y.-H.; Kasaon, S.-J.; Tseng, C.-H.; Wang, H.-C.; Chen, L.-L.; Chang, Y.-M. Health risks and economic costs of exposure to PCDD/Fs from open burning: A case study in Nairobi, Kenya. Air Qual. Atmos. Health 2016, 9, 201–211. [Google Scholar] [CrossRef]
- Cao, Z.; Fiedler, H.; Wang, B.; Zhang, T.; Yu, G.; Huang, J.; Deng, S. Economic status as a determinant of national PCDD/PCDF releases and implications for PCDD/PCDF reduction. Chemosphere 2013, 91, 328–335. [Google Scholar] [CrossRef] [PubMed]
- Woods, B.; Revill, P.; Sculpher, M.; Claxton, K. Country-level cost-effectiveness thresholds: Initial estimates and the need for further research. Value in Health 2016, 16, 929–935. [Google Scholar] [CrossRef] [PubMed] [Green Version]
- Dvořák, R.; Chlápek, P.; Jecha, D.; Puchýř, R.; Stehlík, P. New approach to common removal of dioxins and NOx as a contribution to environmental protection. J. Clean. Prod. 2010, 18, 881–888. [Google Scholar] [CrossRef]
- Environmental Protection Administration, Executive Yuan, R.O.C. (Taiwan). Manual of Cost Benefit Analysis for Environmental Policy and Development Projects; Environmental Protection Administration: Taipei, Taiwan, 2012.
- United States Environmental Protection Agency. Evaluating Reduced-Form Tools for Estimating Air Quality Benefits. 2019. Available online: https://www.epa.gov/benmap/reduced-form-evaluation-project-report (accessed on 28 November 2021).
- United States Environmental Protection Agency. BenMAP, Environmental Benefits Mapping and Analysis Program-Community Edition, User’s Manual. 2018. Available online: https://www.epa.gov/sites/production/files/2015-04/documents/benmap-ce_user_manual_march_2015.pdf (accessed on 2 November 2021).
- Sacks, J.D.; Fann, N.; Gumy, S.; Kim, I.; Ruggeri, G.; Mudu, P. Quantifying the public health benefits of reducing air pollution: Critically assessing the features and capabilities of WHO’s AirQ+ and U.S. EPA’s environmental benefits mapping and analysis program—Community edition (BenMAP-CE). Atmosphere 2020, 11, 516. [Google Scholar] [CrossRef]
- Chae, Y.; Park, J. Quantifying costs and benefits of integrated environmental strategies of air quality management and greenhouse gas reduction in the Seoul Metropolitan Area. Energy Policy 2011, 39, 5296–5308. [Google Scholar] [CrossRef]
- Heo, J.; Kim, D.; Lee, G. Congener profiles and source-wise phase partitioning analysis of PCDDs/Fs and PCBs in Gyeonggi-Do ambient air, South Korea. Int. J. Environ. Res. Public Health 2014, 11, 11065–11080. [Google Scholar] [CrossRef]
- Nawahda, A. Reductions of PM2.5 air concentrations and possible effects on premature mortality in Japan. Water Air Soil Pollut. 2013, 224, 1–7. [Google Scholar] [CrossRef]
- Boldo, E.; Linares, C.; Aragonés, N.; Lumbreras, J.; Borge, R.; Paz, D.; Pérez-Gómez, B.; Fernández-Navarro, P.; García-Pérez, J.; Pollán, M.; et al. Air quality modeling and mortality impact of fine particles reduction policies in Spain. Environ. Res. 2014, 128, 15–26. [Google Scholar] [CrossRef] [Green Version]
- Manojkumar, N.; Srimuruganandam, B. Health benefits of achieving fine particulate matter standards in India—A nationwide assessment. Sci. Total Environ. 2020, 763, 142999. [Google Scholar] [CrossRef] [PubMed]
- European Commission. ExternE, Externalities of Energy: Methodology 2005 Update. 2005. Available online: http://www.externe.info/externe_d7/sites/default/files/methup05a.pdf (accessed on 30 October 2021).
- United States Environmental Protection Agency. Estimating the Benefit per Ton of Reducing PM2.5 Precursors from 17 Sectors. Technical Support Document. 2013. Available online: https://19january2017snapshot.epa.gov/sites/production/files/2014-10/documents/sourceapportionmentbpttsd.pdf (accessed on 15 October 2021).
- United States Environmental Protection Agency. Estimating the Benefit Per Yon of Reducing PM2.5 Precursors from 17 Sectors (2018 Update Version). Technical Support Document. 2018. Available online: https://www.epa.gov/sites/default/files/2018-02/documents/sourceapportionmentbpttsd_2018.pdf (accessed on 30 September 2021).
- Fann, N.; Fulcher, C.M.; Hubbell, B.J. The influence of location, source, and emission type in estimates of the human health benefits of reducing a ton of air pollution. Air Qual. Atmos. Health 2009, 2, 169–176. [Google Scholar] [CrossRef] [PubMed] [Green Version]
- Fann, N.; Fulcher, C.M.; Baker, K.R. The recent and future health burden of air pollution apportioned across U.S. sectors. Environ. Sci. Technol. 2013, 47, 3580–3589. [Google Scholar] [CrossRef] [PubMed]
- Environmental Protection Administration, Executive Yuan, R.O.C. (Taiwan). A Study of Risk Reduction Impact Assessment and Standard Setting for Fine Particular Matter; NSC100-EPA-F-001-001; Environmental Protection Administration: Taipei, Taiwan, 2013.
- Environmental Protection Administration, Executive Yuan, R.O.C. (Taiwan). The Project of Draft Control Strategy and Emission Investigation for Dioxins and Heavy Metals from the Stationary Sources; EPA-102-FA12-03-A096; Sinotech Engineering Services Ltd.: Taipei, Taiwan, 2013.
- Council of Agriculture, Executive Yuan, R.O.C. (Taiwan). Balance Sheet of Food Grains. 2009. Available online: https://agrstat.coa.gov.tw/sdweb/public/inquiry/InquireAdvance.aspx (accessed on 2 January 2022).
- Ministry of Health and Welfare, Executive Yuan, R.O.C. (Taiwan). Compilation of Exposure Factors. 2008. Available online: https://docsplayer.com/26101974-%E5%8F%B0%E7%81%A3%E4%B8%80%E8%88%AC%E6%B0%91%E7%9C%BE%E6%9A%B4%E9%9C%B2%E5%8F%83%E6%95%B8%E5%BD%99%E7%B7%A8.html (accessed on 26 October 2021).
- United States Environmental Protection Agency. Health Assessment Document for 2,3,7,8-Tetrachlorodibenzo-p-Dioxin (TCDD) and Related Compounds, Volume II of III; EPA/600/BP-92/001b; United States Environmental Protection Agency: Washington, DC, USA, 1994.
- Taiwan Environmental Protection Administration. Dioxin and Heavy Metals, Air Quality Protection Web. 2021. Available online: https://air.epa.gov.tw/EnvTopics/StationarySource_12.aspx (accessed on 20 April 2022).
- National Development Council, Executive Yuan, R.O.C. (Taiwan). Population Projections for the R.O.C.; Taiwan: 2020~2070. 2021. Available online: https://pop-proj.ndc.gov.tw/dataSearch.aspx?r=2&uid=2104&pid=59 (accessed on 10 November 2021).
- Department of Household Registration, Ministry of Interior, R.O.C. (Taiwan). Household Registration Statistics Data Analysis. 2021. Available online: https://www.ris.gov.tw/app/portal/346 (accessed on 12 January 2022).
- Taiwan Cancer Registry. Cancer Survival Rates of Five Years in Taiwan. 2019. Available online: http://tcr.cph.ntu.edu.tw/main.php?Page=A5B3 (accessed on 20 December 2021).
- Liou, J.L. Effect of income heterogeneity on valuation of mortality risk in Taiwan: An application of unconditional quantile regression method. Int. J. Environ. Res. Pub. Health 2019, 16, 1620. [Google Scholar] [CrossRef] [PubMed] [Green Version]
- Directorate-General of Budget, Accounting and Statistics, Executive Yuan, R.O.C. (Taiwan). Earning and Productivity Statistics. 2020. Available online: https://www.stat.gov.tw/np.asp?ctNode=522 (accessed on 22 December 2021).
- Directorate-General of Budget, Accounting and Statistics, Executive Yuan, R.O.C. (Taiwan). Price Indices. 2020. Available online: https://www.stat.gov.tw/np.asp?ctNode=485&mp=4 (accessed on 22 December 2021).


| Settling or Emissions | Region | |||
|---|---|---|---|---|
| Northern | Central | Southern | Eastern | |
| Annual dioxin settling (pg I-TEQ/m2/year) | 12.40 | 41.70 | 68.80 | 1.47 |
| Annual dioxin emissions (g I-TEQ/year) | 5.7628 | 19.3798 | 31.9743 | 0.6832 |
| Age Group (Age) | Region | Taiwan | |||
|---|---|---|---|---|---|
| Northern | Central | Southern | Eastern | ||
| Children (0–14) | 7.26 × 10⁻⁴ | 2.24 × 10⁻³ | 9.21 × 10⁻³ | 8.37 × 10⁻⁵ | 3.19 × 10⁻⁵ |
| Working-age adults (15–64) | 1.52 × 10⁻³ | 4.44 × 10⁻³ | 1.56 × 10⁻² | 1.82 × 10⁻⁴ | 6.00 × 10⁻³ |
| Older adults (65 or above) | 7.68 × 10⁻⁴ | 2.27 × 10⁻³ | 2.79 × 10⁻² | 7.79 × 10⁻⁵ | 8.84 × 10⁻³ |
| Age Group (Age) | Region | Taiwan | |||
|---|---|---|---|---|---|
| Northern | Central | Southern | Eastern | ||
| Children (0–14) | 7.26 × 10⁻⁸ | 2.24 × 10⁻⁷ | 9.21 × 10⁻⁷ | 8.37 × 10⁻⁹ | 3.19 × 10⁻⁷ |
| Working-age adults (15–64) | 1.52 × 10⁻⁷ | 4.44 × 10⁻⁷ | 1.56 × 10⁻⁶ | 1.82 × 10⁻⁸ | 6.00 × 10⁻⁷ |
| Older adults (65 or above) | 7.68 × 10⁻⁸ | 2.27 × 10⁻⁷ | 2.79 × 10⁻⁶ | 7.79 × 10⁻⁹ | 8.84 × 10⁻⁷ |
| Region/ Age Group | Year | ||||||||||
|---|---|---|---|---|---|---|---|---|---|---|---|
| 2020 | 2021 –2025 | 2026 –2030 | 2031 –2035 | 2036 –2040 | 2041 –2045 | 2046 –2050 | 2051 –2055 | 2056 –2060 | 2061 –2065 | 2066 –2070 | |
| Northern | |||||||||||
| Children | 1,318,119 | 1,264,892 | 1,192,701 | 1,124,171 | 1,132,252 | 1,113,024 | 1,064,712 | 1,001,184 | 943,498 | 899,735 | 871,704 |
| Working-age adults | 7,477,322 | 7,267,601 | 6,877,924 | 6,504,056 | 6,081,763 | 5,624,320 | 5,156,703 | 4,821,029 | 4,488,235 | 4,156,714 | 3,911,141 |
| Older adults | 1,684,598 | 1,922,894 | 2,326,148 | 2,665,299 | 2,908,197 | 3,120,420 | 3,290,247 | 3,287,280 | 3,246,798 | 3,183,865 | 3,021,274 |
| Total | 10,480,038 | 10,455,388 | 10,396,773 | 10,293,526 | 10,122,212 | 9,857,764 | 9,511,662 | 9,109,492 | 8,678,531 | 8,240,315 | 7,804,120 |
| Central | |||||||||||
| Children | 737,293 | 707,520 | 667,140 | 628,808 | 633,328 | 622,573 | 595,549 | 560,015 | 527,748 | 503,269 | 487,590 |
| Working-age adults | 4,182,459 | 4,065,151 | 3,847,184 | 3,638,060 | 3,401,850 | 3,145,977 | 2,884,415 | 2,696,655 | 2,510,505 | 2,325,069 | 2,187,707 |
| Older adults | 942,284 | 1,075,576 | 1,301,137 | 1,490,842 | 1,626,707 | 1,745,415 | 1,840,408 | 1,838,748 | 1,816,105 | 1,780,903 | 1,689,957 |
| Total | 5,862,036 | 5,848,247 | 5,815,461 | 5,757,710 | 5,661,885 | 5,513,965 | 5,320,372 | 5,095,417 | 4,854,358 | 4,609,241 | 4,365,254 |
| Southern | |||||||||||
| Children | 820,861 | 787,714 | 742,757 | 700,080 | 705,112 | 693,138 | 663,051 | 623,489 | 587,565 | 560,312 | 542,855 |
| Working-age adults | 4,656,515 | 4,525,912 | 4,283,239 | 4,050,412 | 3,787,429 | 3,502,555 | 3,211,346 | 3,002,304 | 2,795,056 | 2,588,601 | 2,435,670 |
| Older adults | 1,049,086 | 1,197,486 | 1,448,613 | 1,659,820 | 1,811,085 | 1,943,247 | 2,049,007 | 2,047,159 | 2,021,949 | 1,982,758 | 1,881,504 |
| Total | 6,526,462 | 6,511,111 | 6,474,609 | 6,410,312 | 6,303,626 | 6,138,940 | 5,923,405 | 5,672,953 | 5,404,571 | 5,131,671 | 4,860,030 |
| Eastern | |||||||||||
| Children | 72,900 | 69,956 | 65,963 | 62,173 | 62,620 | 61,557 | 58,885 | 55,371 | 52,181 | 49,761 | 48,210 |
| Working-age adults | 413,539 | 401,940 | 380,389 | 359,712 | 336,357 | 311,057 | 285,195 | 266,631 | 248,225 | 229,890 | 216,309 |
| Older adults | 93,168 | 106,347 | 128,649 | 147,406 | 160,840 | 172,577 | 181,970 | 181,805 | 179,567 | 176,086 | 167,094 |
| Total | 579,606 | 578,243 | 575,001 | 569,291 | 559,817 | 545,191 | 526,050 | 503,807 | 479,973 | 455,737 | 431,613 |
| Taiwan | |||||||||||
| Children | 2,963,396 | 2,843,731 | 2,681,433 | 2,527,363 | 2,545,531 | 2,502,302 | 2,393,687 | 2,250,863 | 2,121,174 | 2,022,787 | 1,959,767 |
| Working-age adults | 16,810,525 | 16,339,032 | 15,462,958 | 14,622,428 | 13,673,029 | 12,644,604 | 11,593,307 | 10,838,644 | 10,090,456 | 9,345,131 | 8,793,034 |
| Older adults | 3,787,315 | 4,323,054 | 5,229,648 | 5,992,129 | 6,538,212 | 7,015,332 | 7,397,137 | 7,390,467 | 7,299,455 | 7,157,971 | 6,792,433 |
| Total | 23,561,236 | 23,505,817 | 23,374,039 | 23,141,920 | 22,756,772 | 22,162,238 | 21,384,132 | 20,479,973 | 19,511,085 | 18,525,889 | 17,545,234 |
| Parameter | Value | Definition |
|---|---|---|
| 11.79 | The VSL computed in Liou’s study in 2019 [62]; unit: millions of US$ | |
| 0.2476 | The earnings elasticity estimated for monthly earnings between US$1317.18 and US$1580.61 | |
| 1317.18 | Average monthly earnings in US$ in 2014 | |
| 1385.64 | Average monthly earnings in US$ in 2020 | |
| 98.93 | ||
| 102.55 |
| Age Group/ Region | Year | ||||||||||
|---|---|---|---|---|---|---|---|---|---|---|---|
| 2020 | 2021 –2025 | 2026 –2030 | 2031 –2035 | 2036 –2040 | 2041 –2045 | 2046 –2050 | 2051 –2055 | 2056 –2060 | 2061 –2065 | 2066 –2070 | |
| VSL (US$/person) | |||||||||||
| Children | 2,194,866 | 2,167,689 | 2,151,162 | 2,134,532 | 2,117,808 | 2,100,999 | 2,084,114 | 2,067,906 | 2,050,987 | 2,034,013 | 2,016,989 |
| Working-age adults | 12,326,614 | 12,173,987 | 12,081,168 | 11,987,772 | 11,893,849 | 11,799,449 | 11,704,618 | 11,613,595 | 11,518,578 | 11,423,246 | 11,327,640 |
| Older adults | 25,745,461 | 25,426,682 | 25,232,819 | 25,037,751 | 24,841,583 | 24,644,418 | 24,446,355 | 24,256,242 | 24,057,790 | 23,858,678 | 23,658,995 |
| Estimated total monetary value of death from cancer due to dioxin emissions for each age group for 2020 and each 5-year interval from 2021 to 2070 (US$) | |||||||||||
| Northern | |||||||||||
| Children | 47,848 | 45,305 | ,378 | 39,702 | 39,603 | 38,658 | 36,680 | 34,327 | 31,995 | 30,307 | 29,045 |
| Working-age adults | 3,191,360 | 3,062,975 | 2,877,734 | 2,699,646 | 2,504,845 | 2,297,353 | 2,090,445 | 1,938,309 | 1,789,987 | 1,643,805 | 1,533,762 |
| Older adults | 759,491 | 854,337 | 1,026,976 | 1,166,759 | 1,264,437 | 1,345,585 | 1,408,110 | 1,394,734 | 1,366,482 | 1,328,928 | 1,251,561 |
| Central | |||||||||||
| Children | 82,527 | 78,254 | 73,139 | 68,518 | 68,405 | 66,812 | 63,357 | 59,142 | 55,172 | 52,274 | 50,223 |
| Working-age adults | 5,214,158 | 5,005,944 | 4,700,782 | 4,411,500 | 4,092,673 | 3,754,585 | 3,414,237 | 3,167,027 | 2,924,567 | 2,686,747 | 2,506,807 |
| Older adults | 1,253,804 | 1,413,724 | 1,698,169 | 1,930,411 | 2,089,177 | 2,225,391 | 2,327,293 | 2,306,769 | 2,259,026 | 2,197,384 | 2,067,796 |
| Southern | |||||||||||
| Children | 377,956 | 358,319 | 335,151 | 313,563 | 313,224 | 305,485 | 289,900 | 270,482 | 252,887 | 239,200 | 229,735 |
| Working-age adults | 20,398,082 | 19,580,641 | 18,388,746 | 17,255,199 | 16,007,931 | 14,686,774 | 13,357,311 | 12,390,544 | 11,441,404 | 10,508,244 | 9,805,205 |
| Older adults | 17,167,073 | 19,352,248 | 23,231,857 | 26,412,324 | 28,595,147 | 30,438,321 | 31,836,488 | 31,559,797 | 30,916,666 | 30,066,706 | 28,291,426 |
| Eastern | |||||||||||
| Children | 219 | 217 | 215 | 213 | 212 | 210 | 208 | 207 | 205 | 203 | 202 |
| Working-age adults | 20,955 | 20,696 | 19,330 | 17,982 | 16,651 | 15,339 | 14,046 | 12,775 | 11,519 | 11,423 | 10,195 |
| Older adults | 5149 | 5085 | 5047 | 7511 | 7452 | 7393 | 7334 | 7277 | 7217 | 7158 | 7098 |
| Taiwan | |||||||||||
| Children | 472,555 | 447,845 | 419,261 | 392,113 | 391,794 | 381,962 | 362,427 | 338,309 | 316,057 | 299,000 | 287,219 |
| Working-age adults | 28,322,862 | 27,186,948 | 25,533,549 | 23,958,761 | 22,227,225 | 20,392,987 | 18,547,138 | 17,204,379 | 15,886,423 | 14,590,912 | 13,613,558 |
| Older adults | 19,636,063 | 22,136,469 | 26,572,682 | 30,213,054 | 32,706,429 | 34,815,170 | 36,415,290 | 36,100,566 | 35,362,545 | 34,389,899 | 32,360,774 |
| Region | Year | ||||||||||
|---|---|---|---|---|---|---|---|---|---|---|---|
| 2020 | 2021 –2025 | 2026 –2030 | 2031 –2035 | 2036 –2040 | 2041 –2045 | 2046 –2050 | 2051 –2055 | 2056 –2060 | 2061 –2065 | 2066 –2070 | |
| The amount of dioxin emissions with a reduction plan for each region (g) | |||||||||||
| Northern | 5.7628 | 5.2826 | 4.8023 | 4.3221 | 3.8419 | 3.3616 | 2.8814 | 2.3051 | 1.7288 | 1.1526 | 0.5763 |
| Central | 19.3798 | 17.7648 | 16.1498 | 14.5348 | 12.9198 | 11.3049 | 9.6899 | 7.7519 | 5.8139 | 3.8760 | 1.9380 |
| Southern | 31.9743 | 29.3097 | 26.6452 | 23.9807 | 21.3162 | 18.6517 | 15.9871 | 12.7897 | 9.5923 | 6.3949 | 3.1974 |
| Eastern | 0.6832 | 0.6262 | 0.5693 | 0.5124 | 0.4554 | 0.3985 | 0.3416 | 0.2733 | 0.2050 | 0.1366 | 0.0683 |
| Taiwan | 57.8000 | 52.9833 | 48.1667 | 43.3500 | 38.5333 | 33.7167 | 28.9000 | 23.1200 | 17.3400 | 11.5600 | 5.7800 |
| The amount of dioxin emissions without a reduction plan for each region (g) | |||||||||||
| Northern | 5.7628 | 5.7628 | 5.7628 | 5.7628 | 5.7628 | 5.7628 | 5.7628 | 5.7628 | 5.7628 | 5.7628 | 5.7628 |
| Central | 19.3798 | 19.3798 | 19.3798 | 19.3798 | 19.3798 | 19.3798 | 19.3798 | 19.3798 | 19.3798 | 19.3798 | 19.3798 |
| Southern | 31.9743 | 31.9743 | 31.9743 | 31.9743 | 31.9743 | 31.9743 | 31.9743 | 31.9743 | 31.9743 | 31.9743 | 31.9743 |
| Eastern | 0.6832 | 0.6832 | 0.6832 | 0.6832 | 0.6832 | 0.6832 | 0.6832 | 0.6832 | 0.6832 | 0.6832 | 0.6832 |
| Taiwan | 57.8000 | 57.8000 | 57.8000 | 57.8000 | 57.8000 | 57.8000 | 57.8000 | 57.8000 | 57.8000 | 57.8000 | 57.8000 |
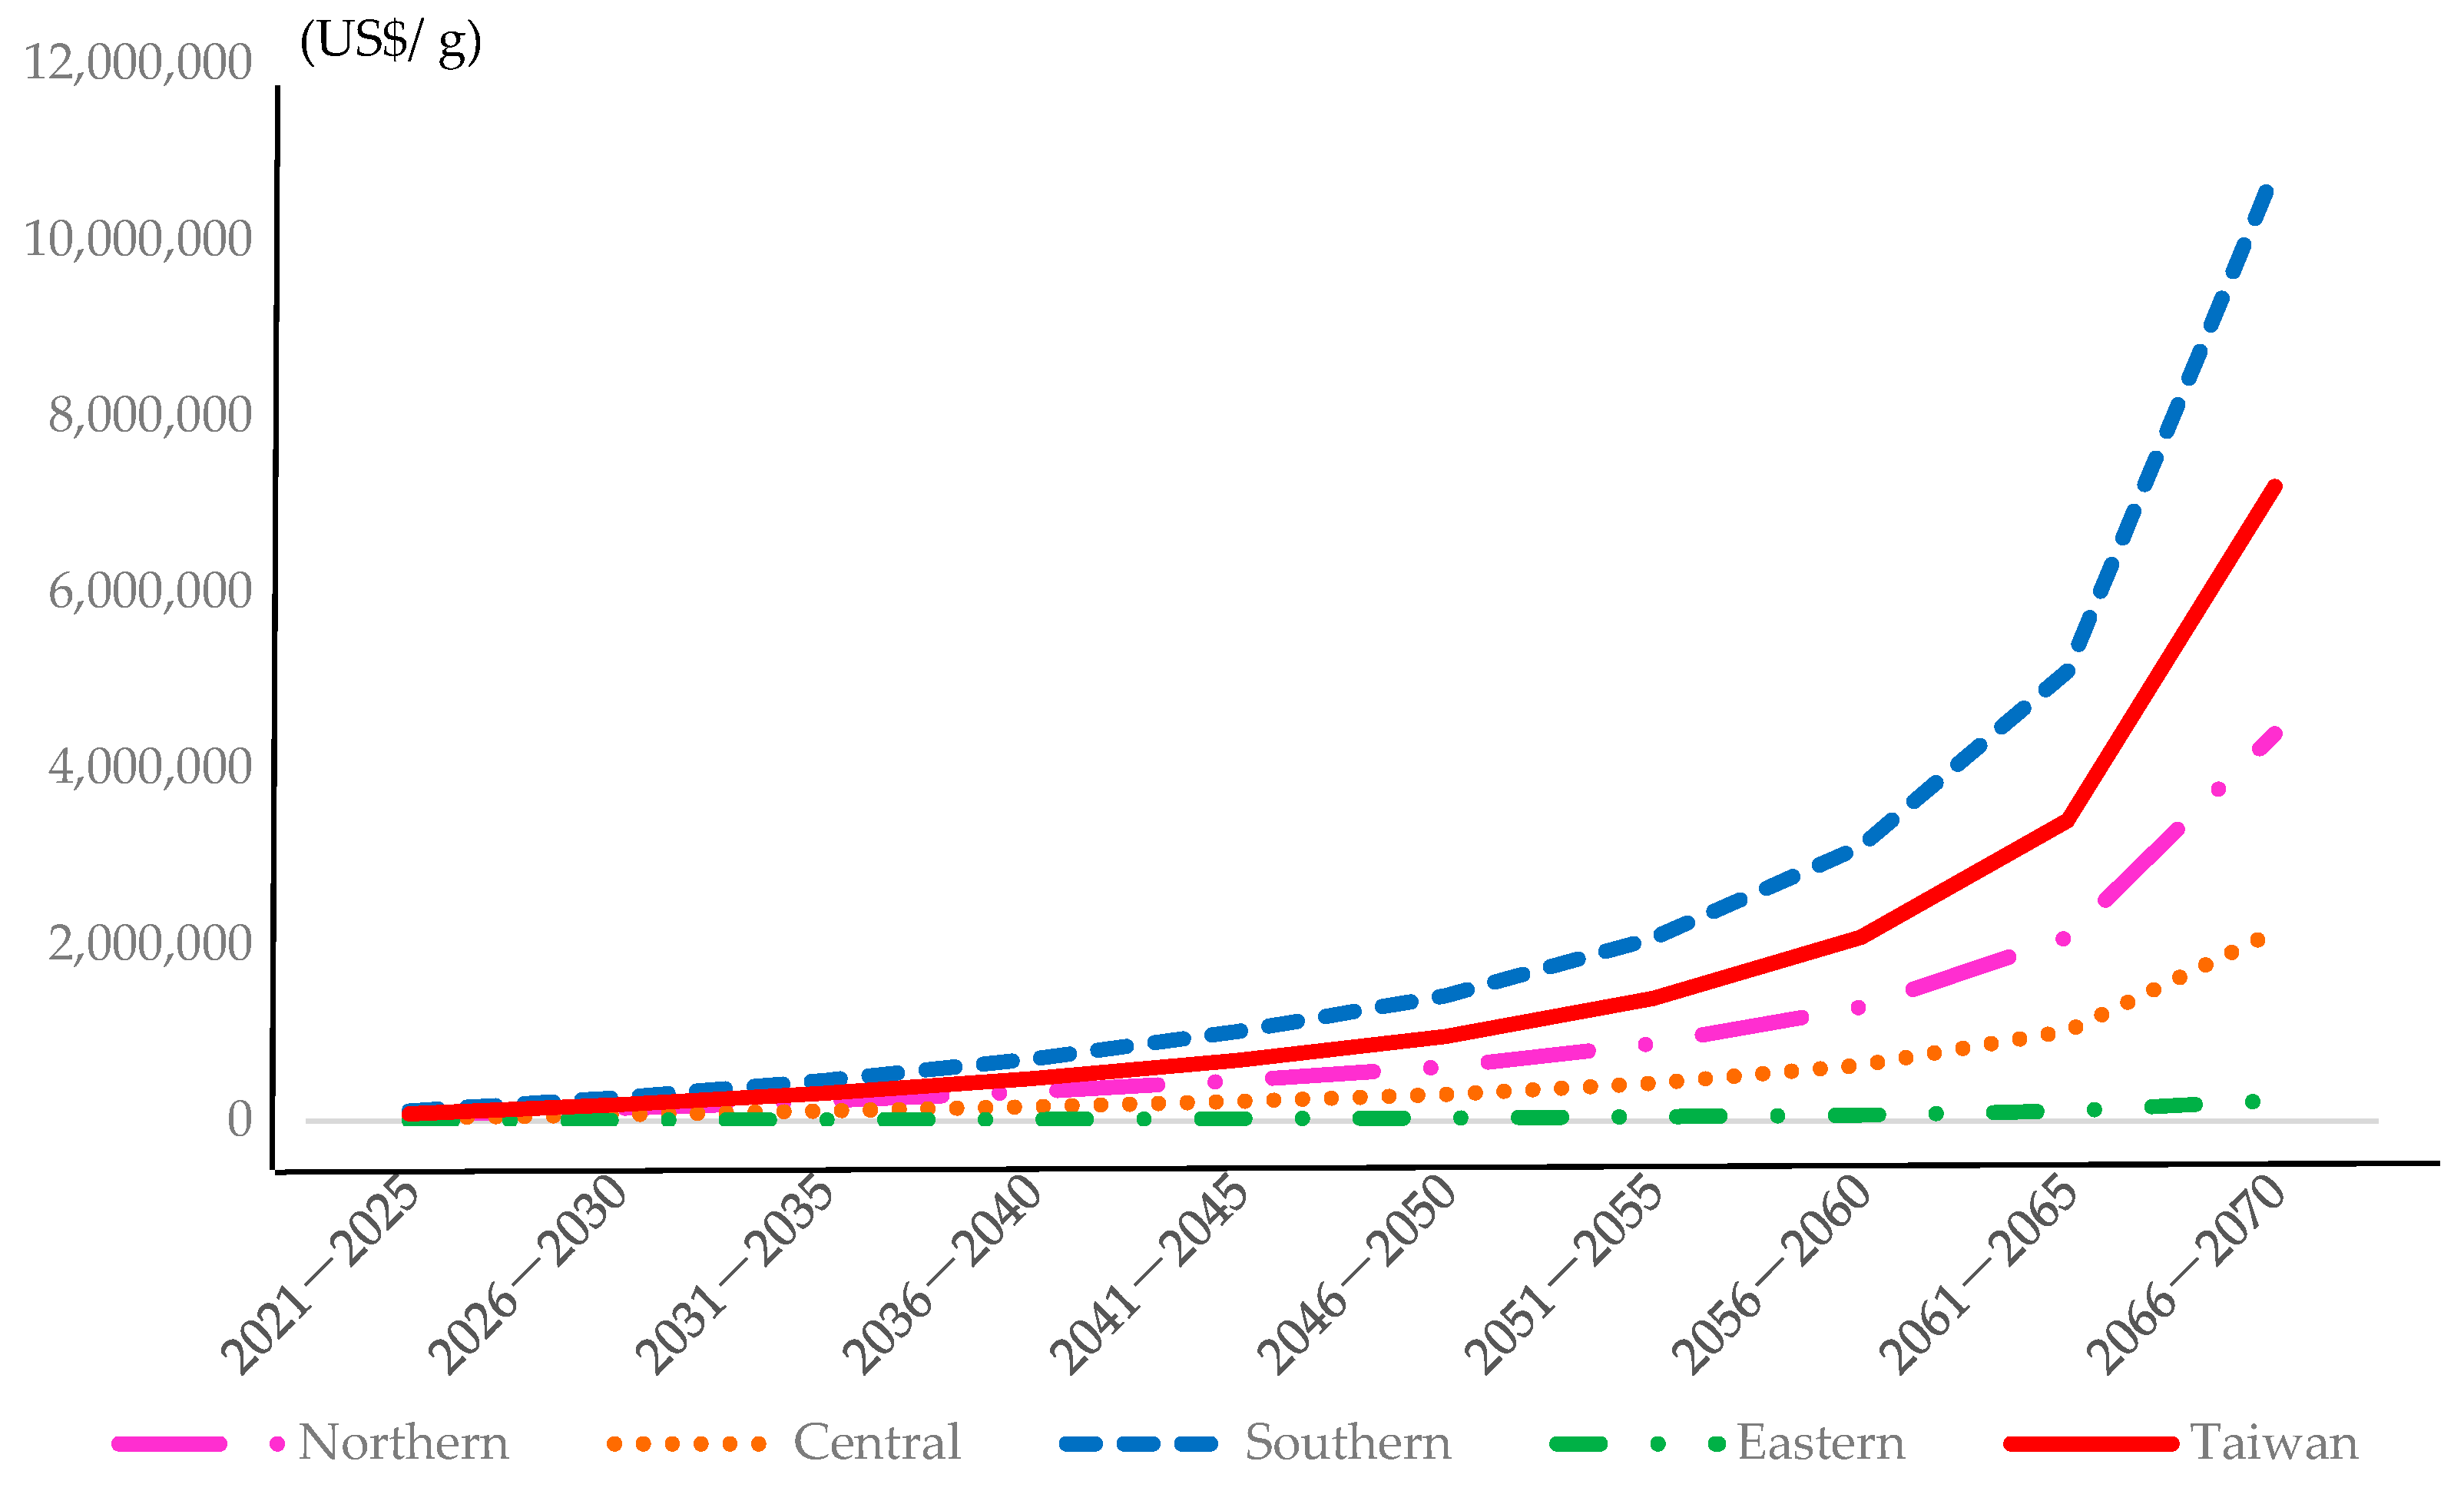
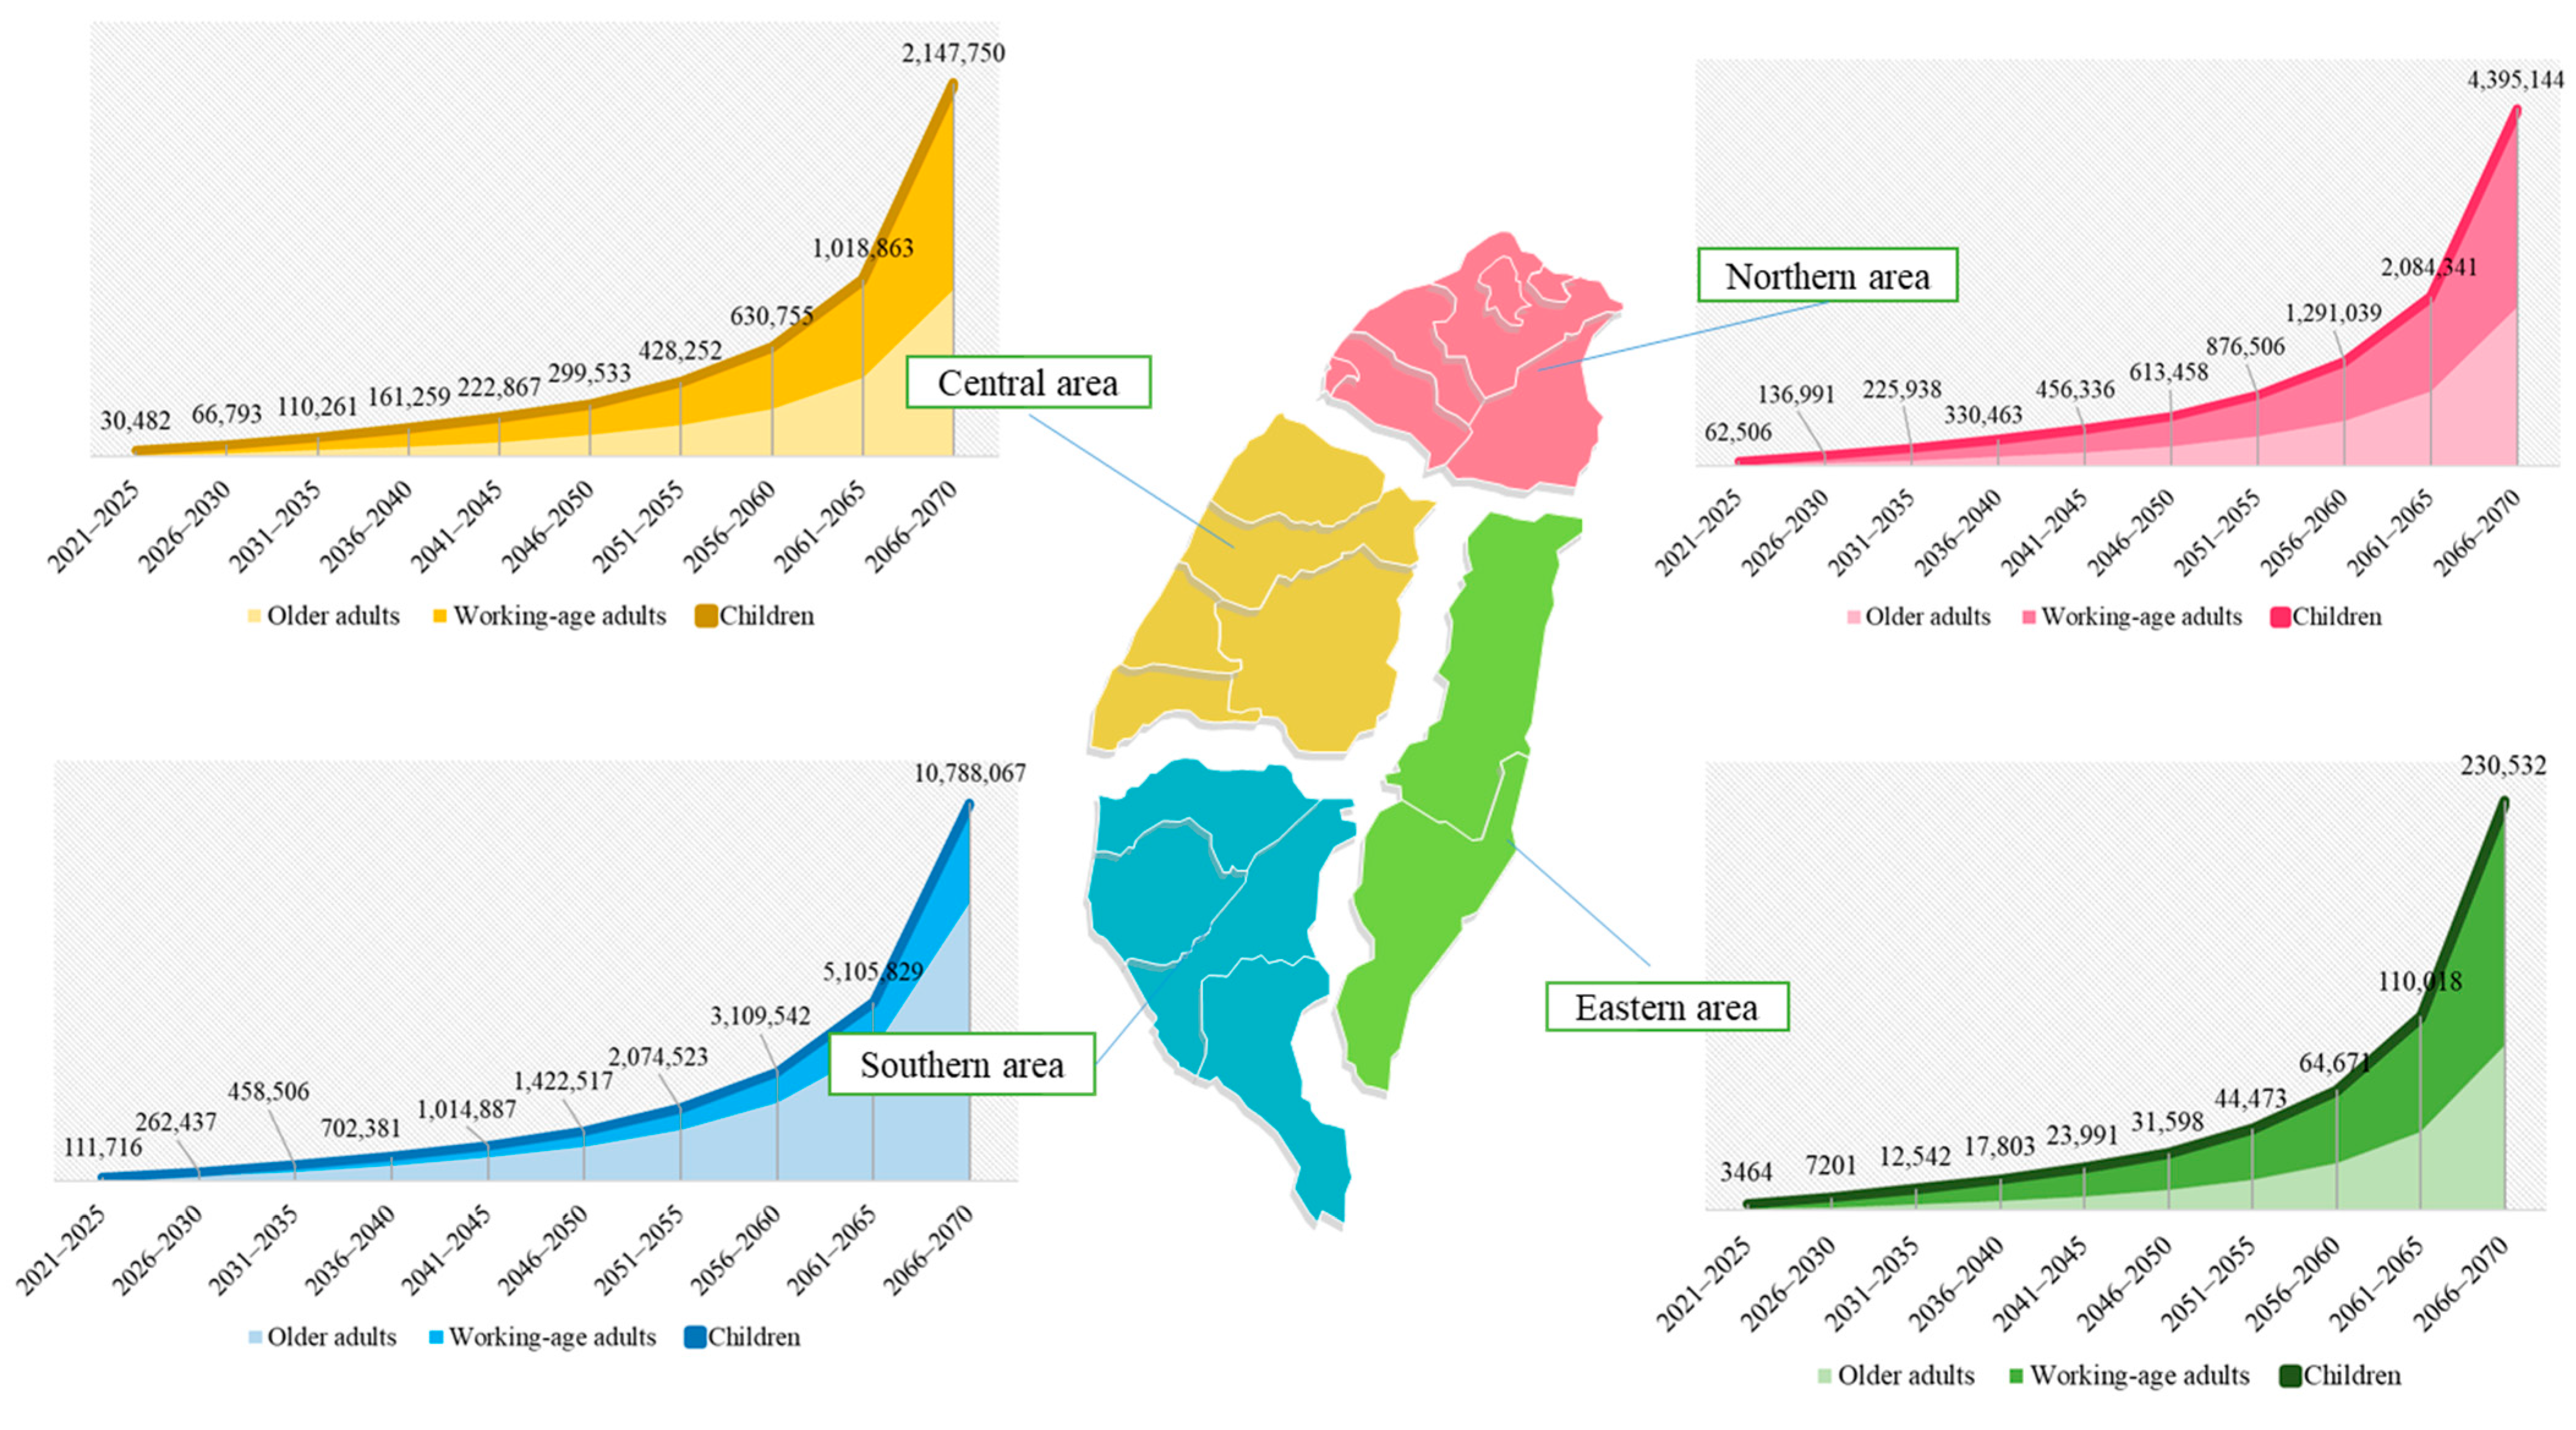
| Age Group/Region | Year | ||||||||||
|---|---|---|---|---|---|---|---|---|---|---|---|
| 2020 | 2021 –2025 | 2026 –2030 | 2031 –2035 | 2036 –2040 | 2041 –2045 | 2046 –2050 | 2051 –2055 | 2056 –2060 | 2061 –2065 | 2066 –2070 | |
| Northern | |||||||||||
| Children | 0 | 715 | 1471 | 2296 | 3436 | 4792 | 6365 | 8935 | 12,955 | 21,035 | 45,358 |
| Working-age adults | 0 | 48,315 | 99,877 | 156,154 | 217,323 | 284,758 | 362,748 | 504,530 | 724,782 | 1,140,927 | 2,395,247 |
| Older adults | 0 | 13,476 | 35,643 | 67,488 | 109,704 | 166,786 | 244,345 | 363,041 | 553,301 | 922,379 | 1,954,538 |
| Northern Total | 0 | 62,506 | 136,991 | 225,938 | 330,463 | 456,336 | 613,458 | 876,506 | 1,291,039 | 2,084,341 | 4,395,144 |
| Central | |||||||||||
| Children | 0 | 367 | 755 | 1179 | 1765 | 2462 | 3269 | 4578 | 6643 | 10,789 | 23,323 |
| Working-age adults | 0 | 23,483 | 48,513 | 75,879 | 105,593 | 138,383 | 176,175 | 245,130 | 352,122 | 554,539 | 1,164,150 |
| Older adults | 0 | 6632 | 17,525 | 33,204 | 53,902 | 82,021 | 120,089 | 178,545 | 271,990 | 453,535 | 960,276 |
| Central Total | 0 | 30,482 | 66,793 | 110,261 | 161,259 | 222,867 | 299,533 | 428,252 | 630,755 | 1,018,863 | 2,147,750 |
| Southern | |||||||||||
| Children | 0 | 1019 | 2096 | 3269 | 4898 | 6824 | 9067 | 12,689 | 18,454 | 29,924 | 64,666 |
| Working-age adults | 0 | 55,673 | 115,023 | 179,887 | 250,325 | 328,092 | 417,754 | 581,275 | 834,938 | 1,314,576 | 2,759,959 |
| Older adults | 0 | 55,024 | 145,317 | 275,351 | 447,158 | 679,971 | 995,696 | 1,480,558 | 2,256,149 | 3,761,330 | 7,963,442 |
| Southern Total | 0 | 111,716 | 262,437 | 458,506 | 702,381 | 1,014,887 | 1,422,517 | 2,074,523 | 3,109,542 | 5,105,829 | 10,788,067 |
| Eastern | |||||||||||
| Children | 0 | 29 | 63 | 104 | 155 | 220 | 305 | 454 | 700 | 1191 | 2658 |
| Working-age adults | 0 | 2757 | 5661 | 8773 | 12,192 | 16,040 | 20,558 | 28,045 | 39,328 | 66,905 | 134,344 |
| Older adults | 0 | 678 | 1,478 | 3,665 | 5,456 | 7,731 | 10,735 | 15,975 | 24,643 | 41,922 | 93,531 |
| Eastern Total | 0 | 3464 | 7201 | 12,542 | 17,803 | 23,991 | 31,598 | 44,473 | 64,671 | 110,018 | 230,532 |
| Taiwan | |||||||||||
| Children | 0 | 704 | 1451 | 2261 | 3389 | 4720 | 6270 | 8780 | 12,759 | 20,692 | 44,723 |
| Working-age adults | 0 | 42,761 | 88,351 | 138,170 | 192,278 | 252,014 | 320,885 | 446,480 | 641,320 | 1,009,752 | 2,119,758 |
| Older adults | 0 | 34,817 | 91,947 | 174,239 | 282,928 | 430,241 | 630,022 | 936,866 | 1,427,554 | 2,379,924 | 5,038,875 |
| Taiwan Total | 0 | 78,282 | 181,748 | 314,671 | 478,595 | 686,975 | 957,177 | 1,392,126 | 2,081,633 | 3,410,368 | 7,203,356 |
| Key Parameter | Impact on BPT Estimation a | Source of Uncertainty and/or Different Selections of Key Parameter |
|---|---|---|
| b | ---- | ----- |
| c | ---- | ----- |
| The uncertainty is from the selection of VSL by selecting a 90% confidence interval and 95% confidence interval instead of the mean value used in Table 6. | ||
| Population | ||
| Children | 2021–2025: −0.065% to 0.042% 2066–2070: −2.847% to 3.193% | The uncertainty for the group of children is from the use of a low-variant projected population and high-variant projected population of the 5-year period in 2021–2025 and in 2066–2070 instead of the medium-variant projected population used in Table 6. |
| Working-age adults | 2021–2025: 0% 2066–2070: −7.576% to 6.404% | The uncertainty for the group of working-age adults is from the use of low-variant projected population and high-variant projected population of the 5-year period for 2021–2025 and 2066–2070 instead of the medium-variant projected population used in Table 6. |
| Older adults | 2021–2025: 0% 2066–2070: −0.0004% to 0.0005% | The uncertainty for the group of older adults is from the use of a low-variant projected population and a high-variant projected population of the 5-year period for 2021–2025 and 2066–2070 instead of the medium-variant projected population used in Table 6. |
Publisher’s Note: MDPI stays neutral with regard to jurisdictional claims in published maps and institutional affiliations. |
© 2022 by the authors. Licensee MDPI, Basel, Switzerland. This article is an open access article distributed under the terms and conditions of the Creative Commons Attribution (CC BY) license (https://creativecommons.org/licenses/by/4.0/).
Share and Cite
Liou, J.-L.; Chen, H.-H.; Wu, P.-I. The Monetary Benefits of Reducing Emissions of Dioxin-like Compounds—Century Poisons—Over Half a Century: Evaluation of the Benefit per Ton Method. Int. J. Environ. Res. Public Health 2022, 19, 6701. https://doi.org/10.3390/ijerph19116701
Liou J-L, Chen H-H, Wu P-I. The Monetary Benefits of Reducing Emissions of Dioxin-like Compounds—Century Poisons—Over Half a Century: Evaluation of the Benefit per Ton Method. International Journal of Environmental Research and Public Health. 2022; 19(11):6701. https://doi.org/10.3390/ijerph19116701
Chicago/Turabian StyleLiou, Je-Liang, Han-Hui Chen, and Pei-Ing Wu. 2022. "The Monetary Benefits of Reducing Emissions of Dioxin-like Compounds—Century Poisons—Over Half a Century: Evaluation of the Benefit per Ton Method" International Journal of Environmental Research and Public Health 19, no. 11: 6701. https://doi.org/10.3390/ijerph19116701