
Bar Load-Velocity Profile of Full Squat and Bench Press Exercises in Young Recreational Athletes

 ,
,  and
and
Abstract
:1. Introduction
2. Materials and Methods
2.1. Data Collection
2.2. Procedures
2.3. Statistical Analysis
3. Results
4. Discussion
5. Conclusions
Author Contributions
Funding
Institutional Review Board Statement
Informed Consent Statement
Data Availability Statement
Acknowledgments
Conflicts of Interest
References
- Pareja-Blanco, F.; Rodríguez-Rosell, D.; Sánchez-Medina, L.; Sanchis-Moysi, J.; Dorado, C.; Mora-Custodio, R.; Yáñez-García, J.M.; Morales-Alamo, D.; Perez-Suarez, I.; Calbet, J.A.L.; et al. Effects of velocity loss during resistance training on athletic performance, strength gains and muscle adaptations. Scand. J. Med. Sci. Sports 2017, 27, 724–735. [Google Scholar] [CrossRef] [Green Version]
- Fenn, W.O.; Marsh, B.S. Muscular force at different speeds of shortening. J. Physiol. 1935, 85, 277–297. [Google Scholar] [CrossRef] [PubMed]
- Hill, A.V. The heat of shortening and the dynamic constants of muscle. Proc. R. Soc. Lond. Ser. B—Biol. Sci. 1938, 126, 136–195. [Google Scholar]
- Charteris, J.; Goslin, B.R. The effects of position and movement velocity on isokinetic force output at the knee. J. Sports Med. Phys. Fit. 1982, 22, 154–160. [Google Scholar]
- Caiozzo, V.J.; Perrine, J.J.; Edgerton, V.R. Training-induced alterations of the in vivo force-velocity relationship of human muscle. J. Appl. Physiol. 1981, 51, 750–754. [Google Scholar] [CrossRef]
- Jidovtseff, B.; Harris, N.K.; Crielaard, J.-M.; Cronin, J.B. Using the load-velocity relationship for 1RM prediction. J. Strength Cond. Res. 2011, 25, 267–270. [Google Scholar] [CrossRef]
- González-Badillo, J.J.; Sánchez-Medina, L. Movement Velocity as a Measure of Loading Intensity in Resistance Training. Int. J. Sports Med. 2010, 31, 347–352. [Google Scholar] [CrossRef]
- Pallarés, J.G.; Sánchez-Medina, L.; Pérez, C.E.; De La Cruz-Sánchez, E.; Mora-Rodriguez, R. Imposing a pause between the eccentric and concentric phases increases the reliability of isoinertial strength assessments. J. Sports Sci. 2014, 32, 1165–1175. [Google Scholar] [CrossRef]
- Banyard, H.G.; Nosaka, K.; Haff, G.G. Reliability and Validity of the Load-Velocity Relationship to Predict the 1RM Back Squat. J. Strength Cond. Res. 2017, 31, 1897–1904. [Google Scholar] [CrossRef] [PubMed]
- Conceição, F.; Fernandes, J.; Lewis, M.; Gonzaléz-Badillo, J.J.; Jimenéz-Reyes, P. Movement velocity as a measure of exercise intensity in three lower limb exercises. J. Sports Sci. 2016, 34, 1099–1106. [Google Scholar] [CrossRef] [Green Version]
- Pestaña-Melero, F.L.; Haff, G.G.; Rojas, F.J.; Pérez-Castilla, A.; García-Ramos, A. Reliability of the Load-Velocity Relationship Obtained through Linear and Polynomial Regression Models to Predict the 1-Repetition Maximum Load. J. Appl. Biomech. 2018, 34, 184–190. [Google Scholar] [CrossRef] [PubMed]
- Kilgallon, J.; Cushion, E.; Joffe, S.; Tallent, J. Reliability and validity of velocity measures and regression methods to predict maximal strength ability in the back-squat using a novel linear position transducer. J. Sports Eng. Technol. 2022, 1, 1–14. [Google Scholar] [CrossRef]
- Ruf, L.; Chéry, C.; Taylor, K.-L. Validity and Reliability of the Load-Velocity Relationship to Predict the One-Repetition Maximum in Deadlift. J. Strength Cond. Res. 2018, 32, 681–689. [Google Scholar] [CrossRef] [PubMed]
- Weakley, J.; Mann, B.; Banyard, H.; McLaren, S.; Scott, T.; Garcia-Ramos, A. Velocity-Based Training: From Theory to Application. Strength Cond. J. 2020, 43, 31–49. [Google Scholar] [CrossRef]
- García-Ramos, A.; Pestaña-Melero, F.L.; Pérez-Castilla, A.; Rojas, F.J.; Haff, G.G. Differences in the Load-Velocity Profile between 4 Bench-Press Variants. Int. J. Sports Physiol. Perform. 2018, 13, 326–331. [Google Scholar] [CrossRef]
- Pérez-Castilla, A.; García-Ramos, A.; Padial, P.; Morales-Artacho, A.J.; Feriche, B. Load-Velocity Relationship in Variations of the Half-Squat Exercise: Influence of Execution Technique. J. Strength Cond. Res. 2020, 34, 1024–1031. [Google Scholar] [CrossRef]
- Sánchez-Medina, L.; González-Badillo, J.J.; Pérez, C.E.; Pallarés, J.G. Velocity- and Power-Load Relationships of the Bench Pull vs. Bench Press Exercises. Int. J. Sports Med. 2014, 35, 209–216. [Google Scholar] [CrossRef]
- American College of Sports Medicine. American College of Sports Medicine position stand. Progression models in resistance training for healthy adults. Med. Sci. Sports Exerc. 2009, 41, 687–708. [Google Scholar] [CrossRef]
- LoTurco, I.; Pereira, L.; Abad, C.C.C.; Gil, S.; Kitamura, K.; Kobal, R.; Nakamura, F.Y. Using Bar Velocity to Predict Maximum Dynamic Strength in the Half-Squat Exercise. Int. J. Sports Physiol. Perform. 2016, 11, 697–700. [Google Scholar] [CrossRef]
- Munn, J.; Herbert, R.D.; Hancock, M.J.; Gandevia, S.C. Resistance Training for Strength: Effect of Number of Sets and Contraction Speed. Med. Sci. Sports Exerc. 2005, 37, 1622–1626. [Google Scholar] [CrossRef]
- Harris, G.R.; Stone, M.H.; O’bryant, H.S.; Proulx, C.M.; Johnson, R.L. Short-Term Performance Effects of High Power, High Force, or Combined Weight-Training Methods. J. Strength Cond. Res. 2000, 14, 14–20. [Google Scholar]
- Pareja-Blanco, F.; Rodríguez-Rosell, D.; Sánchez-Medina, L.; Gorostiaga, E.M.; González-Badillo, J.J. Effect of Movement Velocity during Resistance Training on Neuromuscular Performance. Int. J. Sports Med. 2014, 35, 916–924. [Google Scholar] [CrossRef] [PubMed]
- Blazevich, A.; Jenkins, D. Effect of the movement speed of resistance training exercises on sprint and strength performance in concurrently training elite junior sprinters. J. Sports Sci. 2002, 20, 981–990. [Google Scholar] [CrossRef]
- Tsuzuku, S.; Shimokata, H.; Ikegami, Y.; Yabe, K.; Wasnich, R. Effects of High versus Low-Intensity Resistance Training on Bone Mineral Density in Young Males. Calcif. Tissue Res. 2001, 68, 342–347. [Google Scholar] [CrossRef]
- Balsalobre-Fernández, C.; García-Ramos, A.; Jiménez-Reyes, P. Load-velocity profiling in the military press exercise: Effects of gender and training. Int. J. Sports Sci. Coach. 2018, 13, 743–750. [Google Scholar] [CrossRef]
- Alonso-Aubin, D.A.; Chulvi-Medrano, I.; Cortell-Tormo, J.M.; Picón-Martínez, M.; Rebullido, T.R.; Faigenbaum, A.D. Squat and Bench Press Force-Velocity Profiling in Male and Female Adolescent Rugby Players. J. Strength Cond. Res. 2021, 35 (Suppl. 1), S44–S50. [Google Scholar] [CrossRef] [PubMed]
- Fernandes, J.F.; Lamb, K.L.; Twist, C. A Comparison of Load-Velocity and Load-Power Relationships between Well-Trained Young and Middle-Aged Males during Three Popular Resistance Exercises. J. Strength Cond. Res. 2018, 32, 1440–1447. [Google Scholar] [CrossRef] [PubMed]
- Fahs, C.A.; Blumkaitis, J.C.; Rossow, L.M. Factors Related to Average Concentric Velocity of Four Barbell Exercises at Various Loads. J. Strength Cond. Res. 2019, 33, 597–605. [Google Scholar] [CrossRef]
- Banyard, H.G.; Nosaka, K.; Vernon, A.D.; Haff, G.G. The Reliability of Individualized Load-Velocity Profiles. Int. J. Sports Physiol. Perform. 2018, 13, 763–769. [Google Scholar] [CrossRef]
- García-Ramos, A.; Ulloa-Díaz, D.; Barboza-González, P.; Rodríguez-Perea, Á.; Martínez-García, D.; Quidel-Catrilelbún, M.; Guede-Rojas, F.; Cuevas-Aburto, J.; Janićijević, D.; Weakley, J. Assessment of the load-velocity profile in the free-weight prone bench pull exercise through different velocity variables and regression models. PLoS ONE 2019, 14, e0212085. [Google Scholar] [CrossRef]
- Haff, G.; Nimphius, S. Training Principles for Power. Strength Cond. J. 2012, 34, 3–12. [Google Scholar] [CrossRef] [Green Version]
- Sánchez-Medina, L.; González-Badillo, J.J. Velocity Loss as an Indicator of Neuromuscular Fatigue during Resistance Training. Med. Sci. Sports Exerc. 2011, 43, 1725–1734. [Google Scholar] [CrossRef] [PubMed]
- Mora-Rodríguez, R.; Pallarés, J.G.; López-Samanes, Á.; Ortega, J.F.; Fernández-Elías, V.E. Caffeine Ingestion Reverses the Circadian Rhythm Effects on Neuromuscular Performance in Highly Resistance-Trained Men. PLoS ONE 2012, 7, e33807. [Google Scholar] [CrossRef] [PubMed] [Green Version]
- Pallares, J.G.; López-Samanes, Á.; Fernández-Elías, V.E.; Aguado-Jimenez, R.; Ortega, J.F.; Gomez, C.; Ventura, R.; Segura, J.; Rodríguez, R.M. Pseudoephedrine and circadian rhythm interaction on neuromuscular performance. Scand. J. Med. Sci. Sports 2014, 25, e603–e612. [Google Scholar] [CrossRef] [PubMed]
- González-Badillo, J.J.; Rodríguez-Rosell, D.; Sánchez-Medina, L.; Gorostiaga, E.M.; Blanco, F.P. Maximal intended velocity training induces greater gains in bench press performance than deliberately slower half-velocity training. Eur. J. Sport Sci. 2014, 14, 772–781. [Google Scholar] [CrossRef]
- Faigenbaum, A.D.; Milliken, L.A.; Westcott, W.L. Maximal Strength Testing in Healthy Children. J. Strength Cond. Res. 2003, 17, 162–166. [Google Scholar]
- Sanchez-Medina, L.; Perez, C.E.; Gonzalez-Badillo, J.J. Importance of the Propulsive Phase in Strength Assessment. Int. J. Sports Med. 2010, 31, 123–129. [Google Scholar] [CrossRef]
- Sánchez-Medina, L.; Pallarés, J.G.; Pérez, C.E.; Morán-Navarro, R.; González-Badillo, J.J. Estimation of Relative Load from Bar Velocity in the Full Back Squat Exercise. Sports Med. Int. Open 2017, 1, E80–E88. [Google Scholar] [CrossRef]
- Ortega, J.A.F.; De los Reyes, Y.G.; Pena, F.R.G. Effects of strength training based on velocity versus traditional training on muscle mass, neuromuscular activation, and indicators of maximal power and strength in girls soccer players. Apunt. Sports Med. 2020, 55, 53–61. [Google Scholar] [CrossRef]
- Hartmann, H.; Wirth, K.; Klusemann, M. Analysis of the Load on the Knee Joint and Vertebral Column with Changes in Squatting Depth and Weight Load. Sports Med. 2013, 43, 993–1008. [Google Scholar] [CrossRef]
- Fernández-Ortega, J.A.; Hoyos-Cuartas, L.A.; Ruiz-Arias, F.A. Asociación entre marcadores de riesgo metabólicos y diferentes manifestaciones de la fuerza en adultos jóvenes. Rev. De La Fac. De Med. 2017, 66, 565–570. [Google Scholar] [CrossRef]
- Torrejón, A.; Balsalobre-Fernández, C.; Haff, G.G.; García-Ramos, A. The load-velocity profile differs more between men and women than between individuals with different strength levels. Sports Biomech. 2017, 18, 245–255. [Google Scholar] [CrossRef] [PubMed]
- García-Ramos, A.; Suzovic, D.; Pérez-Castilla, A. The load-velocity profiles of three upper-body pushing exercises in men and women. Sports Biomech. 2019, 20, 693–705. [Google Scholar] [CrossRef] [PubMed]
- Izquierdo, M.; Häkkinen, K.; Gonzalez-Badillo, J.J.; Ibáñez, J.; Gorostiaga, E.M. Effects of long-term training specificity on maximal strength and power of the upper and lower extremities in athletes from different sports. Eur. J. Appl. Physiol. 2002, 87, 264–271. [Google Scholar] [CrossRef]
- Helms, E.R.; Storey, A.; Cross, M.R.; Brown, S.R.; Lenetsky, S.; Ramsay, H.; Dillen, C.; Zourdos, M.C. RPE and Velocity Relationships for the Back Squat, Bench Press, and Deadlift in Powerlifters. J. Strength Cond. Res. 2017, 31, 292–297. [Google Scholar] [CrossRef]
- Goslin, B.R.; Charteris, J. The human elbow and knee: Functional relationships and phylogenetic considerations. Hum. Biol. 1982, 54, 491–500. [Google Scholar]
- Charteris, J. Effects of velocity on upper to lower extremity muscular work and power output ratios of intercollegiate athletes. Br. J. Sports Med. 1999, 33, 250–254. [Google Scholar] [CrossRef] [Green Version]
- Fitts, R.H.; McDonald, K.S.; Schluter, J.M. The determinants of skeletal muscle force and power: Their adaptability with changes in activity pattern. J. Biomech. 1991, 24, 111–122. [Google Scholar] [CrossRef]


| Variables | Women (n = 96) | Men (n = 259) | p-Value |
|---|---|---|---|
| Maximum full squat strength (kg) | 39.4 ± 10.8 | 67.5 ± 12.6 | *** |
| Maximum bench press strength (kg) | 33.1 ± 8.0 | 59.3 ± 11.4 | *** |
| MPVSQ 50% 1RM (m·s−1) | 0.81 ± 0.09 | 0.87 ± 0.08 | * |
| MPVSQ 60% 1RM (m·s−1) | 0.64 ± 0.11 | 0.70 ± 0.07 | * |
| MPVSQ 70% 1RM (m·s−1) | 0.55 ± 0.10 | 0.61 ± 0.09 | ** |
| MPVSQ 80% 1RM (m·s−1) | 0.42 ± 0.11 | 0.49 ± 0.12 | ** |
| MPVSQ 100% 1RM (m·s−1) | 0.23 ± 0.06 | 0.26 ± 0.11 | * |
| MPVBP 50% 1RM (m·s−1) | 0.82 ± 0.09 | 0.92 ± 0.10 | * |
| MPVBP 60% 1RM (m·s−1) | 0.63 ± 0.09 | 0.70 ± 0.10 | * |
| MPVBP 70% 1RM (m·s−1) | 0.51 ± 0.10 | 0.57 ± 0.10 | * |
| MPVBP 80% 1RM (m·s−1) | 0.36 ± 0.08 | 0.42 ± 0.09 | * |
| MPVBP 100% 1RM (m·s−1) | 0.19 ± 0.07 | 0.21 ± 0.10 | * |
| Variable | Women | Men | ||||
|---|---|---|---|---|---|---|
| Minimum | Maximum | CV | Minimum | Maximum | CV | |
| MPVPB50 (m·s−1) | 0.61 | 1.07 | 11.49% | 0.69 | 1.17 | 11.31% |
| MPVPB60 (m·s−1) | 0.35 | 0.86 | 14.76% | 0.41 | 0.98 | 13.76% |
| MPVPB70 (m·s−1) | 0.23 | 0.77 | 19.60% | 0.31 | 0.80 | 16.74% |
| MPVPB80 (m·s−1) | 0.20 | 0.55 | 22.63% | 0.15 | 0.68 | 21.06% |
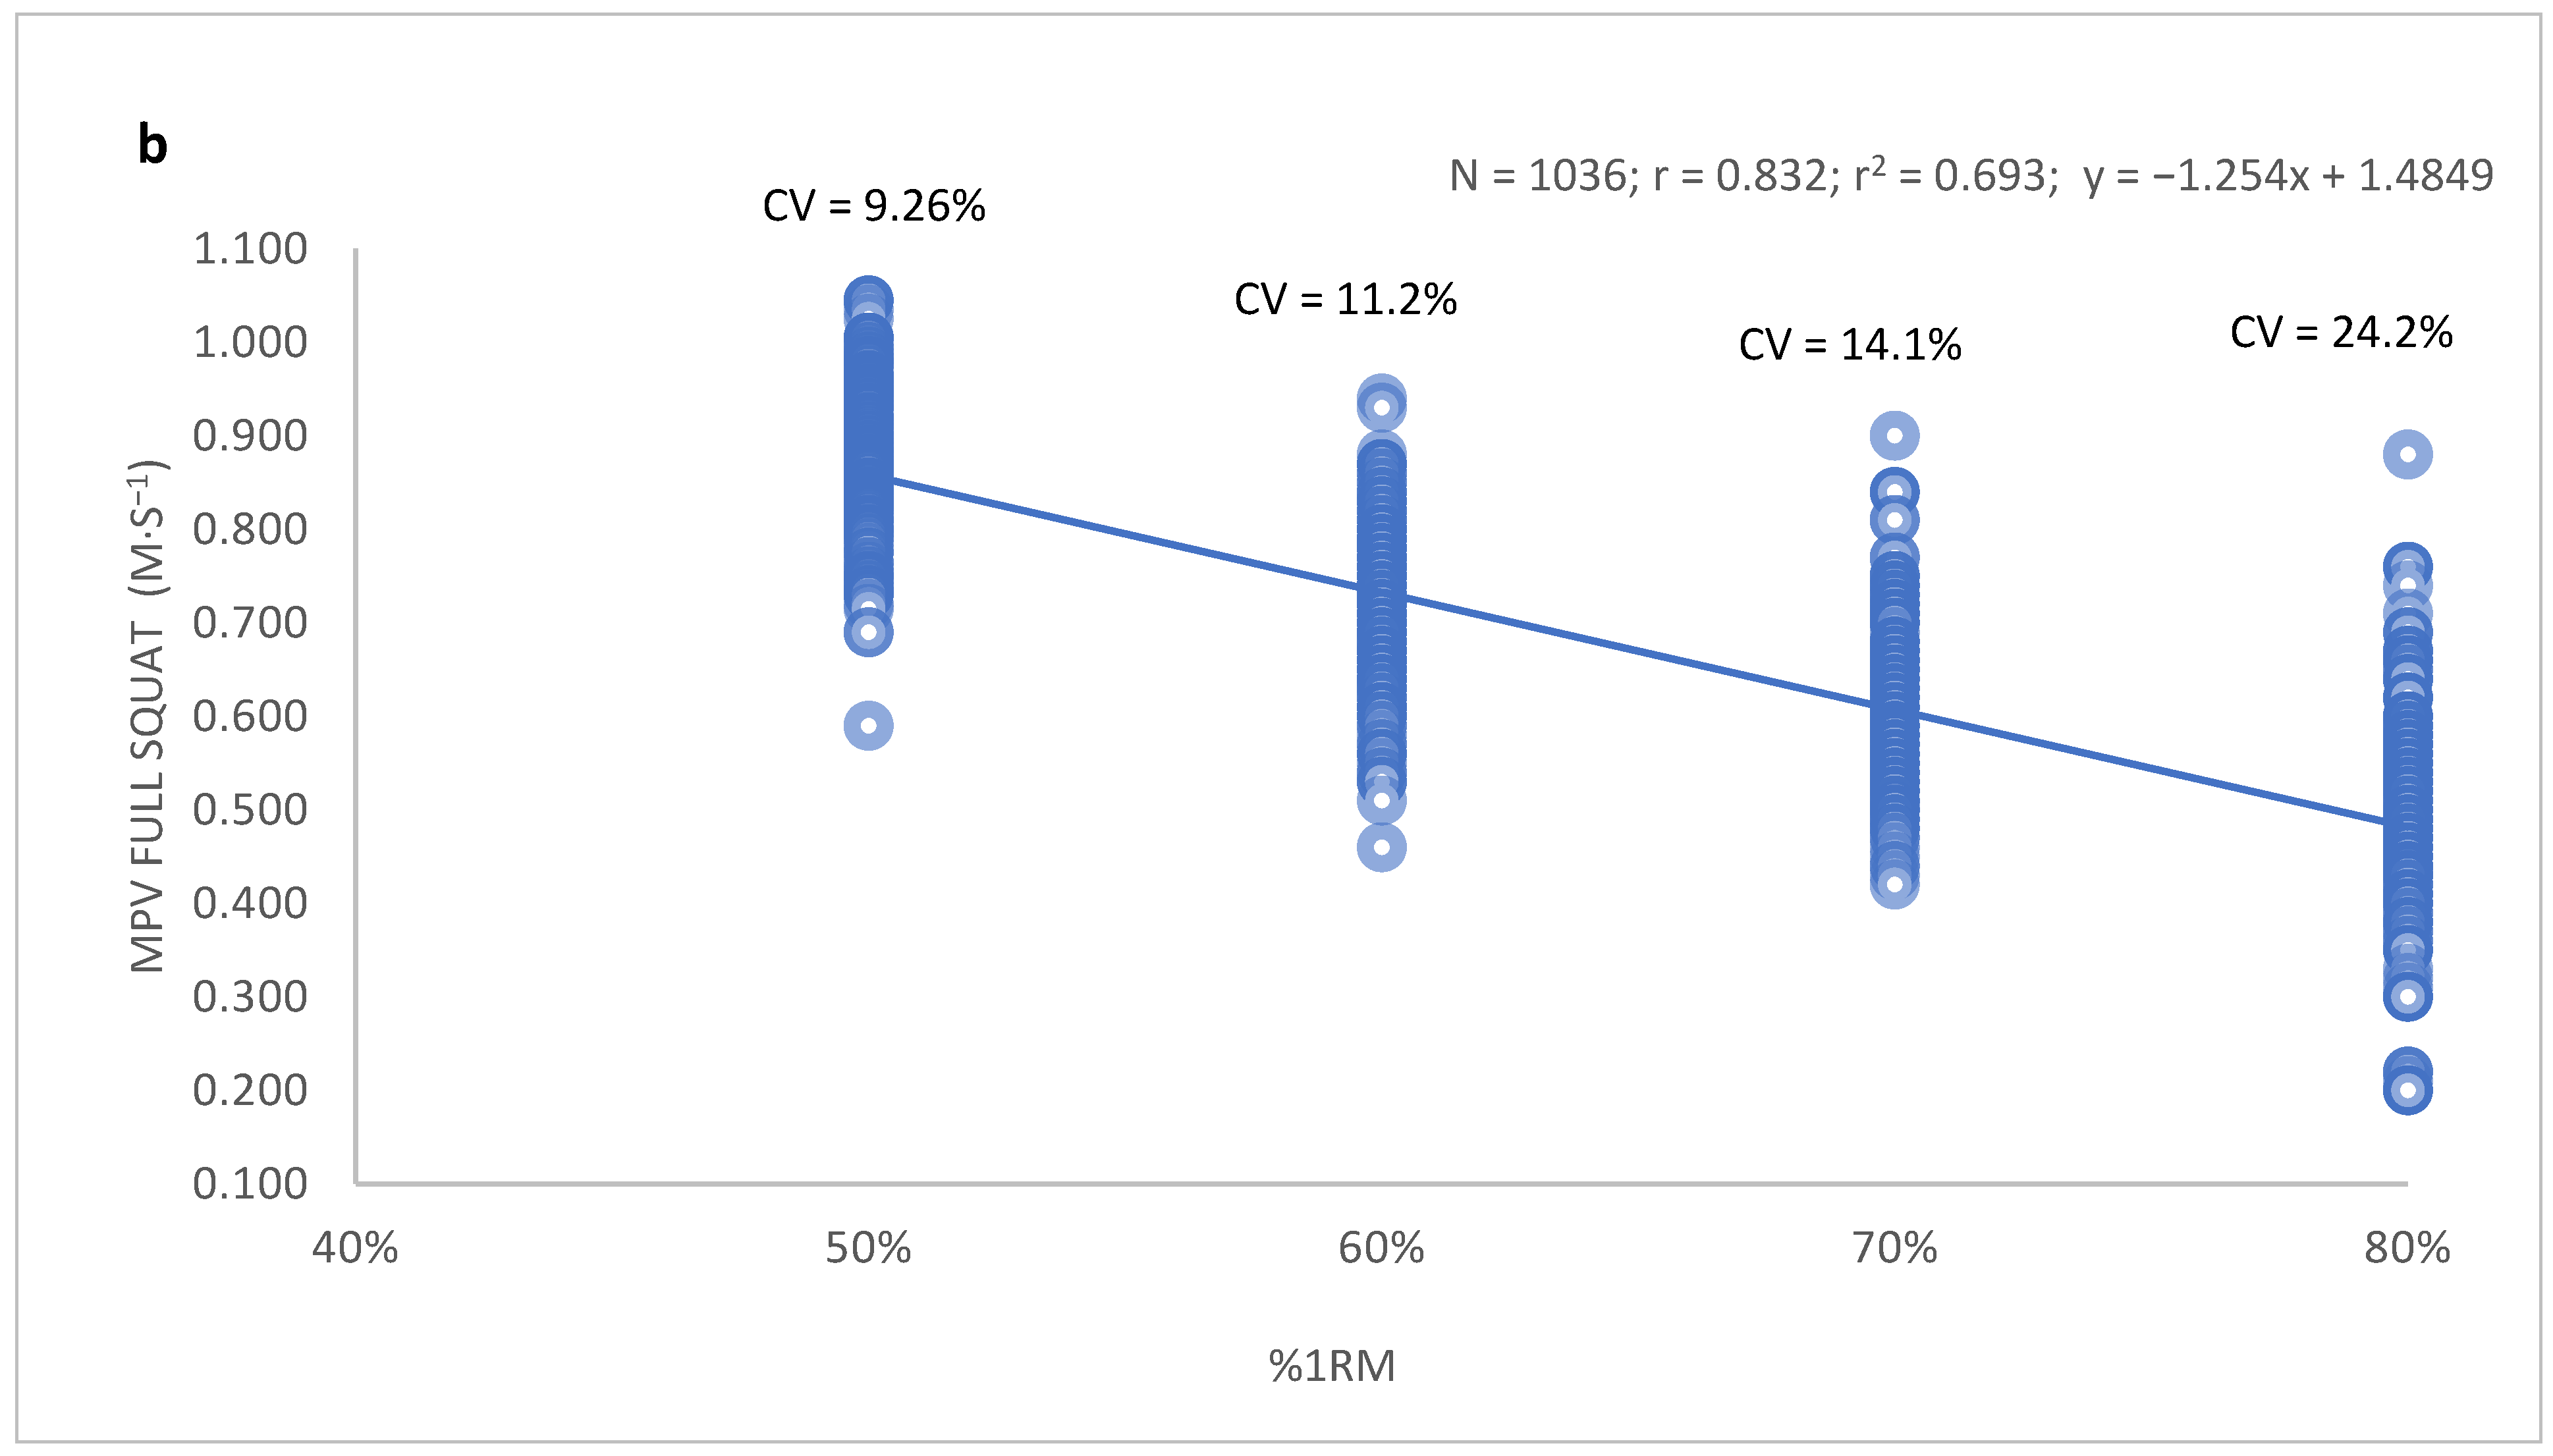
| MPVSQ50 (m·s−1) | 0.51 | 0.96 | 11.58% | 0.59 | 1.05 | 9.26% |
| MPVSQ60 (m·s−1) | 0.33 | 0.88 | 17.17% | 0.46 | 0.94 | 11.20% |
| MPVSQ70 (m·s−1) | 0.22 | 0.77 | 17.39% | 0.42 | 0.90 | 14.10% |
| MPVSQ80 (m·s−1) | 0.20 | 0.59 | 25.15% | 0.20 | 0.88 | 24.20% |
| %1RM | Men | Women | ||||
|---|---|---|---|---|---|---|
| MPVBP (m·s−1) | MPVSQ (m·s−1) | p-Value | MPVBP (m·s−1) | MPVSQ (m·s−1) | p-Value | |
| 50% | 0.92 ± 0.10 | 0.87 ± 0.08 | <0.001 | 0.82 ± 0.09 | 0.81 ± 0.09 | NS |
| 60% | 0.70 ± 0.10 | 0.71 ± 0.08 | NS | 0.63 ± 0.09 | 0.64 ± 0.11 | NS |
| 70% | 0.57 ± 0.09 | 0.61 ± 0.09 | <0.001 | 0.51 ± 0.10 | 0.55 ± 0.10 | *** |
| 80% | 0.42 ± 0.09 | 0.49 ± 0.12 | <0.001 | 0.36 ± 0.08 | 0.42 ± 0.11 | *** |
Publisher’s Note: MDPI stays neutral with regard to jurisdictional claims in published maps and institutional affiliations. |
© 2022 by the authors. Licensee MDPI, Basel, Switzerland. This article is an open access article distributed under the terms and conditions of the Creative Commons Attribution (CC BY) license (https://creativecommons.org/licenses/by/4.0/).
Share and Cite
Fernandez Ortega, J.A.; Mendoza Romero, D.; Sarmento, H.; Prieto Mondragón, L. Bar Load-Velocity Profile of Full Squat and Bench Press Exercises in Young Recreational Athletes. Int. J. Environ. Res. Public Health 2022, 19, 6756. https://doi.org/10.3390/ijerph19116756
Fernandez Ortega JA, Mendoza Romero D, Sarmento H, Prieto Mondragón L. Bar Load-Velocity Profile of Full Squat and Bench Press Exercises in Young Recreational Athletes. International Journal of Environmental Research and Public Health. 2022; 19(11):6756. https://doi.org/10.3390/ijerph19116756
Chicago/Turabian StyleFernandez Ortega, Jairo Alejandro, Dario Mendoza Romero, Hugo Sarmento, and Laura Prieto Mondragón. 2022. "Bar Load-Velocity Profile of Full Squat and Bench Press Exercises in Young Recreational Athletes" International Journal of Environmental Research and Public Health 19, no. 11: 6756. https://doi.org/10.3390/ijerph19116756
APA StyleFernandez Ortega, J. A., Mendoza Romero, D., Sarmento, H., & Prieto Mondragón, L. (2022). Bar Load-Velocity Profile of Full Squat and Bench Press Exercises in Young Recreational Athletes. International Journal of Environmental Research and Public Health, 19(11), 6756. https://doi.org/10.3390/ijerph19116756