Spatial-Temporal Evolution Analysis of Carbon Emissions Embodied in Inter-Provincial Trade in China
Abstract
:1. Introduction
2. Research Methods and Data
2.1. MRIO Analysis
2.2. Calculation of Carbon Emissions Embodied in Inter-Provincial Trade
2.3. Construction of the ECETN
2.4. Indicators for Analyzing the ECETN
2.4.1. Centrality Analysis
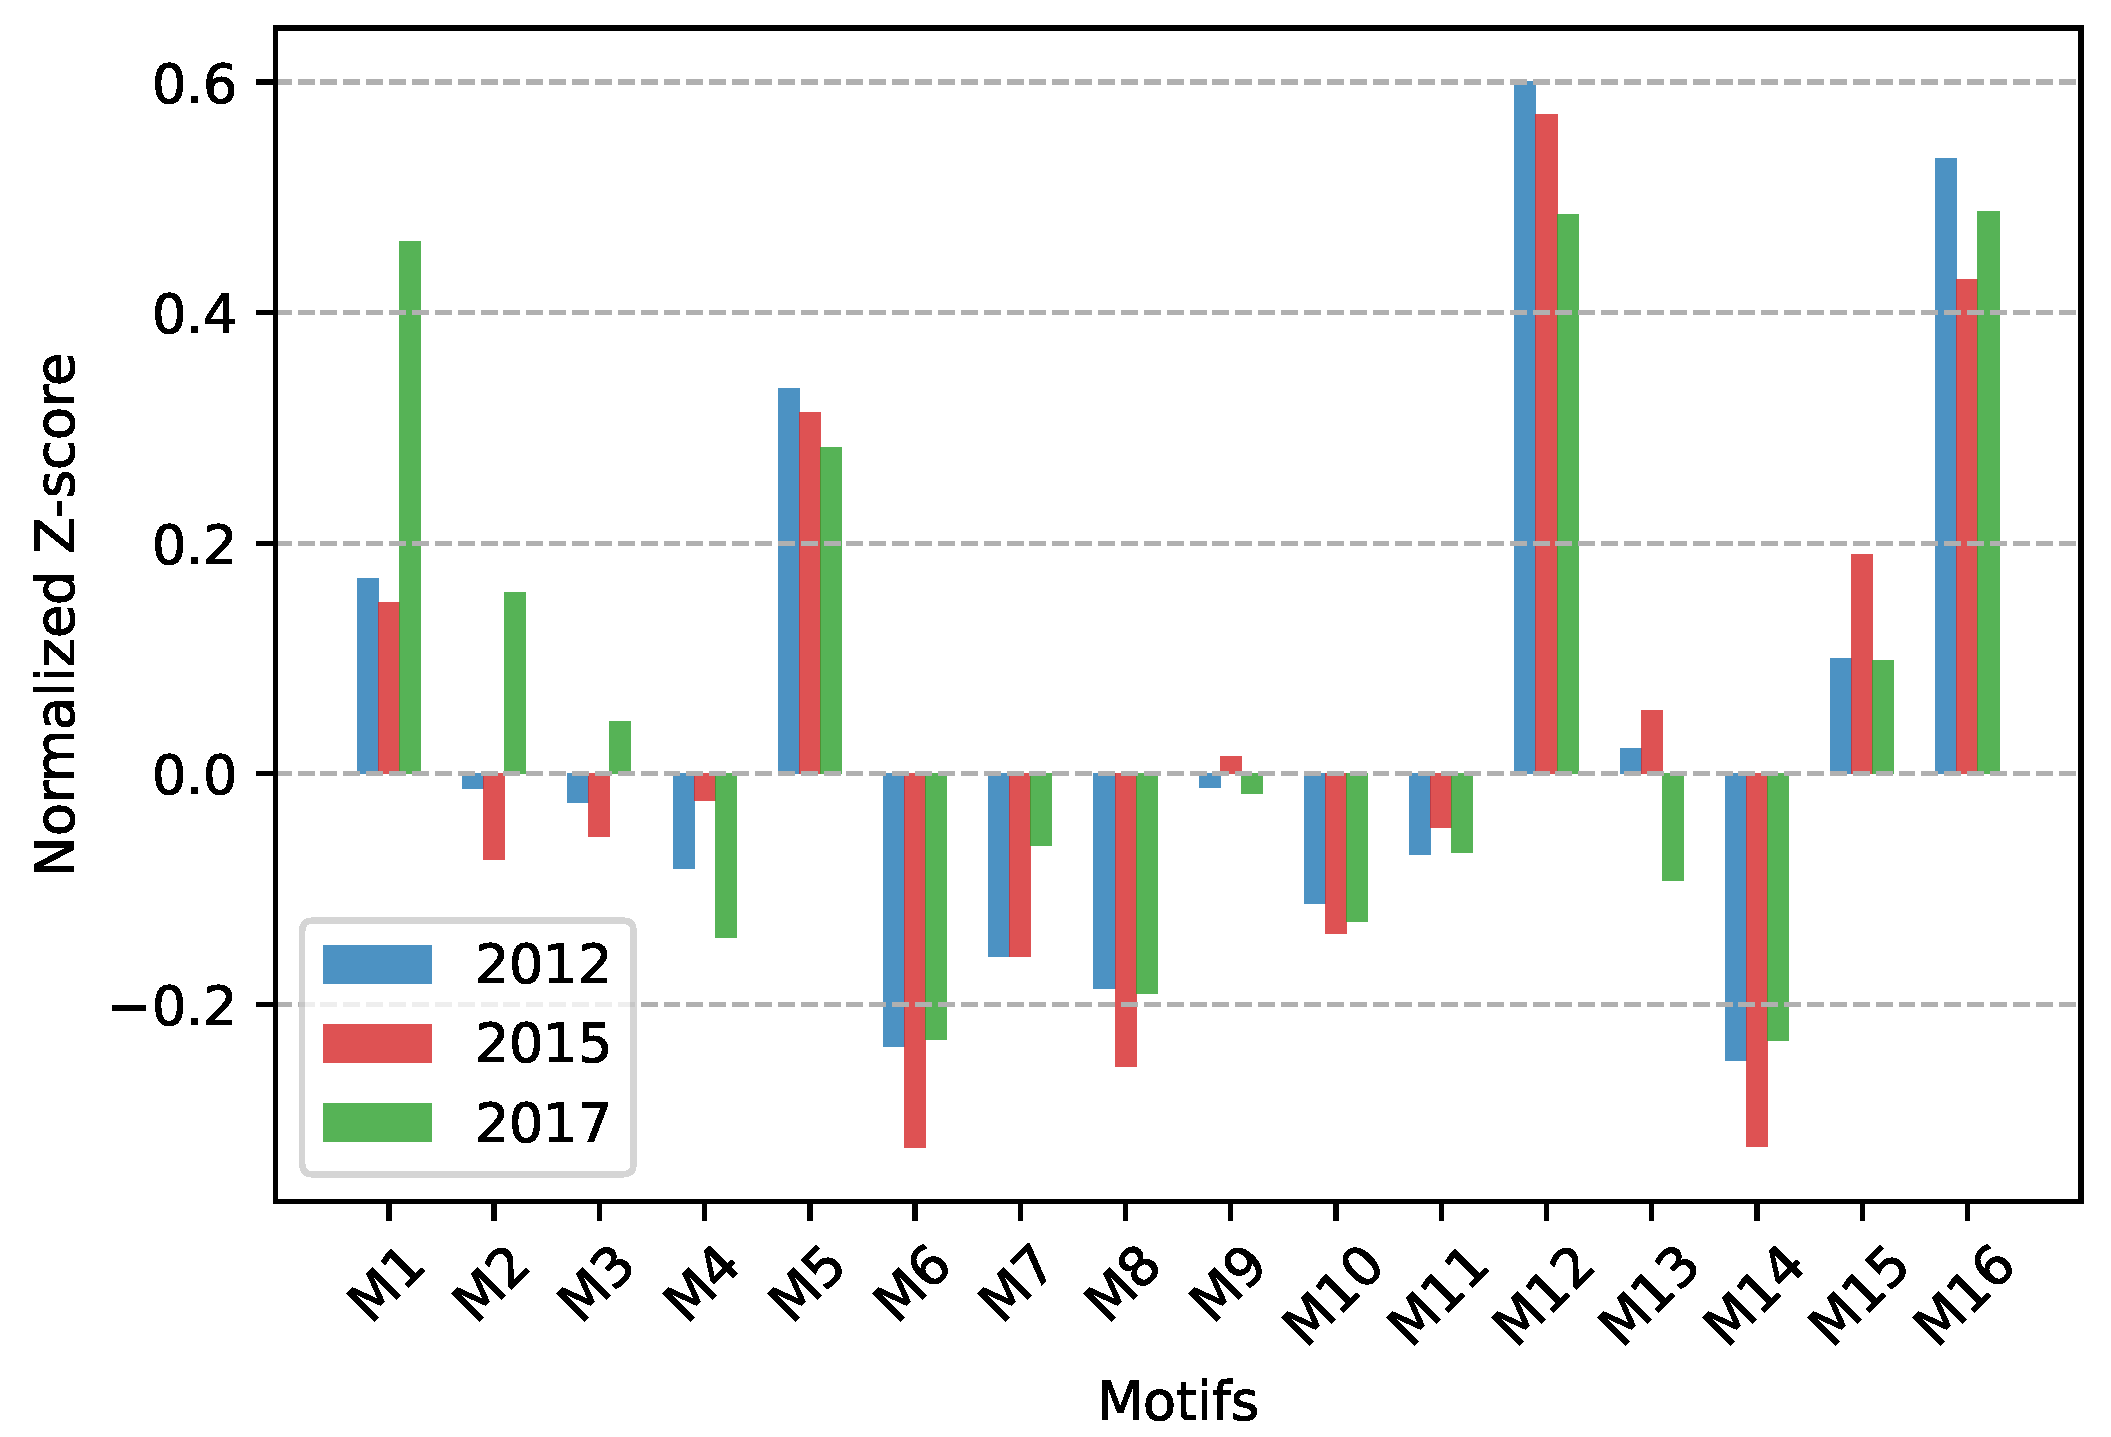
2.4.2. Topology Analysis
2.4.3. Clustering Analysis
2.5. QAP Analysis
2.6. The Data
3. Empirical Results
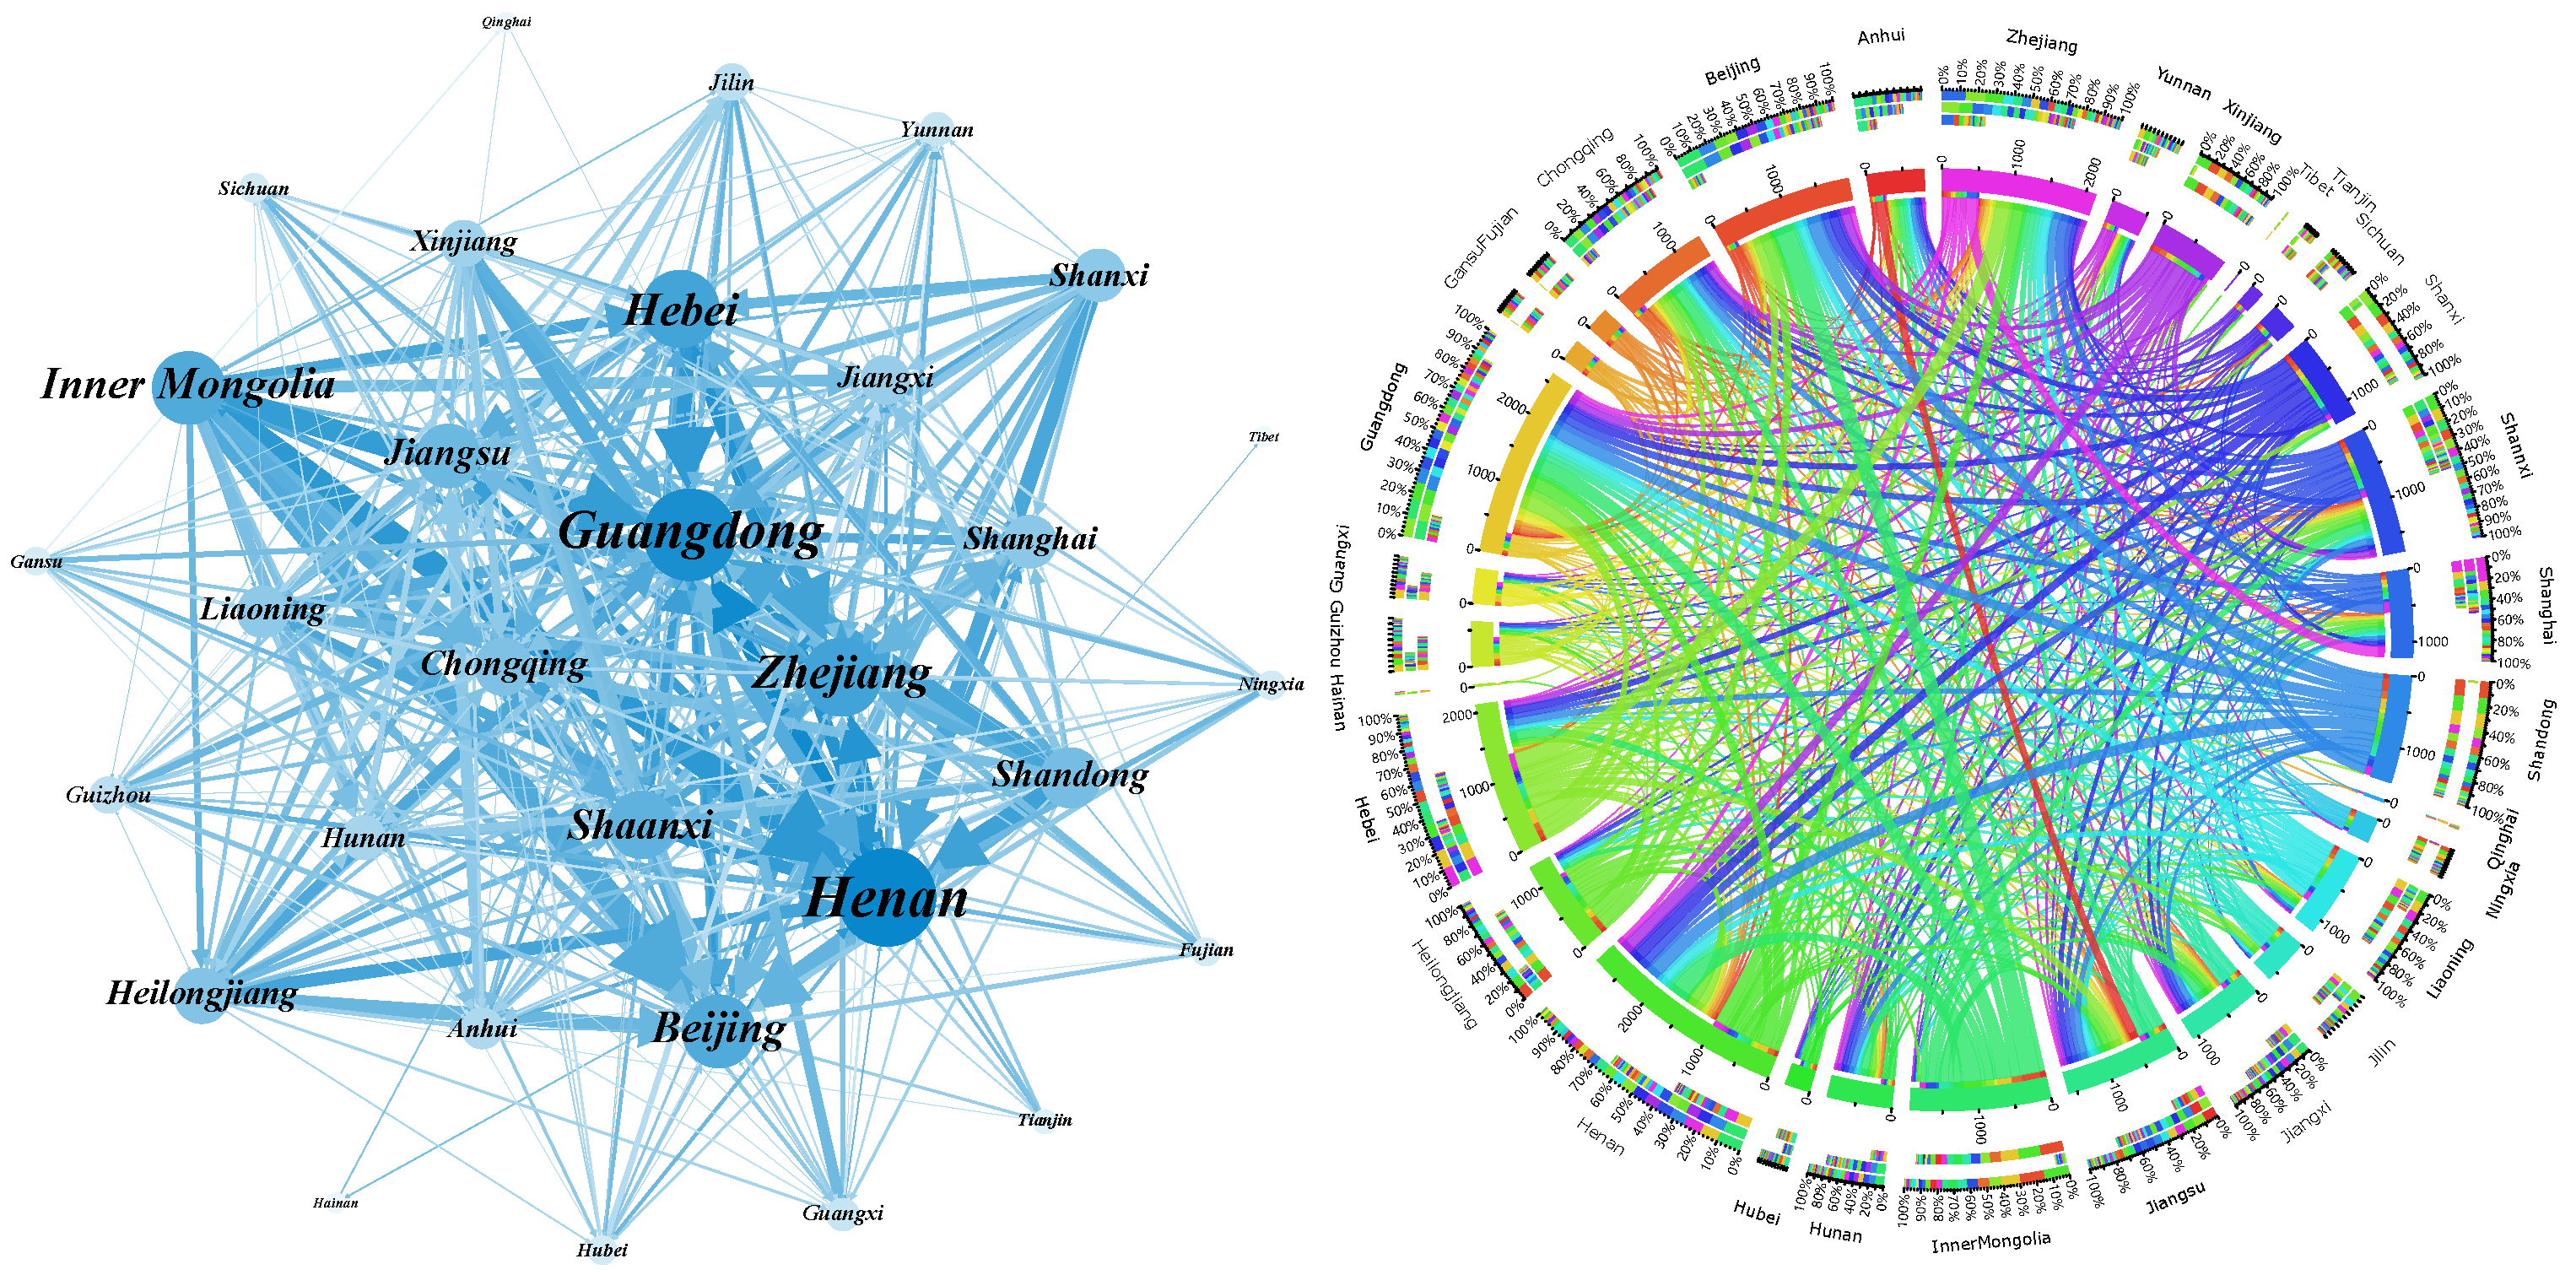
3.1. Evolution of Carbon Emissions Embodied in Inter-Provincial Trade in China
3.1.1. Evolution of Embodied Carbon Emissions under the Provincial Perspective
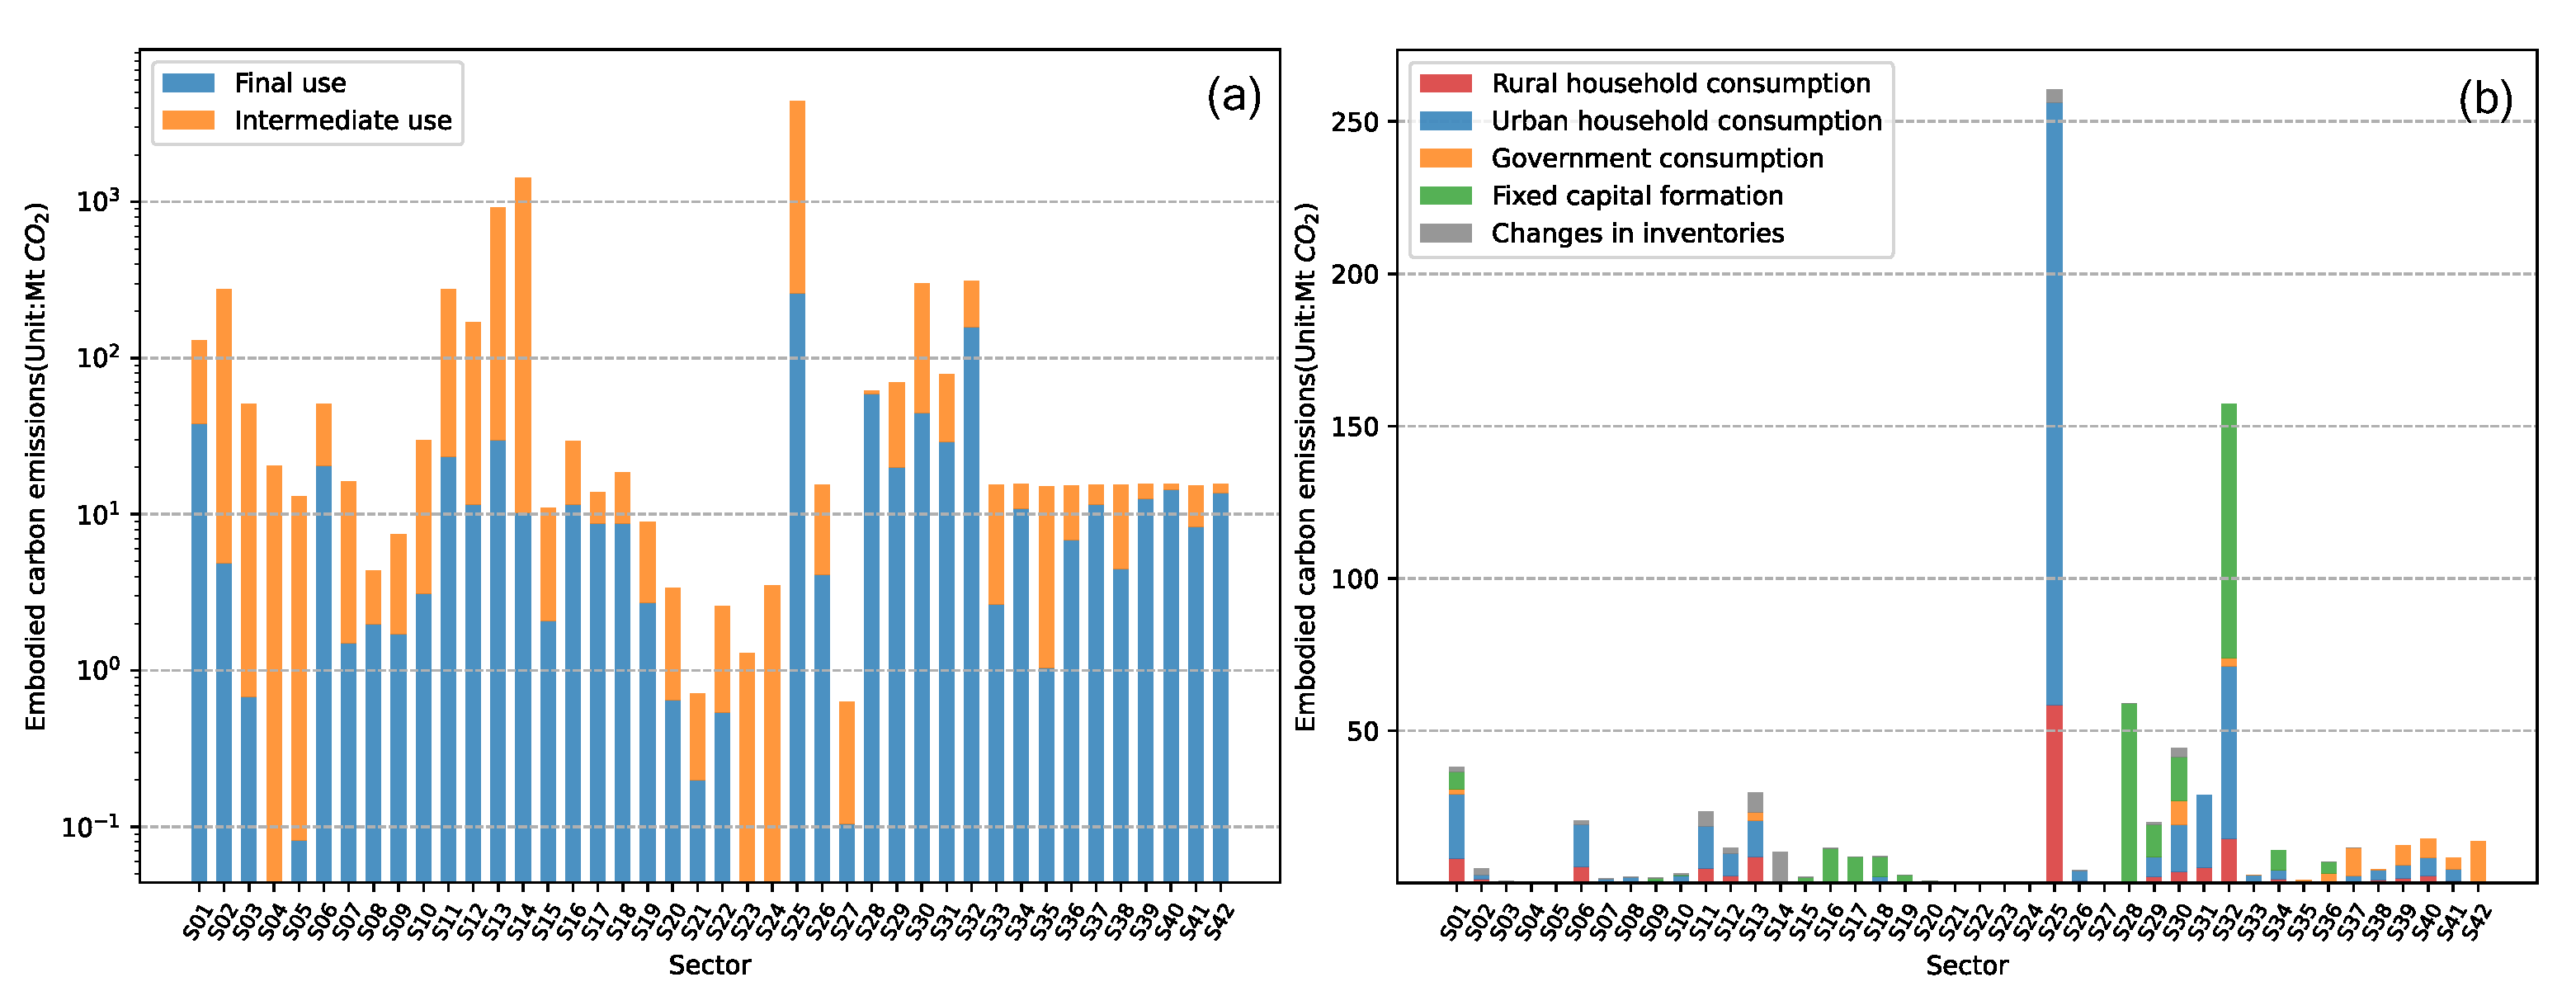
3.1.2. Evolution of Embodied Carbon Emissions under the Sectoral Perspective
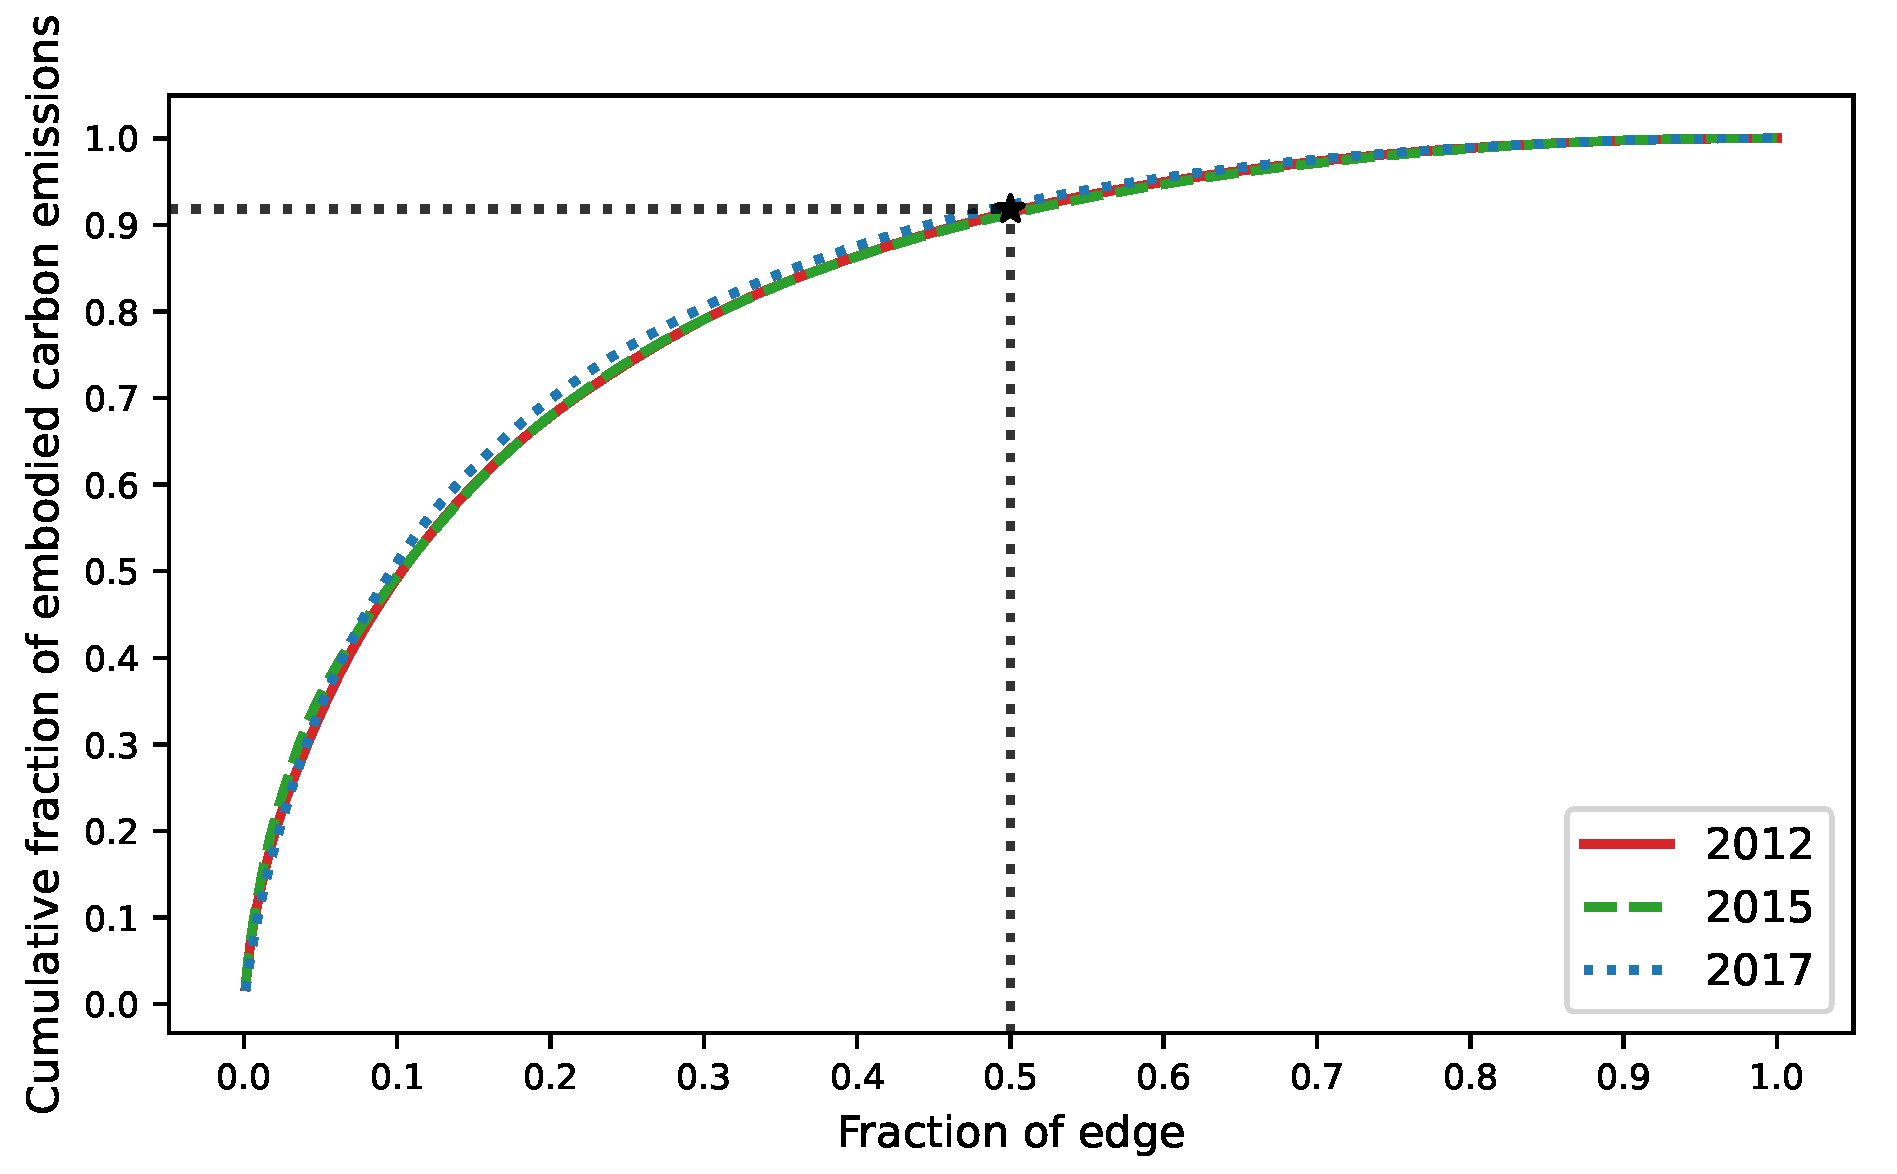
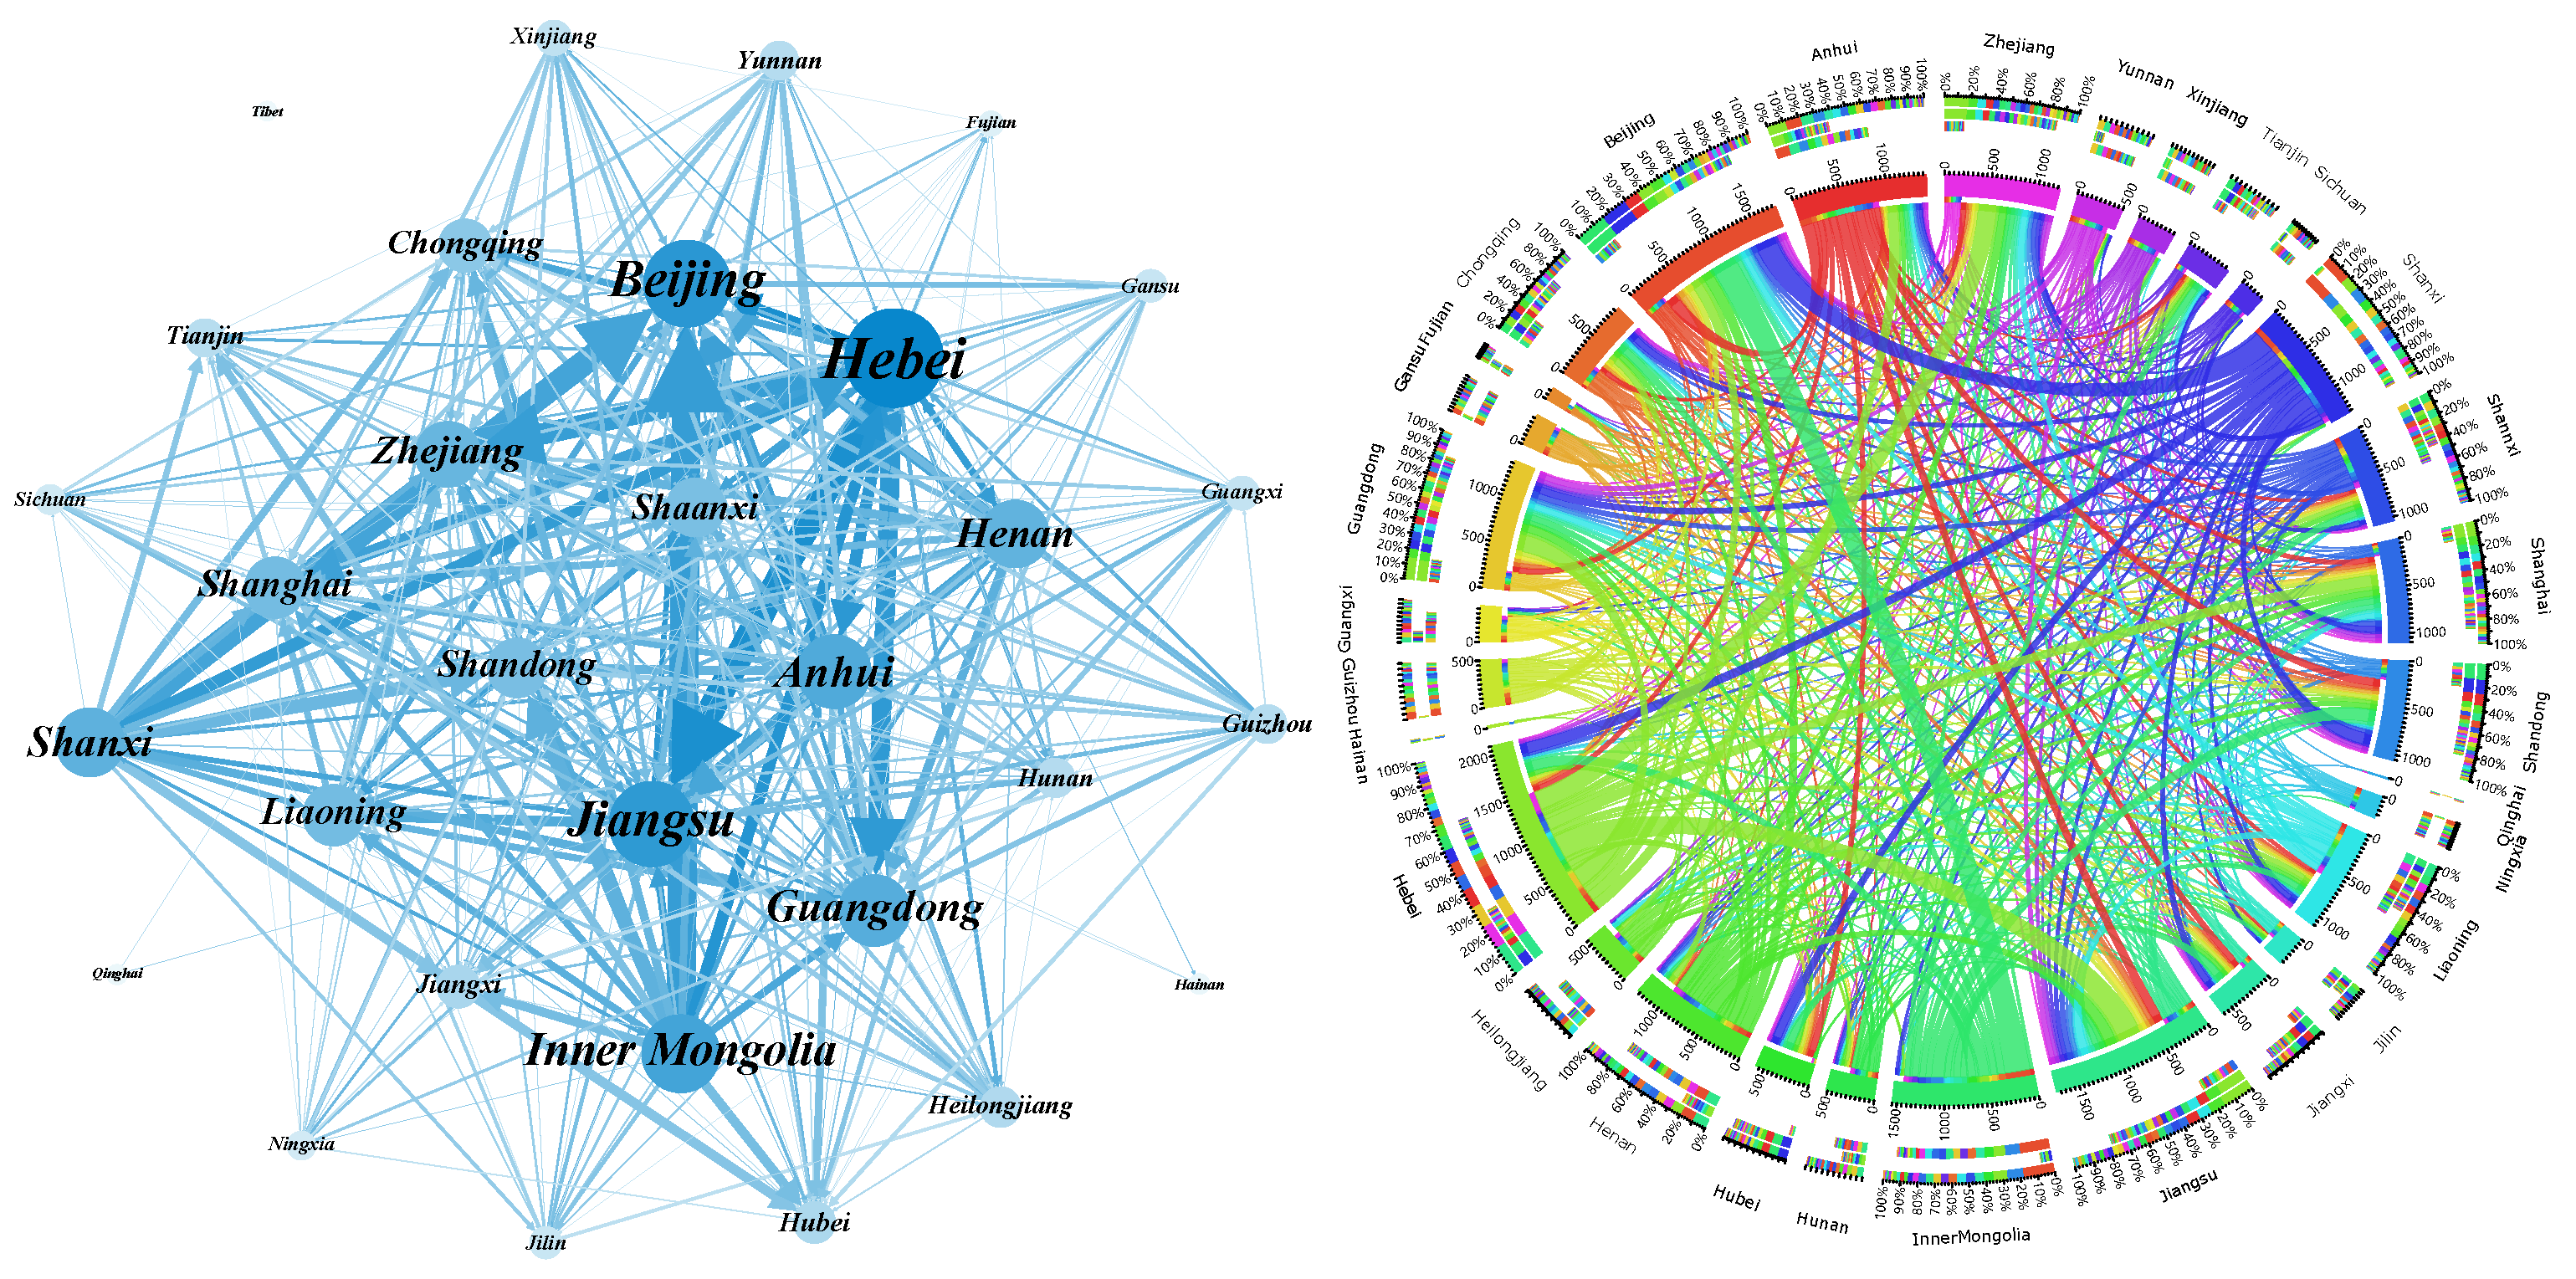
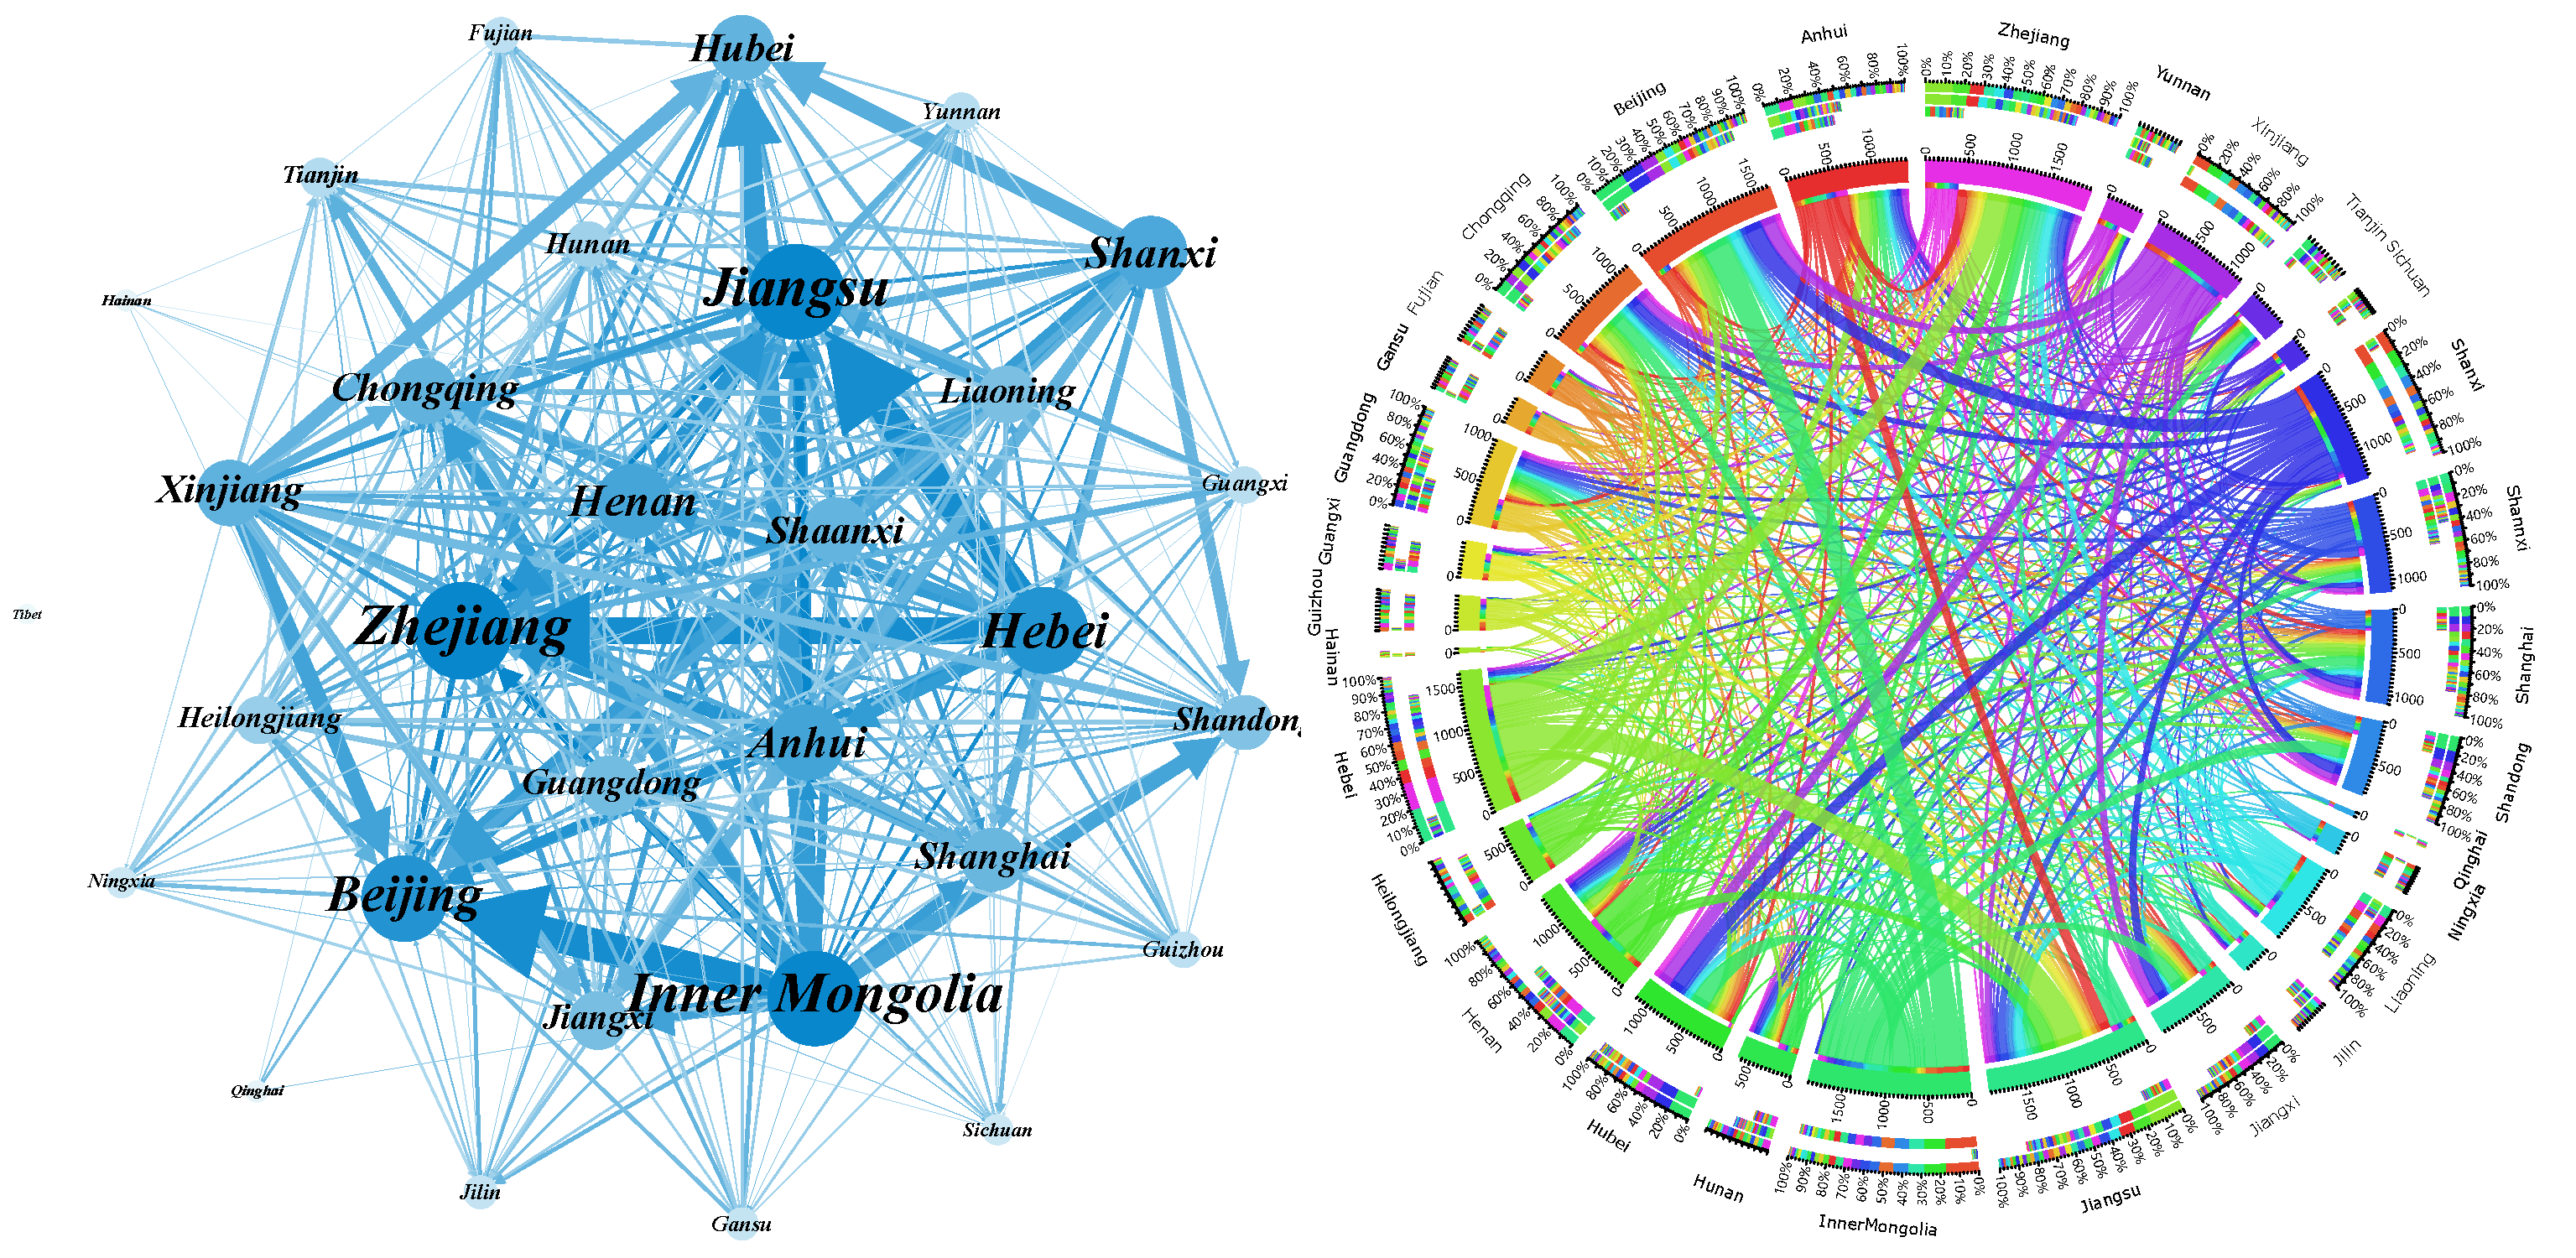
3.2. Evolution of Structural Characteristics of ECETN
3.3. Provincial Roles
3.3.1. Provinces with Large-Scale Influence
3.3.2. Provinces with Strong Influence
3.3.3. Provinces with Strong Intermediary Ability
3.3.4. Provinces with Strong Central Ability
3.3.5. Provinces with High Eigenvector Centrality
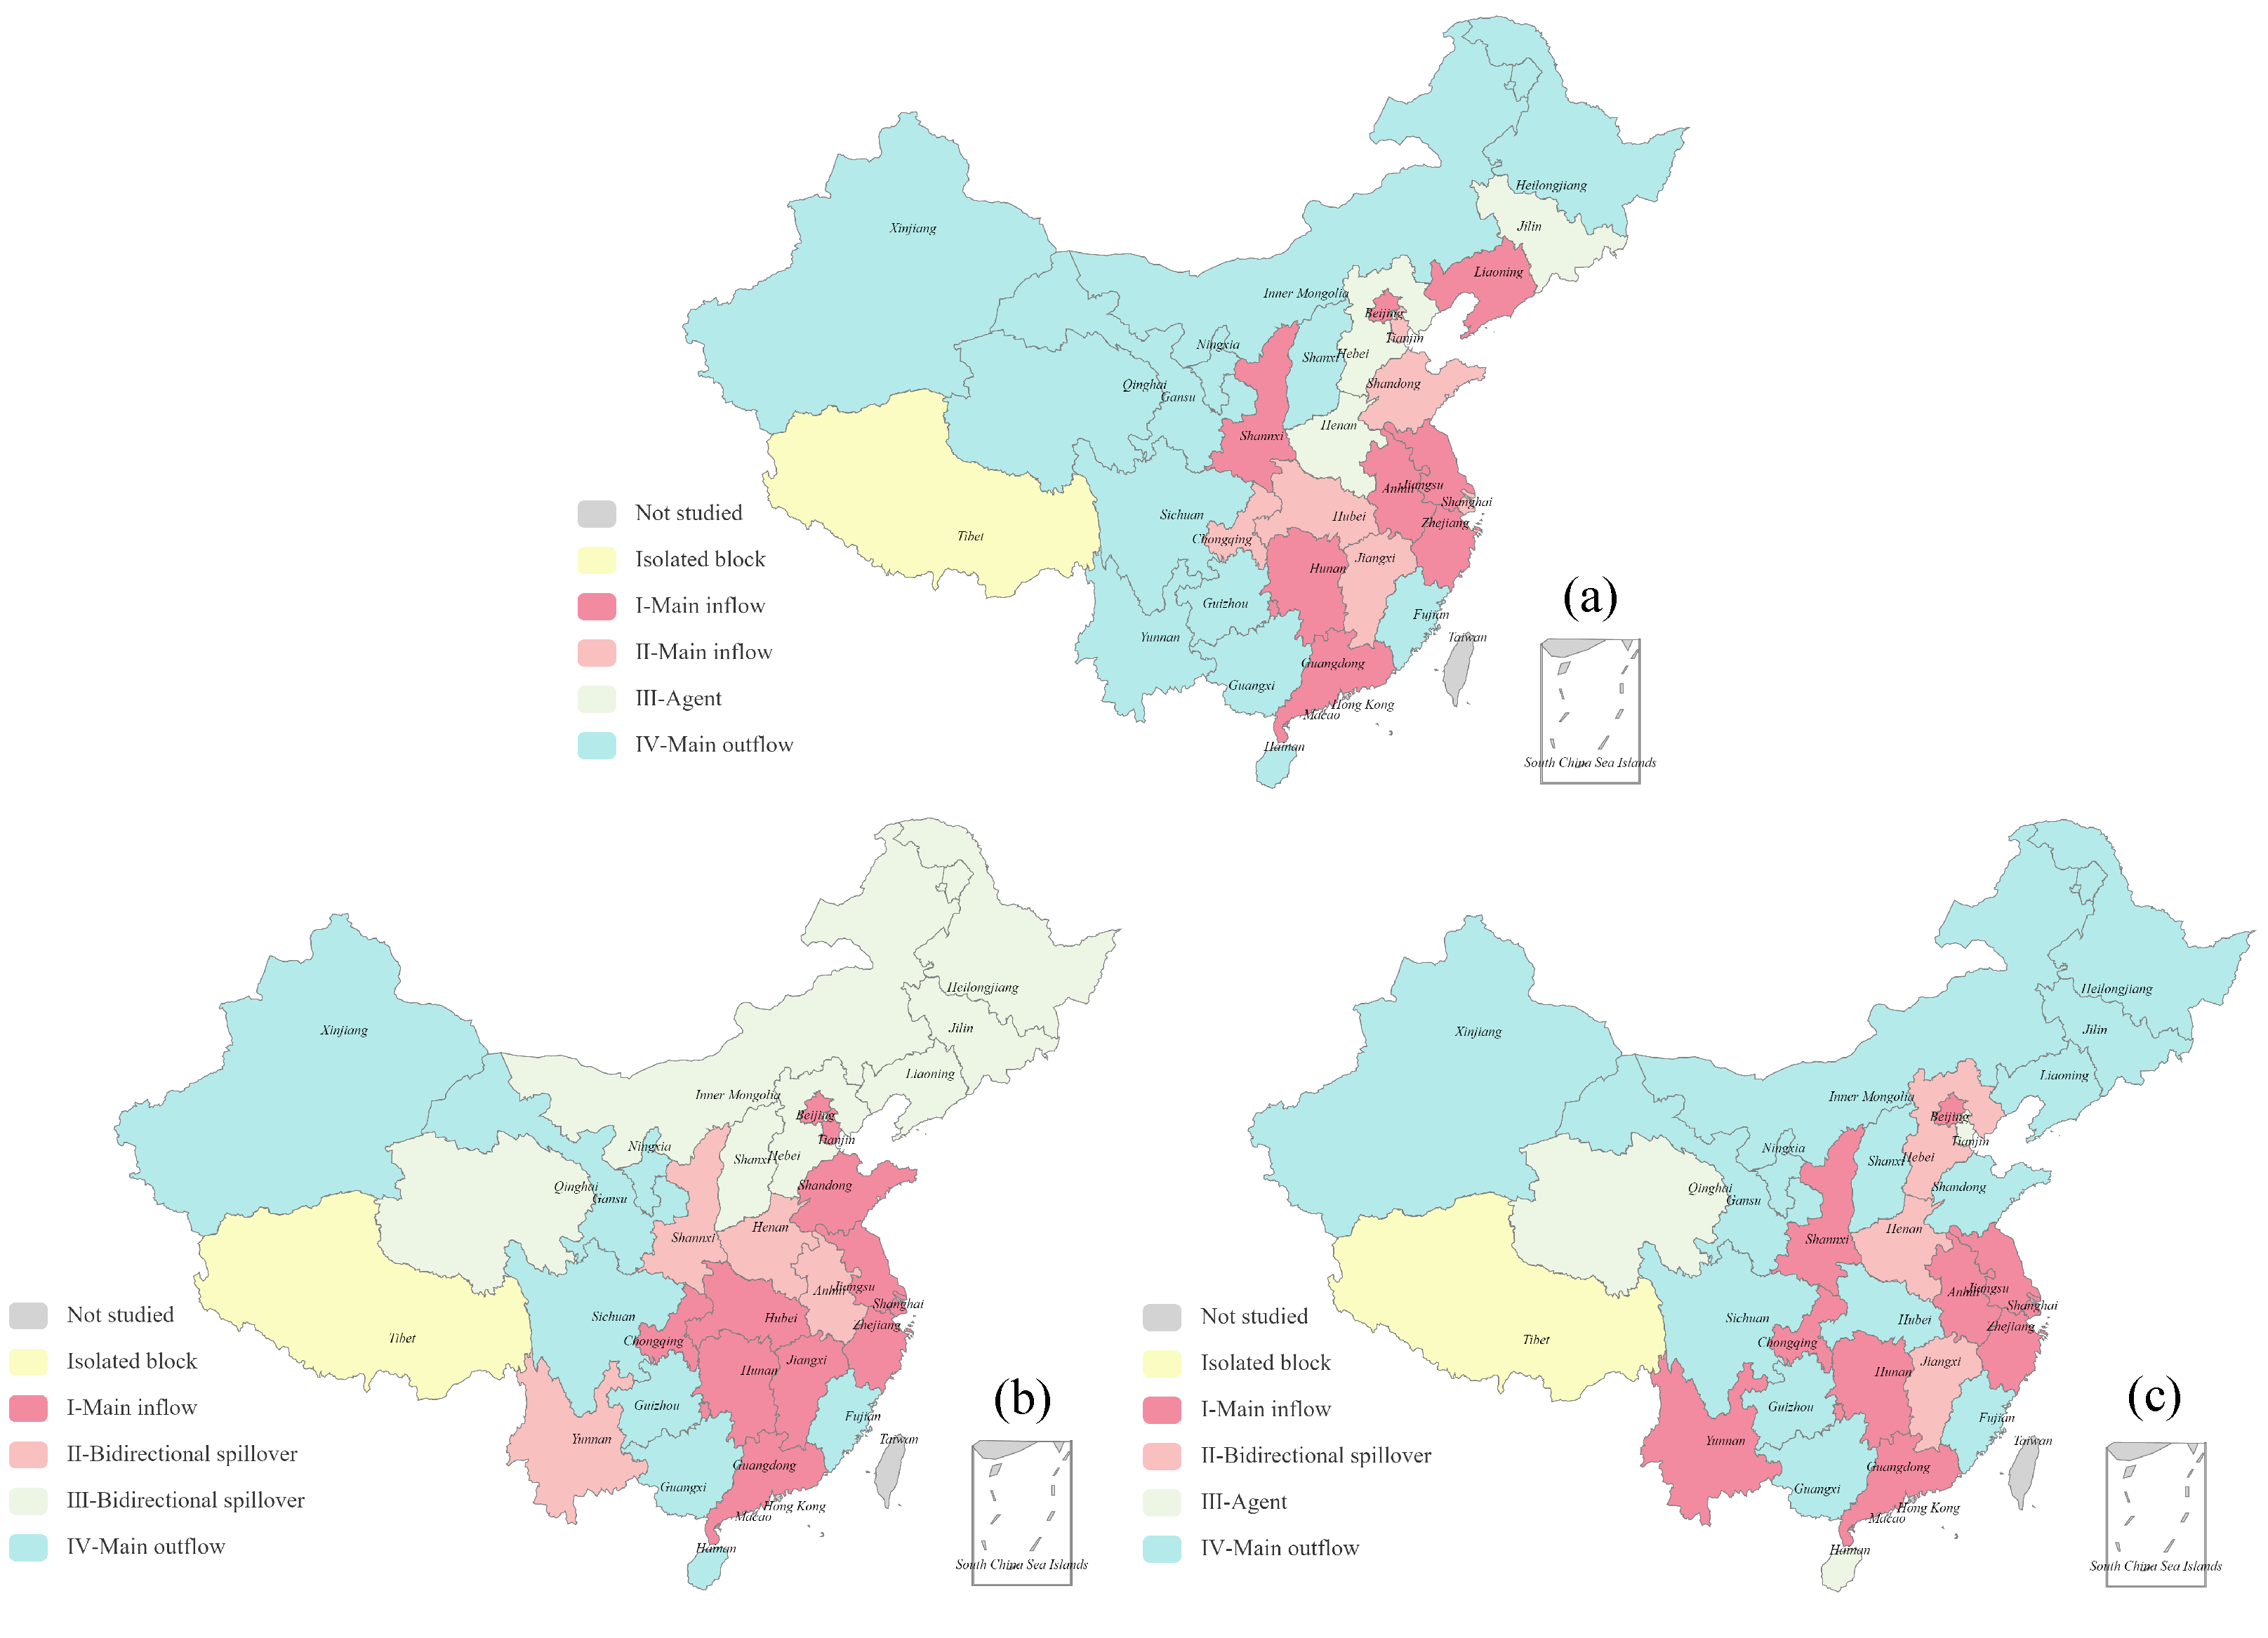
3.4. Clustering and Spatial Spillover Structure Characteristics
3.5. Analysis of Influencing Factors of ECETN
4. Conclusions and Policy Implications
Author Contributions
Funding
Institutional Review Board Statement
Informed Consent Statement
Data Availability Statement
Acknowledgments
Conflicts of Interest
Appendix A
| Index | Province | Degree-In | Degree-Out | Degree | Strength-In | Strength-Out | Strength | Betweenness | Closeness-In | Closeness-Out | Eigenvector | ||||||||||||||||||||
|---|---|---|---|---|---|---|---|---|---|---|---|---|---|---|---|---|---|---|---|---|---|---|---|---|---|---|---|---|---|---|---|
| 2012 | 2015 | 2017 | 2012 | 2015 | 2017 | 2012 | 2015 | 2017 | 2012 | 2015 | 2017 | 2012 | 2015 | 2017 | 2012 | 2015 | 2017 | 2012 | 2015 | 2017 | 2012 | 2015 | 2017 | 2012 | 2015 | 2017 | 2012 | 2015 | 2017 | ||
| 1 | Beijing | 26 | 27 | 27 | 15 | 10 | 10 | 41 | 37 | 37 | 154.80 | 150.18 | 176.97 | 24.02 | 18.36 | 18.90 | 178.82 | 168.54 | 195.87 | 0.01847 | 0.01738 | 0.00409 | 0.938 | 0.968 | 0.968 | 0.714 | 0.600 | 0.667 | 0.312 | 0.275 | 0.293 |
| 2 | Tianjin | 18 | 19 | 3 | 8 | 5 | 6 | 26 | 24 | 9 | 38.04 | 40.91 | 3.84 | 11.42 | 7.68 | 14.15 | 49.47 | 48.59 | 17.98 | 0.00013 | 0.00034 | 0.00000 | 0.732 | 0.769 | 0.526 | 0.545 | 0.526 | 0.588 | 0.203 | 0.190 | 0.079 |
| 3 | Hebei | 21 | 12 | 21 | 26 | 26 | 22 | 47 | 38 | 43 | 61.44 | 20.89 | 77.55 | 148.95 | 148.43 | 133.51 | 210.39 | 169.32 | 211.06 | 0.14629 | 0.04326 | 0.09371 | 0.811 | 0.638 | 0.811 | 1.000 | 0.938 | 0.938 | 0.363 | 0.315 | 0.348 |
| 4 | Shanxi | 3 | 7 | 3 | 22 | 20 | 19 | 25 | 27 | 22 | 3.50 | 10.91 | 10.31 | 127.80 | 123.41 | 110.27 | 131.30 | 134.32 | 120.58 | 0.00043 | 0.00352 | 0.00072 | 0.484 | 0.556 | 0.526 | 0.882 | 0.789 | 0.833 | 0.210 | 0.222 | 0.195 |
| 5 | InnerMongolia | 7 | 5 | 8 | 24 | 26 | 20 | 31 | 31 | 28 | 10.55 | 5.49 | 12.59 | 144.93 | 185.40 | 182.26 | 155.48 | 190.89 | 194.86 | 0.04252 | 0.05272 | 0.00405 | 0.556 | 0.508 | 0.577 | 0.938 | 0.938 | 0.857 | 0.262 | 0.243 | 0.235 |
| 6 | Liaoning | 24 | 12 | 17 | 20 | 20 | 18 | 44 | 32 | 35 | 51.20 | 18.58 | 31.13 | 60.16 | 76.39 | 87.13 | 111.36 | 94.97 | 118.26 | 0.04974 | 0.01698 | 0.01507 | 0.882 | 0.638 | 0.732 | 0.833 | 0.789 | 0.811 | 0.343 | 0.271 | 0.318 |
| 7 | Jilin | 10 | 10 | 8 | 10 | 10 | 17 | 20 | 20 | 25 | 15.38 | 18.61 | 22.28 | 17.93 | 16.32 | 41.13 | 33.31 | 34.92 | 63.41 | 0.00225 | 0.00110 | 0.00094 | 0.588 | 0.612 | 0.577 | 0.566 | 0.600 | 0.789 | 0.151 | 0.160 | 0.212 |
| 8 | Heilongjiang | 8 | 6 | 11 | 18 | 20 | 18 | 26 | 26 | 29 | 15.95 | 8.65 | 30.30 | 39.98 | 61.77 | 101.67 | 55.93 | 70.42 | 131.97 | 0.00400 | 0.00502 | 0.00933 | 0.545 | 0.545 | 0.625 | 0.789 | 0.789 | 0.811 | 0.205 | 0.213 | 0.223 |
| 9 | Shanghai | 27 | 25 | 21 | 9 | 13 | 18 | 36 | 38 | 39 | 97.08 | 86.59 | 64.55 | 13.57 | 23.63 | 57.62 | 110.65 | 110.22 | 122.17 | 0.02031 | 0.00885 | 0.02412 | 0.968 | 0.909 | 0.811 | 0.625 | 0.638 | 0.811 | 0.280 | 0.304 | 0.328 |
| 10 | Jiangsu | 28 | 27 | 28 | 16 | 16 | 13 | 44 | 43 | 41 | 136.73 | 161.66 | 121.44 | 38.15 | 30.50 | 40.61 | 174.88 | 192.17 | 162.06 | 0.05356 | 0.04119 | 0.02200 | 1.000 | 0.968 | 1.000 | 0.732 | 0.682 | 0.714 | 0.334 | 0.327 | 0.313 |
| 11 | Zhejiang | 27 | 27 | 28 | 13 | 17 | 14 | 40 | 44 | 42 | 104.50 | 157.09 | 161.12 | 18.30 | 39.83 | 52.98 | 122.81 | 196.92 | 214.10 | 0.02832 | 0.04980 | 0.03457 | 0.968 | 0.968 | 1.000 | 0.682 | 0.698 | 0.732 | 0.301 | 0.332 | 0.325 |
| 12 | Anhui | 24 | 25 | 20 | 17 | 20 | 7 | 41 | 45 | 27 | 54.48 | 75.51 | 56.45 | 89.43 | 66.56 | 23.13 | 143.91 | 142.07 | 79.58 | 0.01913 | 0.04022 | 0.00000 | 0.882 | 0.909 | 0.789 | 0.750 | 0.750 | 0.612 | 0.321 | 0.353 | 0.205 |
| 13 | Fujian | 6 | 7 | 0 | 8 | 14 | 12 | 14 | 21 | 12 | 6.30 | 8.13 | 0.00 | 7.72 | 32.38 | 32.49 | 14.02 | 40.51 | 32.49 | 0.00050 | 0.00010 | 0.00000 | 0.536 | 0.577 | 0.000 | 0.536 | 0.652 | 0.667 | 0.101 | 0.169 | 0.104 |
| 14 | Jiangxi | 21 | 20 | 23 | 7 | 9 | 13 | 28 | 29 | 36 | 49.15 | 77.05 | 75.89 | 12.95 | 20.73 | 31.94 | 62.10 | 97.77 | 107.83 | 0.00031 | 0.00037 | 0.00445 | 0.789 | 0.789 | 0.857 | 0.500 | 0.566 | 0.698 | 0.199 | 0.216 | 0.274 |
| 15 | Shandong | 26 | 18 | 1 | 12 | 10 | 21 | 38 | 28 | 22 | 84.84 | 67.40 | 2.00 | 21.56 | 21.43 | 146.99 | 106.40 | 88.83 | 148.99 | 0.03678 | 0.00175 | 0.00029 | 0.938 | 0.750 | 0.462 | 0.652 | 0.600 | 0.882 | 0.298 | 0.222 | 0.196 |
| 16 | Henan | 18 | 26 | 27 | 25 | 25 | 23 | 43 | 51 | 50 | 29.52 | 60.13 | 183.69 | 98.48 | 79.11 | 101.84 | 128.00 | 139.23 | 285.53 | 0.06296 | 0.14758 | 0.16813 | 0.750 | 0.938 | 0.968 | 0.968 | 0.882 | 0.968 | 0.345 | 0.395 | 0.384 |
| 17 | Hubei | 22 | 23 | 7 | 3 | 3 | 10 | 25 | 26 | 17 | 55.43 | 111.61 | 11.30 | 3.88 | 4.43 | 23.27 | 59.31 | 116.04 | 34.57 | 0.00014 | 0.00202 | 0.00000 | 0.811 | 0.857 | 0.556 | 0.455 | 0.448 | 0.667 | 0.179 | 0.194 | 0.129 |
| 18 | Hunan | 16 | 23 | 24 | 16 | 11 | 11 | 32 | 34 | 35 | 21.58 | 40.72 | 71.12 | 30.64 | 23.98 | 19.03 | 52.22 | 64.70 | 90.15 | 0.00372 | 0.00309 | 0.00385 | 0.714 | 0.857 | 0.882 | 0.732 | 0.612 | 0.667 | 0.257 | 0.264 | 0.275 |
| 19 | Guangdong | 27 | 27 | 28 | 14 | 15 | 14 | 41 | 42 | 42 | 117.47 | 66.60 | 231.22 | 20.82 | 35.76 | 32.00 | 138.28 | 102.37 | 263.21 | 0.02069 | 0.03754 | 0.04068 | 0.968 | 0.968 | 1.000 | 0.698 | 0.667 | 0.732 | 0.313 | 0.314 | 0.323 |
| 20 | Guangxi | 8 | 8 | 9 | 16 | 15 | 13 | 24 | 23 | 22 | 10.22 | 11.42 | 15.78 | 28.21 | 32.08 | 32.99 | 38.43 | 43.51 | 48.77 | 0.00122 | 0.00602 | 0.00045 | 0.588 | 0.600 | 0.600 | 0.732 | 0.667 | 0.698 | 0.190 | 0.162 | 0.180 |
| 21 | Hainan | 1 | 3 | 1 | 2 | 3 | 1 | 3 | 6 | 2 | 1.18 | 2.75 | 1.54 | 1.59 | 2.72 | 1.40 | 2.78 | 5.47 | 2.94 | 0.00000 | 0.00000 | 0.00000 | 0.469 | 0.526 | 0.517 | 0.441 | 0.429 | 0.455 | 0.024 | 0.039 | 0.022 |
| 22 | Chongqing | 23 | 26 | 27 | 14 | 10 | 10 | 37 | 36 | 37 | 64.05 | 100.79 | 119.26 | 25.30 | 15.95 | 19.10 | 89.35 | 116.74 | 138.36 | 0.01424 | 0.00778 | 0.01053 | 0.857 | 0.938 | 0.968 | 0.698 | 0.577 | 0.652 | 0.291 | 0.268 | 0.290 |
| 23 | Sichuan | 4 | 7 | 7 | 15 | 13 | 12 | 19 | 20 | 19 | 4.20 | 10.31 | 11.50 | 23.18 | 17.86 | 24.92 | 27.38 | 28.17 | 36.42 | 0.00000 | 0.00010 | 0.00060 | 0.492 | 0.556 | 0.566 | 0.714 | 0.638 | 0.698 | 0.154 | 0.161 | 0.168 |
| 24 | Guizhou | 1 | 3 | 15 | 18 | 16 | 16 | 19 | 19 | 31 | 0.80 | 3.09 | 21.22 | 50.16 | 37.59 | 40.78 | 50.96 | 40.68 | 62.00 | 0.00014 | 0.00031 | 0.01399 | 0.462 | 0.517 | 0.682 | 0.769 | 0.682 | 0.789 | 0.156 | 0.152 | 0.265 |
| 25 | Yunnan | 9 | 13 | 18 | 16 | 13 | 10 | 25 | 26 | 28 | 8.35 | 17.85 | 30.10 | 42.18 | 26.46 | 21.12 | 50.53 | 44.31 | 51.22 | 0.00053 | 0.00135 | 0.00126 | 0.556 | 0.667 | 0.750 | 0.732 | 0.638 | 0.667 | 0.193 | 0.215 | 0.241 |
| 26 | Tibet | 0 | 0 | 1 | 0 | 0 | 0 | 0 | 0 | 1 | 0.00 | 0.00 | 1.03 | 0.00 | 0.00 | 0.00 | 0.00 | 0.00 | 1.03 | 0.00000 | 0.00000 | 0.00000 | 0.000 | 0.000 | 0.492 | 0.000 | 0.000 | 0.000 | 0.000 | 0.000 | 0.014 |
| 27 | Shaanxi | 21 | 21 | 26 | 22 | 24 | 18 | 43 | 45 | 44 | 46.15 | 47.05 | 87.62 | 58.70 | 67.52 | 88.42 | 104.85 | 114.58 | 176.05 | 0.04319 | 0.08824 | 0.03748 | 0.811 | 0.811 | 0.938 | 0.882 | 0.882 | 0.811 | 0.332 | 0.353 | 0.355 |
| 28 | Gansu | 3 | 4 | 0 | 15 | 14 | 13 | 18 | 18 | 13 | 2.50 | 3.55 | 0.00 | 32.26 | 29.66 | 30.27 | 34.76 | 33.21 | 30.27 | 0.00000 | 0.00000 | 0.00000 | 0.484 | 0.526 | 0.000 | 0.714 | 0.652 | 0.652 | 0.146 | 0.130 | 0.100 |
| 29 | Qinghai | 0 | 1 | 1 | 2 | 3 | 2 | 2 | 4 | 3 | 0.00 | 0.87 | 1.53 | 1.62 | 4.55 | 2.11 | 1.62 | 5.42 | 3.64 | 0.00000 | 0.00000 | 0.00000 | 0.000 | 0.353 | 0.000 | 0.435 | 0.462 | 0.448 | 0.016 | 0.026 | 0.016 |
| 30 | Ningxia | 1 | 2 | 1 | 14 | 14 | 12 | 15 | 16 | 13 | 0.98 | 2.42 | 1.98 | 23.27 | 25.46 | 32.42 | 24.26 | 27.89 | 34.40 | 0.00000 | 0.00000 | 0.00000 | 0.370 | 0.375 | 0.357 | 0.714 | 0.667 | 0.714 | 0.113 | 0.110 | 0.106 |
| 31 | Xinjiang | 4 | 3 | 3 | 17 | 22 | 21 | 21 | 25 | 24 | 6.16 | 3.36 | 3.70 | 35.39 | 114.24 | 94.52 | 41.54 | 117.61 | 98.21 | 0.00053 | 0.01530 | 0.03381 | 0.508 | 0.517 | 0.526 | 0.750 | 0.811 | 0.909 | 0.177 | 0.202 | 0.214 |
References
- IPCC. Climate Change 2022: Mitigation of Climate Change; Cambridge University Press: Cambridge, UK, 2022. [Google Scholar]
- Paris Agreement. In Report of the Conference of the Parties to the United Nations Framework Convention on Climate Change (21st Session, 2015: Paris); HeinOnline: Paris, France, 2015.
- Tollefson, J. China’s carbon emissions could peak sooner than forecast. Nature 2016, 531, 425–426. [Google Scholar] [CrossRef] [PubMed]
- Chen, W.; Lei, Y.; Feng, K.; Wu, S.; Li, L. Provincial emission accounting for CO2 mitigation in China: Insights from production, consumption and income perspectives. Appl. Energy 2019, 255, 113754. [Google Scholar] [CrossRef]
- Enhanced Actions on Climate Change: China’s Intended Nationally Determined Contributions. 2015. Available online: http://www.china.org.cn/environment/2015-06/30/content_35950951.htm (accessed on 14 May 2022).
- Li, Y.L.; Chen, B.; Chen, G.Q. Carbon network embodied in international trade: Global structural evolution and its policy implications. Energy Policy 2020, 139, 111316. [Google Scholar] [CrossRef]
- Ullah, I.; Ali, S.; Shah, M.H.; Yasim, F.; Rehman, A.; Al-Ghazali, B.M. Linkages between Trade, CO2 Emissions and Healthcare Spending in China. Int. J. Environ. Res. Public Health 2019, 16, 4298. [Google Scholar] [CrossRef] [Green Version]
- Jakob, M.; Marschinski, R. Interpreting trade-related CO2 emission transfers. Nat. Clim. Chang. 2013, 3, 19–23. [Google Scholar] [CrossRef]
- Su, B.; Ang, B.W. Input–output analysis of CO2 emissions embodied in trade: The effects of spatial aggregation. Ecol. Econ. 2010, 70, 10–18. [Google Scholar] [CrossRef]
- Li, Y.L.; Han, M.Y.; Liu, S.Y.; Chen, G.Q. Energy consumption and greenhouse gas emissions by buildings: A multi-scale perspective. Build. Environ. 2019, 151, 240–250. [Google Scholar] [CrossRef]
- Shi, M.J.; Wang, Y.; Zhang, Z.Y.; Zhou, X. Regional carbon footprint and interregional transfer of carbon emissions in China. Acta Geogr. Sin. 2012, 67, 1327–1338. [Google Scholar]
- Bullard, C.W.; Herendeen, R.A. The energy cost of goods and services. Energy Policy 1975, 3, 268–278. [Google Scholar] [CrossRef]
- Costanza, R. Embodied Energy and Economic Valuation. Science 1980, 210, 1219–1224. [Google Scholar] [CrossRef]
- Yang, W.; Gao, H.; Yang, Y.; Liao, J. Embodied Carbon in China’s Export Trade: A Multi Region Input–Output Analysis. Int. J. Environ. Res. Public Health 2022, 19, 3894. [Google Scholar] [CrossRef] [PubMed]
- Li, J.; Liu, Y.; Li, H.; Chandio, A.A. Heterogeneous Driving Factors of Carbon Emissions Embedded in China’s Export: An Application of the LASSO Model. Int. J. Environ. Res. Public Health 2021, 18, 10423. [Google Scholar] [CrossRef] [PubMed]
- Qayyum, M.; Yu, Y.; Li, S. The impact of economic complexity on embodied carbon emission in trade: New empirical evidence from cross-country panel data. Environ. Sci. Pollut. Res. 2021, 28, 54015–54029. [Google Scholar] [CrossRef] [PubMed]
- Huo, J.; Meng, J.; Zhang, Z.; Gao, Y.; Zheng, H.; Coffman, D.M.; Xue, J.; Li, Y.; Guan, D. Drivers of fluctuating embodied carbon emissions in international services trade. One Earth 2021, 4, 1322–1332. [Google Scholar] [CrossRef]
- Leontief, W.W. Quantitative input and output relations in the economic systems of the United States. Rev. Econ. Stat. 1936, 18, 105–125. [Google Scholar] [CrossRef] [Green Version]
- Leontief, W. Environmental repercussions and the economic structure: An input–output approach. Rev. Econ. Stat. 1970, 52, 262–271. [Google Scholar] [CrossRef]
- Leontief, W.W.; Daniel, F. Air pollution and the economic structure: Empirical results of input–output computations. In Proceedings of the Fifth International Conference On Input–Output Techniques, Geneva, Switzerland, 11–15 January 1972; pp. 9–30. [Google Scholar]
- Chen, B.; Li, J.S.; Wu, X.F.; Han, M.Y.; Zeng, L.; Li, Z.; Chen, G.Q. Global energy flows embodied in international trade: A combination of environmentally extended input–output analysis and complex network analysis. Appl. Energy 2018, 210, 98–107. [Google Scholar] [CrossRef]
- Duan, C.; Chen, B.; Feng, K.; Liu, Z.; Hayat, T.; Alsaedi, A.; Ahmad, B. Interregional carbon flows of China. Appl. Energy 2018, 227, 342–352. [Google Scholar] [CrossRef]
- Li, J.; Chandio, A.A.; Liu, Y. Trade Impacts on Embodied Carbon Emissions—Evidence from the Bilateral Trade between China and Germany. Int. J. Environ. Res. Public Health 2020, 17, 5076. [Google Scholar] [CrossRef]
- Long, R.; Li, J.; Chen, H.; Zhang, L.; Li, Q. Embodied carbon dioxide flow in international trade: A comparative analysis based on China and Japan. J. Environ. Manag. 2018, 209, 371–381. [Google Scholar] [CrossRef]
- Zhang, K.; Wang, X. Pollution Haven Hypothesis of Global CO2, SO2, NOx—Evidence from 43 Economies and 56 Sectors. Int. J. Environ. Res. Public Health 2021, 18, 6552. [Google Scholar] [CrossRef] [PubMed]
- Zhang, Z.; Xi, L.; Bin, S.; Yuhuan, Z.; Song, W.; Ya, L.; Hao, L.; Yongfeng, Z.; Ashfaq, A.; Guang, S. Energy, CO2 emissions, and value added flows embodied in the international trade of the BRICS group: A comprehensive assessment. Renew. Sustain. Energy Rev. 2019, 116, 109432. [Google Scholar] [CrossRef]
- Zhou, D.; Zhou, X.; Xu, Q.; Wu, F.; Wang, Q.; Zha, D. Regional embodied carbon emissions and their transfer characteristics in China. Struct. Chang. Econ. Dyn. 2018, 46, 180–193. [Google Scholar] [CrossRef]
- Yuan, X.; Sheng, X.; Chen, L.; Tang, Y.; Li, Y.; Jia, Y.; Qu, D.; Wang, Q.; Ma, Q.; Zuo, J. Carbon footprint and embodied carbon transfer at the provincial level of the Yellow River Basin. Sci. Total Environ. 2022, 803, 149993. [Google Scholar] [CrossRef] [PubMed]
- Lv, K.; Feng, X.; Kelly, S.; Zhu, L.; Deng, M. A study on embodied carbon transfer at the provincial level of China from a social network perspective. J. Clean. Prod. 2019, 225, 1089–1104. [Google Scholar] [CrossRef]
- Liu, Z. China’s Carbon Emissions Report 2016; Report for Harvard Belfer Center for Science and International Affairs. 2016. Available online: http://nrs.harvard.edu/urn-3:HUL.InstRepos:29916843 (accessed on 14 May 2022).
- An, Q.; An, H.; Wang, L.; Gao, X.; Lv, N. Analysis of embodied exergy flow between Chinese industries based on network theory. Ecol. Model. 2015, 318, 26–35. [Google Scholar] [CrossRef]
- Gao, X.; An, H.; Fang, W.; Li, H.; Sun, X. The transmission of fluctuant patterns of the forex burden based on international crude oil prices. Energy 2014, 73, 380–386. [Google Scholar] [CrossRef]
- Li, J.; Fang, H.; Fang, S.; Zhang, Z.; Zhang, P. Embodied Energy Use in China’s Transportation Sector: A Multi-Regional Input–Output Analysis. Int. J. Environ. Res. Public Health 2021, 18, 7873. [Google Scholar] [CrossRef]
- Zeng, L.; Wang, B.; Tian, J.; Wang, Z. Threat impact analysis to air traffic control systems through flight delay modeling. Comput. Ind. Eng. 2021, 162, 107731. [Google Scholar] [CrossRef]
- Zeng, L.; Wang, B.; Tian, J.; Wang, Z. Research on delay propagation mechanism of air traffic control system based on causal inference. Transp. Res. Part C Emerg. Technol. 2022, 138, 103622. [Google Scholar] [CrossRef]
- Wang, X.; Yu, J.; Song, J.; Di, X.; Wang, R. Structural evolution of China’s intersectoral embodied carbon emission flow network. Environ. Sci. Pollut. Res. 2021, 28, 21145–21158. [Google Scholar] [CrossRef] [PubMed]
- Gao, C.; Su, B.; Sun, M.; Zhang, X.; Zhang, Z. Interprovincial transfer of embodied primary energy in China: A complex network approach. Appl. Energy 2018, 215, 792–807. [Google Scholar] [CrossRef]
- Cook, A.; Blom, H.A.; Lillo, F.; Mantegna, R.N.; Micciche, S.; Rivas, D.; Vázquez, R.; Zanin, M. Applying complexity science to air traffic management. J. Air Transp. Manag. 2015, 42, 149–158. [Google Scholar] [CrossRef] [Green Version]
- Shi, J.; Li, H.; Guan, J.; Sun, X.; Guan, Q.; Liu, X. Evolutionary features of global embodied energy flow between sectors: A complex network approach. Energy 2017, 140, 395–405. [Google Scholar] [CrossRef]
- Barrat, A.; Barthelemy, M.; Pastor-Satorras, R.; Vespignani, A. The architecture of complex weighted networks. Proc. Natl. Acad. Sci. USA 2004, 101, 3747–3752. [Google Scholar] [CrossRef] [PubMed] [Green Version]
- Wasserman, S.; Faust, K. Social Network Analysis: Methods and Applications. Riv. Ital. Sci. Politica 1994, 25, 582–584. [Google Scholar]
- Jiang, M.; Gao, X.; Guan, Q.; Hao, X.; An, F. The structural roles of sectors and their contributions to global carbon emissions: A complex network perspective. J. Clean. Prod. 2019, 208, 426–435. [Google Scholar] [CrossRef]
- Newman, M.E.J. Assortative mixing in networks. Phys. Rev. Lett. 2002, 89, 208701. [Google Scholar] [CrossRef] [Green Version]
- White, H.C.; Boorman, S.A.; Breiger, R.L. Social structure from multiple networks. I. Blockmodels of roles and positions. Am. J. Sociol. 1976, 81, 730–780. [Google Scholar] [CrossRef]
- Doreian, P.; Batagelj, V.; Ferligoj, A. Generalized blockmodeling of two-mode network data. Soc. Netw. 2004, 26, 29–53. [Google Scholar] [CrossRef] [Green Version]
- Cela, E.; Deineko, V.G.; Woeginger, G.J. Well-solvable cases of the QAP with block-structured matrices. Discret. Appl. Math. 2015, 186, 56–65. [Google Scholar] [CrossRef]
- Xu, H.; Cheng, L. The QAP weighted network analysis method and its application in international services trade. Phys. A Stat. Mech. Its Appl. 2016, 448, 91–101. [Google Scholar] [CrossRef]
- Barnes, J.A. Class and committees in a Norwegian island parish. Hum. Relat. 1954, 7, 39–58. [Google Scholar] [CrossRef]
- Scott, J. Social network analysis. Sociology 1988, 22, 109–127. [Google Scholar] [CrossRef]
- He, Y.-Y.; Wei, Z.-X.; Liu, G.-Q.; Zhou, P. Spatial network analysis of carbon emissions from the electricity sector in China. J. Clean. Prod. 2020, 262, 121193. [Google Scholar] [CrossRef]
- Zheng, H.; Bai, Y.; Wei, W.; Meng, J.; Zhang, Z.; Song, M.; Guan, D. Chinese provincial multi-regional input–output database for 2012, 2015, and 2017. Sci. Data 2021, 8, 1–13. [Google Scholar] [CrossRef]
- Zheng, H.; Zhang, Z.; Wei, W.; Song, M.; Dietzenbacher, E.; Wang, X.; Meng, J.; Shan, Y.; Ou, J.; Guan, D. Regional determinants of China’s consumption-based emissions in the economic transition. Environ. Res. Lett. 2020, 15, 074001. [Google Scholar] [CrossRef]
- Guan, Y.; Shan, Y.; Huang, Q.; Chen, H.; Wang, D.; Hubacek, K. Assessment to China’s recent emission pattern shifts. Earth Future 2021, 9, e2021EF002241. [Google Scholar] [CrossRef]
- Shan, Y.; Liu, J.; Liu, Z.; Xu, X.; Shao, S.; Wang, P.; Guan, D. New provincial CO2 emission inventories in China based on apparent energy consumption data and updated emission factors. Appl. Energy 2016, 184, 742–750. [Google Scholar] [CrossRef] [Green Version]
- Shan, Y.; Guan, D.; Zheng, H.; Ou, J.; Li, Y.; Meng, J.; Mi, Z.; Liu, Z.; Zhang, Q. China CO2 emission accounts 1997–2015. Sci. Data 2018, 5, 54. [Google Scholar] [CrossRef] [Green Version]
- Shan, Y.; Huang, Q.; Guan, D.; Hubacek, K. China CO2 emission accounts 2016–2017. Sci. Data 2020, 7, 1–9. [Google Scholar] [CrossRef] [PubMed] [Green Version]
- Shen-Orr, S.S.; Milo, R.; Mangan, S.; Alon, U. Network motifs in the transcriptional regulation network of Escherichia coli. Nat. Genet. 2002, 31, 64–68. [Google Scholar] [CrossRef] [PubMed]
- Bu, Y.; Wang, E.; Bai, J.; Shi, Q. Spatial pattern and driving factors for interprovincial natural gas consumption in China: Based on SNA and LMDI. J. Clean. Prod. 2020, 263, 121392. [Google Scholar] [CrossRef]
- Su, Y.; Yu, Y. Spatial association effect of regional pollution control. J. Clean. Prod. 2019, 213, 540–552. [Google Scholar] [CrossRef]
- Wiedmann, T. A review of recent multi-region input–output models used for consumption-based emission and resource accounting. Ecol. Econ. 2009, 69, 540–552. [Google Scholar] [CrossRef]



| Input | Output | |||||||||||||||||
|---|---|---|---|---|---|---|---|---|---|---|---|---|---|---|---|---|---|---|
| Intermediate Use | Final Use | Total Output | ||||||||||||||||
| Province 1 | ⋯ | Provincem | Province 1 | ⋯ | Provincem | Exports | ||||||||||||
| Sector 1 | ⋯ | Sectorn | Sector 1 | ⋯ | Sectorn | Category 1 | ⋯ | Categoryk | Category 1 | ⋯ | Categoryk | |||||||
| Intermediate input | Sector 1 | ⋯ | ⋯ | ⋯ | ⋯ | |||||||||||||
| Province 1 | ⋮ | ⋮ | ⋱ | ⋮ | ⋯ | ⋮ | ⋱ | ⋮ | ⋮ | ⋱ | ⋮ | ⋯ | ⋮ | ⋱ | ⋮ | ⋮ | ⋮ | |
| Sector n | ⋯ | ⋯ | ⋯ | ⋯ | ||||||||||||||
| ⋮ | ⋮ | ⋮ | ⋮ | ⋮ | ||||||||||||||
| Sector 1 | ⋯ | ⋯ | ⋯ | ⋯ | ||||||||||||||
| Province m | ⋮ | ⋮ | ⋱ | ⋮ | ⋯ | ⋮ | ⋱ | ⋮ | ⋮ | ⋱ | ⋮ | ⋯ | ⋮ | ⋱ | ⋮ | ⋮ | ⋮ | |
| Sector n | ⋯ | ⋯ | ⋯ | ⋯ | ||||||||||||||
| Imports | ⋯ | ⋯ | ⋯ | ⋯ | ⋯ | ⋯ | ||||||||||||
| Value-added | ⋯ | ⋯ | ⋯ | |||||||||||||||
| Total input | ⋯ | ⋯ | ⋯ | |||||||||||||||
| Direct carbon emissions | ⋯ | ⋯ | ⋯ | |||||||||||||||
| Year | Number of Node | Number of Edge | Average Degree | Average Strength | Network Density | Network Efficiency | Clustering Coefficient | Average Path Length | Assortativity |
|---|---|---|---|---|---|---|---|---|---|
| 2012 | 31 | 434 | 14.000 | 40.404 | 0.467 | 0.864 | 0.657 | 1.590 | −0.272 |
| 2015 | 31 | 432 | 13.935 | 44.844 | 0.465 | 0.861 | 0.620 | 1.586 | −0.254 |
| 2017 | 31 | 414 | 13.355 | 52.871 | 0.445 | 0.824 | 0.663 | 1.560 | −0.319 |
| Year | Block | Provinces | Contacts Received | Contacts Sent | Expected Internal Relationship | Actual Internal Relationship | Characteristic | ||
|---|---|---|---|---|---|---|---|---|---|
| Inside | Outside | Inside | Outside | ||||||
| 2012 | I | Beijing, Anhui, Hunan, Guangdong, Zhejiang, Liaoning, Jiangsu, Shaanxi (8) | 54 | 139 | 54 | 79 | 24.14% | 40.60% | Main inflow |
| II | Tianjin, Chongqing, Shandong, Shanghai, Jiangxi, Hubei (6) | 10 | 127 | 10 | 43 | 17.24% | 18.87% | Main inflow | |
| III | Henan, Jilin, Hebei (3) | 4 | 45 | 4 | 57 | 6.90% | 6.56% | Agent | |
| IV | Fujian, Inner Mongolia, Guangxi, Hainan, Heilongjiang, Sichuan, Guizhou, Yunnan, Shanxi, Gansu, Qinghai, Ningxia, Xinjiang (13) | 19 | 36 | 19 | 168 | 41.38% | 10.16% | Main outflow | |
| 2015 | I | Beijing, Tianjin, Hunan, Guangdong, Shandong, Shanghai, Chongqing, Zhejiang, Jiangsu, Jiangxi, Hubei (11) | 73 | 184 | 73 | 41 | 34.48% | 64.04% | Main inflow |
| II | Shaanxi, Yunnan, Henan, Anhui (4) | 12 | 73 | 12 | 70 | 10.34% | 14.63% | Bidirectional spillover | |
| III | Liaoning, Qinghai, Heilongjiang, Inner Mongolia, Shanxi, Jilin, Hebei (7) | 26 | 27 | 26 | 99 | 20.69% | 20.80% | Bidirectional spillover | |
| IV | Hainan, Guangxi, Guizhou, Sichuan, Gansu, Fujian, Ningxia, Xinjiang (8) | 7 | 30 | 7 | 104 | 24.14% | 6.31% | Main outflow | |
| 2017 | I | Beijing, Shanghai, Hunan, Guangdong, Anhui, Shaanxi, Chongqing, Zhejiang, Yunnan, Jiangsu (10) | 79 | 168 | 79 | 46 | 31.03% | 63.20% | Main inflow |
| II | Jiangxi, Henan, Hebei (3) | 5 | 66 | 5 | 52 | 6.90% | 8.77% | Bidirectional spillover | |
| III | Hainan, Qinghai, Tianjin (3) | 0 | 5 | 0 | 9 | 6.90% | 0.00% | Agent | |
| IV | Heilongjiang, Hubei, Shandong, Guangxi, Liaoning, Inner Mongolia, Sichuan, Guizhou, Jilin, Shanxi, Gansu, Fujian, Ningxia, Xinjiang (14) | 49 | 41 | 49 | 173 | 44.83% | 22.07% | Main outflow | |
| Year | Block | Density Matrix | Image Matrix | ||||||
|---|---|---|---|---|---|---|---|---|---|
| I | II | III | IV | I | II | III | IV | ||
| 2012 | I | 0.964 | 1.000 | 0.750 | 0.125 | 1 | 1 | 1 | 0 |
| II | 0.750 | 0.333 | 0.278 | 0.026 | 1 | 0 | 0 | 0 | |
| III | 0.875 | 0.833 | 0.667 | 0.538 | 1 | 1 | 1 | 1 | |
| IV | 0.788 | 0.821 | 0.564 | 0.122 | 1 | 1 | 1 | 0 | |
| 2015 | I | 0.709 | 0.682 | 0.104 | 0.034 | 1 | 1 | 0 | 0 |
| II | 0.977 | 1.000 | 0.536 | 0.375 | 1 | 1 | 1 | 0 | |
| III | 0.844 | 0.679 | 0.619 | 0.268 | 1 | 1 | 1 | 0 | |
| IV | 0.864 | 0.750 | 0.071 | 0.125 | 1 | 1 | 0 | 0 | |
| 2017 | I | 0.878 | 0.800 | 0.000 | 0.157 | 1 | 1 | 0 | 0 |
| II | 1.000 | 0.833 | 0.333 | 0.452 | 1 | 1 | 0 | 0 | |
| III | 0.267 | 0.111 | 0.000 | 0.000 | 0 | 0 | 0 | 0 | |
| IV | 0.929 | 0.976 | 0.048 | 0.269 | 1 | 1 | 0 | 0 | |
| Variable | 2012 | 2015 | 2017 | |||
|---|---|---|---|---|---|---|
| ObsValue | Significance | ObsValue | Significance | ObsValue | Significance | |
| −0.024 | 0.237 | −0.071 ** | 0.024 | 0.052 * | 0.066 | |
| −0.044 | 0.257 | 0.047 | 0.205 | −0.119 ** | 0.043 | |
| 0.211 *** | 0.000 | 0.261 *** | 0.000 | 0.303 *** | 0.000 | |
| 0.221 *** | 0.001 | 0.214 *** | 0.001 | 0.106 * | 0.089 | |
| 0.109 ** | 0.048 | −0.009 | 0.462 | −0.066 | 0.190 | |
| −0.088 | 0.143 | −0.021 | 0.413 | 0.141 ** | 0.040 | |
| B | 0.203 *** | 0.005 | 0.098 ** | 0.023 | 0.269 *** | 0.002 |
| −0.224 *** | 0.000 | −0.206 *** | 0.000 | −0.192 *** | 0.001 | |
| C | −0.218 *** | 0.000 | −0.173 *** | 0.000 | −0.138 ** | 0.034 |
| 0.065 ** | 0.032 | 0.033** | 0.038 | 0.115 *** | 0.000 |
| Dependent Variable | Inter Provincial Embodied Carbon Emission Transfer Network | 2012 | 2015 | 2017 | |||
|---|---|---|---|---|---|---|---|
| Standardized Coefficient | Significance (p-Value) | Standardized Coefficient | Significance (p-Value) | Standardized Coefficient | Significance (p-Value) | ||
| Influencing factors (difference matrix) | — | — | −0.073 | 0.414 | 0.131 ** | 0.032 | |
| — | — | — | — | −0.107 | 0.154 | ||
| 0.360 *** | 0.000 | 0.329 *** | 0.000 | 0.345 *** | 0.000 | ||
| 0.232 *** | 0.000 | 0.182 *** | 0.000 | 0.157 *** | 0.001 | ||
| 0.223 *** | 0.005 | — | — | — | — | ||
| — | — | — | — | 0.129 | 0.111 | ||
| B | 0.184 *** | 0.000 | 0.184 *** | 0.000 | 0.197 *** | 0.000 | |
| −0.409 *** | 0.000 | −0.381 *** | 0.000 | −0.378 *** | 0.000 | ||
| C | −0.187 *** | 0.005 | −0.266 *** | 0.000 | −0.108 ** | 0.033 | |
| 0.075 *** | 0.002 | 0.082 *** | 0.007 | 0.091 *** | 0.001 | ||
| Determination cofficient | 0.372 | 0.352 | 0.378 | ||||
| Adjusted | 0.364 | 0.343 | 0.370 | ||||
Publisher’s Note: MDPI stays neutral with regard to jurisdictional claims in published maps and institutional affiliations. |
© 2022 by the authors. Licensee MDPI, Basel, Switzerland. This article is an open access article distributed under the terms and conditions of the Creative Commons Attribution (CC BY) license (https://creativecommons.org/licenses/by/4.0/).
Share and Cite
Wang, T.; Chen, Y.; Zeng, L. Spatial-Temporal Evolution Analysis of Carbon Emissions Embodied in Inter-Provincial Trade in China. Int. J. Environ. Res. Public Health 2022, 19, 6794. https://doi.org/10.3390/ijerph19116794
Wang T, Chen Y, Zeng L. Spatial-Temporal Evolution Analysis of Carbon Emissions Embodied in Inter-Provincial Trade in China. International Journal of Environmental Research and Public Health. 2022; 19(11):6794. https://doi.org/10.3390/ijerph19116794
Chicago/Turabian StyleWang, Tianrui, Yu Chen, and Leya Zeng. 2022. "Spatial-Temporal Evolution Analysis of Carbon Emissions Embodied in Inter-Provincial Trade in China" International Journal of Environmental Research and Public Health 19, no. 11: 6794. https://doi.org/10.3390/ijerph19116794
APA StyleWang, T., Chen, Y., & Zeng, L. (2022). Spatial-Temporal Evolution Analysis of Carbon Emissions Embodied in Inter-Provincial Trade in China. International Journal of Environmental Research and Public Health, 19(11), 6794. https://doi.org/10.3390/ijerph19116794


