
Assessment of Trace Metals Contamination, Species Distribution and Mobility in River Sediments Using EDTA Extraction


Abstract
:1. Introduction
2. Materials and Methods
2.1. Sampling Area
2.2. EDTA Extraction
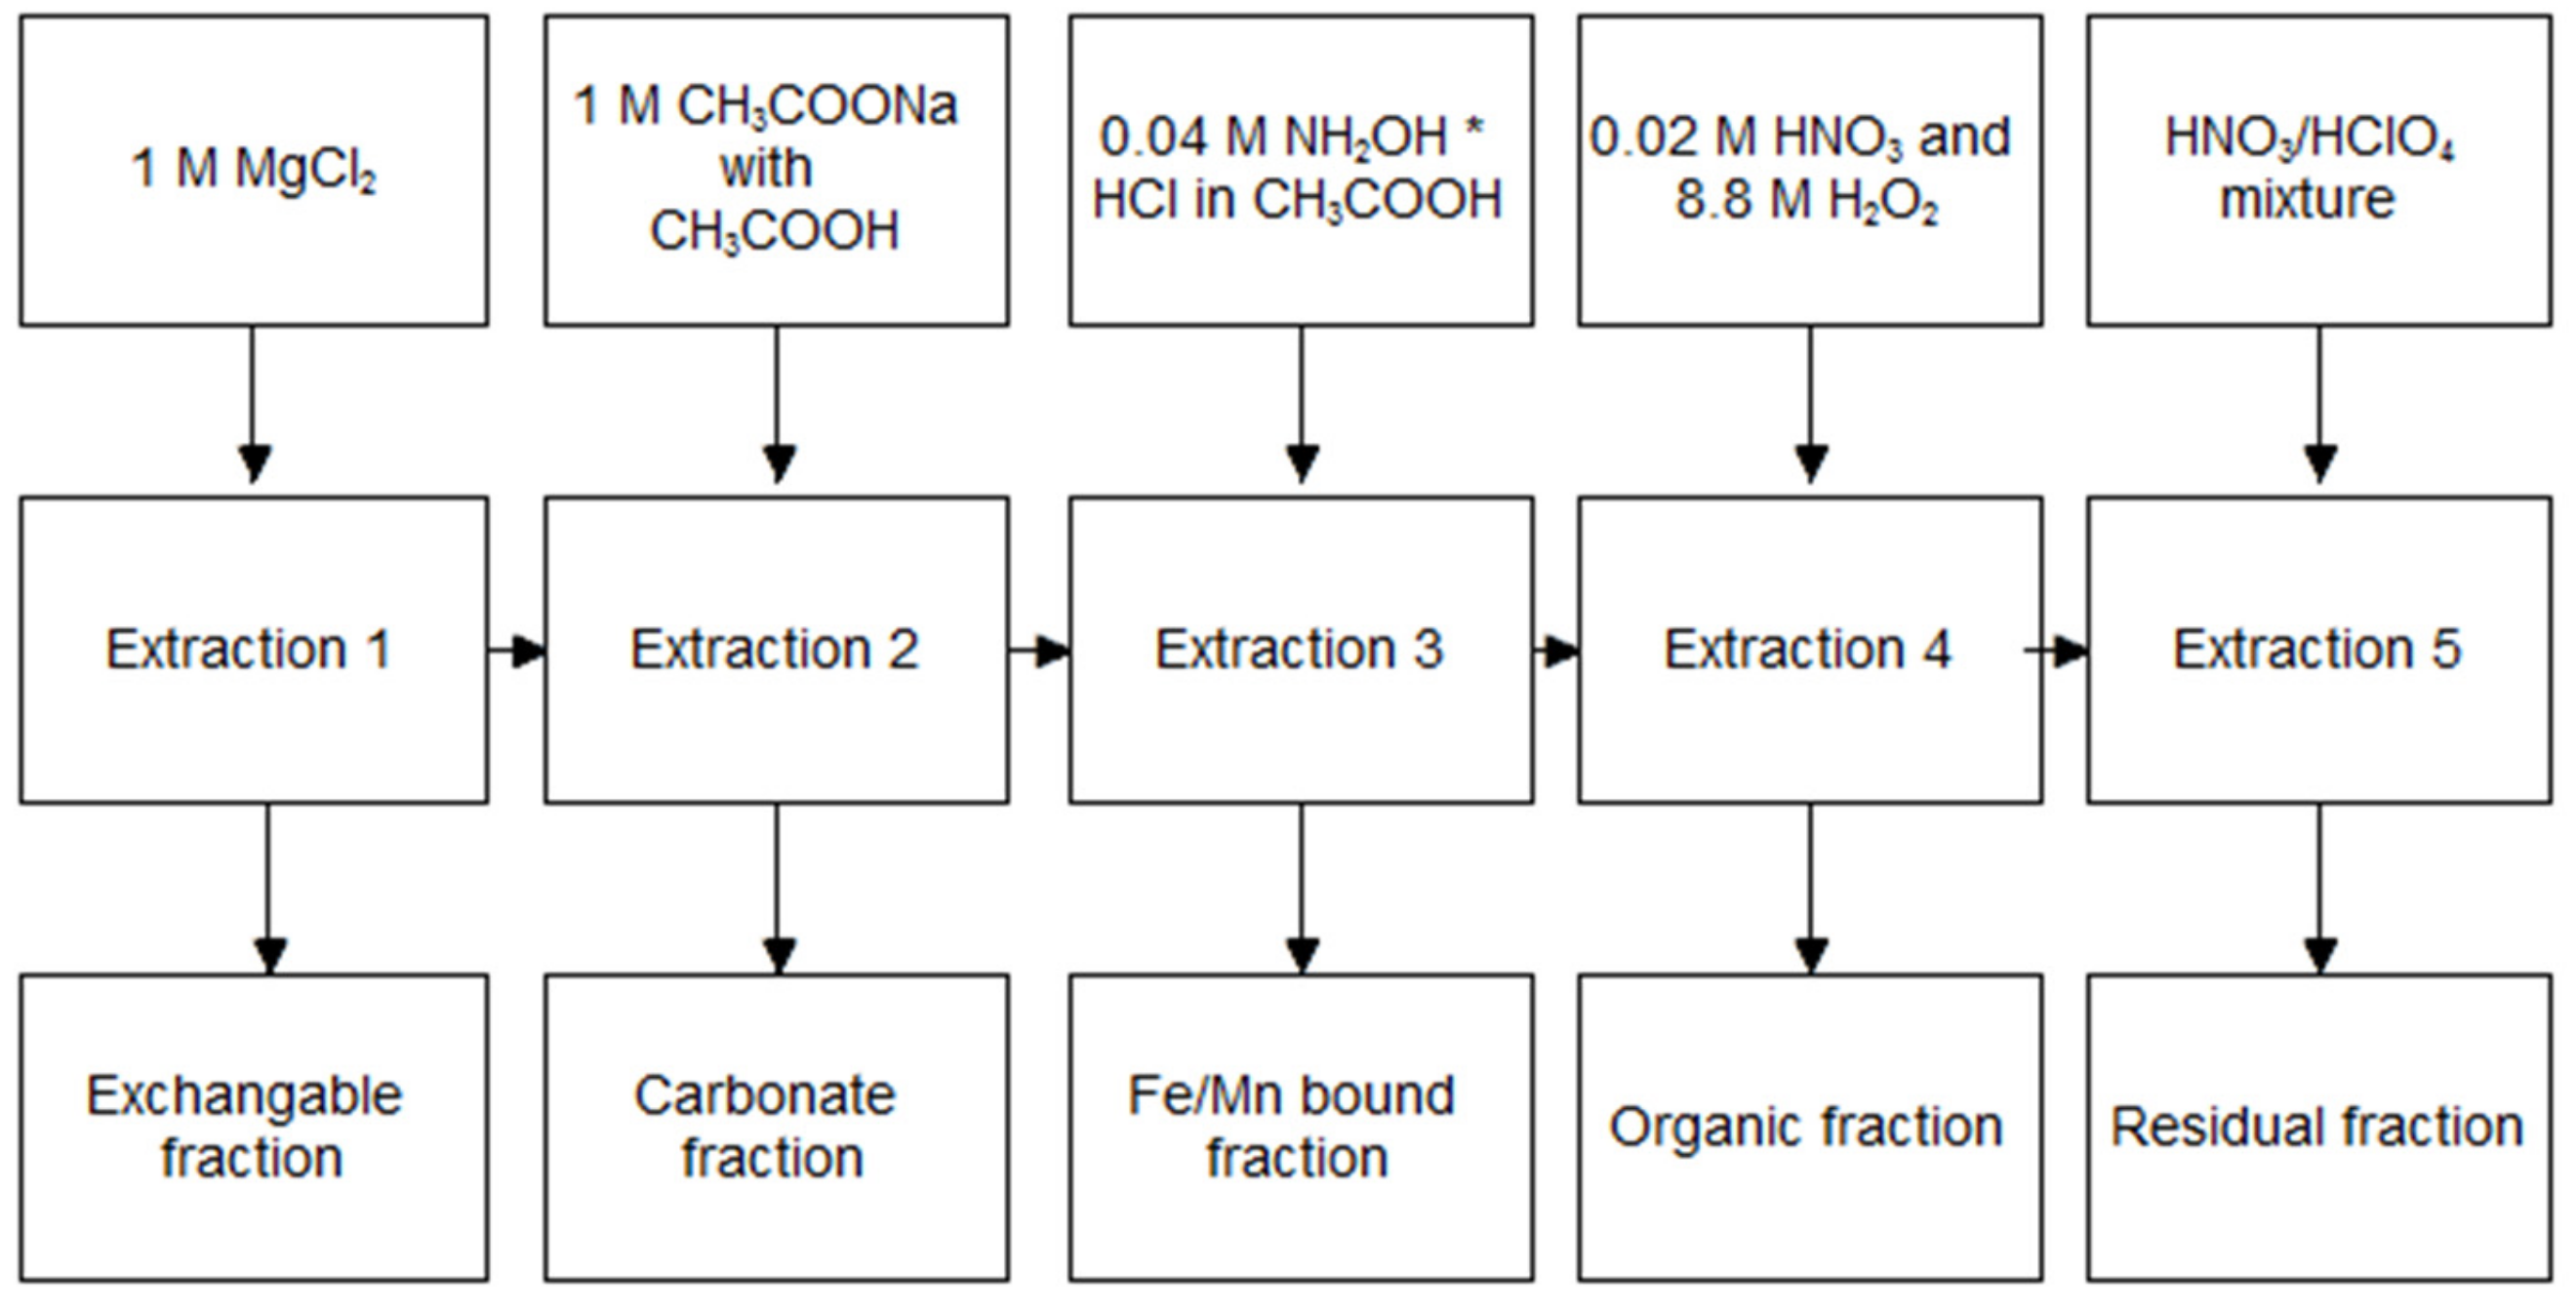
2.3. TM Speciation by Tessier Method
2.4. Extraction Kinetics
3. Results
3.1. Raw Sediment Fraction Analysis
3.2. TM Speciation in Raw Sediment
3.3. EDTA Sequential Extraction
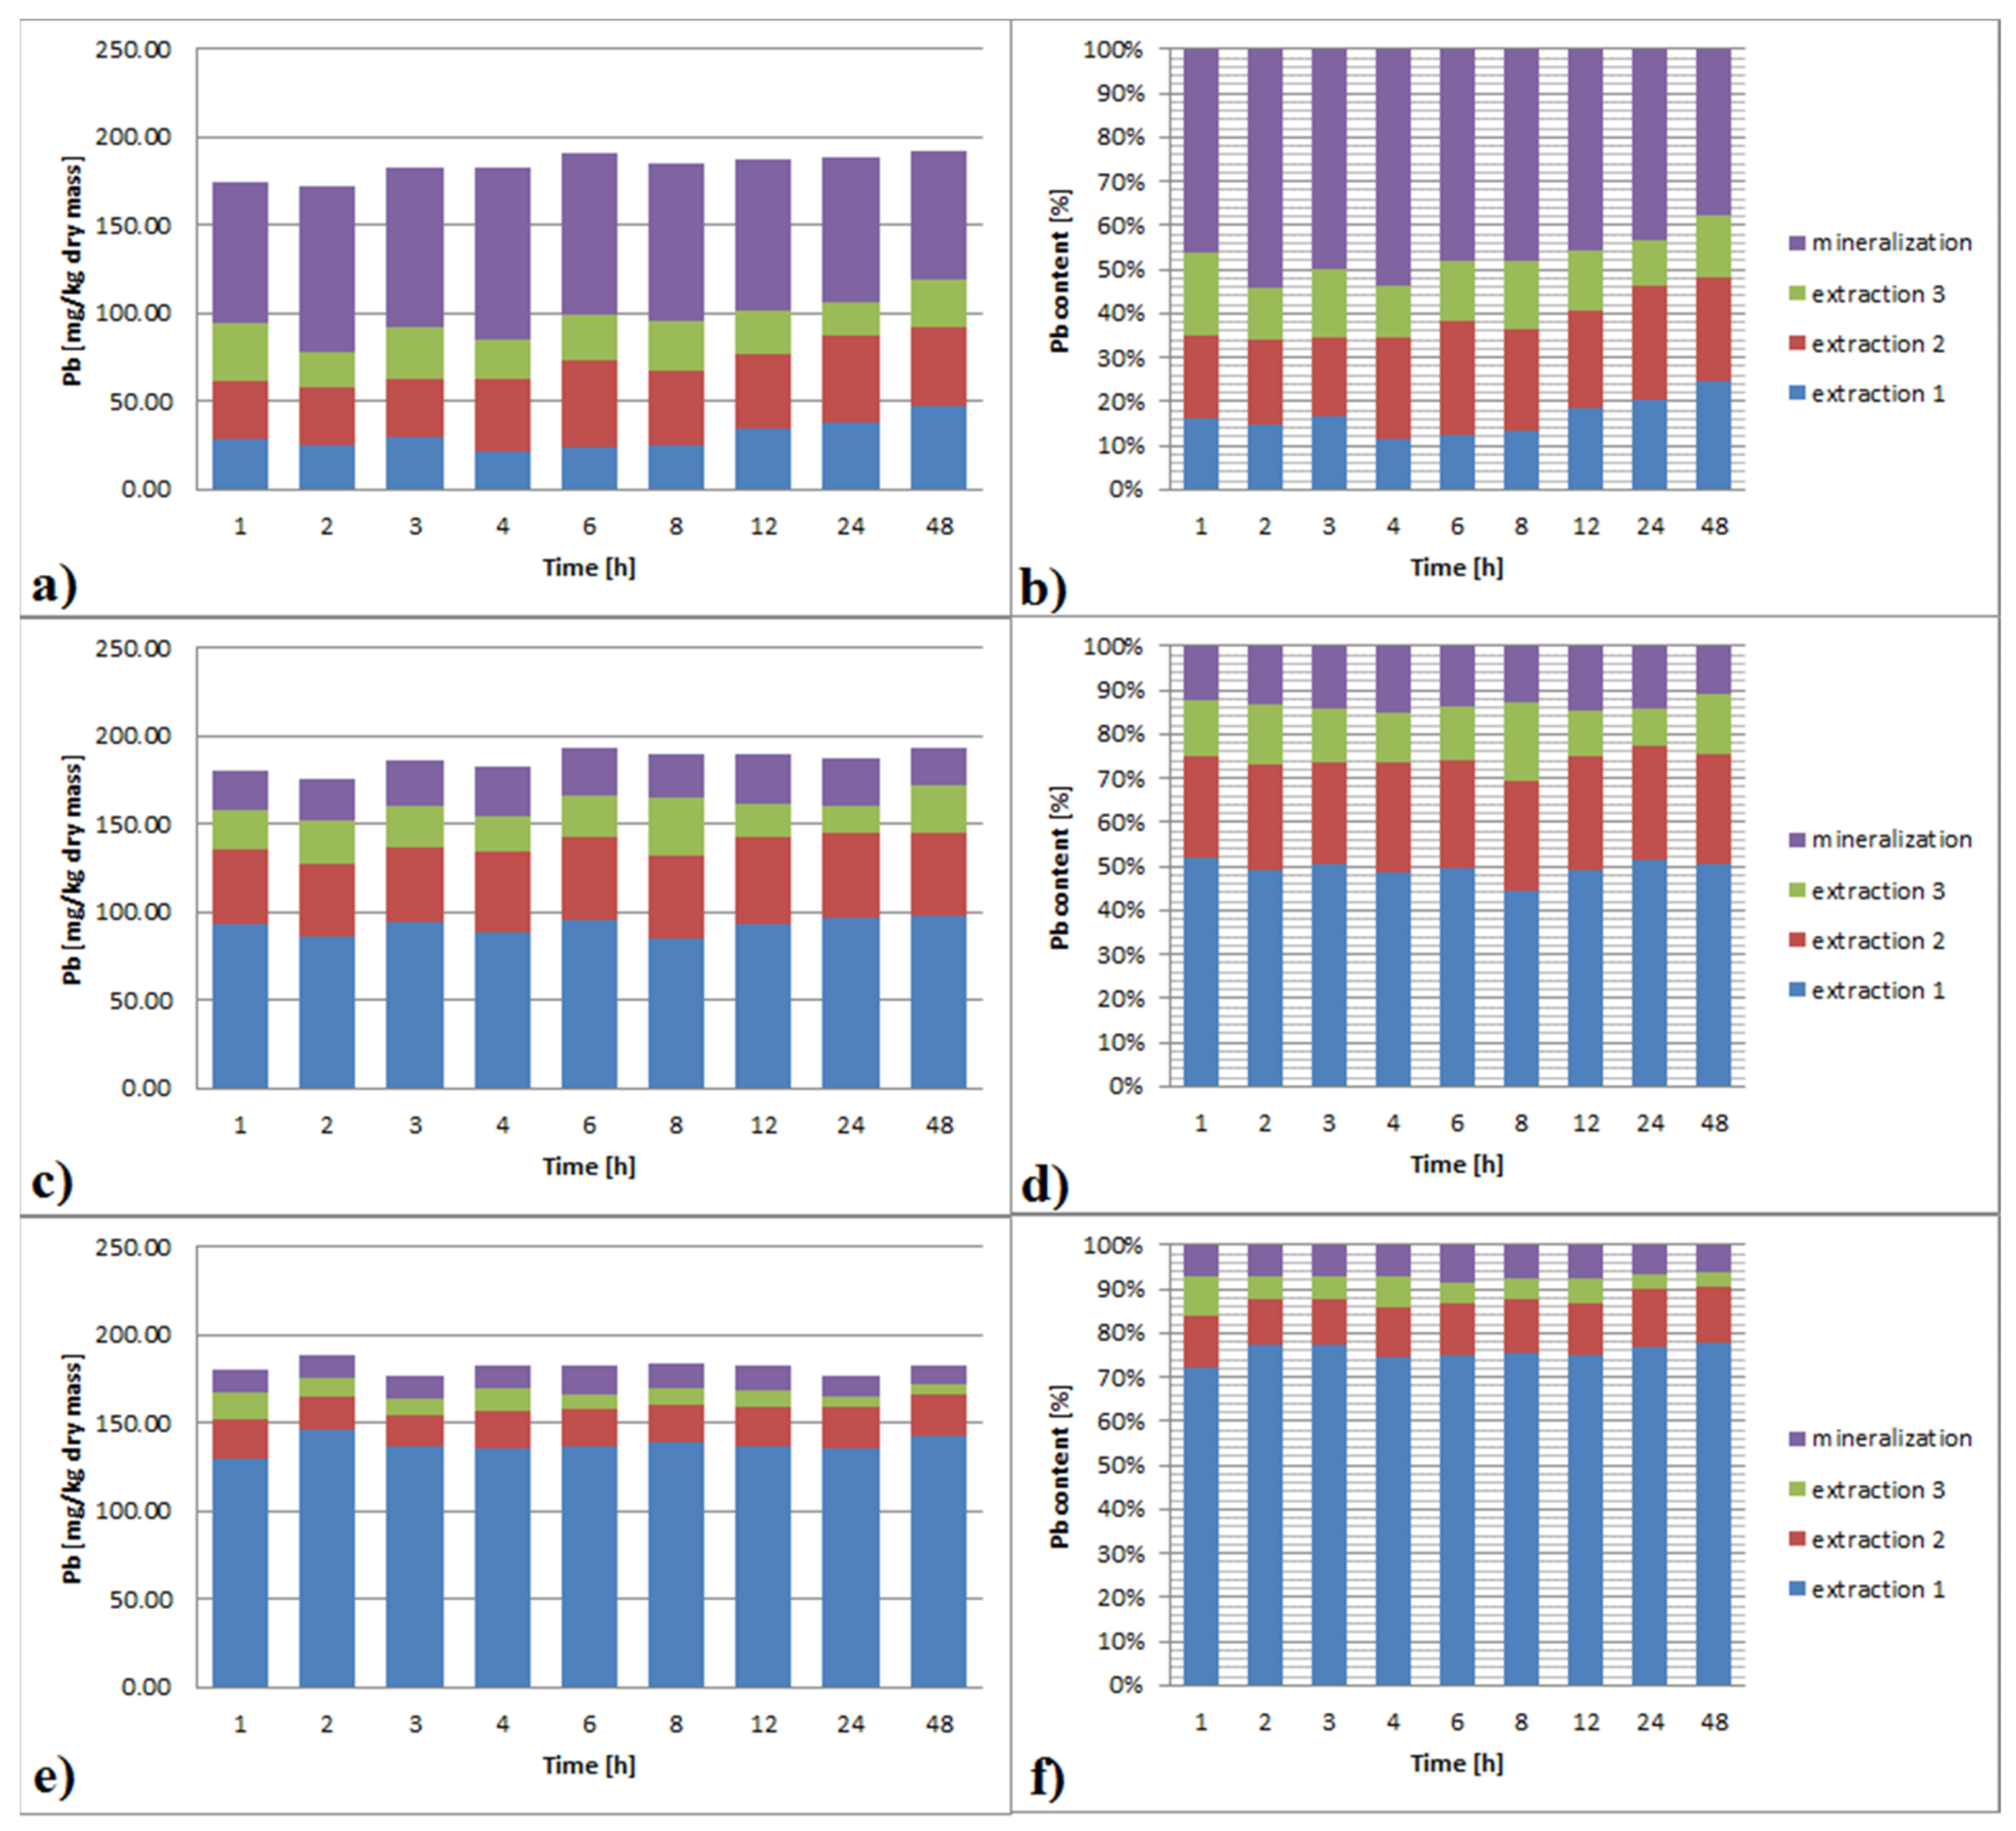
3.3.1. Lead
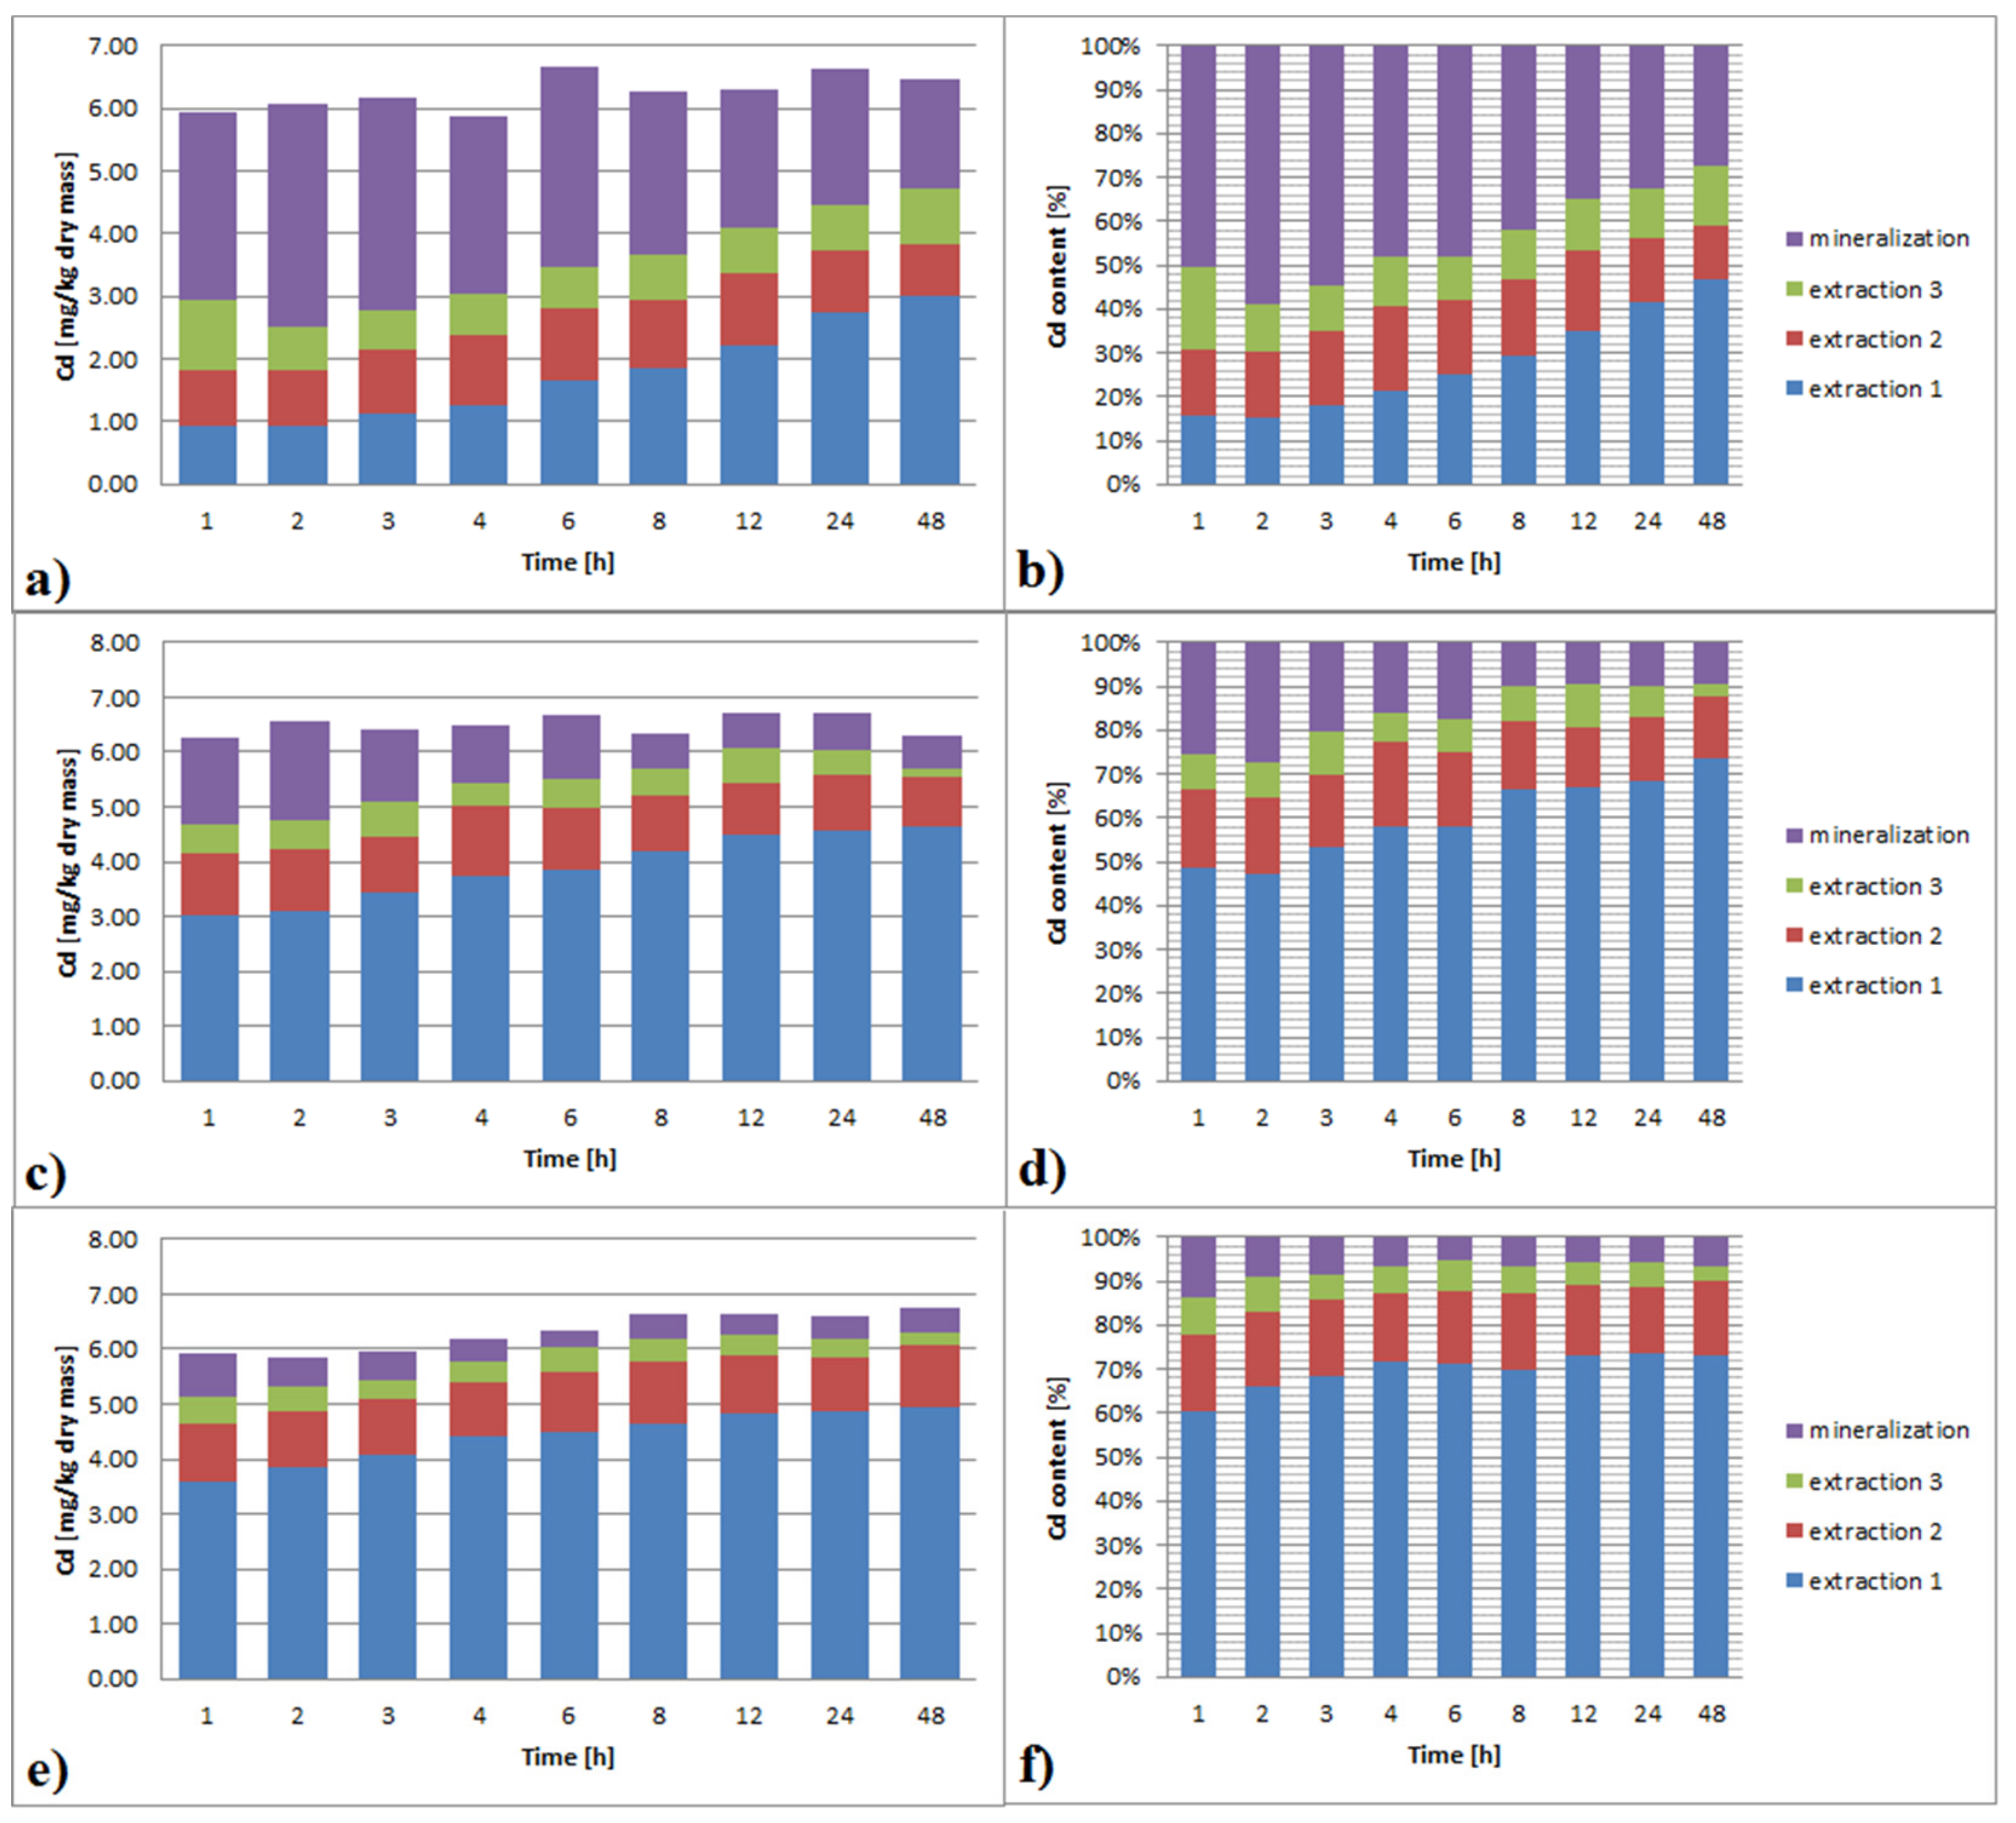
3.3.2. Cadmium
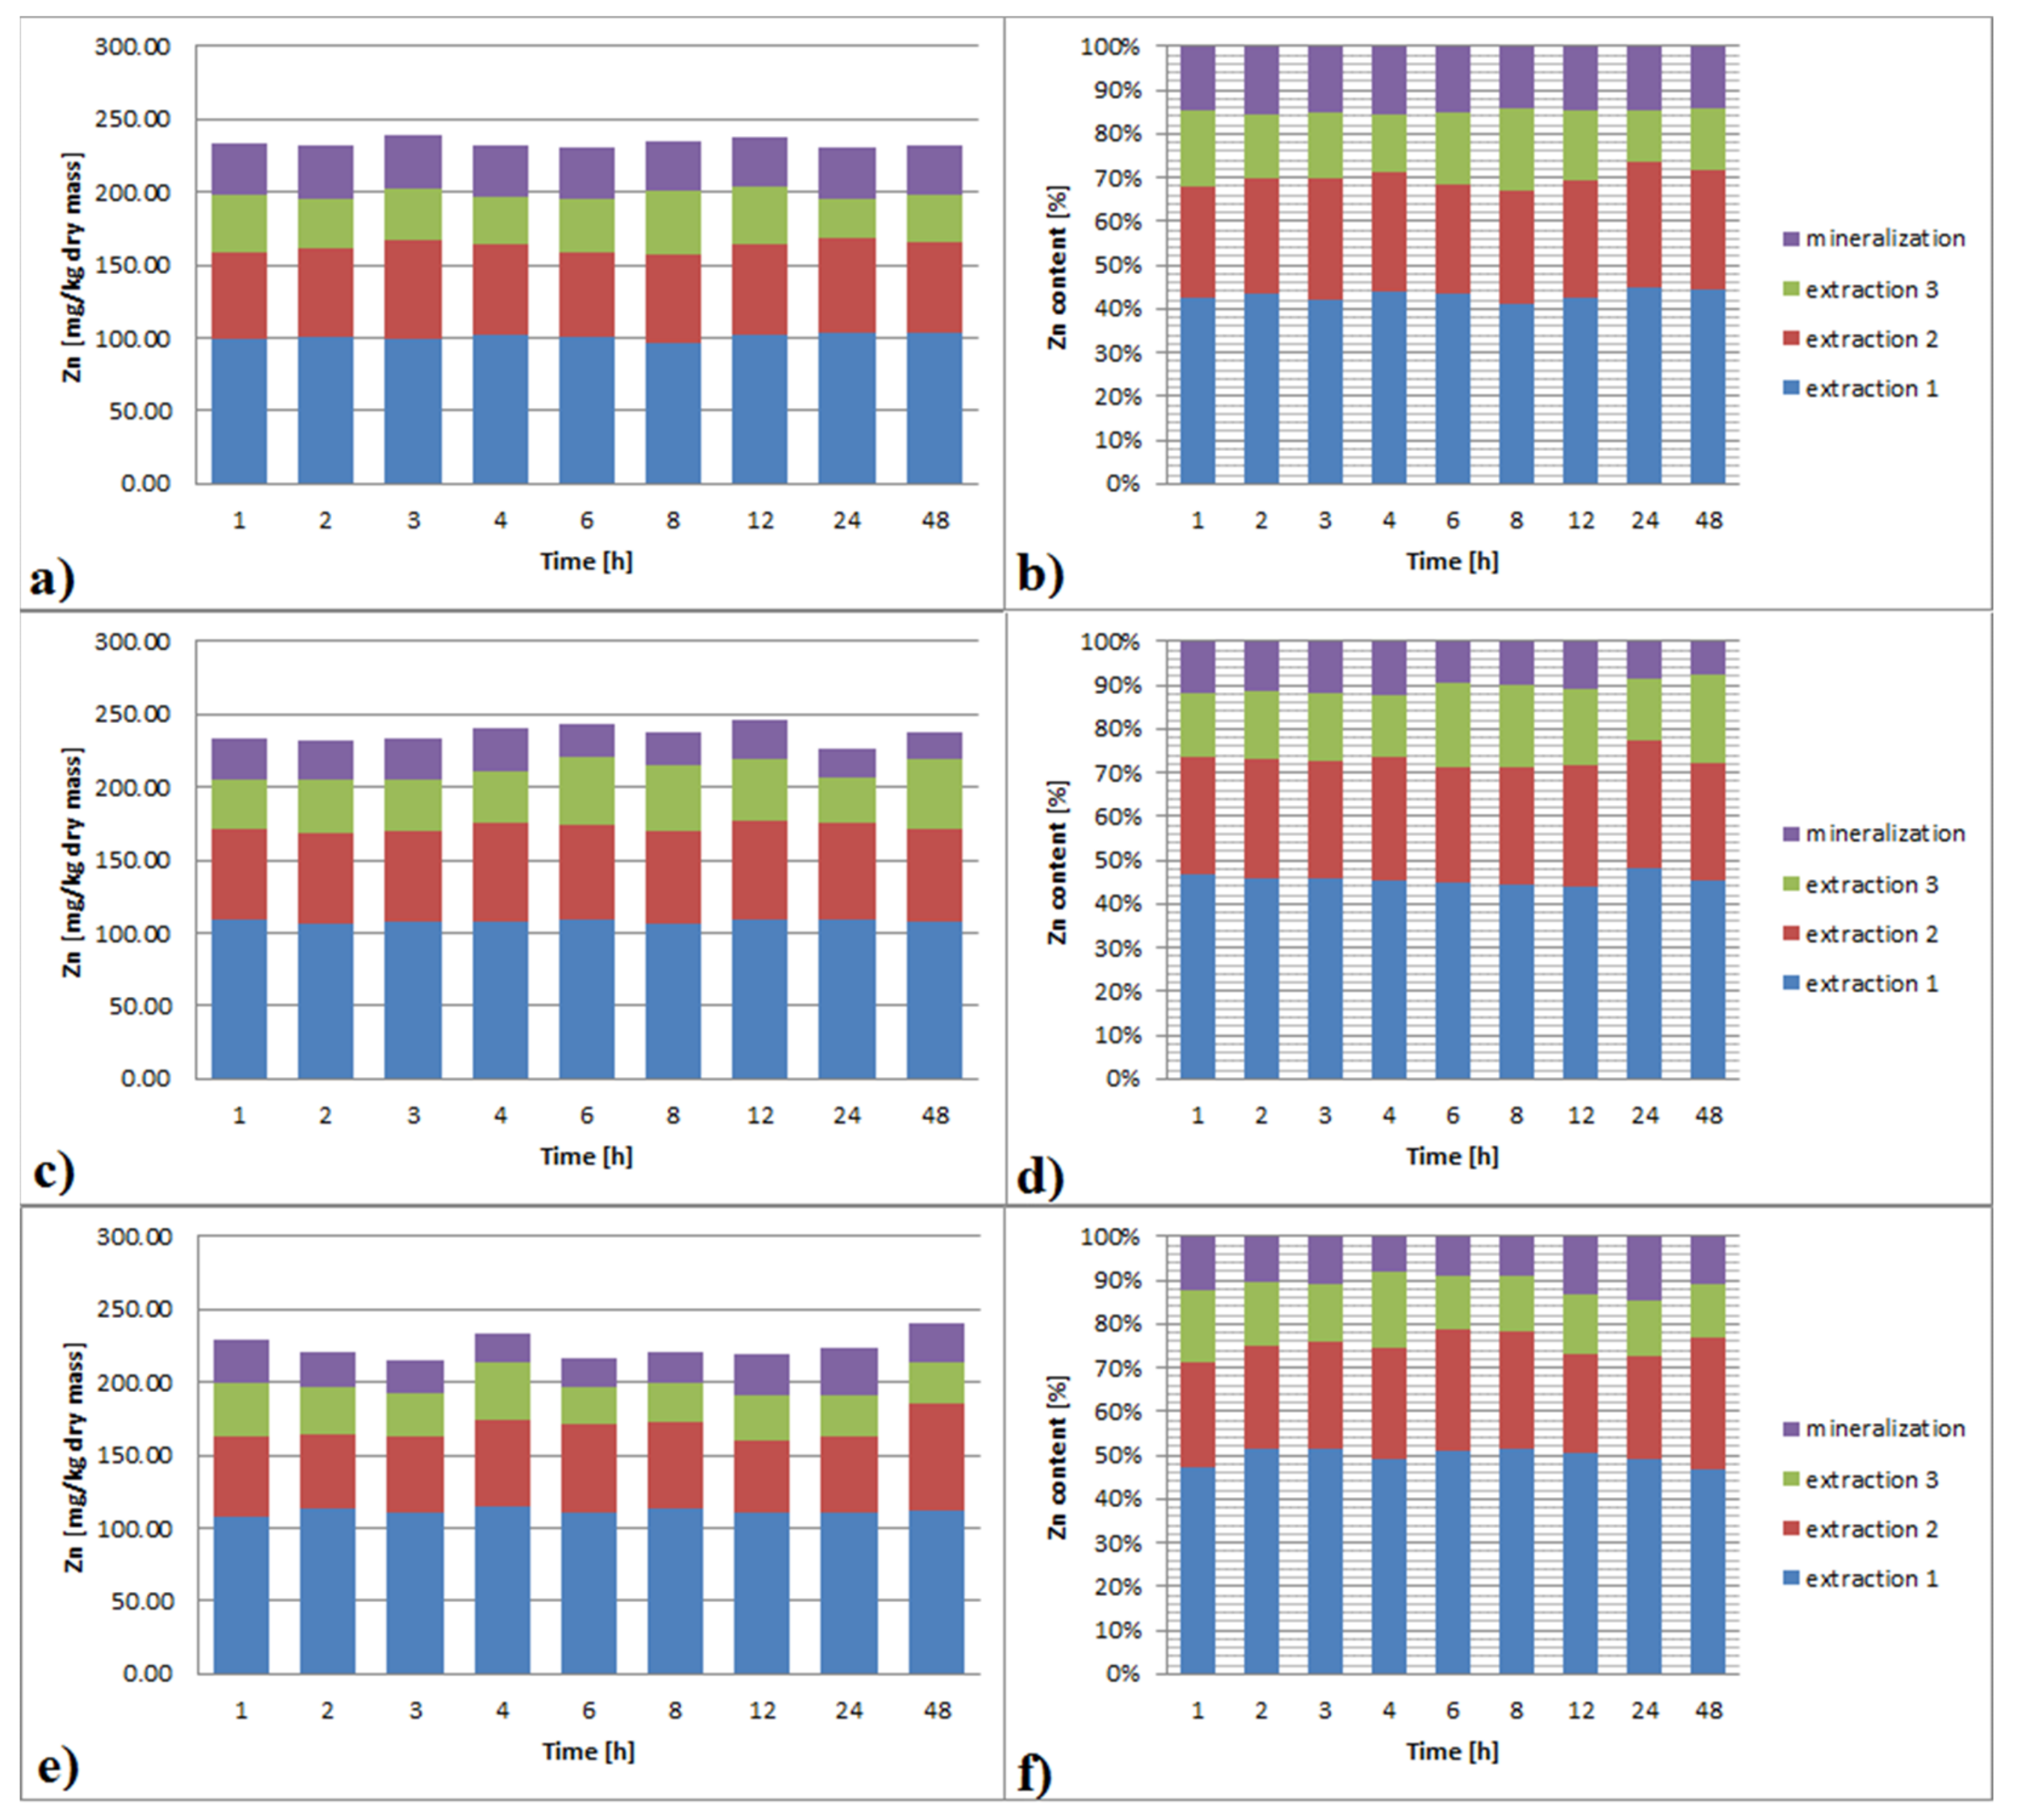
3.3.3. Zinc
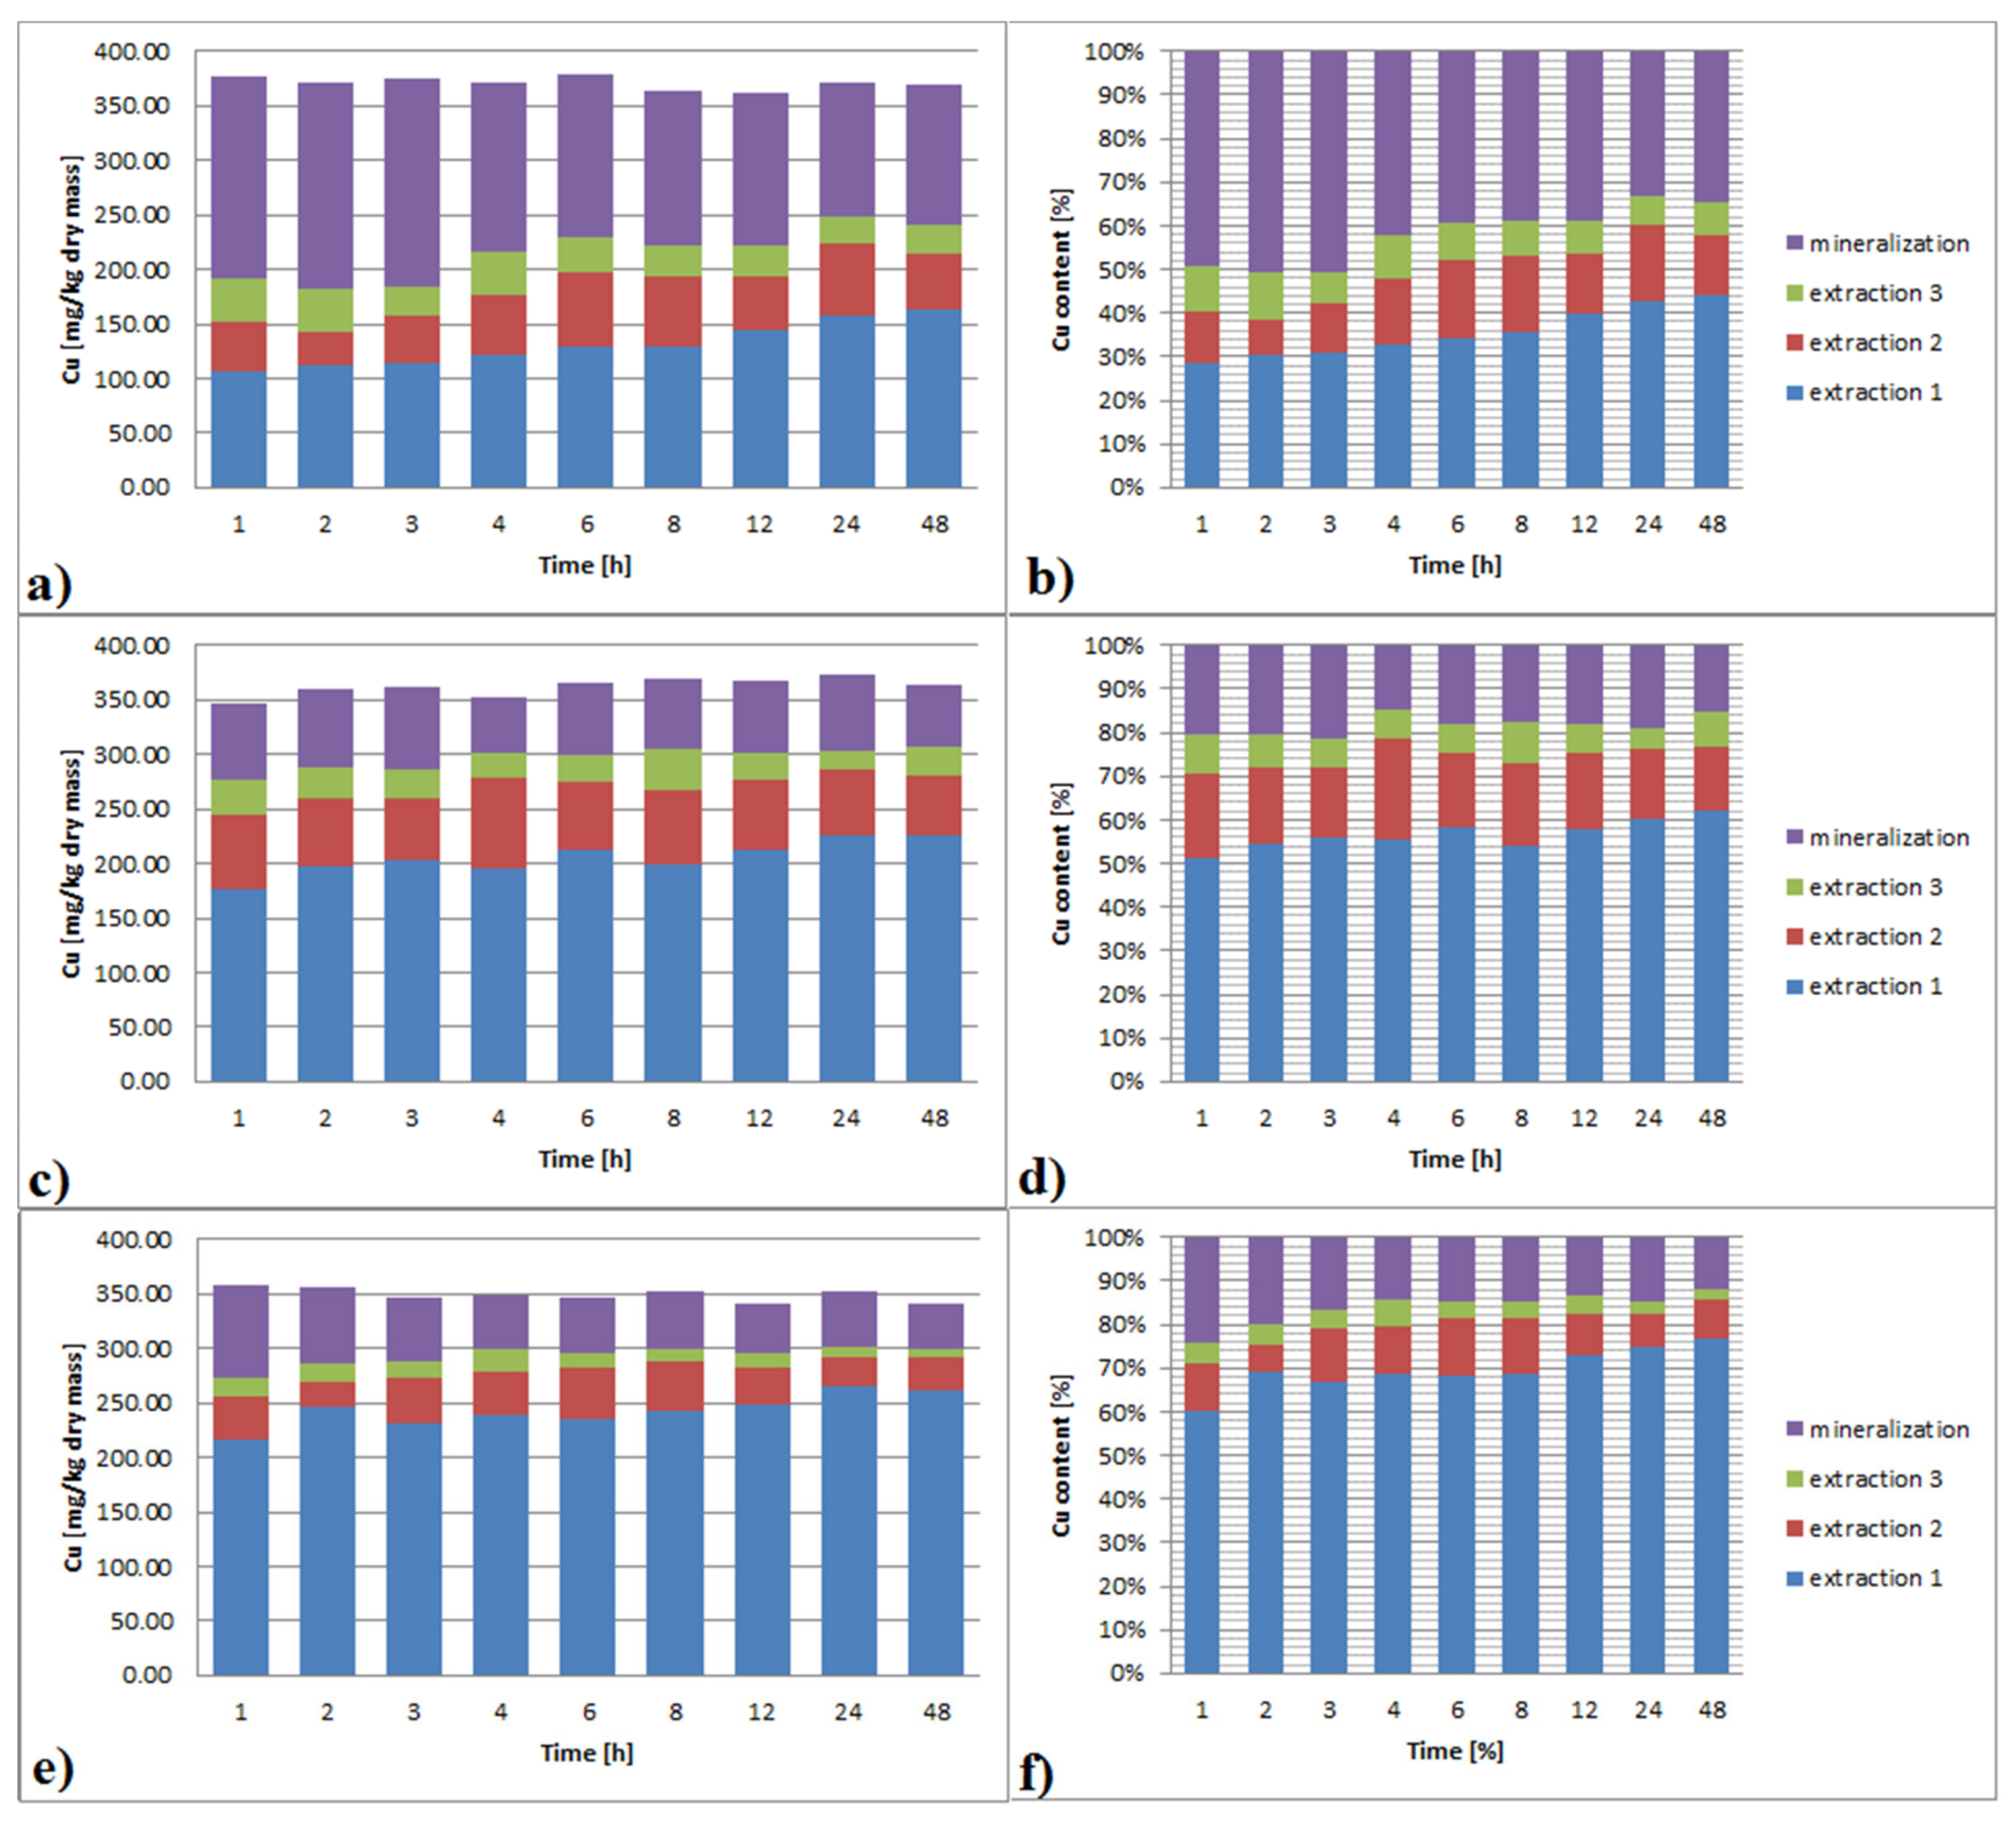
3.3.4. Copper
3.4. Lability Determination
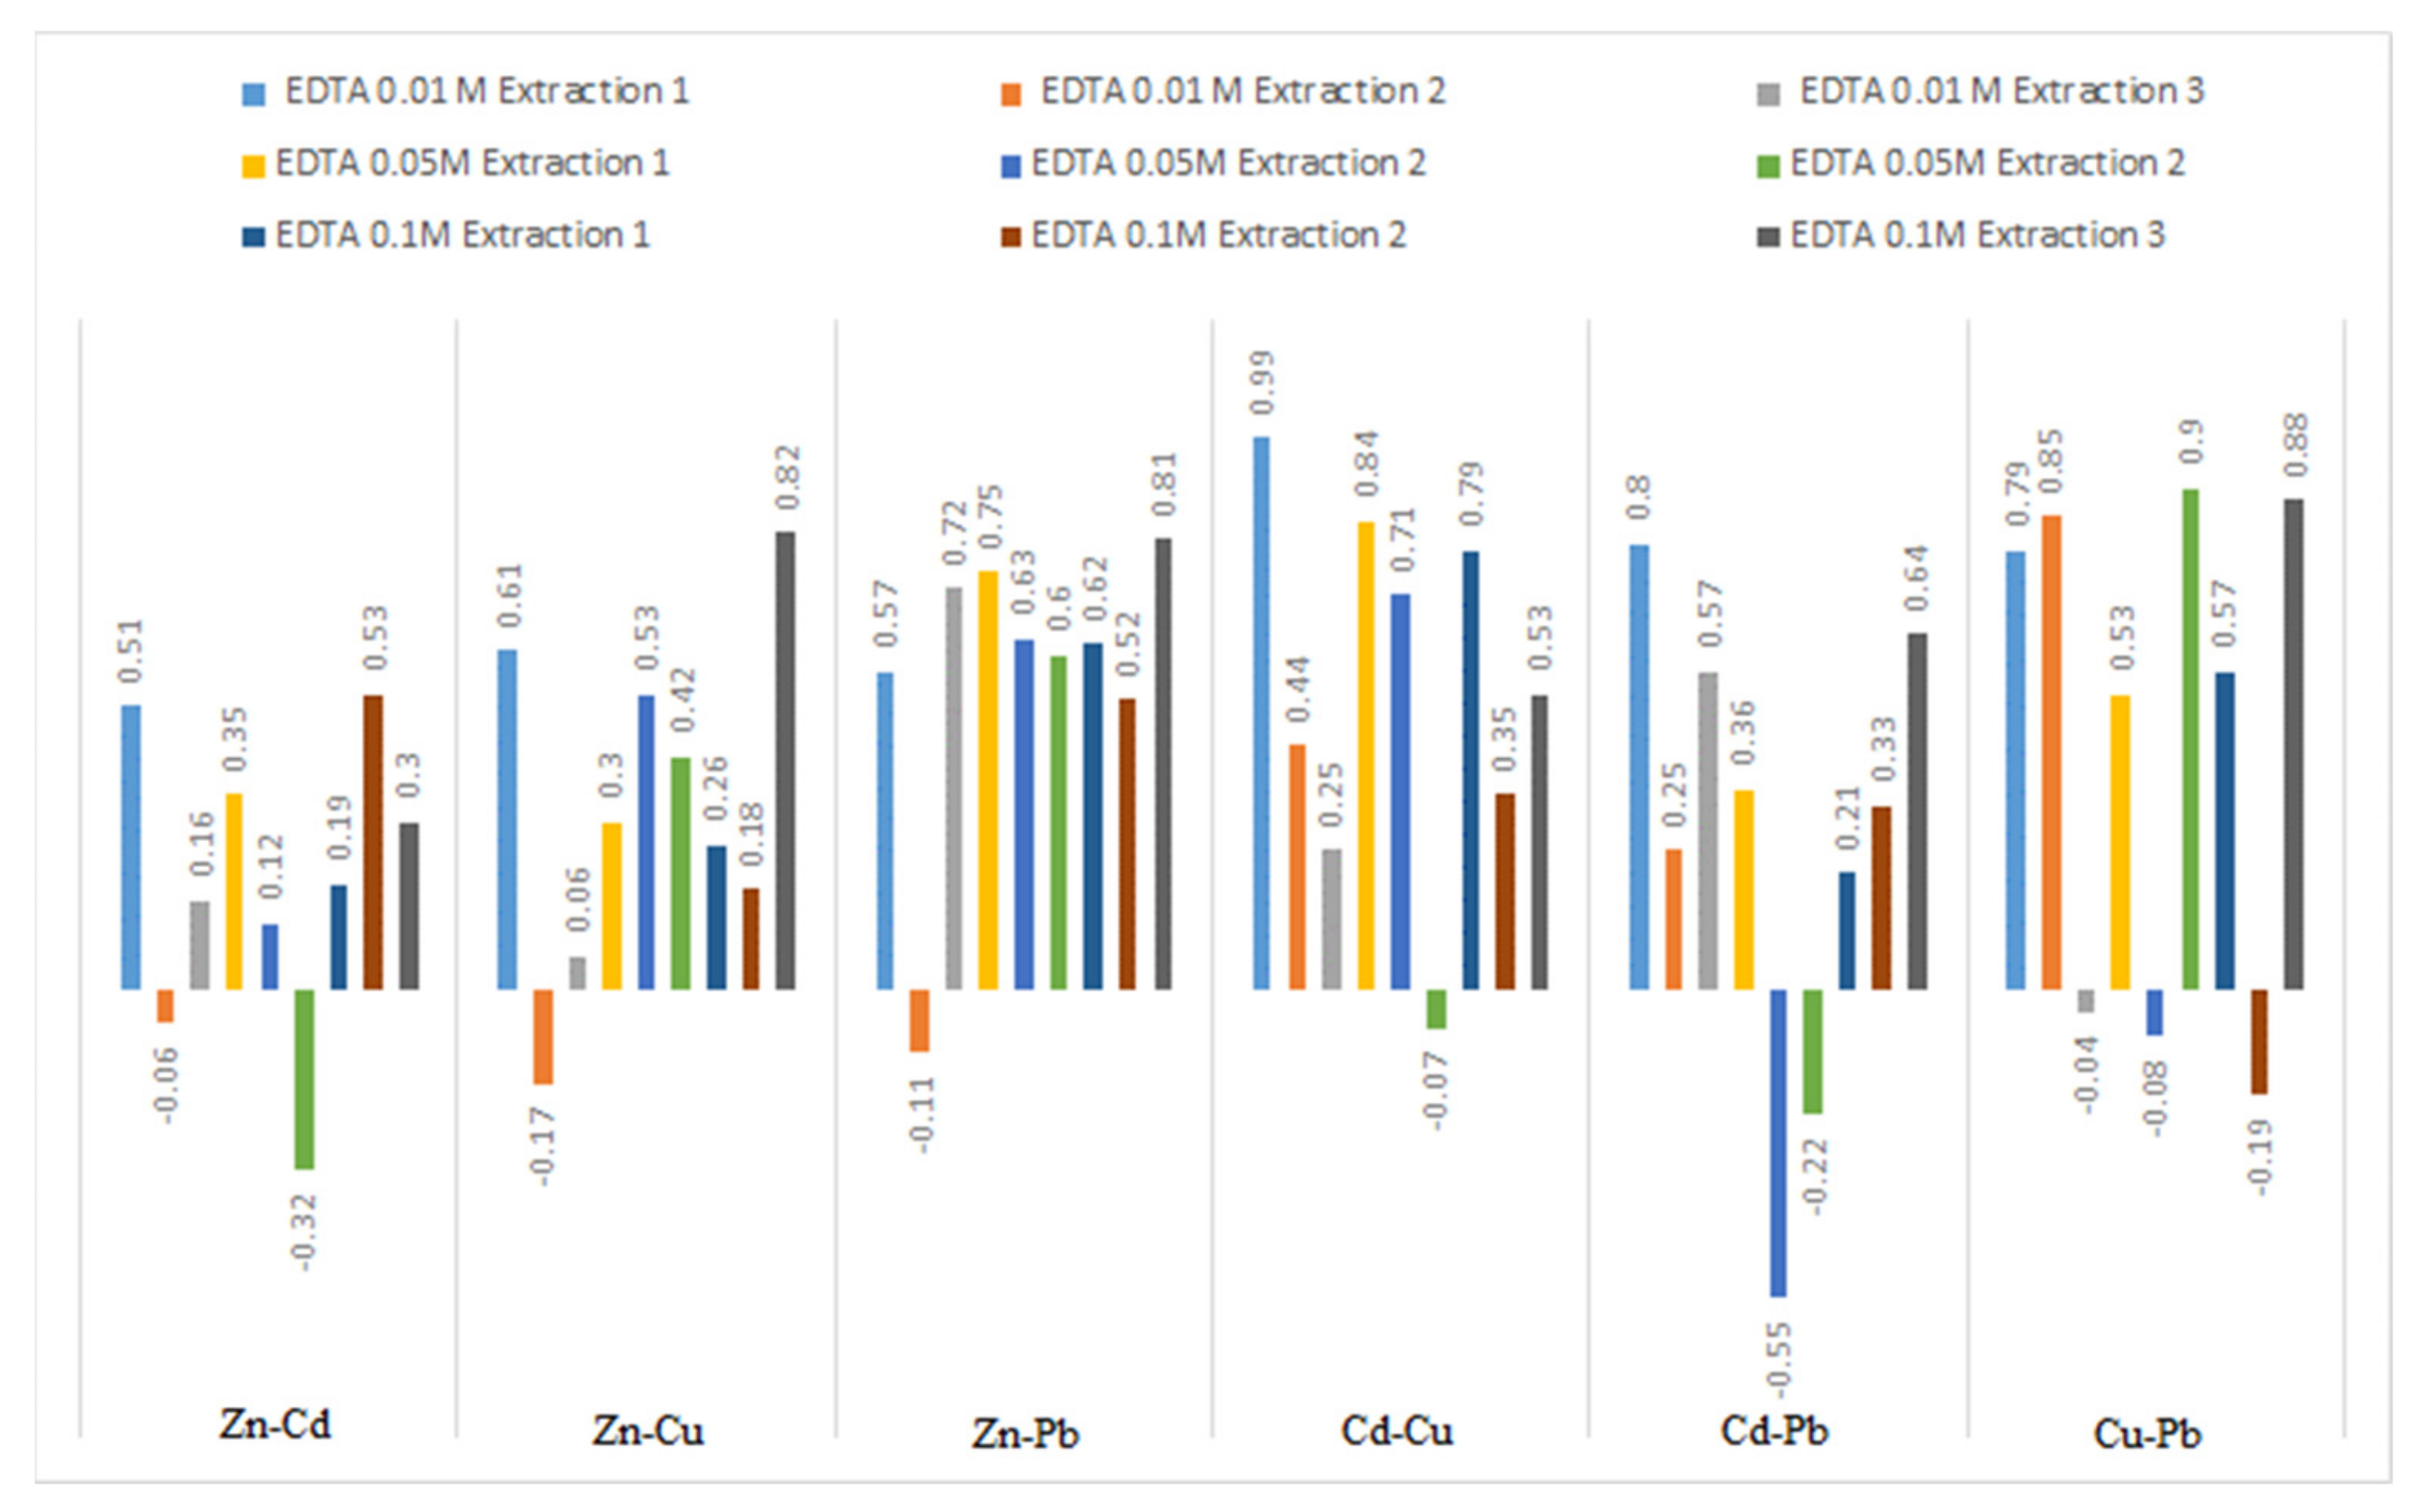
3.5. Extraction Correlations
3.6. Speciation of Metals in Sediment after EDTA Extraction
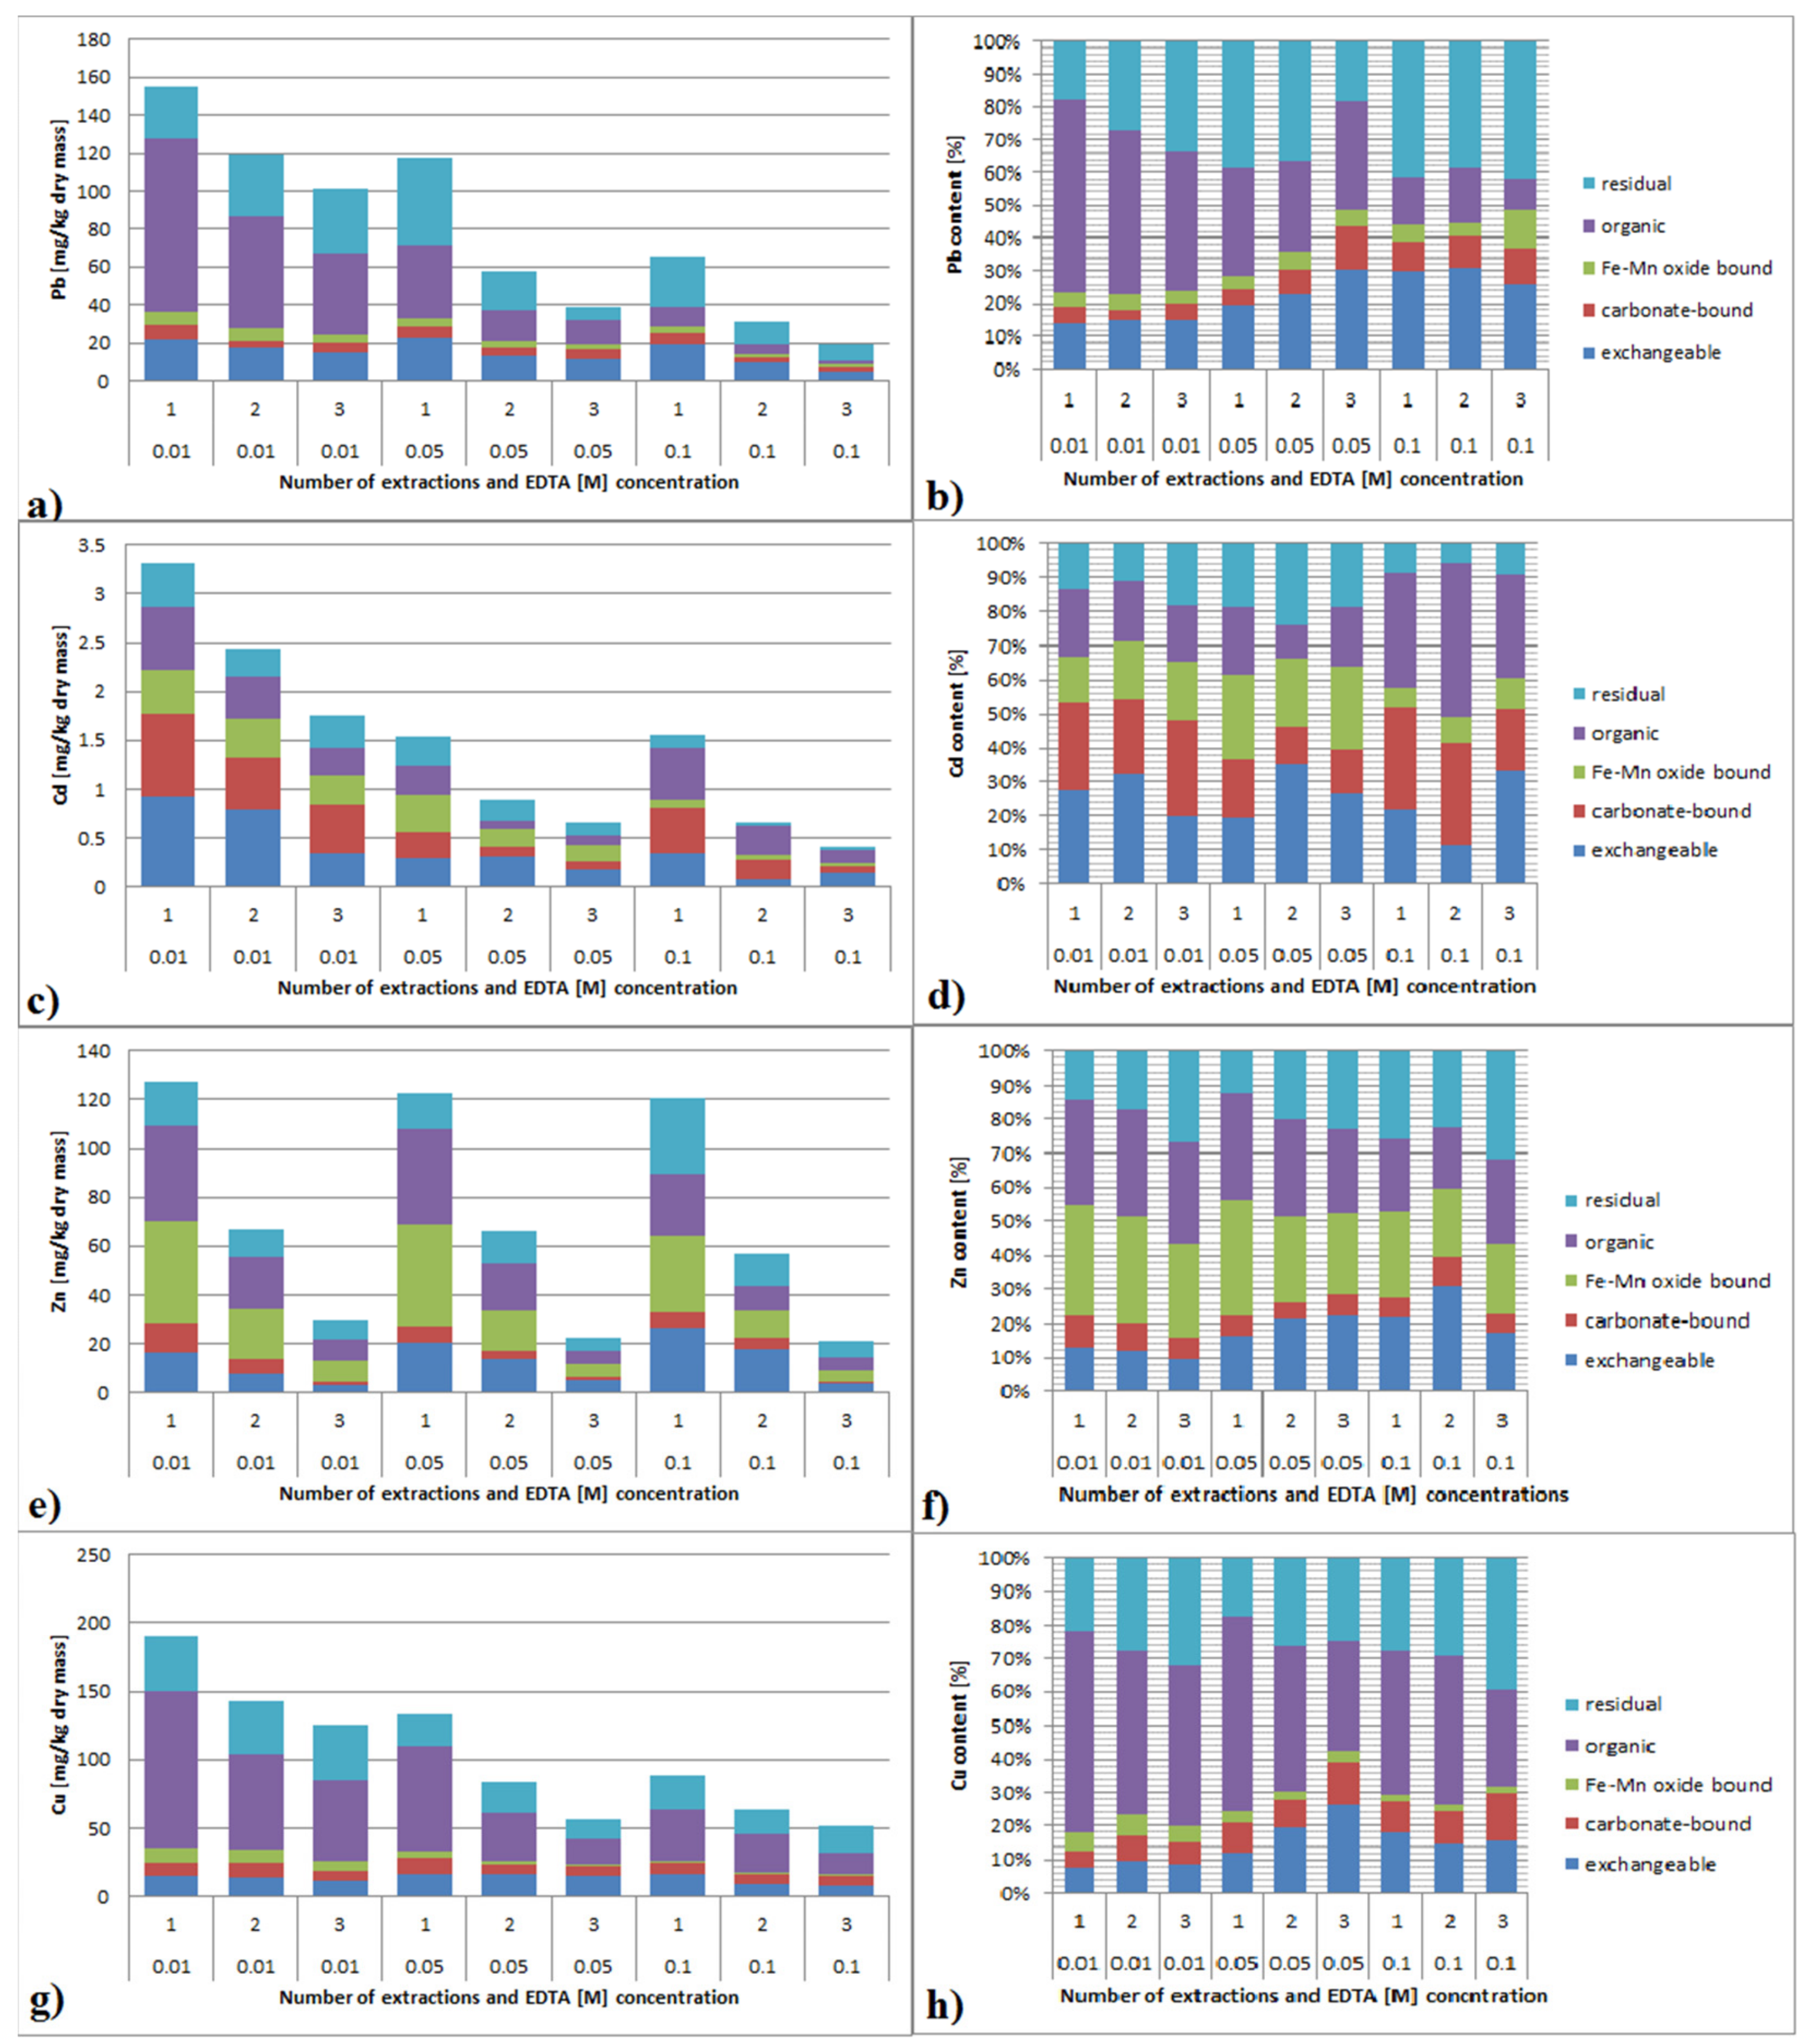
3.6.1. Lead
3.6.2. Cadmium
3.6.3. Zinc
3.6.4. Copper
4. Discussion
5. Conclusions
Author Contributions
Funding
Institutional Review Board Statement
Informed Consent Statement
Data Availability Statement
Conflicts of Interest
References
- Yu, H.; Hou, J.; Dang, Q.; Cui, D.; Xi, B.; Tan, W. Decrease in bioavailability of soil heavy metals caused by the presence of microplastics varies across aggregate levels. J. Hazard. Mater. 2020, 395, 122690. [Google Scholar] [CrossRef]
- Ma, L.; Xiao, T.; Ning, Z.; Liu, Y.; Chen, H.; Peng, J. Pollution and health risk assessment of toxic metal(loid)s in soils under different land use in sulphide mineralized areas. Sci. Total Environ. 2020, 724, 138176. [Google Scholar] [CrossRef]
- Kelepertzis, E.; Argyraki, A.; Chrastny, V.; Botsou, F.; Skordas, K.; Komarek, M.; Fouskas, A. Metal(loid) and isotopic tracing of Pb in soils, road and house dusts from the industrial area of Volos (central Greece). Sci. Total Environ. 2020, 725, 138300. [Google Scholar] [CrossRef]
- Sun, B.; Zhao, F.J.; Lombi, E.; McGrath, S.P. Leaching of heavy metals from contaminated soils using EDTA. Environ. Pollut. 2001, 113, 111–120. [Google Scholar] [CrossRef]
- Galunin, E.; Ferreti, J.; Zapelini, I.; Vieira, I.; Teixeira Tarley, C.R.; Abrao, T.; Santos, M.J. Cadmium mobility in sediments and soils from a coal mining area on Tibagi River watershed: Environmental risk assessment. J. Hazard. Mater. 2014, 265, 280–287. [Google Scholar] [CrossRef]
- Zhu, H.; Chen, L.; Xing, W.; Ran, S.; Wei, Z.; Amee, M.; Wassie, M.; Niu, H.; Tang, D.; Sun, J.; et al. Phytohormones-induced senescence efficiently promotes the transport of cadmium from roots into shoots of plants: A novel strategy for strengthening of phytoremediation. J. Hazard. Mater. 2020, 388, 122080. [Google Scholar] [CrossRef]
- Xu, D.M.; Fu, R.B.; Wang, J.X.; Shi, Y.X.; Guo, X.P. Chemical stabilization remediation for heavy metals in contaminated soils on the latest decade: Available stabilizing materials and associated evaluation methods-a critical review. J. Clean. Prod. 2021, 321, 128730. [Google Scholar] [CrossRef]
- Uddin, M.K. A review on the adsorption of heavy metals by clay minerals, with special focus on the past decade. Chem. Eng. J. 2017, 308, 438–462. [Google Scholar] [CrossRef]
- Chen, H.; Xu, J.; Tan, W.; Fang, L. Lead binding to wild metal-resistant bacteria analyzed by ITC and XAFS spectroscopy. Environ. Pollut. 2019, 250, 118–126. [Google Scholar] [CrossRef]
- Vega, F.A.; Weng, L. Speciation of heavy metals in River Rhine. Water Res. 2013, 47, 363–372. [Google Scholar] [CrossRef]
- Jiang, B.; Ma, Y.; Zhu, G.; Li, J. Prediction of soil copper phytotoxicity to barley root elongation by an EDTA extraction method. J. Hazard. Mater. 2020, 389, 121869. [Google Scholar] [CrossRef]
- Wojtkowska, M.; Bogacki, J. Use of Speciation Analysis for Monitoring Heavy Metals in the Bottom Sediments of the Utrata River. Ochr. Srodowiska 2012, 34, 43–46. [Google Scholar]
- Arain, M.B.; Kazi, T.G.; Jamali, M.K.; Jalbani, N.; Afridi, H.I.; Baig, J.A. Speciation of heavy metals in sediment by conventional, ultrasound and microwave assisted single extraction methods: A comparison with modified sequential extraction procedure. J. Hazard. Mater. 2008, 154, 998–1006. [Google Scholar] [CrossRef]
- Kot, A.; Namiesńik, J. The role of speciation in analytical chemistry. Trends Analyt Chem. 2000, 19, 69–79. [Google Scholar] [CrossRef]
- Labanowski, J.; Monna, F.; Bermond, A.; Cambier, P.; Fernandez, C.; Lamy, I.; van Oort, F. Kinetic extractions to assess mobilization of Zn, Pb, Cu, and Cd in a metal-contaminated soil: EDTA vs. citrate. Environ. Pollut. 2008, 152, 693–701. [Google Scholar] [CrossRef] [PubMed]
- Peng, J.; Song, Y.; Yuan, P.; Cui, X.; Qiu, G. The remediation of heavy metals contaminated sediment. J. Hazard. Mater. 2009, 161, 633–640. [Google Scholar] [CrossRef] [PubMed]
- Alonso Castillo, M.L.; Vereda Alonso, E.; Siles Cordero, M.T.; Cano Pavón, J.M.; García de Torres, A. Fractionation of heavy metals in sediment by using microwave assisted sequential extraction procedure and determination by inductively coupled plasma mass spectrometry. Microchem. J. 2011, 98, 234–239. [Google Scholar] [CrossRef]
- Brady, J.P.; Kinaev, I.; Goonetilleke, A.; Ayoko, G.A. Comparison of partial extraction reagents for assessing potential bioavailability of heavy metals in sediments. Mar. Pollut. Bull. 2016, 106, 329–334. [Google Scholar] [CrossRef]
- Hasan, M.; Kausar, D.; Akhter, G.; Shah, M.H. Evaluation of the mobility and pollution index of selected essential/toxic metals in paddy soil by sequential extraction method. Ecotoxicol. Environ. Saf. 2018, 147, 283–291. [Google Scholar] [CrossRef] [PubMed]
- Horváth, M.; Halász, G.; Kucanová, E.; Kuciková, B.; Fekete, I.; Remeteiová, D.; Heltai, G.; Flórián, K. Sequential extraction studies on aquatic sediment and biofilm samples for the assessment of heavy metal mobility. Microchem. J. 2013, 107, 121–125. [Google Scholar] [CrossRef]
- Schintu, M.; Marrucci, A.; Marras, G.F.; Buosi, C.; Ibba, A.; Cherchi, A. Heavy metal accumulation in surface sediments at the port of Cagliari (Sardinia, western Mediterranean): Environmental assessment using sequential extractions and benthic foraminifera. Mar. Pollut. Bull. 2016, 111, 45–56. [Google Scholar] [CrossRef] [PubMed]
- Silveira, M.L.; Alleoni, L.R.F.; O’Connor, G.A.; Chang, A.C. Heavy metal sequential extraction methods—A modification for tropical soils. Chemosphere 2006, 64, 1929–1938. [Google Scholar] [CrossRef]
- Song, Z.; Dong, L.; Shan, B.; Tang, W. Assessment of potential bioavailability of heavy metals in the sediments of land-freshwater interfaces by diffusive gradients in thin films. Chemosphere 2018, 191, 218–225. [Google Scholar] [CrossRef]
- Liu, L.; Li, W.; Song, W.; Guo, M. Remediation techniques for heavy metal-contaminated soils: Principles and applicability. Sci. Total Environ. 2018, 633, 206–219. [Google Scholar] [CrossRef]
- Yoo, J.-C.; Lee, C.-D.; Yang, J.-S.; Baek, K. Extraction characteristics of heavy metals from marine sediments. Chem. Eng. J. 2013, 228, 688–699. [Google Scholar] [CrossRef]
- Dermont, G.; Bergeron, M.; Mercier, G.; Richer-Lafleche, M. Soil washing for metal removal: A review of physical/chemical technologies and field applications. J. Hazard. Mater. 2008, 152, 1–31. [Google Scholar] [CrossRef]
- Peters, R.W. Chelant extraction of heavy metals from contaminated soils. J. Hazard. Mater. 2009, 66, 151–210. [Google Scholar] [CrossRef]
- Moutsatsou, A.; Gregou, M.; Matsas, D.; Protonotarios, V. Washing as a remediation technology applicable in soils heavily polluted by mining–metallurgical activities. Chemosphere 2006, 63, 1632–1640. [Google Scholar] [CrossRef]
- Zou, Z.; Qiu, R.; Zhang, W.; Dong, H.; Zhao, Z.; Zhang, T.; Wei, X.; Cai, X. The study of operating variables in soil washing with EDTA. Environ. Pollut. 2009, 157, 229–236. [Google Scholar] [CrossRef]
- Finzgar, N.; Lestan, D. The two-phase leaching of Pb, Zn and Cd contaminated soil using EDTA. Chemosphere 2008, 73, 1484–1491. [Google Scholar] [CrossRef]
- Fangueiro, D.; Bermonda, A.; Santos, E.; Carapuça, H.; Duarte, A. Heavy metal mobility assessment in sediments based on a kinetic approach of the EDTA extraction: Search for optimal experimental conditions. Anal. Chim. Acta. 2002, 459, 245–256. [Google Scholar] [CrossRef]
- Pociecha, M.; Lestan, D. EDTA leaching of Cu contaminated soil using electrochemical treatment of the washing solution. J. Hazard. Mater. 2009, 165, 533–539. [Google Scholar] [CrossRef]
- Xia, W.; Gao, H.; Wang, X.; Zhou, C.; Liu, Y.; Fana, T.; Wang, X. Application of EDTA decontamination on soils affected by mining activities and impact of treatment on the geochemical partition of metal contaminants. J. Hazard. Mater. 2009, 164, 936–940. [Google Scholar] [CrossRef] [PubMed]
- Ortega, L.M.; Lebrunb, R.; Blaisc, J.-F.; Hauslerd, R.; Droguie, P. Effectiveness of soil washing, nanofiltration and electrochemical treatment for the recovery of metal ions coming from a contaminated soil. Water Res. 2008, 42, 1943–1952. [Google Scholar] [CrossRef]
- Zhang, W.; Huang, H.; Tan, F.; Wang, H.; Qiu, R. Influence of EDTA washing on the species and mobility of heavy metals residual in soils. J. Hazard. Mater. 2010, 173, 369–376. [Google Scholar] [CrossRef]
- Vanthuyne, M.; Maes, A. Metal speciation in sulphidic sediments: A new method based on oxidation kinetics modelling in the presence of EDTA. Sci. Total Environ. 2006, 367, 405–417. [Google Scholar] [CrossRef] [PubMed]
- Di Palma, L.; Mecozzi, R. Heavy metals mobilization from harbour sediments using EDTA and citric acid as chelating agents. J. Hazard. Mater. 2007, 147, 768–775. [Google Scholar] [CrossRef]
- Kim, E.J.; Jeon, E.-K.; Baek, K. Role of reducing agent in extraction of arsenic and heavy metals from soils by use of EDTA. Chemosphere 2016, 152, 274–283. [Google Scholar] [CrossRef]
- Shukla, M.; Baksi, B.; Mohanty, S.P.; Mahanty, B.; Mansi, A.; Rene, E.R.; Behera, S.K. Remediation of chromium contaminated soil by soil washing using EDTA and N-acetyl-L-cysteine as the chelating agents. Prog. Org. Coat. 2022, 165, 106704. [Google Scholar] [CrossRef]
- Wojtkowska, M.; Matula, M. Analysis of Heavy Metals in Selected Particular Granulometric Fractions of Bottom Sediments. Rocz. Ochr. Srodowiska. 2016, 18, 667–680. [Google Scholar]
- Tessier, A.; Cambell, P.G.C.; Bisson, M. Sequential extraction procedure for the spetiation of particulate trace metals. Anal. Chem. 1979, 51, 844–851. [Google Scholar] [CrossRef]
- Fangueiro, D.; Bermond, A.; Santos, E.; Carapuca, H.; Duarte, A. Kinetic approach to heavy metal mobilization assessment in sediments: Choose of kinetic equations and models to achieve maximum information. Talanta 2005, 66, 844–857. [Google Scholar] [CrossRef]
- Santos, S.; Costa, C.A.E.; Duarte, A.C.; Scherer, H.W.; Schneider, R.J.; Esteves, V.I.; Santos, E.B.H. Influence of different organic amendments on the potential availability of metals from soil: A study on metal fractionation and extraction kinetics by EDTA. Chemosphere 2010, 78, 389–396. [Google Scholar] [CrossRef]
- Li, Z.; Wu, L.; Luo, Y.; Christie, P. Changes in metal mobility assessed by EDTA kinetic extraction in three polluted soils after repeated phytoremediation using a cadmium/zinc hyperaccumulator. Chemosphere 2018, 194, 432–440. [Google Scholar] [CrossRef] [PubMed]
- Minister of the Environment. Regulation of the Minister of the Environment of 1 September 2016 on the method of assessing the Pollution of the Earth’s Surface. In Journal of Laws of 2016; Item 1395; Wydawnictwo Sejmowe: Warsaw, Poland, 2016. (In Polish) [Google Scholar]
- Gismera, M.J.; Lacal, J.; Silva, P.; García, R.; Sevilla, M.T.; Procopio, J.R. Study of metal fractionation in river sediments. A comparison between kinetic and sequential extraction procedures. Environ. Pollut. 2004, 127, 175–182. [Google Scholar] [CrossRef]
- McCready, S.; Birch, G.F.; Taylor, S.E. Extraction of heavy metals in Sydney Harbour sediments using 1M HCl and 0.05M EDTA and implications for sediment-quality guidelines. Aust. J. Earth Sci. 2003, 50, 249–255. [Google Scholar] [CrossRef]
- Guo, X.; Zhao, G.; Zhang, G.; He, Q.; Wei, Z.; Zheng, W.; Qian, T.; Wu, Q. Effect of mixed chelators of EDTA, GLDA, and citric acid on bioavailability of residual heavy metals in soils and soil properties. Chemosphere 2018, 209, 776–782. [Google Scholar] [CrossRef]
- Wang, Z.; Wang, H.; Wang, H.; Li, Q.; Li, Y. Effect of soil washing on heavy metal removal and soil quality: A two-sided coin. Ecotoxicol. Environ. Saf. 2020, 203, 110981. [Google Scholar] [CrossRef]
- Cheng, S.; Lin, Q.; Wang, Y.; Luo, H.; Huang, Z.; Fu, H.; Chen, H.; Xiao, R. The removal of Cu, Ni, and Zn in industrial soil by washing with EDTA-organic acids. Arab. J. Chem. 2020, 13, 5160–5170. [Google Scholar] [CrossRef]
- Ferrans, F.; Jani, Y.; Hogland, W. Chemical extraction of trace elements from dredged sediments into a circular economy perspective: Case study on Malmfjärden Bay, south-eastern Sweden. Resour. Environ. Sustain. 2021, 6, 100039. [Google Scholar] [CrossRef]
- Lumia, L.; Giustra, M.G.; Viviani, G.; Di Bella, G. Washing Batch Test of Contaminated Sediment: The Case of Augusta Bay (SR, Italy). Appl. Sci. 2020, 10, 473. [Google Scholar] [CrossRef] [Green Version]
- Bolan, N.; Kunhikrishn, S.A.; Thangarajan, R.; Kumpiene, J.; Park, J.; Makino, T.; Kirkham, M.B.; Scheckel, K. Remediation of heavy metal (loid)s contaminated soils-to mobilize or to immobilize? J. Hazard. Mater. 2014, 266, 141–166. [Google Scholar] [CrossRef]
- Gräfe, M.; Donner, E.; Collins, R.N.; Lombi, E. Speciation of metal(loid)s in environmental samples by X-ray absorption spectroscopy: A critical review. Anal. Chim. Acta 2014, 822, 1–22. [Google Scholar] [CrossRef] [PubMed]
- Chen, L.; Liu, J.R.; Hu, W.F.; Gao, J.; Yang, J.Y. Vanadium in soil-plant system: Source, fate, toxicity, and bioremediation. J. Hazard. Mater. 2021, 405, 124200. [Google Scholar] [CrossRef]
- Li, Z.; Liang, Y.; Hu, H.; Shaheen, S.M.; Zhong, H.; Tack, F.M.; Wu, M.; Li, Y.; Gao, Y.; Rinklebe, J.; et al. Speciation, transportation, and pathways of cadmium in soil-rice systems: A review on the environmental implications and remediation approaches for food safety. Environ. Int. 2021, 156, 106749. [Google Scholar] [CrossRef]
- Falaciński, P.; Wojtkowska, M. The use of extraction methods to assess the immobilization of metals in hardening slurries. Arch. Environ. Prot. 2021, 47, 60–70. [Google Scholar]

| Grain Size [µm] | Mass [g] | Share in Total Content [%] |
|---|---|---|
| >2000 | 24.65 | 2.3 |
| 2000–1000 | 30.57 | 2.9 |
| 1000–500 | 103.8 | 9.8 |
| 500–250 | 171.16 | 16.2 |
| 250–90 | 294.88 | 27.9 |
| <90 | 433.11 | 40.9 |
| TM | Fraction | Total | |||||||||
|---|---|---|---|---|---|---|---|---|---|---|---|
| Exchangeable | Carbonate | Fe/Mn Bound | Organic | Residual | |||||||
| mg/kg | % | mg/kg | % | mg/kg | % | mg/kg | % | mg/kg | % | mg/kg | |
| Zn | 7.2 | 3.0 | 92.0 | 38.9 | 71.5 | 30.1 | 51.8 | 21.8 | 14.8 | 6.2 | 237.3 |
| Cd | 2.9 | 47.0 | 2.2 | 36.2 | 0.3 | 4.6 | 0.2 | 3.7 | 0.5 | 8.5 | 6.1 |
| Pb | 25.1 | 13.3 | 51.0 | 27.0 | 52.5 | 27.8 | 33.0 | 17.4 | 27.4 | 14.5 | 189.0 |
| Cu | 1.0 | 0.3 | 48.8 | 13.8 | 28.5 | 8.1 | 251.4 | 71.3 | 23.1 | 6.5 | 352.8 |
| Classification | Total TM Content [mg/kg d. m.] | |||
|---|---|---|---|---|
| Pb | Zn | Cu | Cd | |
| Non-polluted | ≤100 | ≤300 | ≤150 | ≤4 |
| Polluted | >100 | >300 | >150 | >4 |
| Zn | |||||||||
|---|---|---|---|---|---|---|---|---|---|
| EDTA [M] | 0.01 | 0.05 | 0.1 | ||||||
| Extraction Multiplicity | 1 | 2 | 3 | 1 | 2 | 3 | 1 | 2 | 3 |
| q [mg/kg d.m.] | 232.9 | 129.6 | 66.7 | 232.7 | 124 | 61.1 | 240 | 128.1 | 55.4 |
| Q1 [mg/kg d.m.] | 99.2 | 59.5 | 39.7 | 108.6 | 62.4 | 33.8 | 108.3 | 54.8 | 37.1 |
| Q2 [mg/kg d.m.] | 4.1 | 3.4 | 0.1 | 0.1 | 0.5 | 14.5 | 3.6 | 17.9 | 0.1 |
| Q3 [mg/kg d.m.] | 129.6 | 66.7 | 26.9 | 124 | 61.1 | 12.8 | 128.1 | 55.4 | 18.2 |
| Cd | |||||||||
| EDTA [M] | 0.01 | 0.05 | 0.1 | ||||||
| Extraction multiplicity | 1 | 2 | 3 | 1 | 2 | 3 | 1 | 2 | 3 |
| q [mg/kg d.m.] | 6.25 | 3.23 | 2.33 | 6.25 | 1.6 | 0.44 | 6.71 | 1.79 | 0.66 |
| Q1 [mg/kg d.m.] | 0.93 | 0.89 | 0.67 | 3.03 | 1.13 | 0.2 | 3.59 | 1.03 | 0.49 |
| Q2 [mg/kg d.m.] | 2.09 | 0.01 | 0.22 | 1.62 | 0.03 | 0.02 | 1.33 | 0.1 | 0.03 |
| Q3 [mg/kg d.m.] | 3.23 | 2.33 | 1.44 | 1.6 | 0.44 | 0.22 | 1.79 | 0.66 | 0.14 |
| Cu | |||||||||
| EDTA [M] | 0.01 | 0.05 | 0.1 | ||||||
| Extraction multiplicity | 1 | 2 | 3 | 1 | 2 | 3 | 1 | 2 | 3 |
| q [mg/kg d.m.] | 376.7 | 213.5 | 162.5 | 363.5 | 137.9 | 70.3 | 358.8 | 98.1 | 59 |
| Q1[mg/kg d.m.] | 106.7 | 44.5 | 39.7 | 177.1 | 67.5 | 21.1 | 216.6 | 39 | 17 |
| Q2 [mg/kg d.m.] | 56.5 | 6.5 | 0.1 | 48.5 | 0.1 | 0.1 | 44.1 | 0.1 | 0.1 |
| Q3 | 213.5 | 162.5 | 122.7 | 137.9 | 70.3 | 49.1 | 98.1 | 59 | 41.9 |
| Pb | |||||||||
| EDTA [M] | 0.01 | 0.05 | 0.1 | ||||||
| Extraction multiplicity | 1 | 2 | 3 | 1 | 2 | 3 | 1 | 2 | 3 |
| q [mg/kg d.m.] | 191.9 | 145 | 99.3 | 193.1 | 95.5 | 47.8 | 183.3 | 40.9 | 17 |
| Q1 [mg/kg d.m.] | 28.6 | 32.6 | 32.8 | 93.8 | 41.6 | 22.4 | 130.2 | 21.4 | 10.7 |
| Q2 [mg/kg d.m.] | 18.3 | 13.1 | 0.1 | 3.8 | 6.1 | 4.1 | 12.2 | 2.5 | 0.1 |
| Q3 [mg/kg d.m.] | 145 | 99.3 | 66.4 | 95.5 | 47.8 | 21.3 | 40.9 | 17 | 6.2 |
Publisher’s Note: MDPI stays neutral with regard to jurisdictional claims in published maps and institutional affiliations. |
© 2022 by the authors. Licensee MDPI, Basel, Switzerland. This article is an open access article distributed under the terms and conditions of the Creative Commons Attribution (CC BY) license (https://creativecommons.org/licenses/by/4.0/).
Share and Cite
Wojtkowska, M.; Bogacki, J. Assessment of Trace Metals Contamination, Species Distribution and Mobility in River Sediments Using EDTA Extraction. Int. J. Environ. Res. Public Health 2022, 19, 6978. https://doi.org/10.3390/ijerph19126978
Wojtkowska M, Bogacki J. Assessment of Trace Metals Contamination, Species Distribution and Mobility in River Sediments Using EDTA Extraction. International Journal of Environmental Research and Public Health. 2022; 19(12):6978. https://doi.org/10.3390/ijerph19126978
Chicago/Turabian StyleWojtkowska, Małgorzata, and Jan Bogacki. 2022. "Assessment of Trace Metals Contamination, Species Distribution and Mobility in River Sediments Using EDTA Extraction" International Journal of Environmental Research and Public Health 19, no. 12: 6978. https://doi.org/10.3390/ijerph19126978