Abstract
This research examines customers’ intention to buy depending on their use of nutrition labelling (NL) in fast food operations (FFOs) and their intention to visit and recommend these FFOs with nutrition-labelled menus. The research model draws on the theory of planned behaviour (TPB) to examine customers’ intentions to buy from nutrition-labelled menus and their behaviour of visiting and recommending to others FFOs with nutrition-labelled menus. To achieve this purpose, a self-administrated questionnaire was distributed to and collected from a random sample of customers at FFOs in Greater Cairo, Egypt, i.e., McDonald’s and Subway. The results from the structural equation modelling (SEM) using AMOS software indicated positive and direct significant paths from the constructs of the TPB, except for customers’ attitude, to customer intention to buy nutrition-labelled menu items. The results also showed a positive significant impact of customers’ intention on their behaviour of visiting and recommending FFOs featuring nutrition-labelled menus. The findings showed that there is an awaking of nutritional awareness among fast-food customers and that providing nutritional information on fast-food menus will affect their purchasing intention in the future by encouraging them to make healthy food choices. Theoretical implications for scholars and managerial implications for FFOs, especially in relation to public health in general and healthy food choices in particular, are explained and discussed.
1. Introduction
Dining out has become an important part of the modern lifestyle; thus, there is an increasing trend of eating away from home to keep up with the rapid pace of working life. This is reflected in the growth of fast-food operations (FFOs) worldwide. However, studies often link eating out with obesity and the perceptions that FFOs often provide unhealthy food [1]. This affects the image of FFOs as unhealthy food choice for customers. In response to this, some international FFOs chains, mainly American brands, e.g., McDonald’s, responded by providing nutrition information (NI) on their website and labels containing nutritional information about each served meal on the menu to convince their customers that they are providing healthy food options.
The US Food and Drug Administration (FDA) enacted the Nutrition Labelling and Education Act (NLEA) in 1990, which encouraged a fast-increasing area of research. In 2010, the Patient Protection and Affordable Care Act (ACA) contained a menu calorie labelling mandate, making it one of the first federal-level obesity therapies aimed at the entire community. The FDA, on the other hand, repeatedly postponed the publication of its final regulation until May 2018 [2]. Regulations aimed at maintaining customers’ public health and reducing obesity by giving appropriate nutrition information at the time of purchase as a tool to encourage better food choices have been aimed at the restaurant business [3]. As the cost of these menu nutritional labelling standards is high [4], the impact of nutrition labelling on consumer food choice needs to be clearly demonstrated [5]. The giving of nutritional information at the point-of-purchase menu items is referred to as menu labelling. Total calories, fat calories, saturated fat calories, cholesterol, salt, total and complex carbs, sugars, dietary fibre and protein are all included [6].
Recent studies have been conducted to determine the impacts of disclosing menu item nutrition information on customers’ product assessments, purchase intentions and behaviour [7,8]. A recent study conducted by Aitken et al. [9] on the benefits of menu labelling of organic foods suggested improving labelling to have more actionable information, such as the health, environmental and societal benefits of products. Additionally, the same study showed that consumers’ perceived behavioural control needs to be enhanced to their strengthen intentions to purchase food with organic labels. The existing research on the effectiveness of menu labelling has shown different results. In FFOs providing information on the menu board, it was found that it enhanced consumer awareness [10]. Moreover, numerous different studies have found a decrease in the numbers of calories ordered and consumed after menu labelling [11,12,13]. However, other studies have found only a slight change in the number of calories ordered after menu labelling [14,15]. Another study [16] found that calorie labels reduced the number of calories ordered for some items, but not all of the restaurant items were assessed to ensure the generalizability of this result.
This research examines the influence of nutrition labelling on customers’ buying intention in FFOs and their behaviour of visiting and recommending to other customers those items with nutrition labelling and information. For this purpose, the research adopted the theory of planned behaviour (TPB) to properly understand and examine this relationship. The TPB framework has been applied extensively [(see for example 17–20)] to predict human intention and behaviour. For example, the theory was adopted to predict food consumption decisions [17], intentions to purchase local food products [18] and customer intention and behaviour towards food waste [19]. Shin et al., [20] adopted the TPB to explore and examine customer intention and behaviour towards organic menus in restaurants and gained a better understanding of the determinants of customer intention and behaviours regarding organic menu. Despite the appropriateness of the TPB for predicting customers’ intention and behaviour, to the best of the researchers’ knowledge, there is no published research examining customer intention to buy from FFOs featuring nutrition-labelled menus, especially in non-western countries such as Egypt. This research is among the first attempts at drawing on the TPB for better understanding customer buying intention and behaviour regarding items with nutrition labelling in FFOs. Specifically, the research addresses the implications of these nutrition labels on customers’ healthy choices, which in turn affects the public health.
To achieve the research purpose highlighted above, the current article will be structured as follows. The next section (Section 2) reviews the related studies and discusses the research conceptual model. Section 3 presents the research methodology, especially the data collection methods from the research sample and the data analysis techniques. This section also discusses the research instruments adopted for the data collection. Section 4 presents the results of the research. This section ends with presenting the research structural model. Section 5 discusses the results and compares them with findings from previous studies. It also highlights the theoretical and practical (mainly managerial) research implications. Section 6 presents the research conclusion. The last section (Section 7) discusses the major limitations of the study and highlights opportunities for future research.
2. Review of the Literature
2.1. Using Nutrition Labelling in Restaurants
Menu labelling provides customers with relevant information about the nutrient content of food items, at the point of purchase, to make customers capable of choosing nutritionally suitable food [21]. Studies [22,23] have confirmed that customers want menu labelling to be available on restaurant menus. Moreover, these studies also confirmed that customers argue that if they see this information, they will make healthier menu choices. The previous studies focused on determining customers’ desire for nutritional information in restaurants, determining what type of nutritional information they specifically want and understanding the formats and methods of presenting nutritional information in restaurants. The basic concept is providing nutritional information that many people do not easy access to in a readily available manner at the point of consumption as well as preventing obesity. With nutrition information, people will become more inclined to use it and make healthier choices [24]. Customers expect restaurants including FFOs to provide nutritional information on the menu, including calorie, sugar, protein, carbohydrate and fat content [25]. The provision of nutritional information on restaurant menus has grown in popularity, as has the number of customers concerned about this issue [23]. Without calorie labelling in restaurants, customers have no effective way of predicting the number of calories in these dishes, which tend to be high in fat and low in nutritional content as well as in larger portions than people consume at home, which may negatively affect their public health. Localities across the US began enacting menu labelling regulations in 2008, beginning with New York City [26]. However, the results of such interventions tend to have varied in practice, with limited effects on pushing people to healthier options at a variety of impact sizes [27,28,29,30].
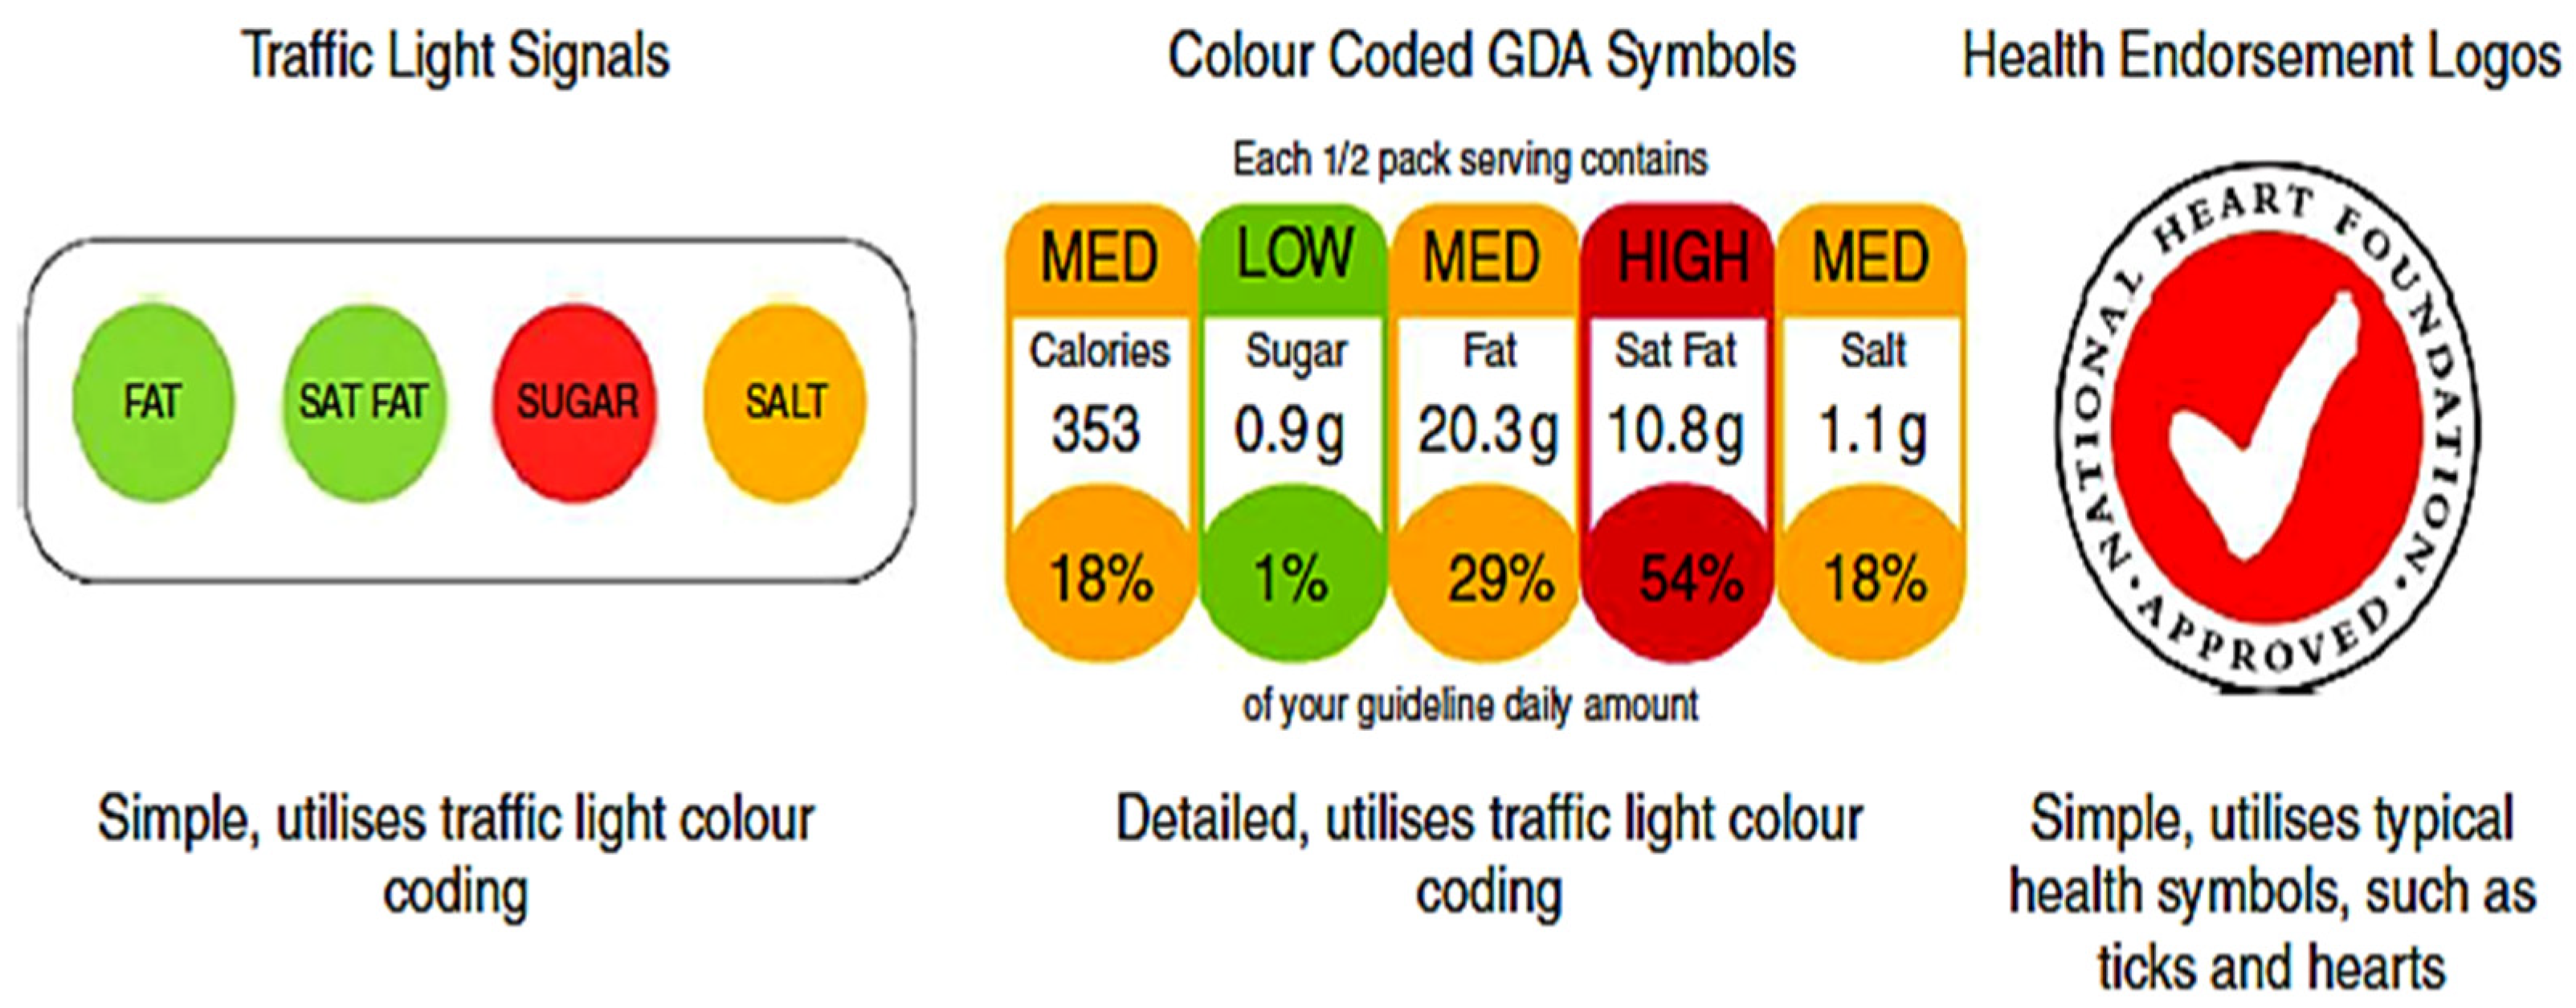
According to Scarborough et al. [31], nutrition labels consist of health endorsement logos, substantial nutritional information and even a simple “traffic light” method of affixing coloured nutritional symbols to food product packaging to signal the degree of healthiness are all examples of nutrition labelling styles (commonly used on ready-made meals in grocery stores throughout parts of Europe). Montandon and Colli [32] identified the most common nutrition-label formats for showing the nutritional information that customers of fast food restaurants were most familiar with (see Figure 1). Kerins et al. [33] designed icon-based menu labels (see Figure 2) based on the traffic light colour-coding system [34], which aims at improving outcomes through food and beverage services [35]. Authors of the same research [35] also suggested that future research should look into how individual differences in socio-demographics, health values and pre-existing nutrition knowledge may impact the effectiveness. According to Zhu [36], consumers would prefer to have the most information available, but they do not always use nutrition information to make purchase decisions. This is due to a variety of socio-demographic characteristics such as gender, income, education, family size, and so on. Furthermore, Green [37] argued that income had a substantial relationship with menu label utilisation, with higher-income consumers being more likely to use the information. Additionally, the same study [37] showed that more educated people had better public health outcomes in general, including lower risk of diabetes.

Figure 1.
Popular nutrition labeling formats. Source: Montandon and Colli, [31].

Figure 2.
Icon-based menu labels. Source: Kerins et al., [32].
Most of the FFOs nowadays include nutrition information on their websites; however, it might be difficult to find; while making ordering decisions. Many American brands in Egypt, such as McDonald’s, have begun to provide nutrition labelling on their websites and with each served meal in various formats. Customers would prefer to have as much information as possible, but they do not always use nutrition information to make purchasing decisions, which is due to a variety of socio-demographic characteristics such as gender, income, education and family size [36]. With regard to the use of menu labels, there was a significant link between income and information use, with higher-income people being more likely to use it [37]. Additionally, more educated people have better health outcomes in general, including a lower risk of diabetes [37]. Studies on menu labelling have found a strong link between the target audience and the impact of nutrition labelling on consumer food choices. In this regard, a FFO menu calorie labelling study discovered a decrease in calories selected only by non-obese people [38]. On one hand, several research studies, see for example, [30,39], found that menu calorie labelling has only minor effects on food purchasing behaviour. On the other hand, various studies have found that menu labelling reduces the number of calories purchased [27,40], and others have even found no effect on consumer behaviour [28,29,41,42,43].
2.2. The Research Conceptual Model
The TPB theory outlines the factors that determine individuals’ intentions and hence their behaviours [44]. According to the TPB, the determinants of an individual’s intention are: attitude, subjective norms and perceived behavioural control. According to the theory, attitude refers to the extent to which an individual has a positive or negative assessment of the behaviour in question. Subjective norms are related to the perceived social influence to behave in a certain way. Perceived behavioural control is concerned with an individual’s perceptions of the ease or difficulty of behaving in a certain way; hence, it reflects previous experience and expected obstacles. The TPB confirms that that the only determinant of behaviour is intention. The TPB suggests that individuals with positive attitude, positive social influence and good perceived behavioural control are more likely to have the intention to perform a behaviour [44,45,46,47].
The TPB was adopted extensively to predict customer intention and behaviour in different contexts beyond the hospitality and tourism contexts. With regard to the hospitality context, the theory was adopted to predict food consumption decisions [17], intention to purchase local food products [18], customer intention and behaviour towards food waste [19], intention and behaviour towards menus with organic information in restaurants [20], attitude towards and intention to buy organic food [9], intentions to select eco-friendly restaurants [48] and purchasing intentions of genetically modified foods based on their nutrition labelling [49]. Recent research [46] suggested that attitudes, descriptive norms and nutrition literacy are significant predictors of food label use intentions. Moreover, perceived behavioural control (PBC) and reading ability are significant predictors of food label usage. These studies are some examples of the plethora of research adopting the TPB to predict customer intention and behaviour.
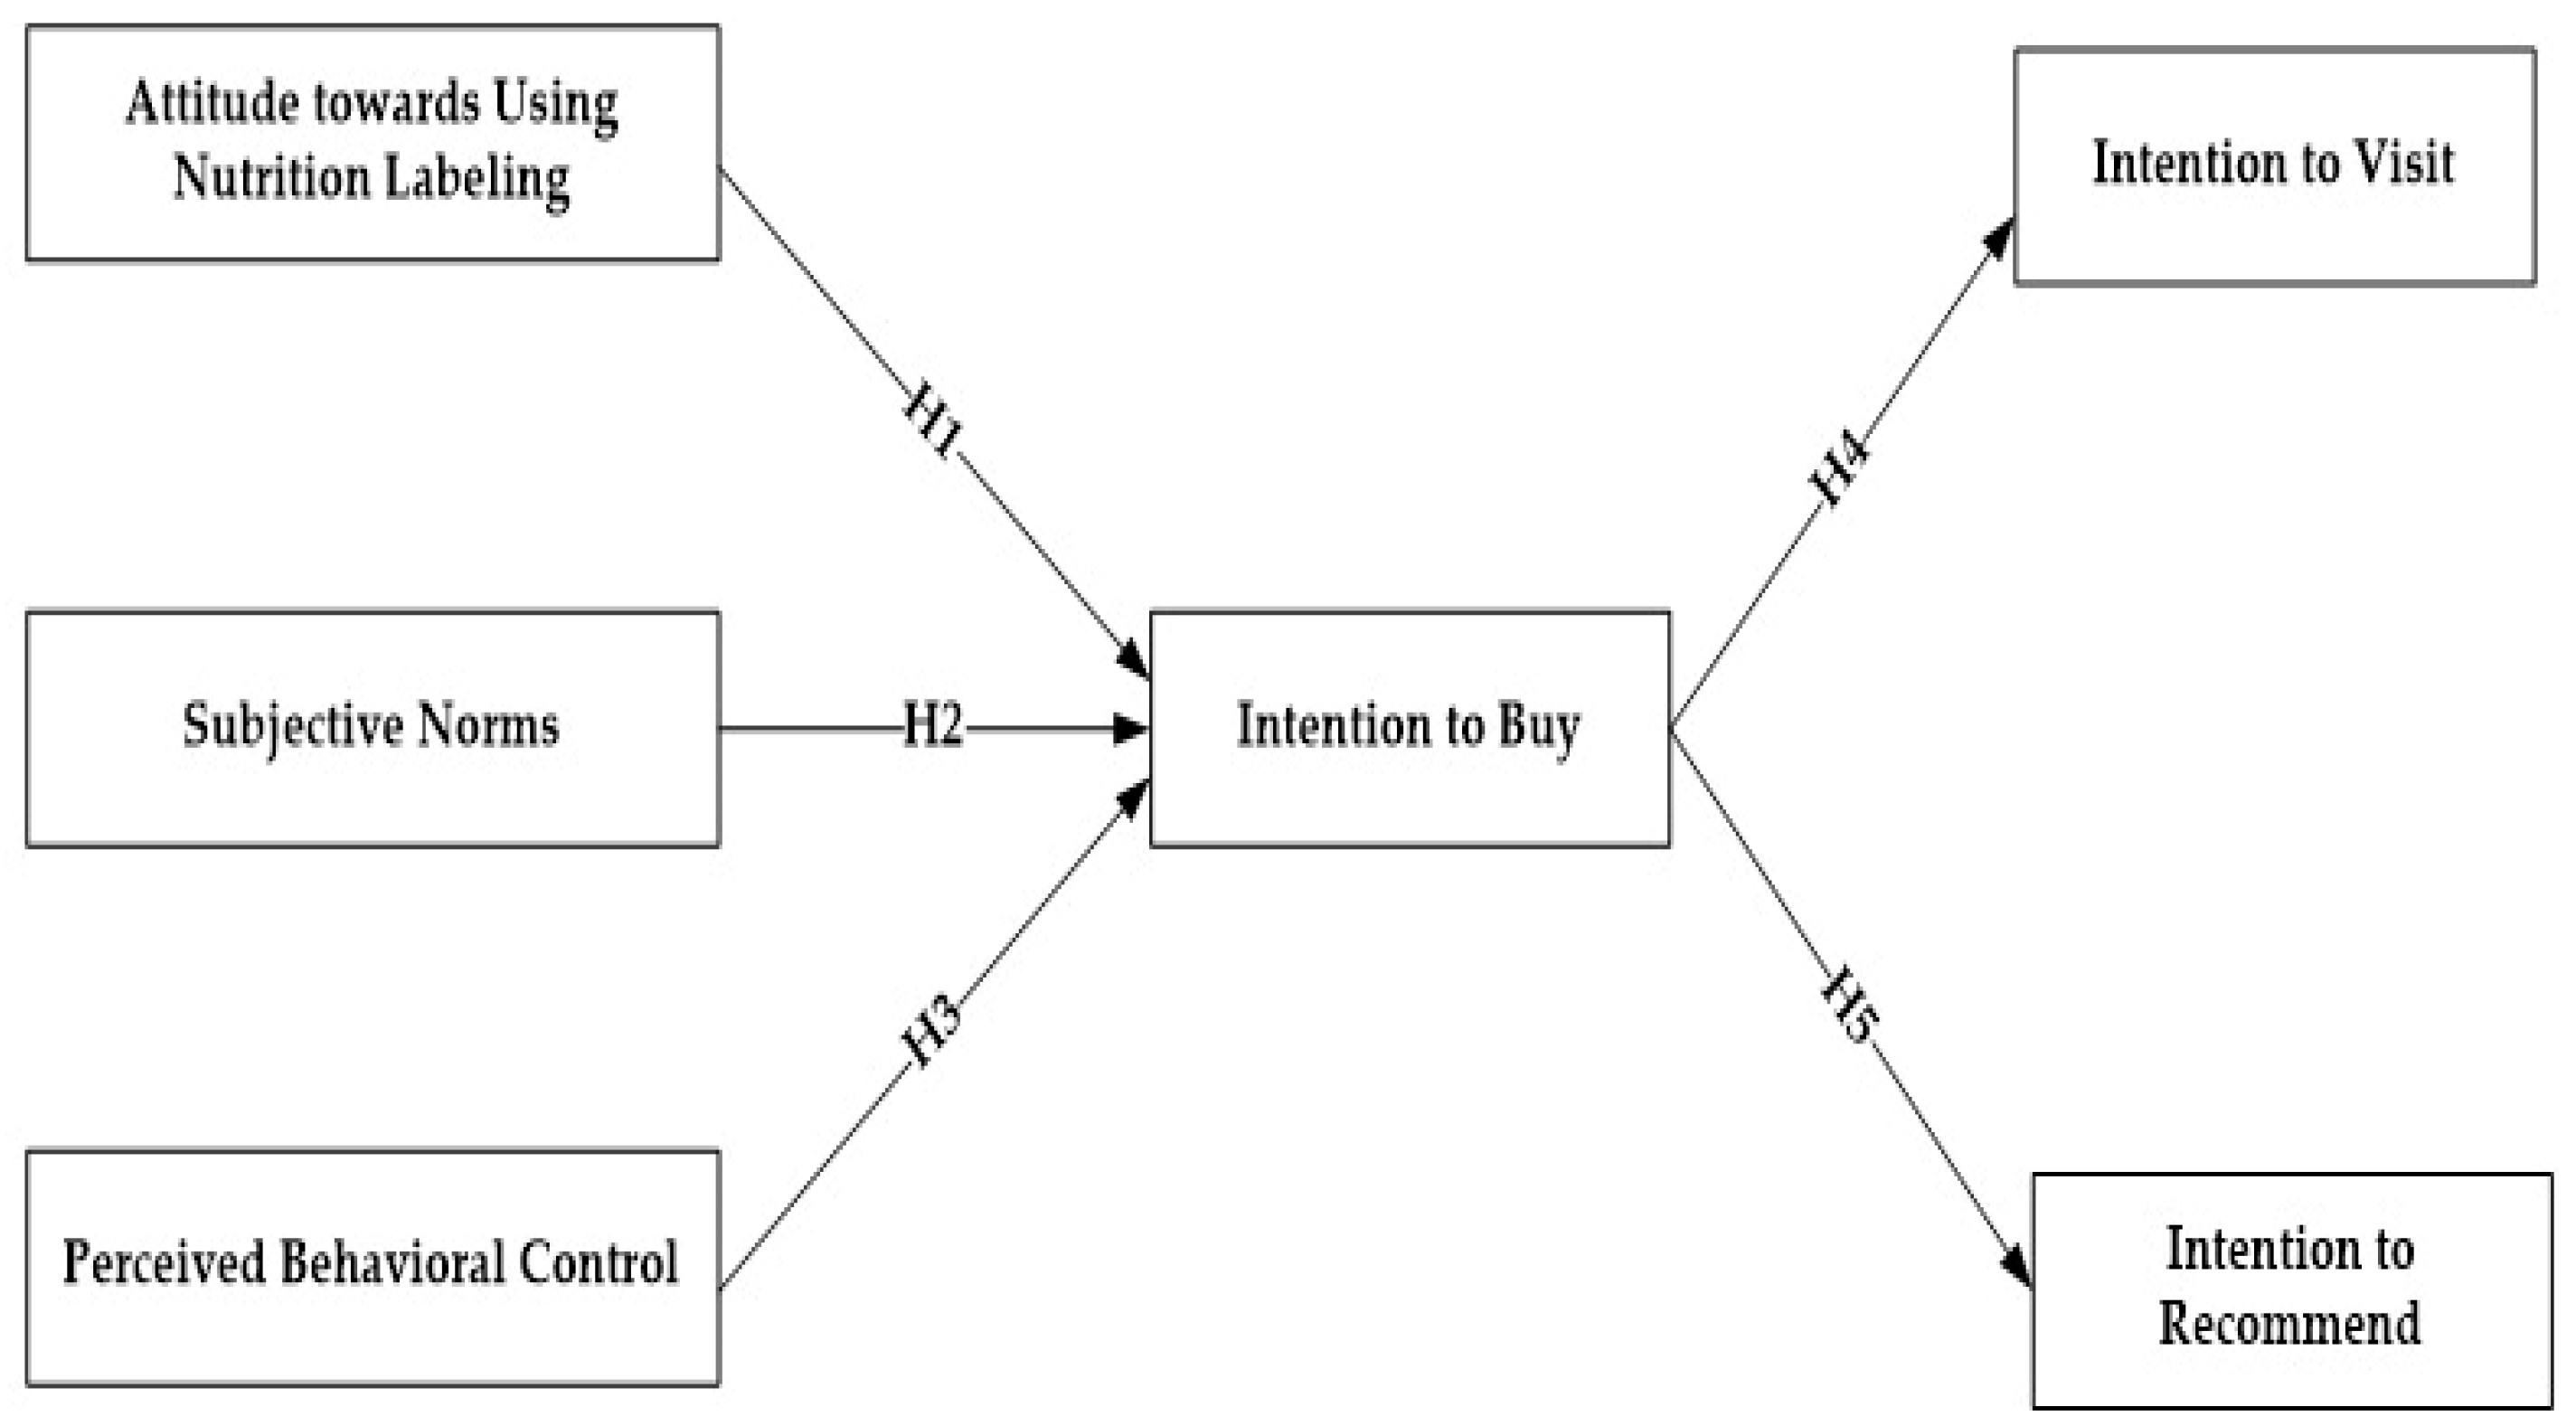
This research draws on the TPB to examine customer attitudes and behaviours related to buying food from FFO menus with nutrition labelling. In the research conceptual model (see Figure 3), a person’s intention to choose items with nutrition labels is formulated by their attitudes, subjective norms and perceived behavioural control. The TPB supports this notion that customers’ intention to choose food menus with nutrition labelling is positively influenced by these three constructs of TPB and to predict their buying behaviour. Thus, the study hypothesis are as follows:
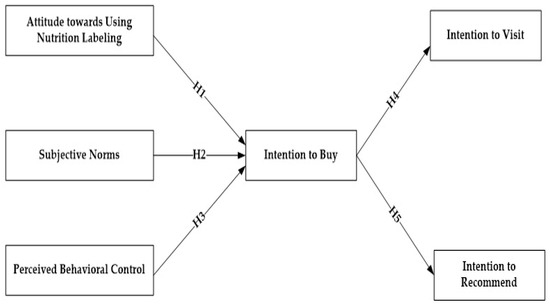
Figure 3.
The proposed research model.
Hypothesis 1 (H1):
Attitude toward nutrition labelling positively affects customers’ intention to buy nutrition-labelled items.
Hypothesis 2 (H2):
Subjective norms positively affect customers’ intention to buy nutrition-labelled items.
Hypothesis 3 (H3):
Perceived behavioural control positively affects customers’ intention to buy nutrition-labelled items.
Hypothesis 4 (H4):
Customers’ intention to buy positively affects customers’ intention to visit restaurants with nutrition-labelled items.
Hypothesis 5 (H5):
Customers’ intention to buy positively affects customers’ intention to recommend restaurants with nutrition-labelled items.
3. Methodology
3.1. Data Collection
The study originated from a need to understand customers’ buying intentions and behaviours in the context of FFO food menus with nutrition labelling. Therefore, the study adopted a pre-tested questionnaire. A total of 600 questionnaire forms were distributed to random samples of FFO customers. The random samples of customers were at McDonald’s and Subway restaurants in Cairo and Giza, Egypt. The managers of the restaurants were asked to approach their customers and ask them to participate in the study. Managers agreed to approach their customers and obtain their consent to participate. Customers were asked to voluntarily participate in the research study. Written consent was obtained from each respondent before the data collection. The questionnaire forms were collected with the support of a company that specialized in data collection. Among the distributed forms, only 408 of the forms were completed and valid for data analysis, which represents a 68% response rate. This number of respondents was a sufficient sample size according to Krejcie and Morgan [50], who argued that the sample size should be 384 or above for a population of one million and above. This research sample also compared favourably with similar research sample sizes [20]. The distribution and collection of the questionnaires took nearly three months (December 2021 until February 2022).
3.2. The Research Questionnaire
The TPB variables (including intention and behaviour) were measured using a 20-item scale that was adopted from [20,51,52,53] as follows: attitude (AT), subjective norms (SN), perceived behavioural control (PBC), intention to buy, intention to visit, and intention to recommend. In order to enhance the response rate [54], items were pre-tested to make the questionnaire as short as possible. Furthermore, only important demographic information was collected. In addition, a high response rate was ensured due to the support of a specialized data collection company. Furthermore, respondents were asked to indicate their agreement on 5-point Likert scales ranging from (1) “strongly disagree” to (5) “strongly agree” instead of 7-point or 10-point Likert scales; 5-point scales require less time, are easy to answer [55] and help yield data sets that are amenable to advanced parametric and multivariate statistical analysis [56].
3.3. Data Analysis Methods
The current study screened the data and employed the following methods of analysis. First, the analysis of the preliminary data such as calculating means, standard deviations and outliers was conducted using statistical package for social sciences (SPSS v.25). Second, the model of this study containing the effects of the three constructs of the TPB on intention and ultimately on customer behaviour of visiting and recommending restaurants based on nutrition label provided was examined via structural equation modelling (SEM) using the analysis of moment structure (AMOS) version 23.
4. Results
4.1. Demographic Data Analysis
Questions related to the respondents’ demographic data asked about their age, gender, education level and diet status (see Table 1). As Table 1 shows, the majority of respondents, 67.6%, were in the age range from 21 to less than 30 years, followed by the respondents from 30 to less than 40 years, with a percentage of 12.3%. Moreover, 17% of the respondents were under 21 years (only those 18 or above could participate in the current study; hence, no children participated in this research). Only 2.9% of the respondents were from 40 to 50 years old, which reflects that young people (often 40 years or younger) are the dominant segment of FFO customers in Egypt. The sample showed similar proportions of female (50.8%) and male (49.2%) respondents. Concerning the level of education, the distribution was obviously skewed toward the highly educated sector of the population, with 66.6% of the sample having completed a bachelor’s degree, and 31.9% of the sample having completed a master’s or a doctoral degree. Only 1.5 of the respondents were secondary school students. Regarding diet status, only 28 (14.2%) of the respondents were following a special diet; most were not (71.6%).

Table 1.
The respondent profile.
4.2. Confirmatory Factor Analysis
The research adopted a confirmatory factor analysis (CFA) to verify the factors of the scale to be used for the data collection. The results from the CFA model showed that the model has good fit indices χ2 (32, n = 408) = 107,760, p < 0.001, normed χ2 = 3.367, SRMR = 0.04233, CFI = 0.981, TLI = 0.966, NFI = 0.932, PCFI = 0.771, and PNFI = 0.669). These fit indices confirm that the measurement model produces the data collected. For example, as [57] suggested, the value of the normed χ2 must be less than 5, and in this study, it was χ2 = 3.367. Additionally, the value of RMSEA must be less than 0.08 according to Pedhazur and Schmelkin [58], and here, it was 0.062. The incremental fit indices, NFI, TLI, and CFI, have to reach a threshold value of 0.90 [59], and these values were excellent in the current research (see Table 2). Furthermore, the results (see Table 2) for the skewness and kurtosis coefficients confirm that the study did not violate the assumption of normality.
Table 2.
The descriptive statistics for the research items.
Convergent validity was adopted to ensure that the variables correlated and could measure the phenomenon. Bentler and Bonett [60] stated that the composite reliability (CR) must be above 0.7 and the average variance extracted (AVE) above 0.5. As Table 3 and Table 4 show, all the values (CR, AVE and discriminant validity) in this research meet the required standards according to [60]. Discriminant validity was tested with a correlation matrix, the square roots of the AVEs and Cronbach’s alpha for each variable. Following the guidelines of Fornell and Larcker [61], discriminant validity was confirmed in this research (see Table 3). All Cronbach’s alphas were excellent or acceptable as recommended in previous research [62,63] since they all exceeded 0.7 (between 0.75 and 0.91; see Table 4).
Table 3.
The convergent validity results.
Table 4.
The discriminant validity results.
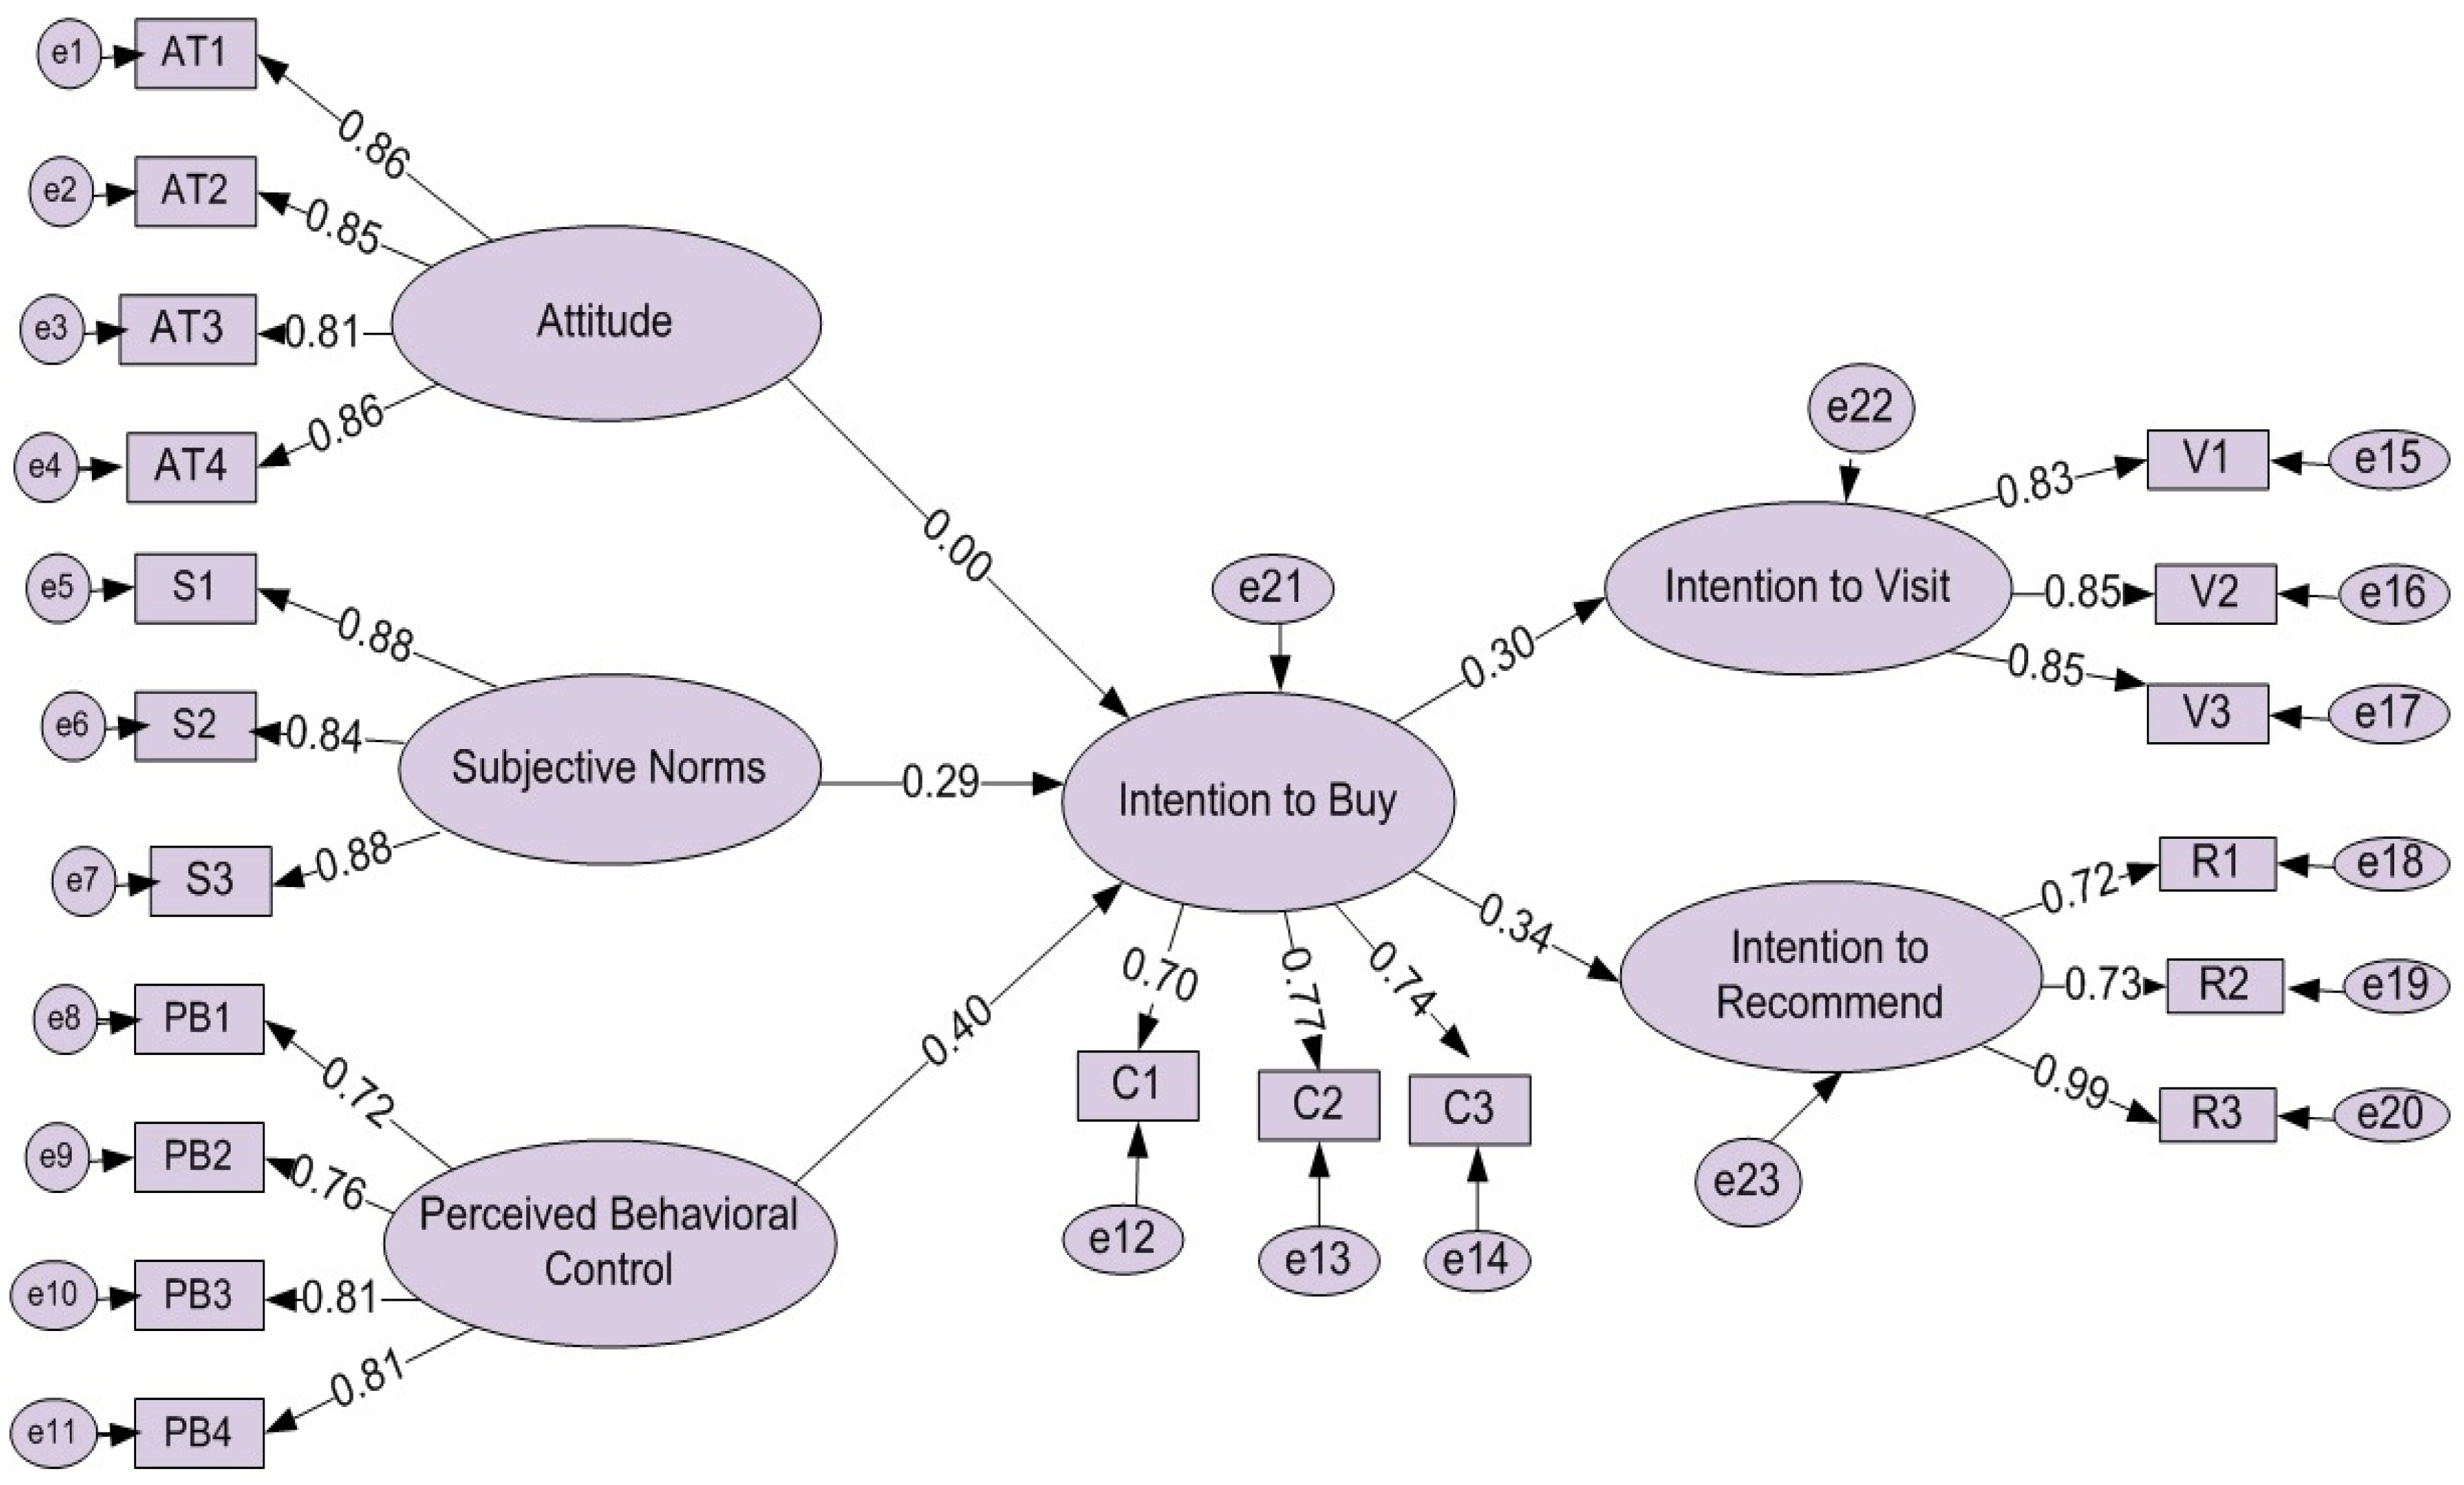
4.3. Structural Equation Modelling Results
As highlighted above, structural equation modelling (SEM) was adopted to test the impacts of nutrition labelling on FFO customer buying intentions and behaviours using the TPB. The SEM results (see Table 4 and Figure 2) show that the structural model has good fit (χ2 (27, n = 408) = 74,520, p < 0.001, normed χ2 = 2760, RMSEA = 0.057, RMR = 0.059, SRMR = 0.038, GFI = 0.910, CFI = 0.979, TLI = 0.939, NFI = 0.889, PCFI = 0.718 and PNFI = 0.809). The results supported all research hypotheses except H1, regarding which, the study did not confirm a positive significant influence of attitude on intention to buy items with nutrition labelling (see Table 5). The results showed a positive significant influence of subjective norms on customers’ intention to buy (β = 0.201, t-value = 23.081, p < 0.001). Moreover, the results of the SEM model confirmed a positive direct path form perceived behavioural control to customers’ intention to buy (β = 0.297, t-value = 13.481, p < 0.001) and from customers’ intention to buy to their intention to visit (β = 0.411, t-value = 5.493, p < 0.001). Additionally, the results confirmed a positive direct influence of customers’ intention to buy on customers’ intention to recommend (β = 0.453, t-value = 6.325, p < 0.001) (see Table 5 and Figure 4).
Table 5.
The results for the structural model.
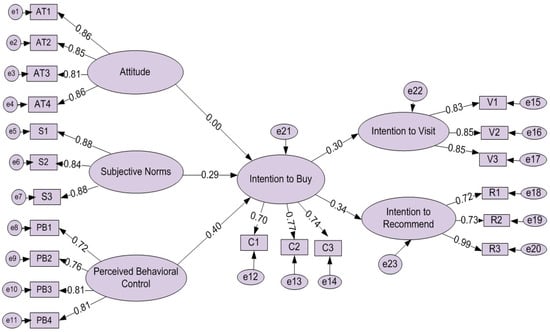
Figure 4.
The final research structural model.
5. Discussion and Implications
This study focused on customers’ buying intention and behaviours towards using nutrition labelling in FFOs in Egypt. Although most customers in this study were not on a special diet, they had high intentions and behaviours regarding buying nutrition-labelled items in FFOs in Egypt. The results revealed the presence of positive and direct significant paths from the constructs of the TPB, except for that from customers’ attitude to their buying intention. The results demonstrated no significant path from attitude to customer intention to buy, and thus, hypothesis one (H1) is not supported. This result does not support the work of Syed and Nazura [64], who found a positive significant influence of attitude on food buying intention. However, their research focused on halal food, which is an important cultural (mostly religious) element influencing attitudes and purchasing behaviour. Notwithstanding, the issue of healthy eating is not deeply related to culture. Moreover, most of the respondents were not on special diets and had not assessed their own attitudes towards using nutrition-labelled items. Although most respondents were highly educated, they paid little attention to special diets and to their attitudes towards the usage of nutrition labelling in FFOs. Hence, their attitudes did not have a significant influence on their buying intention and behaviours. In one comparative international study [65], Egyptian customers viewed McDonald’s more favourably than customers in other countries such as the US, where customers viewed it more critically. Egyptian customers often consume fast food, especially from international brands, without full attention to the type of food served or its calories provided. Again, this could justify the finding here of no statistically significant influence on respondents’ intention to use items with nutrition labels in FFOs.
The impacts of subjective norms on customer intention to buy were positive and statistically significant as was hypothesized. This finding supported hypothesis two (H2). This finding concurs with the work of Shin et al. [20], who found that customers’ buying intentions for specific food types were influenced by subjective norms. Egypt is classified as a collective society according to Hofstede [66]; hence, unsurprisingly, the results of previous research [65] have confirmed that Egyptian customers are influenced by their friends and families and thus spend much time at McDonald’s together. This research showed that respondents are influenced by their peers, even if they are minorities, to use the nutrition labelling provided at McDonald’s and other international restaurants.
The results revealed the presence of positive and significant path from perceived behavioural control to intention to buy supporting hypothesis three (H3). This result is consistent with previous studies [9,49,67], which also found a positive significant influence of perceived behavioural control on customers’ intentions to buy nutrition-labelled items. This means that respondents were confident and had the time and money to buy nutrition-labelled items when these was offered to them at FFOs; hence, this positively affected their intention to buy items with nutrition labels at FFOs. This could because most respondents were highly educated and had more control of their time and money; previous research studies [37] showed that educated people are more likely than others to control their resources (money and time) and buy healthier foods than others.
The results revealed a positive and significant influence of intention to buy on respondents’ intention to visit and on the path from intention to buy to intention to recommend, supporting hypotheses four (H4) and five (H5), respectively. These results are consistent with other studies [67,68] that also found that that the TPB constructs successfully predicted customers’ intention and ultimately their behaviour towards not just food choices but also towards revisit and recommendations to others [20]. This research showed that respondents have the intention to revisit these FFOs with nutrition-labelled menus and recommend them to their networks.
These research findings have some implication for hospitality scholars, especially those related to FFOs. The research adopted TPB to gain a better understating of customers buying intention and behaviours towards FFOs featuring nutrition labelled items. This research highlighted the role of both perceived behavioural control and subjective norms in buying items with nutrition labelled in FFOs. This research showed that customers’ attitudes were not a significant factor in their use of nutrition labels; they are more affected by their friends and families (subjective norms). The TPB explains why customers intend to buy nutrition-labelled items from FFOs. Based upon these results, there are also some managerial implications for those in FFOs. One of the most important issues that top management of these restaurants should consider is media campaigns to influence customer attitudes towards the use of nutrition information and labels to make healthy food choices at FFOs. These campaigns should reach potential customers through different methods including social media sites. Executive managers should be keen to introduce clear, coloured and briefly detailed nutrition labels for their customers at their purchasing units to drive their buying intention and behaviour towards ordering menu items with nutrition labelling and encourage healthy food choices. Calories, fat, cholesterol and saturated fat appeared to be the four nutrients perceived by customers as the most important for including on the menu [6]. It is also recommended that the top management of FFOs consider providing a variety of nutrition label formats in order to meet the demands of different customer segments for healthier choices. Additionally, FFOs should empower service staff by giving them training courses that enable them in becoming knowledgeable about such nutrition issues in order to help customers make the right food choices. FFO marketers should offer advertising and marketing strategies based on customer preferences regarding indoor nutrition labelling and online nutrition information. Policymakers, on the other side, should enact effective rules and legislation to help FFO customers avoid obesity, overweight and related issues that results from making unhealthy choices at FFOs that do not provide nutrition labelling to promote proper public health.
6. Conclusions
This study examined Egyptian customers’ intention to buy fast food items with nutrition labelling at two FFOs. Additionally, the research examined the influence of nutrition labelling on customers’ intentions to visit and recommend these FFOs. The study draws on the TPB to properly understand and examine customers’ intentions to buy nutrition-labelled menus and their behaviour of visiting and recommending these FFOs. The conclusions of the current research are as follows: The research confirmed the positive and significant influences of subjective norms and perceived behavioural control on customer intention to buy items with nutrition labels at FFOs. However, unlike previous research studies, the current research did not confirm a direct positive influence of attitude on customer intention to buy items with nutrition labels. This could be because most respondents were not on special diets and had no assessments of their attitudes towards using nutrition-labelled items. Furthermore, the current research extended the TPB research framework and showed that customer intention to buy menu items from FFOs that provide nutrition labels has a direct positive influence on their revisit intentions and recommendations of these FFOs to peers, friends and networks.
7. Limitations of the Study and Further Research Opportunities
The current research has drawn on the TPB to examine the role of nutrition labelling in buying intention and behaviour at FFOs in a sample of one single market, Egypt. Additionally, the research adopted a questionnaire survey, which has some limitations as a data collection tool. Hence, the results cannot be simply generalized to other country contexts without further examination. This research did not examine the role of culture in customer choices of food based on their nutrition labels. Future researchers could examine this issue by adopting an international comparative study between counties with different cultural dimensions to examine whether culture moderates customer choices of health foods.
Author Contributions
Conceptualization, A.E.E.S. and A.S.A.; methodology, A.E.E.S. and A.S.A.; software, A.E.E.S.; validation, A.E.E.S. and A.S.A.; formal analysis, A.E.E.S. and A.S.A.; investigation, A.E.E.S. and A.S.A.; resources, A.E.E.S. and A.S.A.; data curation, A.E.E.S. and A.S.A.; writing—original draft preparation A.E.E.S. and A.S.A.; writing—review and editing, A.E.E.S. and A.S.A.; visualization, A.E.E.S.; supervision, A.E.E.S.; project administration, A.E.E.S.; Funding acquisition, A.E.E.S. All authors have read and agreed to the published version of the manuscript.
Funding
This work was supported through the Annual Funding track by the Deanship of Scientific Research, Vice Presidency for Graduate Studies and Scientific Research, King Faisal University, Saudi Arabia [Project No. AN000530].
Institutional Review Board Statement
The study was conducted according to the guidelines of the Declaration of Helsinki and approved by the deanship of the scientific research ethical committee, King Faisal University (project number: AN000530, date of approval: 01/12/2021).
Informed Consent Statement
Informed consent was obtained from all subjects involved in the study.
Data Availability Statement
Data are available upon request from researchers who meet the eligibility criteria. Kindly contact the first author privately by e-mail.
Conflicts of Interest
The authors declare no conflict of interest.
References
- Marathe, A.; Liu, C.; Kapcala, L.; Hershkowitz, N.; Men, A.; Uppoor, R.; Mehta, M.; Wang, Y. Pharmacometric Bridging Approach for US Food and Drug Administration Approval and Identification of Topiramate Dosing Regimen for Pediatric Patients 2–9 Years of Age with Epilepsy. J. Pharm. Sci. 2019, 108, 1598–1603. [Google Scholar] [CrossRef] [PubMed]
- Gottlieb, S. Press Announcements—Statement from FDA Commissioner Scott Gottlieb, M.D., on the FDA’s Role in Ensuring Americans Have Access to Clear and Consistent Calorie and Nutrition Information; Forthcoming Guidance Will Provide Greater Clarity and Certainty; U.S. Food and Drug Administration: Silver Spring, MD, USA, 2017. [Google Scholar]
- U.S. Food and Drug Administration (FDA). Food Labeling: Nutrition Labeling of Standard Menu Items in Restaurants and Similar Retail Food Establishments; Proposed Rule 76; U.S. Food and Drug Administration: Silver Spring, MD, USA, 2011.
- Almanza, A.; Nelson, D.; Chai, S. Obstacles to nutrition labeling in restaurants. J. Am. Diet. Assoc. 1997, 97, 157–161. [Google Scholar] [CrossRef]
- Swartz, J.; Braxton, D.; Viera, A. Calorie menu labeling on quick-service restaurant menus: An updated systematic review of the literature. Int. J. Behav. Nutr. Phys. Act. 2011, 8, 135. [Google Scholar] [CrossRef] [PubMed] [Green Version]
- Proud, D. McDonald’s USA Adding Calorie Counts to Menu Boards, Innovating with Recommended Food Groups, Publishes Nutrition Progress Report; McDonald’s USA: Oak Brook, IL, USA, 2012. [Google Scholar]
- Karatzi, K.; Poulia, K.A.; Papakonstantinou, E.; Zampelas, A. The Impact of Nutritional and Lifestyle Changes on Body Weight, Body Composition and Cardiometabolic Risk Factors in Children and Adolescents during the Pandemic of COVID-19: A Systematic Review. Children 2021, 8, 1130. [Google Scholar] [CrossRef]
- Katsouri, E.; Zampelas, A.; Drosinos, E.H.; Nychas, G.J.E. Labelling Assessment of Greek “Quality Label” Prepacked Cheeses as the Basis for a Branded Food Composition Database. Nutrients 2022, 14, 230. [Google Scholar] [CrossRef]
- Aitken, R.; Watkins, L.; Williams, J.; Kean, A. The positive role of labelling on consumers’ perceived behavioural control and intention to purchase organic food. J. Clean. Prod. 2020, 10, 120334. [Google Scholar] [CrossRef]
- Dumanovsky, T.; Huang, C.; Bassett, T.; Silver, L. Consumer Awareness of Fast- Food Calorie Information in New York City after Implementation of Menu Labelling Regulation. Am. J. Public Health 2010, 100, 2520–2525. [Google Scholar] [CrossRef]
- Tandon, S.; Wright, J.; Zhou, C.; Rogers, B.; Christakis, D. Nutrition menu labeling may lead to lower calorie restaurant meal choices for children. Pediatrics 2010, 125, 244–248. [Google Scholar] [CrossRef]
- Pulos, E.; Leng, K. Evaluation of a voluntary menu-labeling program in full, service restaurants. Am. J. Public Health 2010, 100, 1035–1039. [Google Scholar] [CrossRef]
- Roberto, C.; Larsen, P.; Agnew, H.; Baik, J.; Brownell, K. Evaluating the Impact of Menu Labeling on Food Choices and Intake. Am. J. Public Health 2010, 100, 312–318. [Google Scholar] [CrossRef]
- Finkelstein, A.; Strombotne, K.; Chan, N.; Krieger, J. Mandatory menu labeling in one fast-food chain in King County, Washington. Am. J. Prev. Med. 2011, 40, 122–127. [Google Scholar] [CrossRef]
- Vadiveloo, M.; Dixon, L.; Elbel, B. Consumer purchasing patterns in response to calorie labeling legislation in New York City. Int. J. Behav. Nutr. Phys. Act. 2011, 8, 51. [Google Scholar] [CrossRef] [PubMed] [Green Version]
- Dumanovsky, T.; Huang, C.; Nonas, C.; Matte, T.; Bassett, M.; Silver, L. Changes in energy content of lunchtime purchases from fast food restaurants after introduction of calorie labelling: Cross sectional customer surveys. BMJ 2011, 343, d4464. [Google Scholar] [CrossRef] [PubMed] [Green Version]
- Ajzen, I. Consumer attitudes and behavior: The theory of planned behavior applied to food consumption decisions. Riv. Econ. Agrar. 2015, 70, 121–138. [Google Scholar]
- Shin, Y.H.; Hancer, M. The role of attitude, subjective norm, perceived behavioral control, and moral norm in the intention to purchase local food products. J. Foodserv. Bus. Res. 2016, 19, 338–351. [Google Scholar] [CrossRef]
- Elshaer, I.; Sobaih, A.E.E.; Alyahya, M.; Abu Elnasr, A. The Impact of Religiosity and Food Consumption Culture on Food Waste Intention in Saudi Arabia. Sustainability 2021, 13, 6473. [Google Scholar] [CrossRef]
- Shin, Y.; Im, J.; Junga, S.; Severta, K. The theory of planned behavior and the norm activation model approach to consumer behavior regarding organic menus. Int. J. Hosp. Manag. 2018, 69, 21–29. [Google Scholar] [CrossRef]
- Grunert, K.G.; Wills, J.M. A review of European research on consumer response to nutrition information on food labels. J. Public Health 2007, 15, 385–399. [Google Scholar] [CrossRef] [Green Version]
- Hwang, J.; Lorenzen, C.L. Effective nutrition labeling of restaurant menu and pricing of healthy menu. J. Foodserv. 2008, 19, 270–276. [Google Scholar] [CrossRef]
- Mills, J.E.; Thomas, L. Assessing customer expectations of information provided on restaurant menus: A confirmatory factor analysis approach. J. Hosp. Tour. Res. 2008, 32, 62–88. [Google Scholar] [CrossRef]
- Miller, L.; Cassady, D. The effects of nutrition knowledge of food label use. A review of the literature. Appetite 2015, 92, 207–216. [Google Scholar] [CrossRef] [PubMed] [Green Version]
- Thomas, L.; Mills, J. Consumer Knowledge and Expectations of Restaurant. J. Foodserv. 2006, 17, 6–22. [Google Scholar] [CrossRef]
- Cusick, C. Menu-labeling laws: A move from local to national regulation. St. Clara Law Rev. 2011, 51, 989. [Google Scholar]
- Auchincloss, A.; Mallya, G.; Leonberg, B.; Glanz, K.; Schwarz, D. Customer responses to mandatory menu labeling at full-service restaurants. American. J. Prev. Med. 2013, 45, 710–719. [Google Scholar] [CrossRef] [PubMed]
- Cantor, J.; Torres, A.; Abrams, C.; Elbel, B. Five years Later: Awareness of New York City’s calories labels declined, with No changes in calories purchased. Health Aff. 2015, 34, 1893–1900. [Google Scholar] [CrossRef] [PubMed]
- Elbel, B.; Mijanovich, T.; Dixon, L.B.; Abrams, C.; Weitzman, B.; Kersh, R.; Auchincloss, A.H.; Ogedegbe, G. Calorie labeling, fast food purchasing and restaurant visits. Obesity 2013, 21, 2172–2179. [Google Scholar] [CrossRef] [Green Version]
- VanEpps, E.; Roberto, C.; Park, S.; Economos, C.; Bleich, S. Restaurant menu labeling Policy: Review of evidence and controversies. Curr. Obes. Rep. 2016, 5, 72–80. [Google Scholar] [CrossRef] [Green Version]
- Scarborough, P.; Matthews, A.; Eyles, H.; Kaur, A.; Hodgkins, C.; Raats, M.M.; Rayner, M. Reds are more important than greens: How UK supermarket shoppers use the different information on a traffic light nutrition label in a choice experiment. Int. J. Behav. Nutr. Phys. Act. 2015, 12, 151. [Google Scholar] [CrossRef] [Green Version]
- Montandon, A.; Colli, C. Effective nutrition labels for fast food consumers. Br. Food J. 2016, 118, 2534–2549. [Google Scholar] [CrossRef]
- Kerins, C.; Cunningham, K.; Finucane, F.; Gibson, I.; Jones, J.; Kelly, C. Effects of an icon-based menu labelling initiative on consumer food choice. Perspect. Public Health 2016, 137, 45–52. [Google Scholar] [CrossRef]
- Food Standards Agency (FSA). Quantitative Evaluation of Alternative Food Signposting Concepts; FSA: London, UK, 2005. [Google Scholar]
- British Dietetic Association (BDA). The Nutrition and Hydration Digest: Improving Outcomes through Food and Beverage Services. 2012. Available online: http://www.bda.uk.com (accessed on 12 January 2019).
- Zhu, J. The Impact of Nutrition Information Delivery Methods on Restaurant Consumers’ Attitudes and Behavior. Master’s Thesis, Purdue University, West Lafayette, IN, USA, 2013. [Google Scholar]
- Green, J. Association between Socio-Demographic Characteristics and Fast Food Calorie Menu Labeling Use and Awareness among Adults Living in the Southwest. Master’s Thesis, Arizona State University, Tempe, AZ, USA, 2014. [Google Scholar]
- Wisdom, J.; Downs, J.; Loewenstein, G. Promoting healthy Choices: Information versus convenience. Am. Econ. J. Appl. Econ. 2010, 2, 164–178. [Google Scholar] [CrossRef] [Green Version]
- Cawley, J. Does anything work to reduce Obesity? (Yes, modestly). J. Health Politics Policy Law 2016, 41, 463–472. [Google Scholar] [CrossRef]
- Bollinger, B.; Leslie, P.; Sorensen, A. Calorie posting in chain restaurants. Am. Econ. J. Econ. Policy 2011, 3, 91–128. [Google Scholar] [CrossRef] [Green Version]
- Schwartz, J.; Riis, J.; Elbel, B.; Ariely, D. Inviting consumers to downsize fast food portions significantly reduces calorie consumption. Health Aff. 2012, 31, 399–407. [Google Scholar] [CrossRef]
- Downs, J.; Wisdom, J.; Wansink, B.; Loewenstein, G. Supplementing menu labeling with calorie recommendations to test for facilitation effects. Am. J. Public Health 2013, 103, 1604–1609. [Google Scholar] [CrossRef] [PubMed]
- Ellison, B.; Lusk, J.; Davis, D. Looking at the label and Beyond: The effects of calorie labels, health consciousness, and demographics on caloric intake in restaurants. Int. J. Behav. Nutr. Phys. Act. 2013, 10, 21. [Google Scholar] [CrossRef] [Green Version]
- Ajzen, I. The theory of planned behavior. Organ. Behav. Hum. Decis. Processes 1991, 50, 179–211. [Google Scholar] [CrossRef]
- Tian, Y.; Yoo, J.H.; Zhou, H. To read or not to read: An extension of the theory of planned behaviour to food label use. Int. J. Consum. Stud. 2022, 46, 984–993. [Google Scholar] [CrossRef]
- Dangi, N.; Gupta, S.K.; Narula, S.A. Consumer buying behaviour and purchase intention of organic food: A conceptual framework. Manag. Environ. Qual. Int. J. 2020, 31, 1515–1530. [Google Scholar] [CrossRef]
- Dionysis, S.; Chesney, T.; McAuley, D. Examining the influential factors of consumer purchase intentions for blockchain traceable coffee using the theory of planned behaviour. Br. Food J. 2022. ahead-of-print. [Google Scholar] [CrossRef]
- Tarkiainen, A.; Sundqvist, S. Subjective norms, attitudes and intentions of Finnish consumers in buying organic food. Br. Food J. 2005, 107, 808–822. [Google Scholar] [CrossRef] [Green Version]
- Kim, Y.J.; Njite, D.; Hancer, M. Anticipated emotion in consumers’ intentions to select eco-friendly restaurants: Augmenting the theory of planned behavior. Int. J. Hosp. Manag. 2013, 34, 255–262. [Google Scholar] [CrossRef]
- Krejcie, R.V.; Morgan, D.W. Determining sample size for research activities. Educ. Psychol. Meas. 1970, 30, 607–610. [Google Scholar] [CrossRef]
- O’Fallon, J.; Gursoy, D.; Swanger, N. To buy or not to buy: Impact of labeling on purchasing intentions of genetically modified foods. Int. J. Hosp. Manag. 2007, 26, 117–130. [Google Scholar] [CrossRef]
- Ajzen, I.; Fishbein, M. Understanding Attitudes and Predicting Social Behaviour; Prentice-Hall, Inc.: Englewood Cliffs, NJ, USA, 1980. [Google Scholar]
- Ajzen, I. Attitude, Personality and Behavior; Dorsey Press: Chicago, IL, USA, 1988. [Google Scholar]
- Cavana, Y.; Delahaye, L.; Sekaran, U. Applied Business Research: Qualitative and Quantitative Methods; John Wiley and Sons, Inc.: Brisbane, QLD, Australia, 2001. [Google Scholar]
- Frazer, L.; Lawley, M. Questionnaire Design and Administration: A Practical Guide; John Wiley and Sons, Inc.: Brisbane, QLD, Australia, 2000. [Google Scholar]
- Sierles, S. How to do research with self-administered surveys. Acad. Psychiatry 2003, 27, 104–113. [Google Scholar] [CrossRef]
- Tabachnick, B.; Fidell, L. Using Multivariate Statistics, 5th ed.; Pearson: New York, NY, USA, 2007. [Google Scholar]
- Pedhazur, E.; Schmelkin, L. Measurement, Design and Analysis: An Integrated Approach; Holt, Rinehart & Winston: New York, NY, USA, 1991. [Google Scholar]
- Roussel, P. Méthodes de Développement d’Échelles pour Questionnaires d’Enquête. In Management des Ressources Hu-maines: Méthodes de Recherche en Sciences Humaines et Sociales; Roussel, P., Wacheux, F., Eds.; De Boeck Supérieur: Paris, France, 2005; pp. 245–276. [Google Scholar]
- Bentler, P.M.; Bonett, D.G. Significance tests and goodness of fit in the analysis of covariance structures. Psychol. Bull. 1980, 88, 588. [Google Scholar] [CrossRef]
- Fornell, C.; Larcker, D.F. Structural equation models with unobservable variables and measurement error: Algebra and statistics. J. Mark. Res. 1981, 18, 382–388. [Google Scholar] [CrossRef]
- Hair, J.; Anderson, R.; Tatham, R.; Black, W. Multivariate Data Analysis; Prentice Hall: Saddle River, NJ, USA, 2014. [Google Scholar]
- Nunnally, J.C. Psychometric Theory, 2nd ed.; McGraw-Hill: New York, NY, USA, 1978. [Google Scholar]
- Syed, A.; Nazura, S. Applying the theory of planned behaviour (TPB) in Halal food purchasing. Int. J. Commer. Manag. 2011, 21, 8–20. [Google Scholar]
- Khan, M.A.; Sobaih, A.E.; Lee, K.; Ha, I. Cultural differences and McDonald’s: A multi-country comparative study. Int. J. Bus. Glob. 2022, in press. [Google Scholar]
- Hofstede, G. Dimensionalizing cultures: The Hofstede model in context. Online Read. Psychol. Cult. 2011, 2, 2307-0919. [Google Scholar] [CrossRef]
- Han, H.; Hsu, J.; Sheu, C. Application of the theory of planned behavior to green hotel choice: Testing the effect of environmental friendly activities. Tour. Manage 2010, 31, 325–334. [Google Scholar] [CrossRef]
- Teng, M.; Wu, S.; Liu, H. Integrating altruism and the theory of planned behavior to predict patronage intention of a green hotel. J. Hosp. Tour. Res. 2015, 39, 299–315. [Google Scholar] [CrossRef]

Publisher’s Note: MDPI stays neutral with regard to jurisdictional claims in published maps and institutional affiliations. |
© 2022 by the authors. Licensee MDPI, Basel, Switzerland. This article is an open access article distributed under the terms and conditions of the Creative Commons Attribution (CC BY) license (https://creativecommons.org/licenses/by/4.0/).