Synergic Benefits of Air Pollutant Reduction, CO2 Emission Abatement, and Water Saving under the Goal of Achieving Carbon Emission Peak: The Case of Tangshan City, China
Abstract
:1. Introduction
2. Materials and Methods
2.1. LEAP Model
2.2. The Prediction of Water Consumption and Water Saving
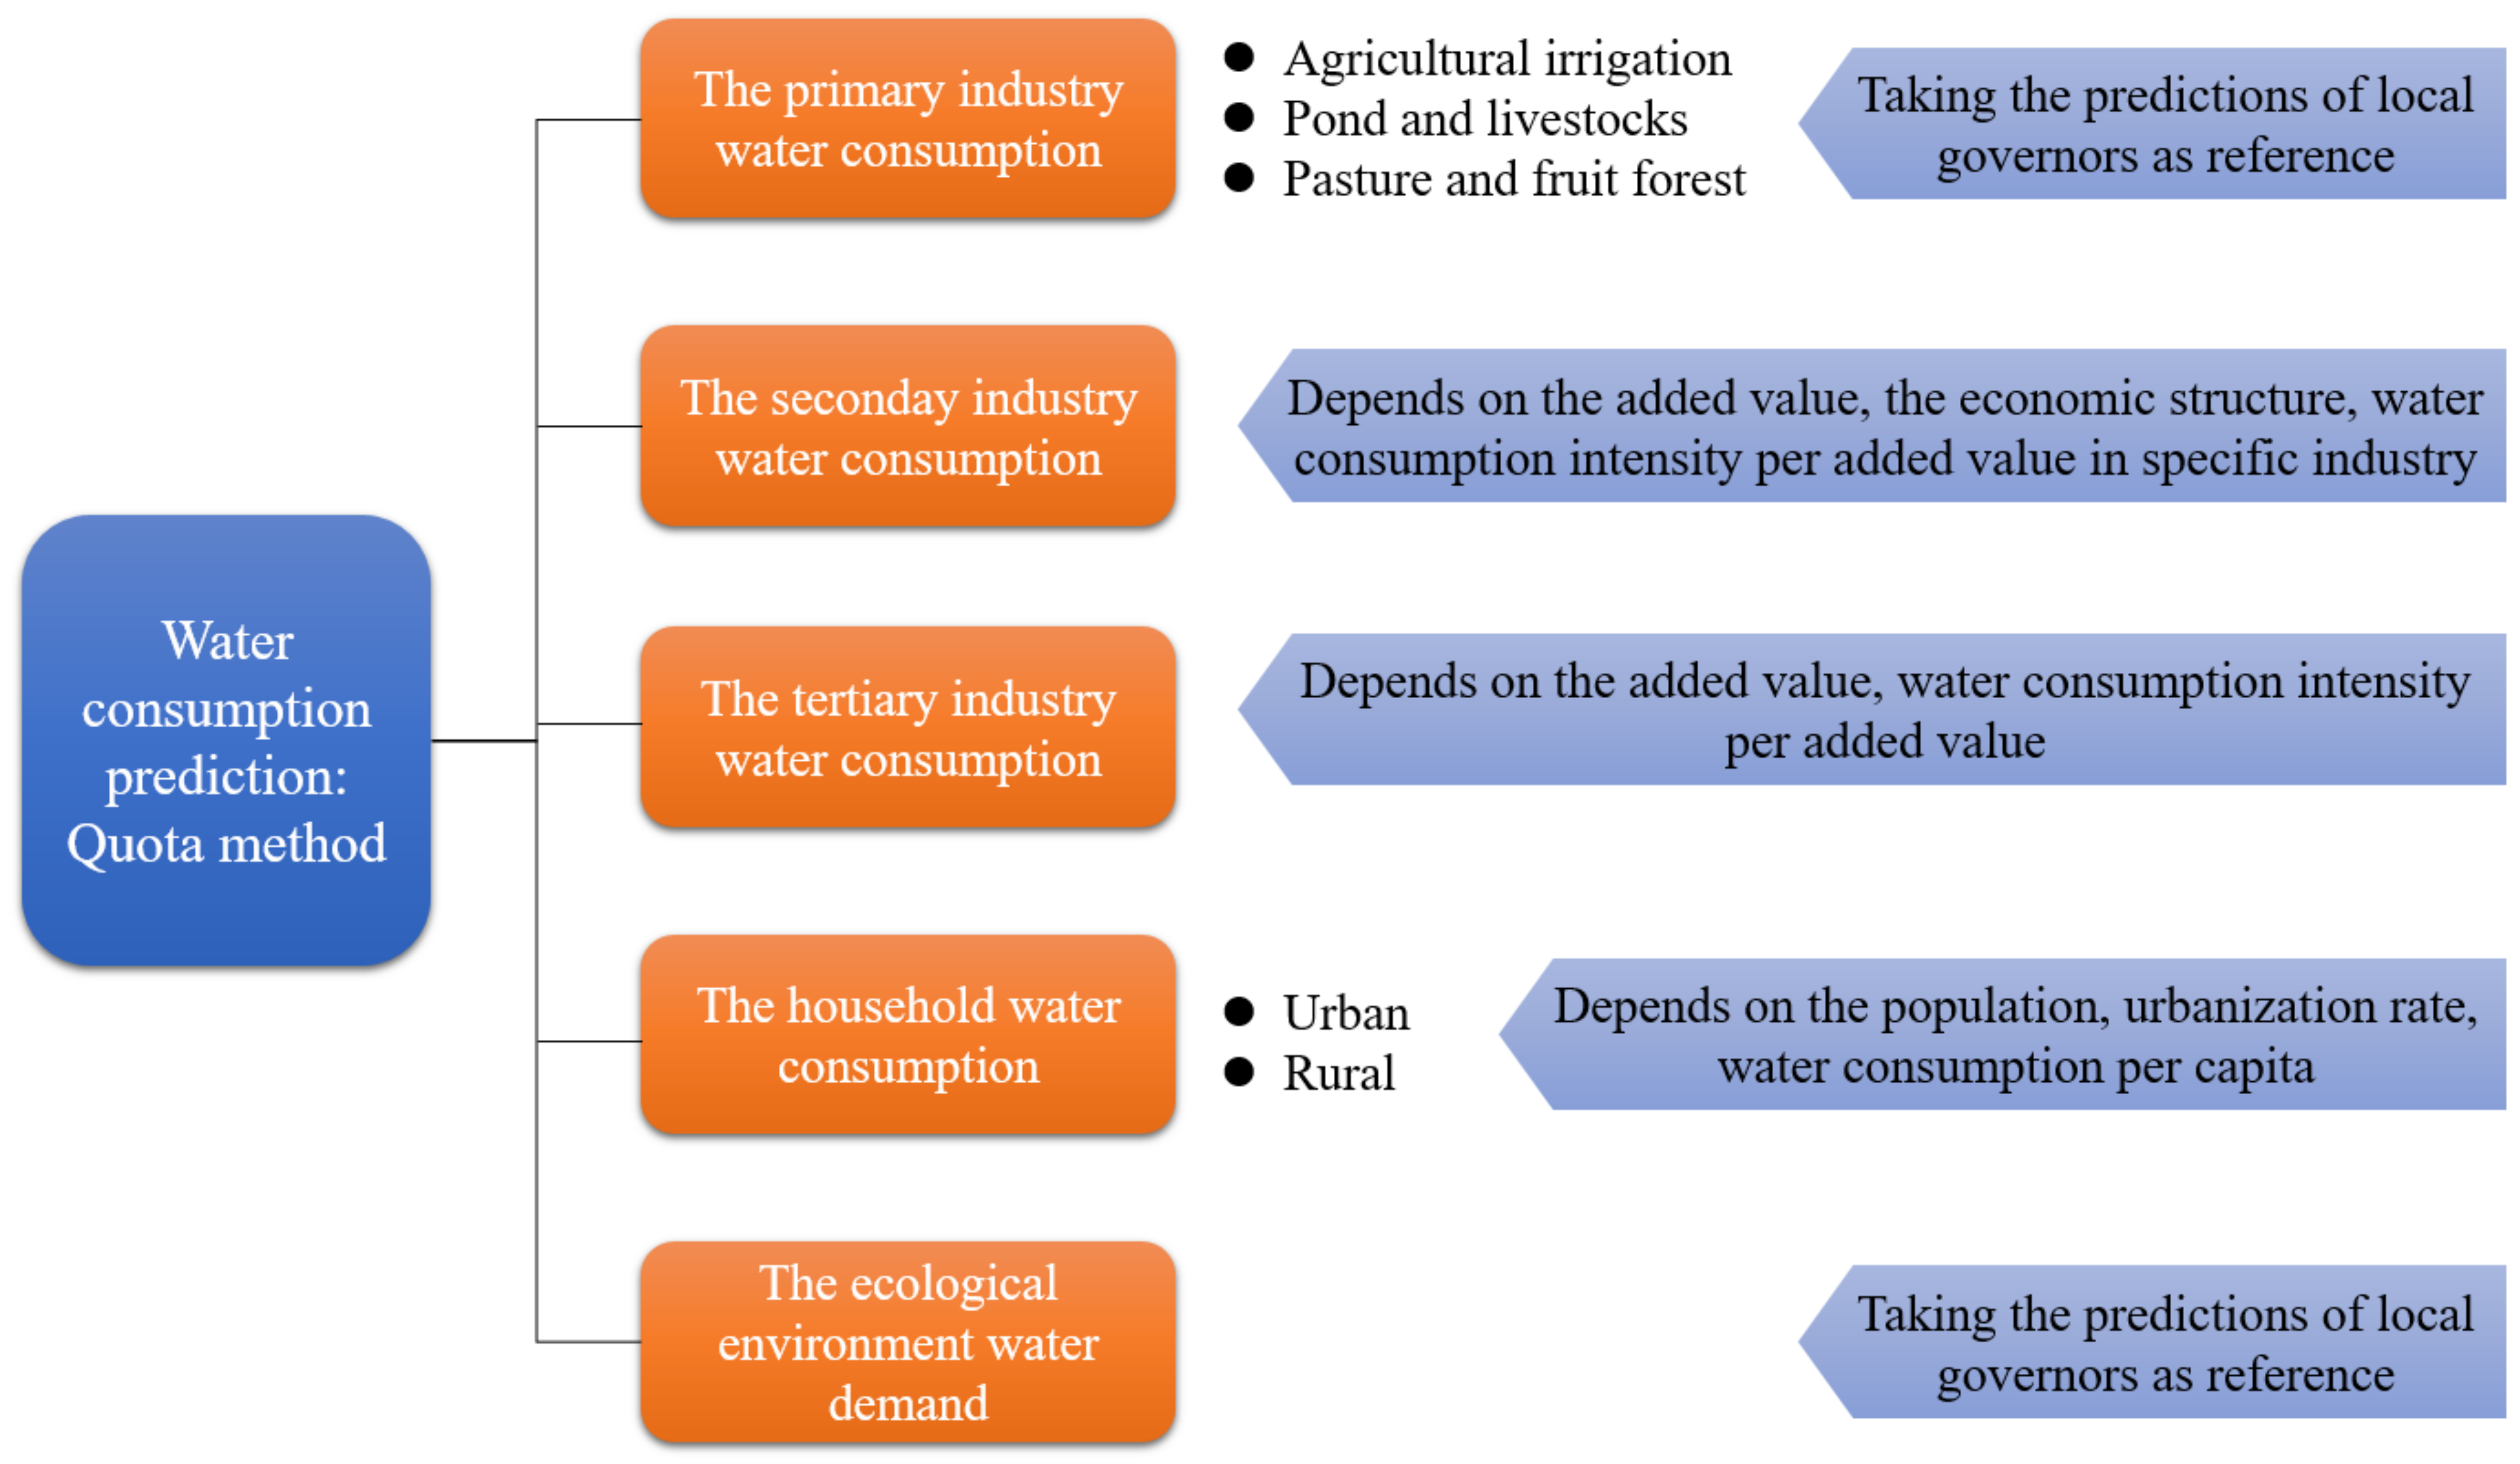
2.2.1. The Water Consumption Prediction
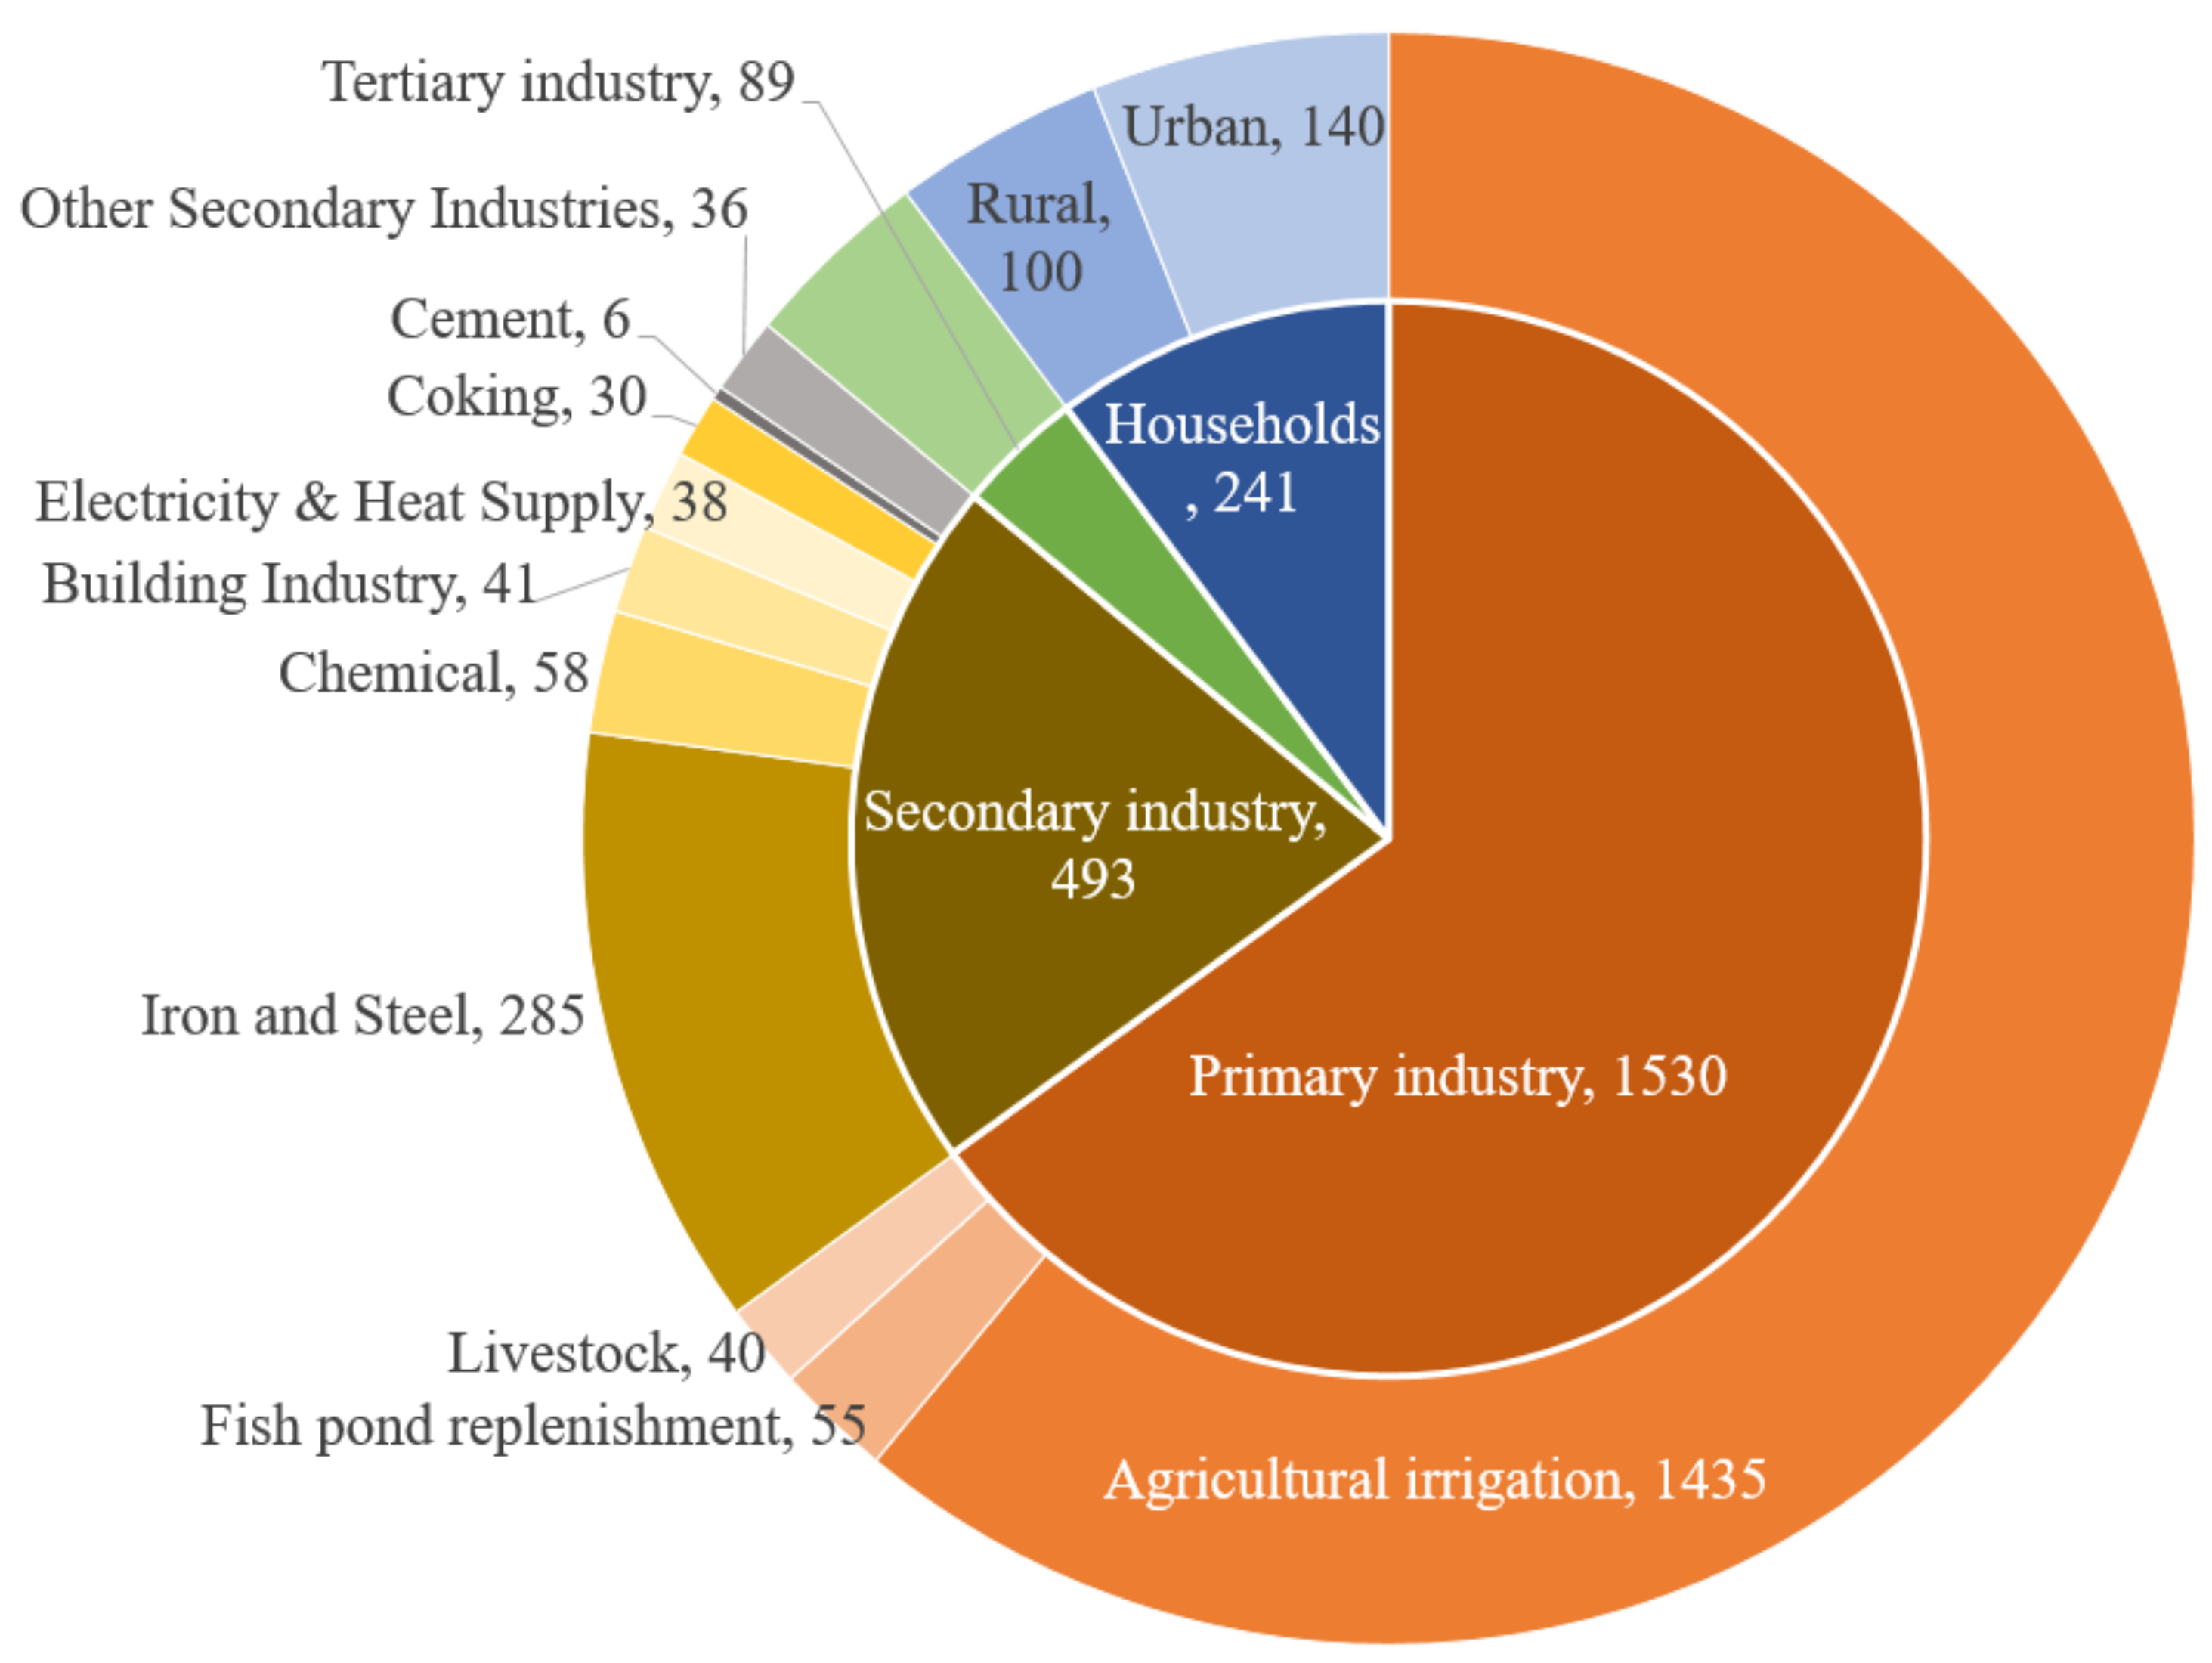
2.2.2. The Water Saving
- Adjusting the economic structure to promote low-emission high-efficiency industries or products. For instance, extending the steel industry chain and developing high value-added special steel products, which can greatly reduce the water consumption per added value.
- Controlling the output of the main products of high-consumption and high-emission industries.
- Shifting toward low-emission process techniques. For example, electric furnace short steelmaking processes is much more environmentally friendly compared with the current long process technology. Additionally, the corresponding water consumption per crude steel differs considerably.
- Improving energy efficiency. The energy efficiency improvement in the secondary industry can usually lead to water savings. As an example, the cooling water demand might be reduced when more energy can be recycled.
2.3. Synergic Reduction Effect
2.4. Data Collection
3. Scenario Design
4. Results
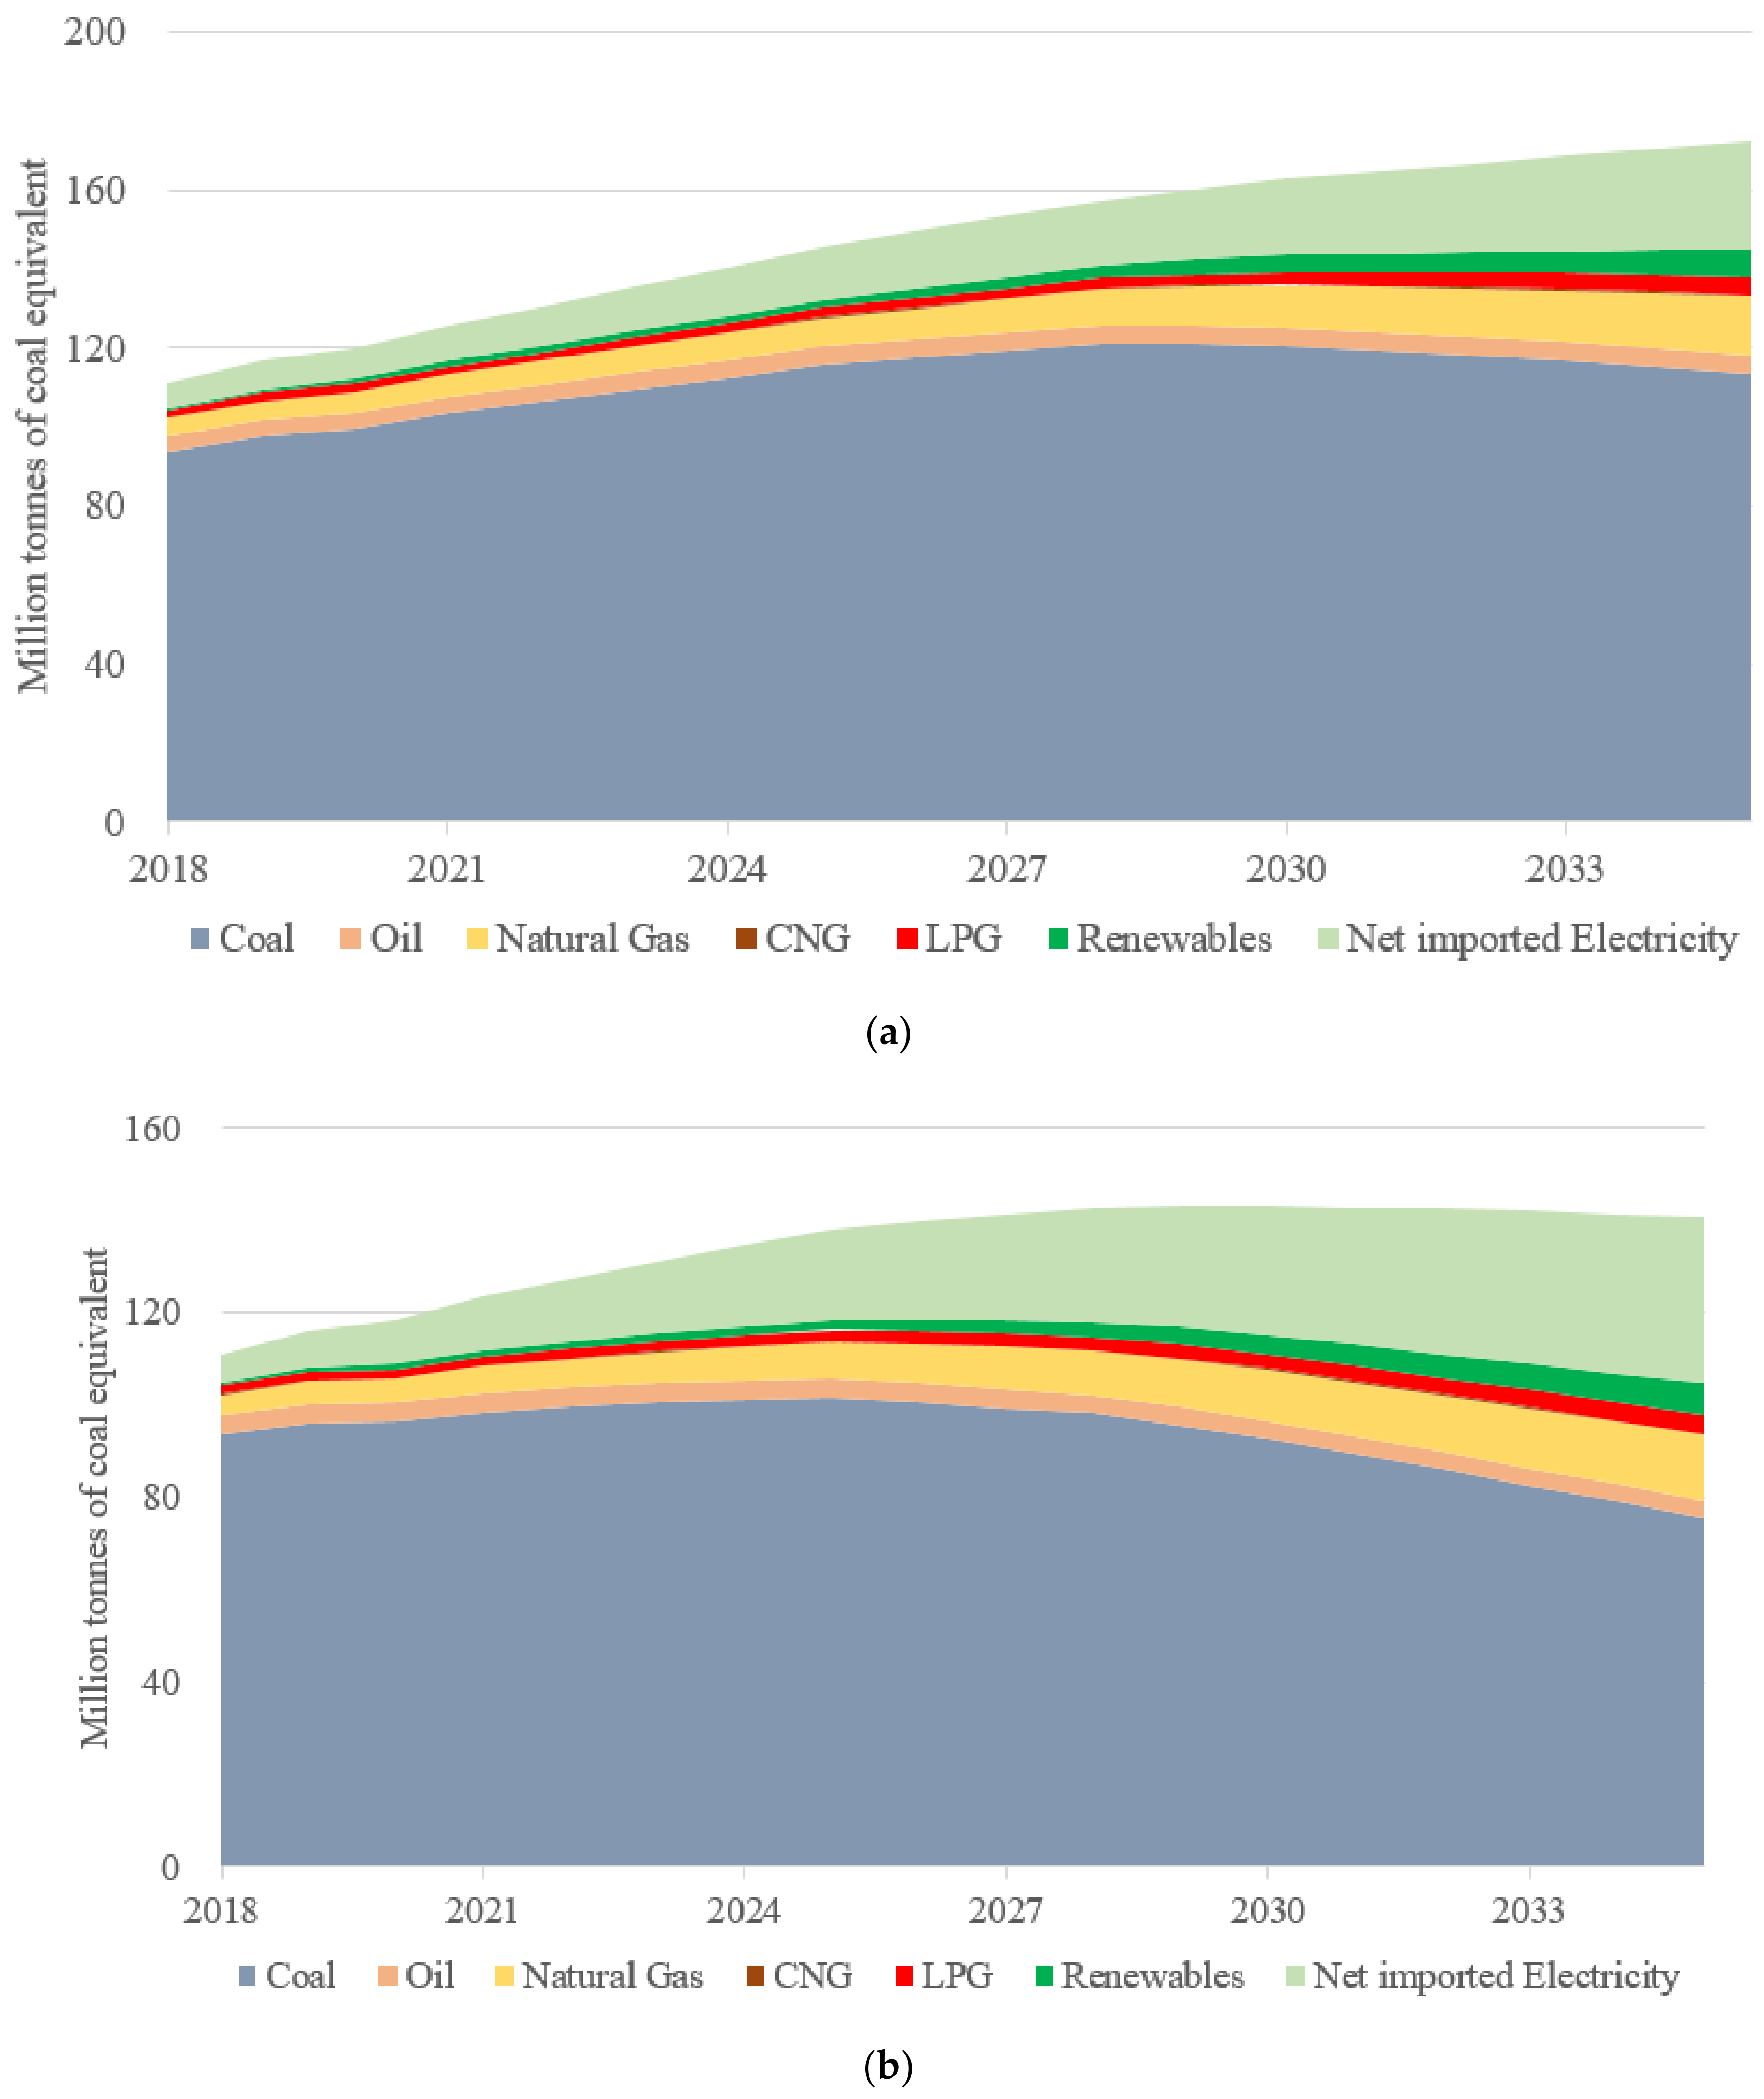
4.1. Energy Consumption
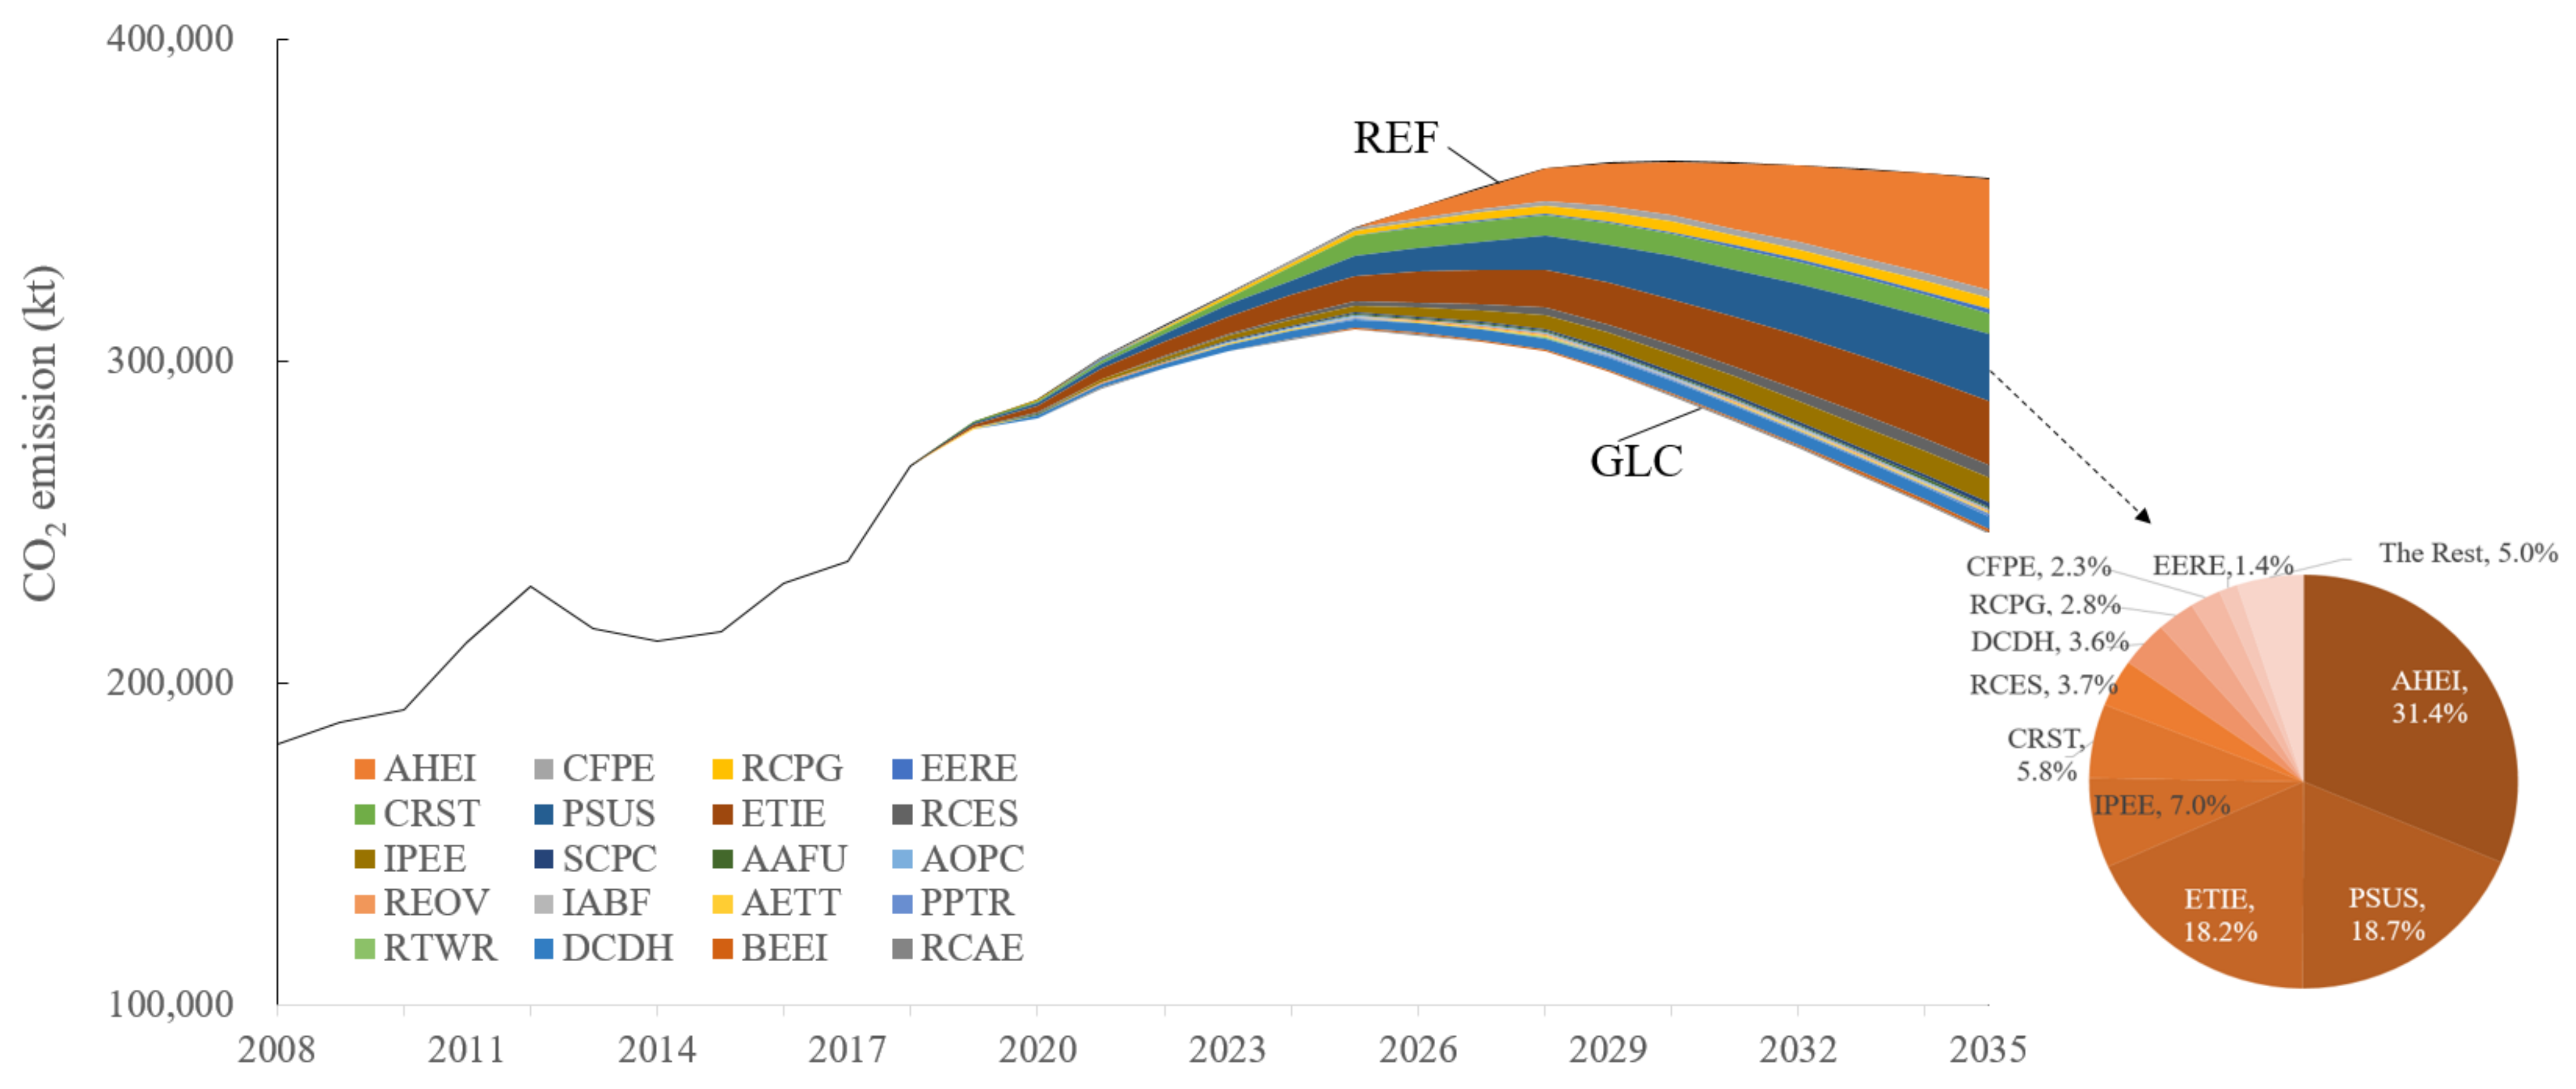
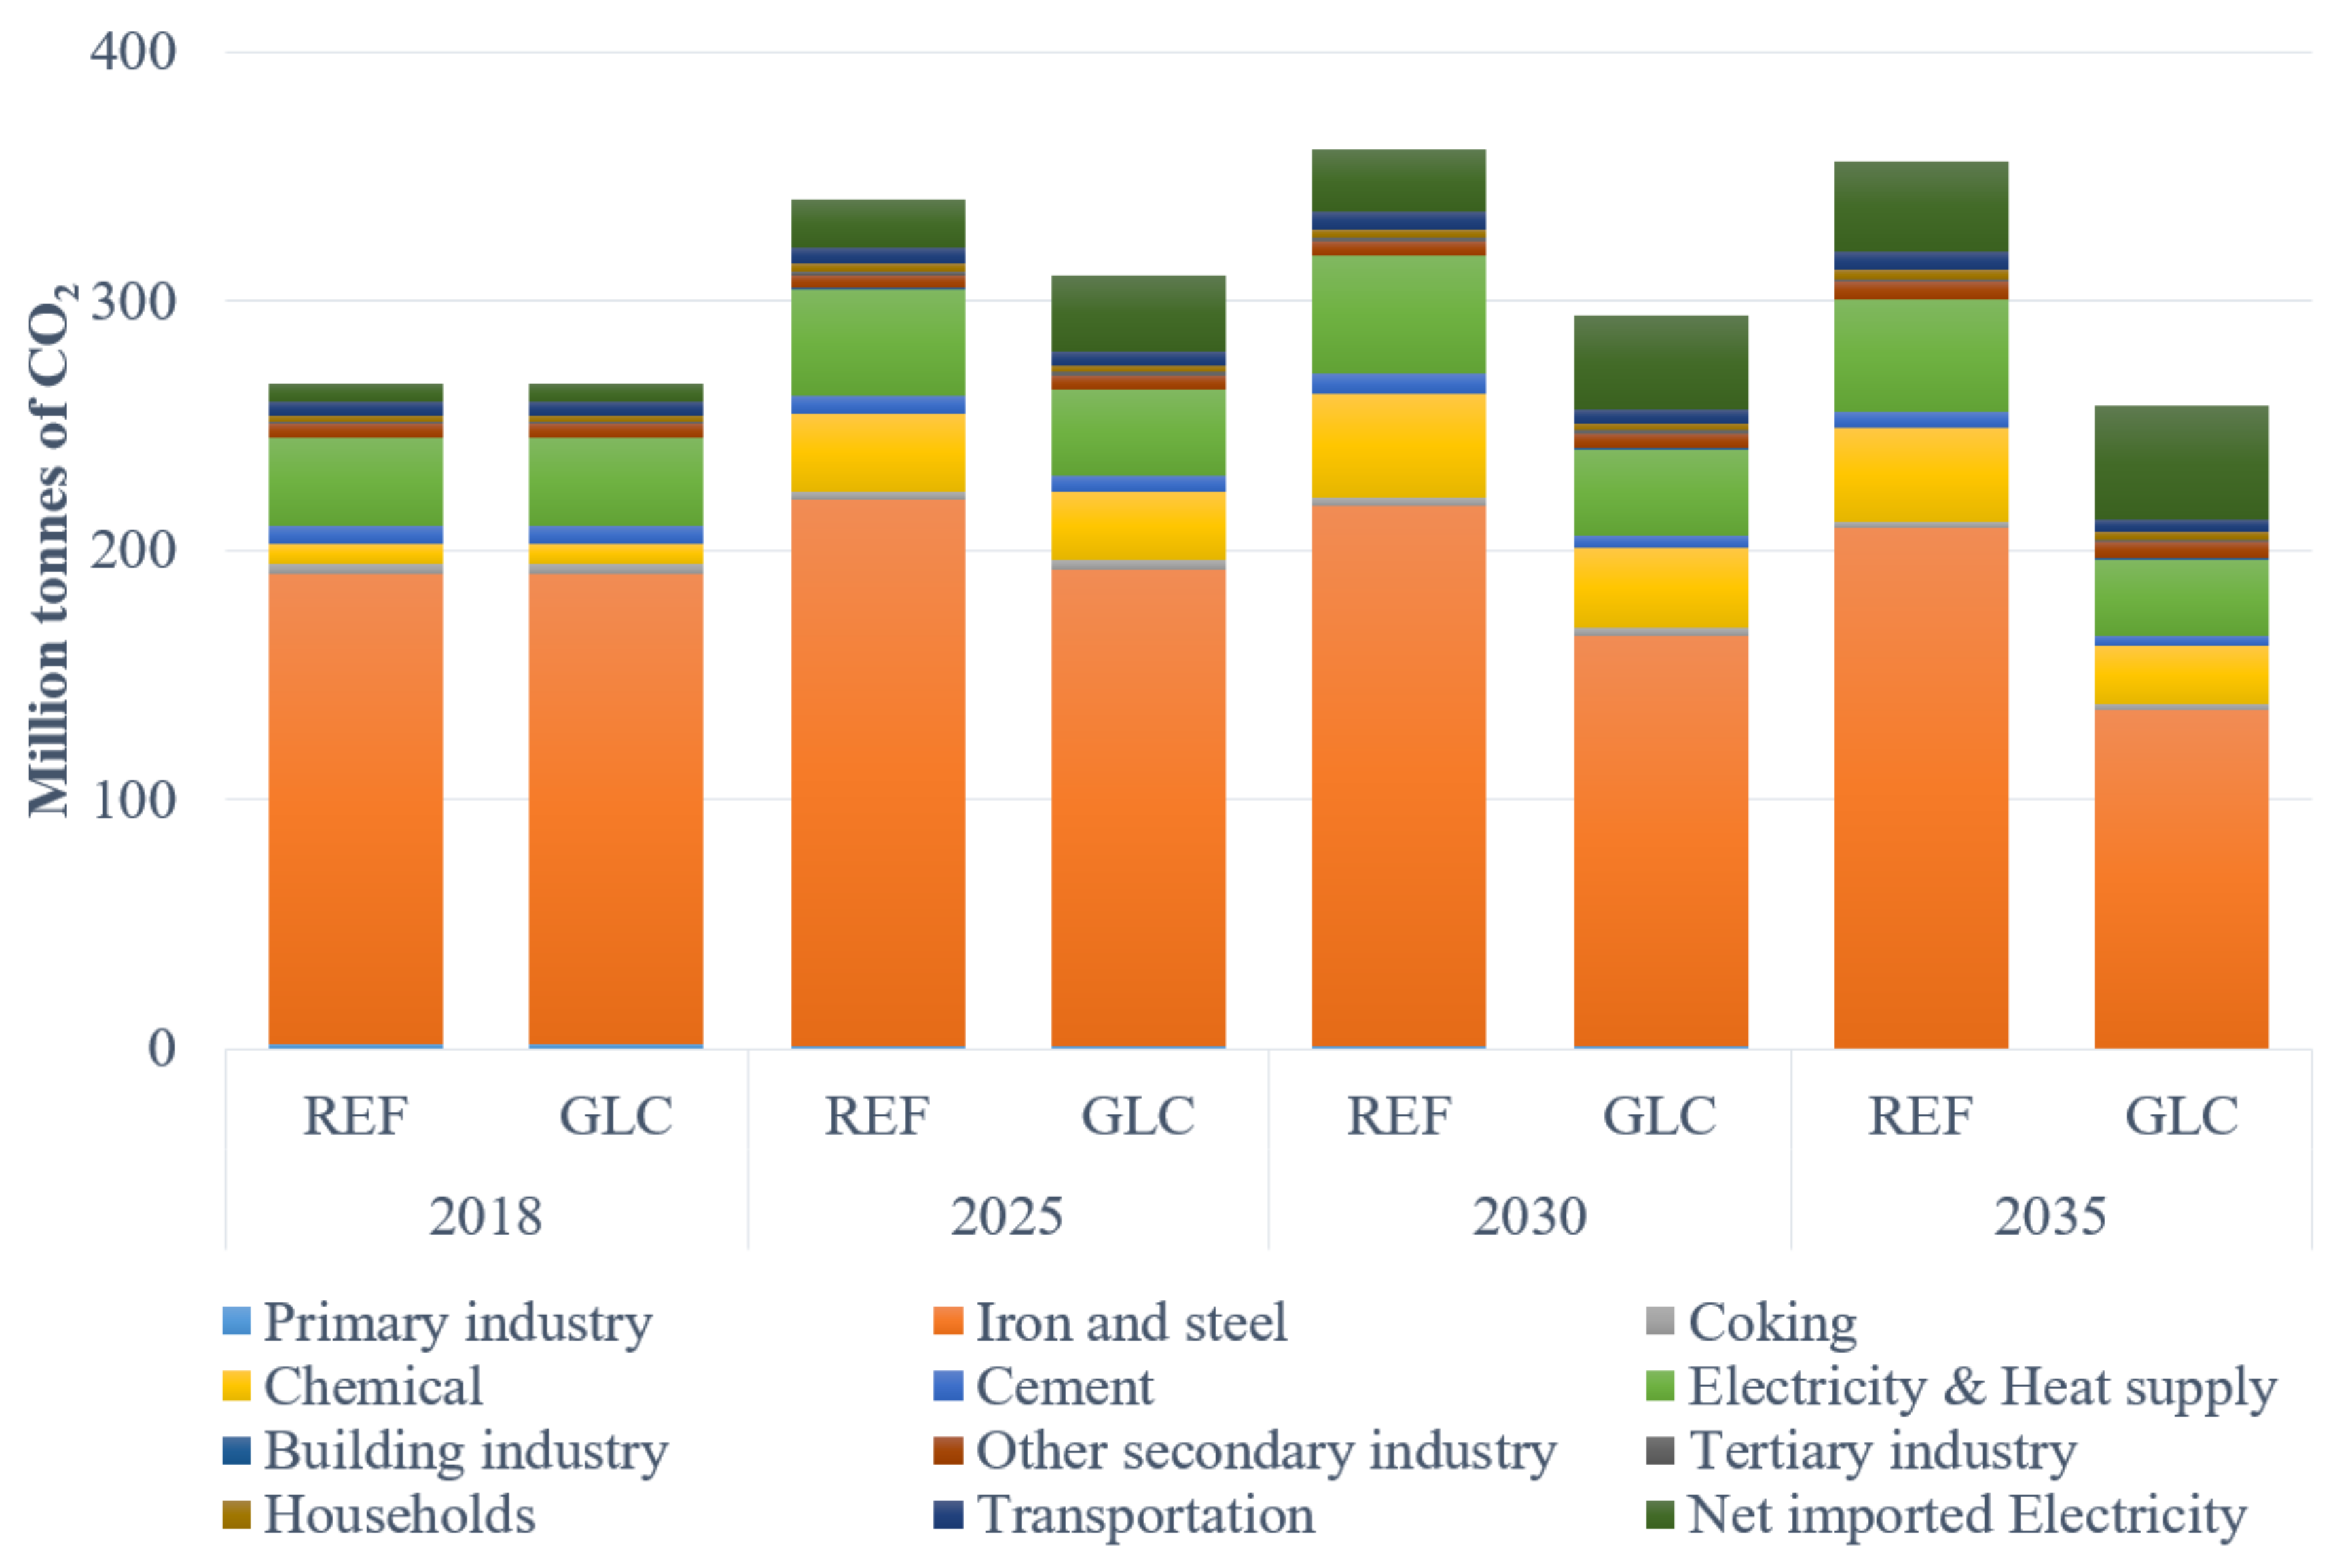
4.2. CO2 Emission
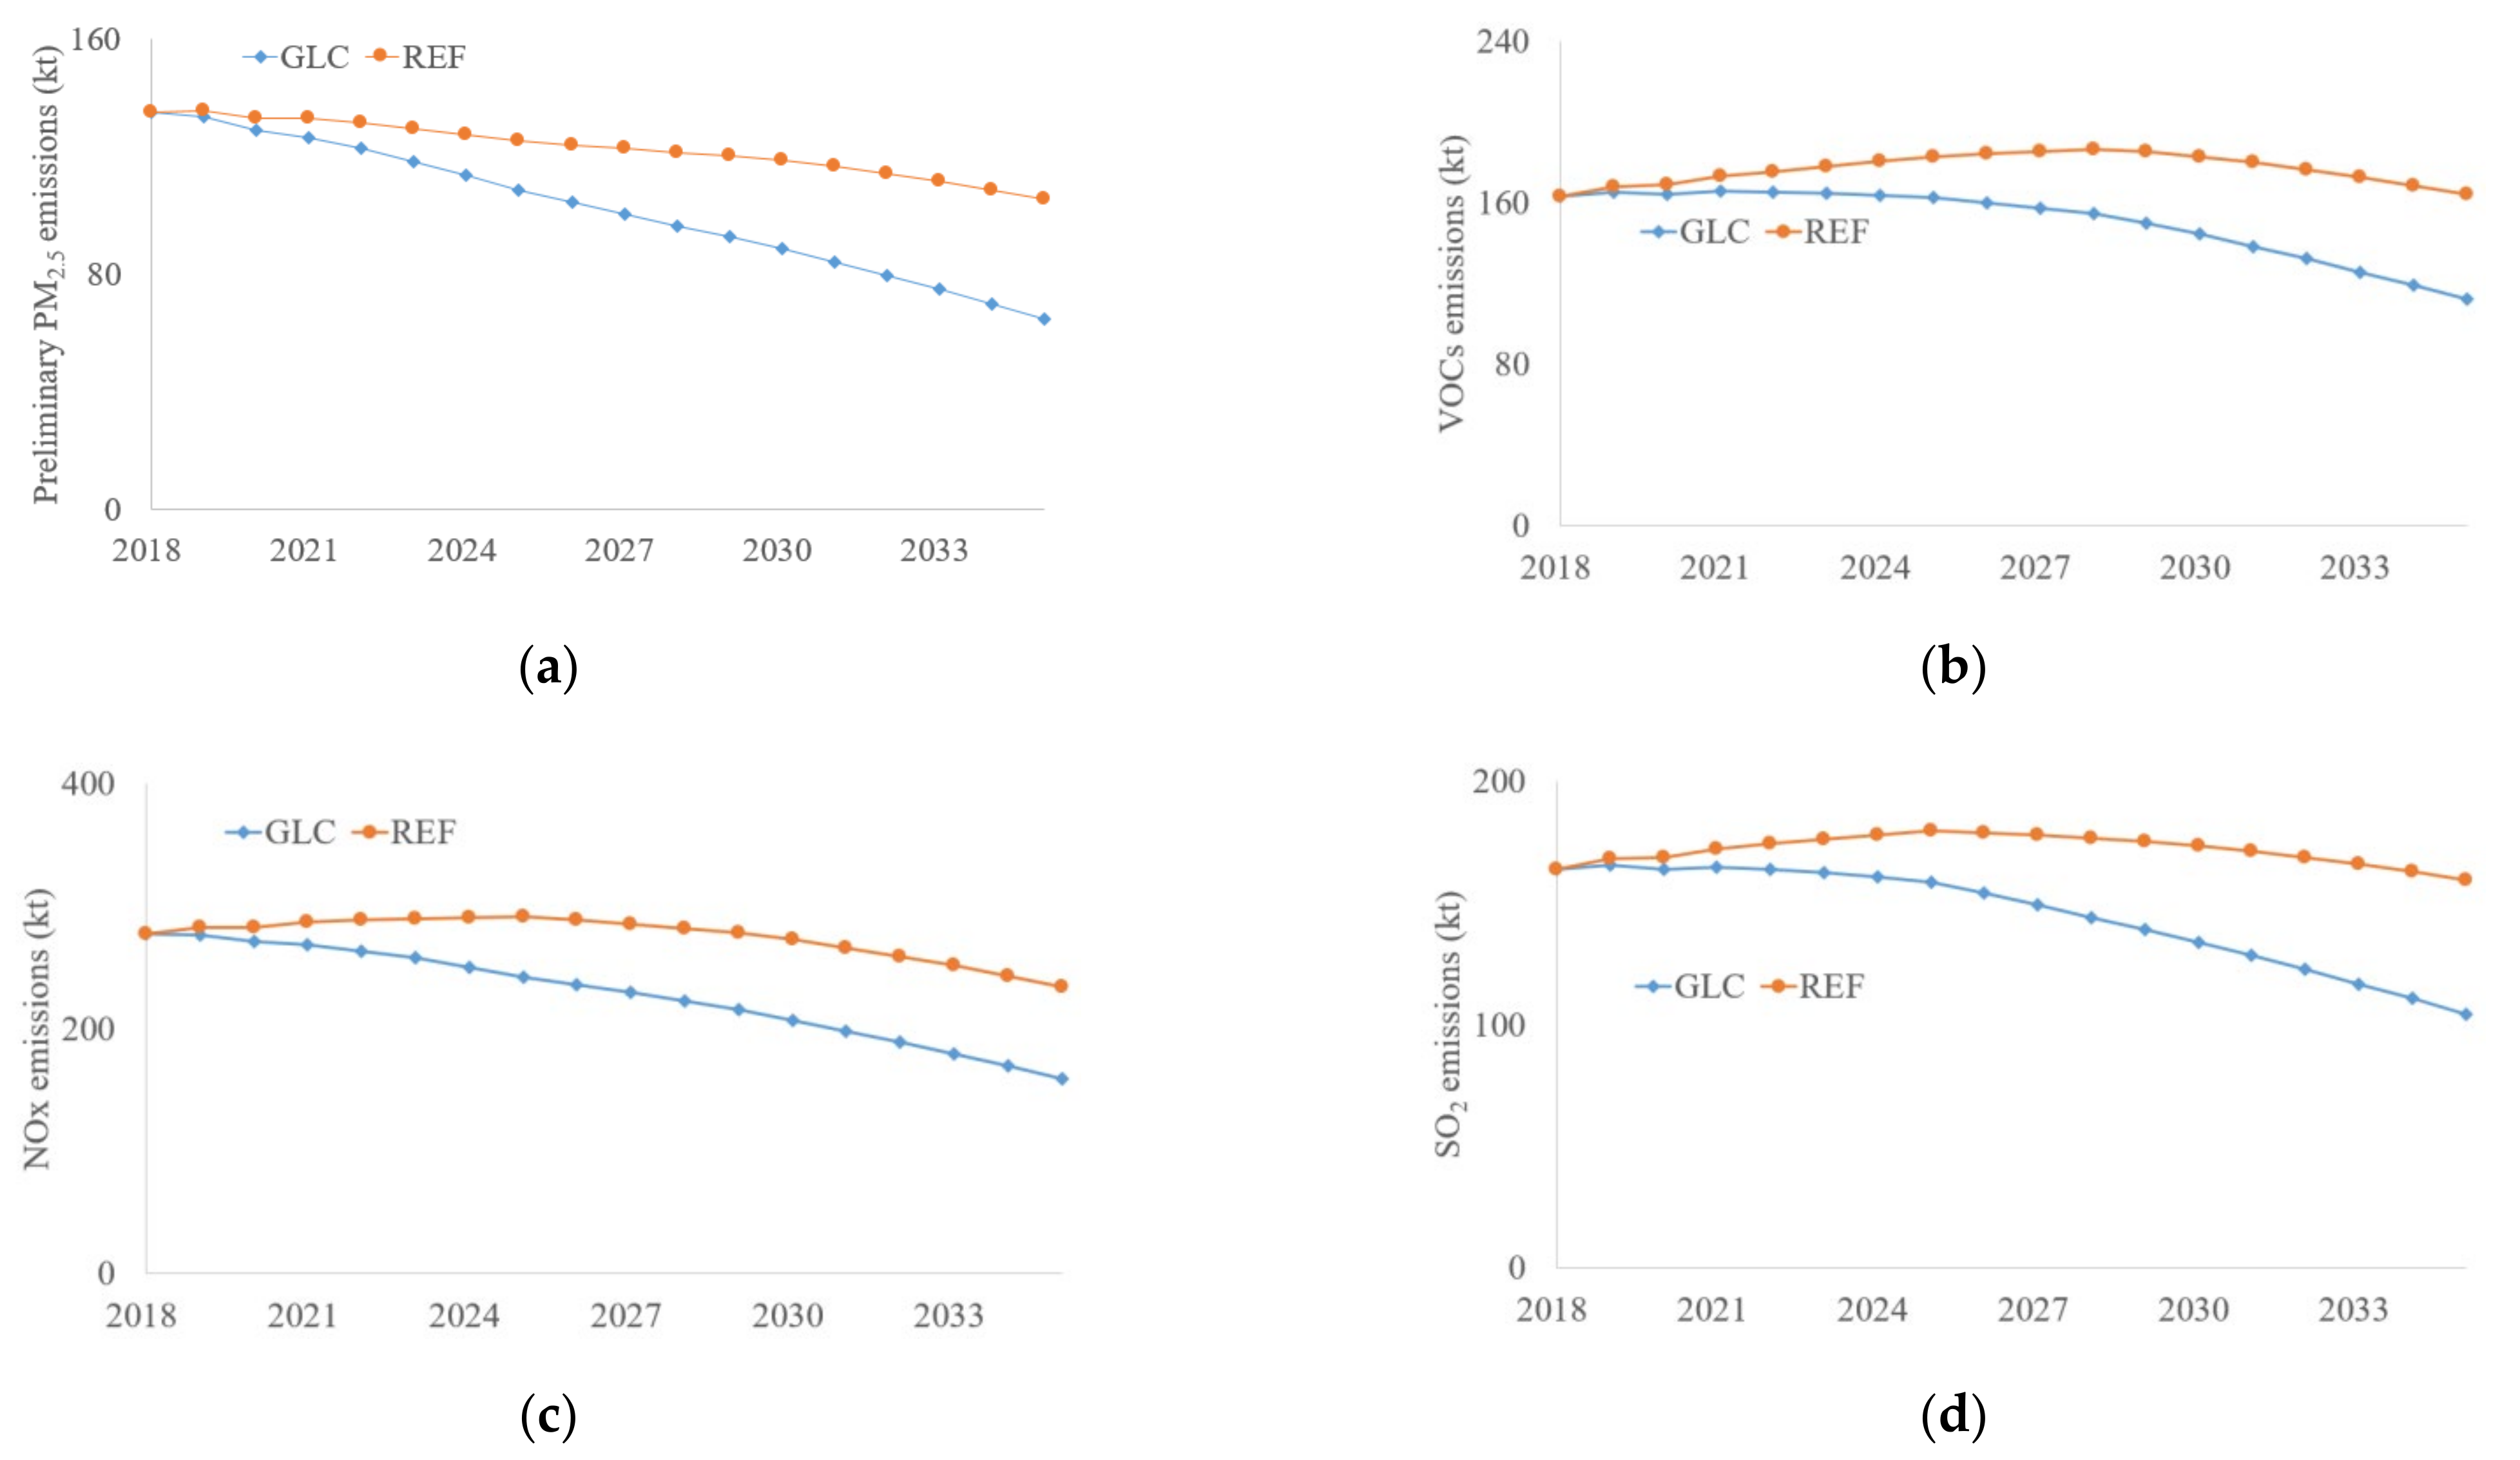
4.3. Air Pollutants Emissions
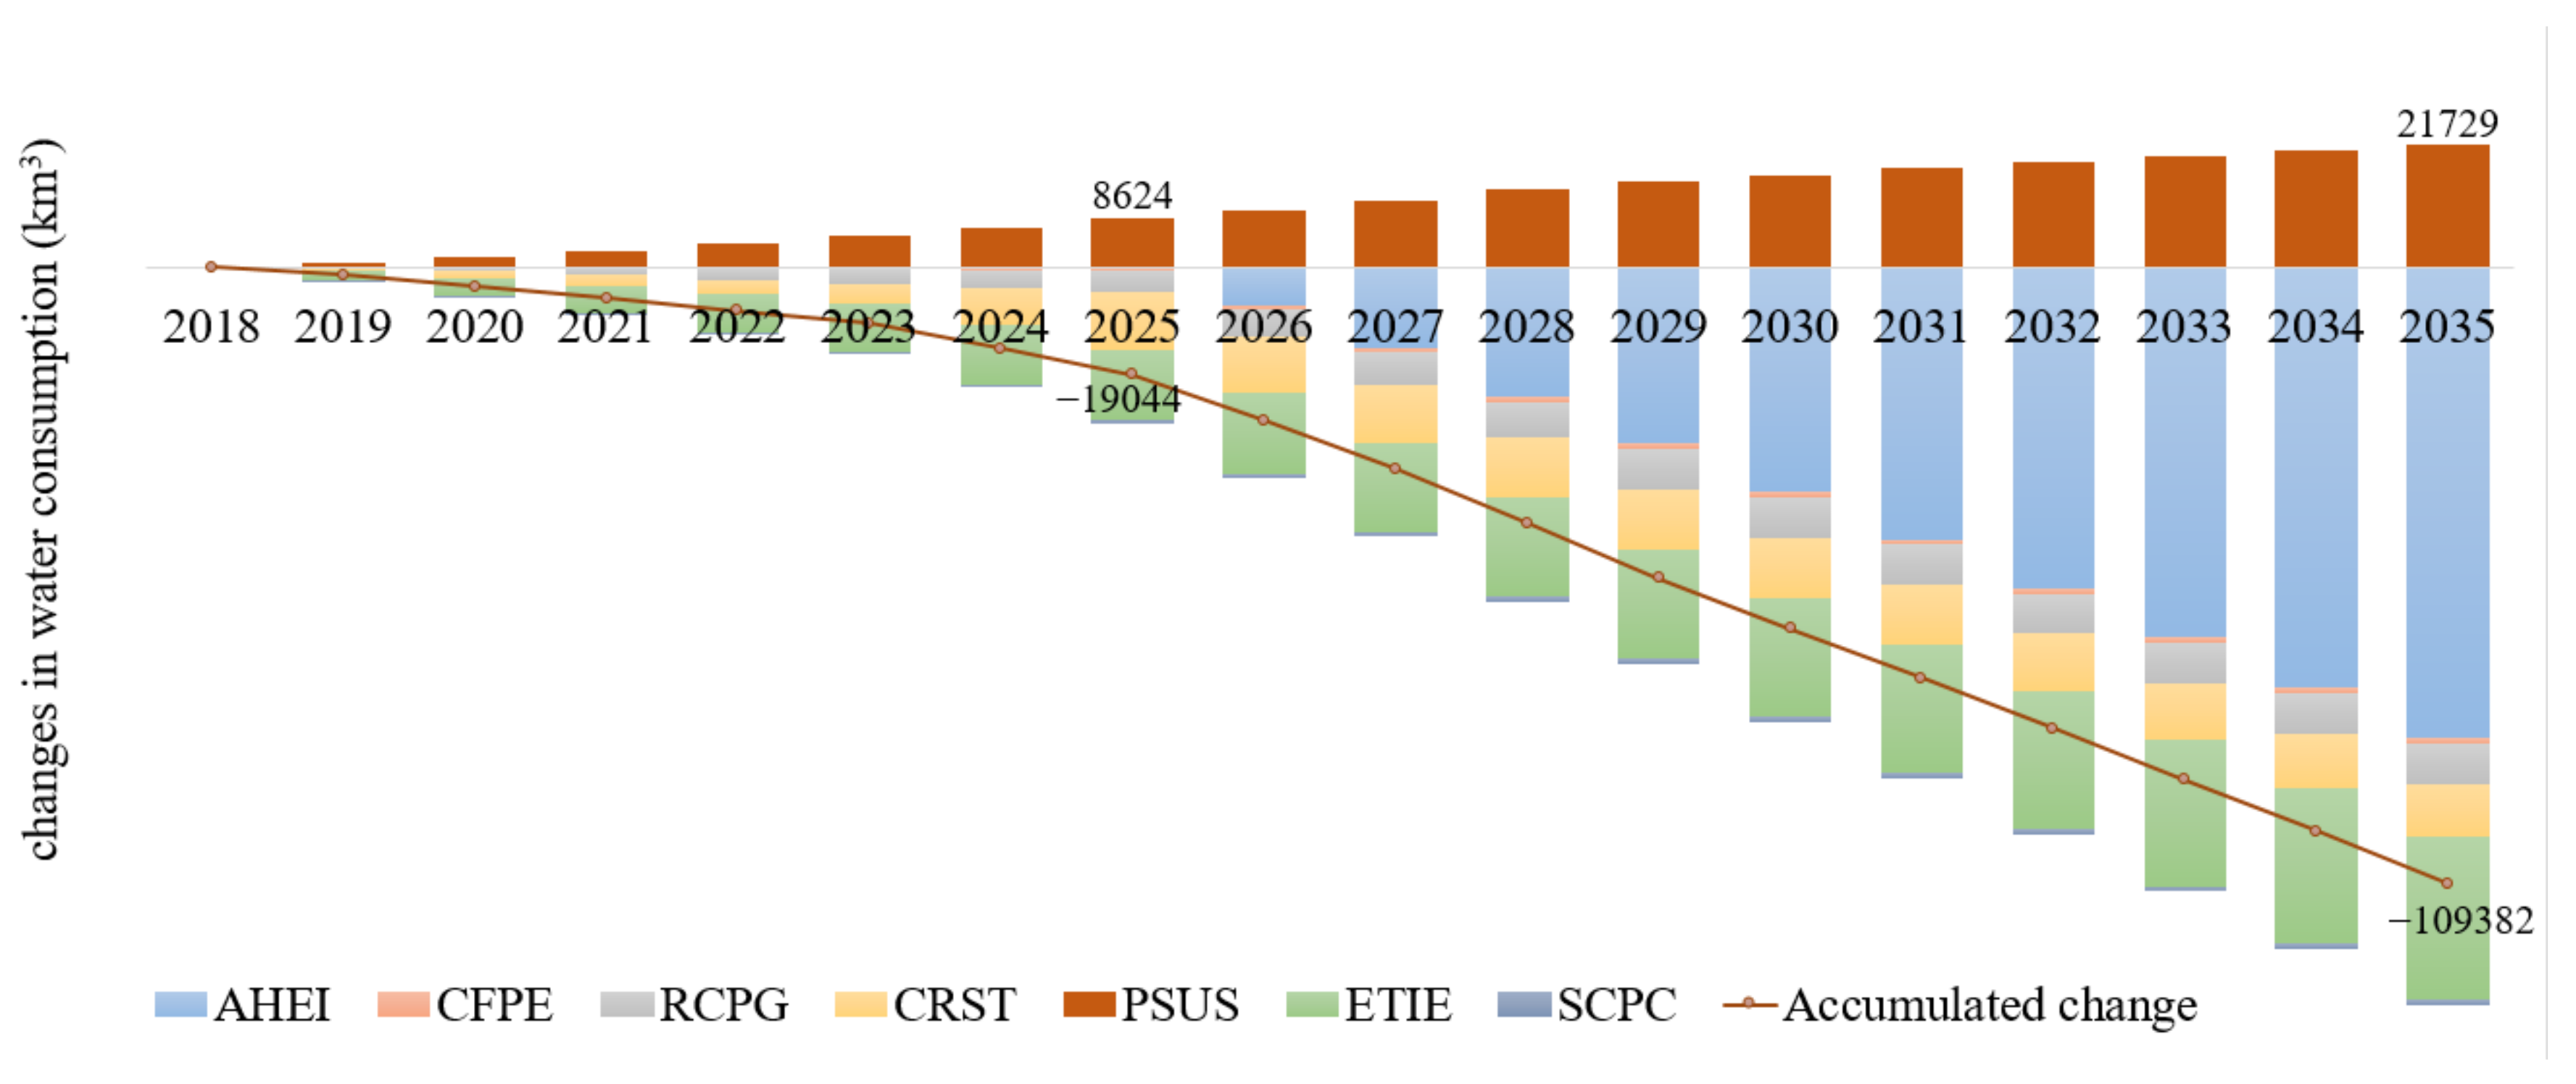
4.4. Saved Water
4.5. Synergic Reduction Analysis
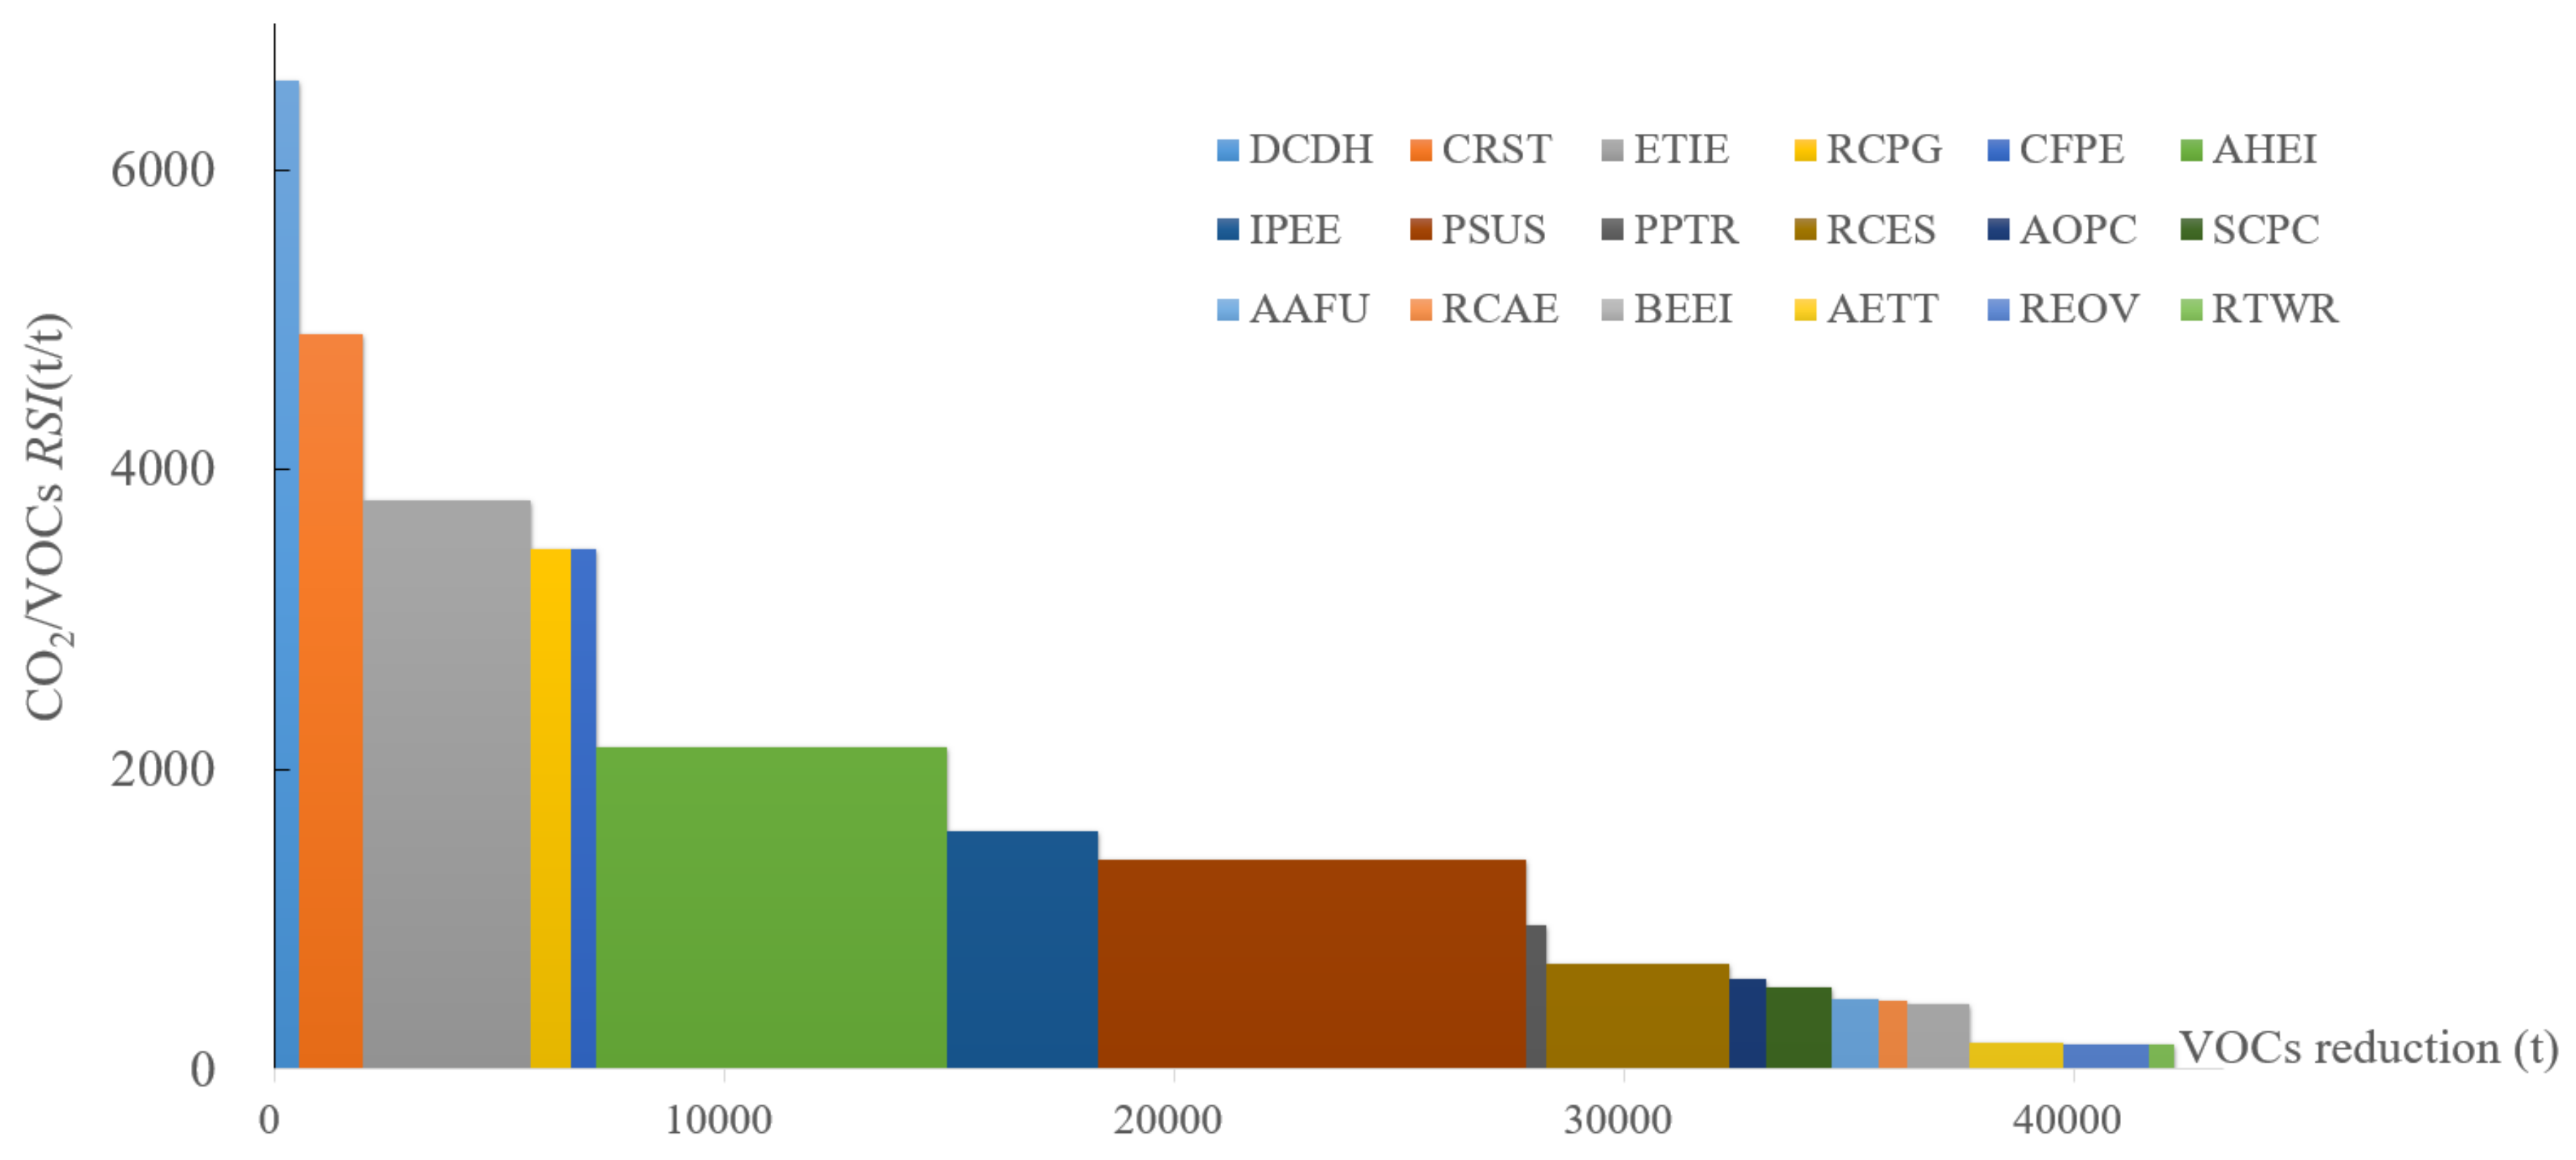
4.5.1. VOCs and CO2 Emission
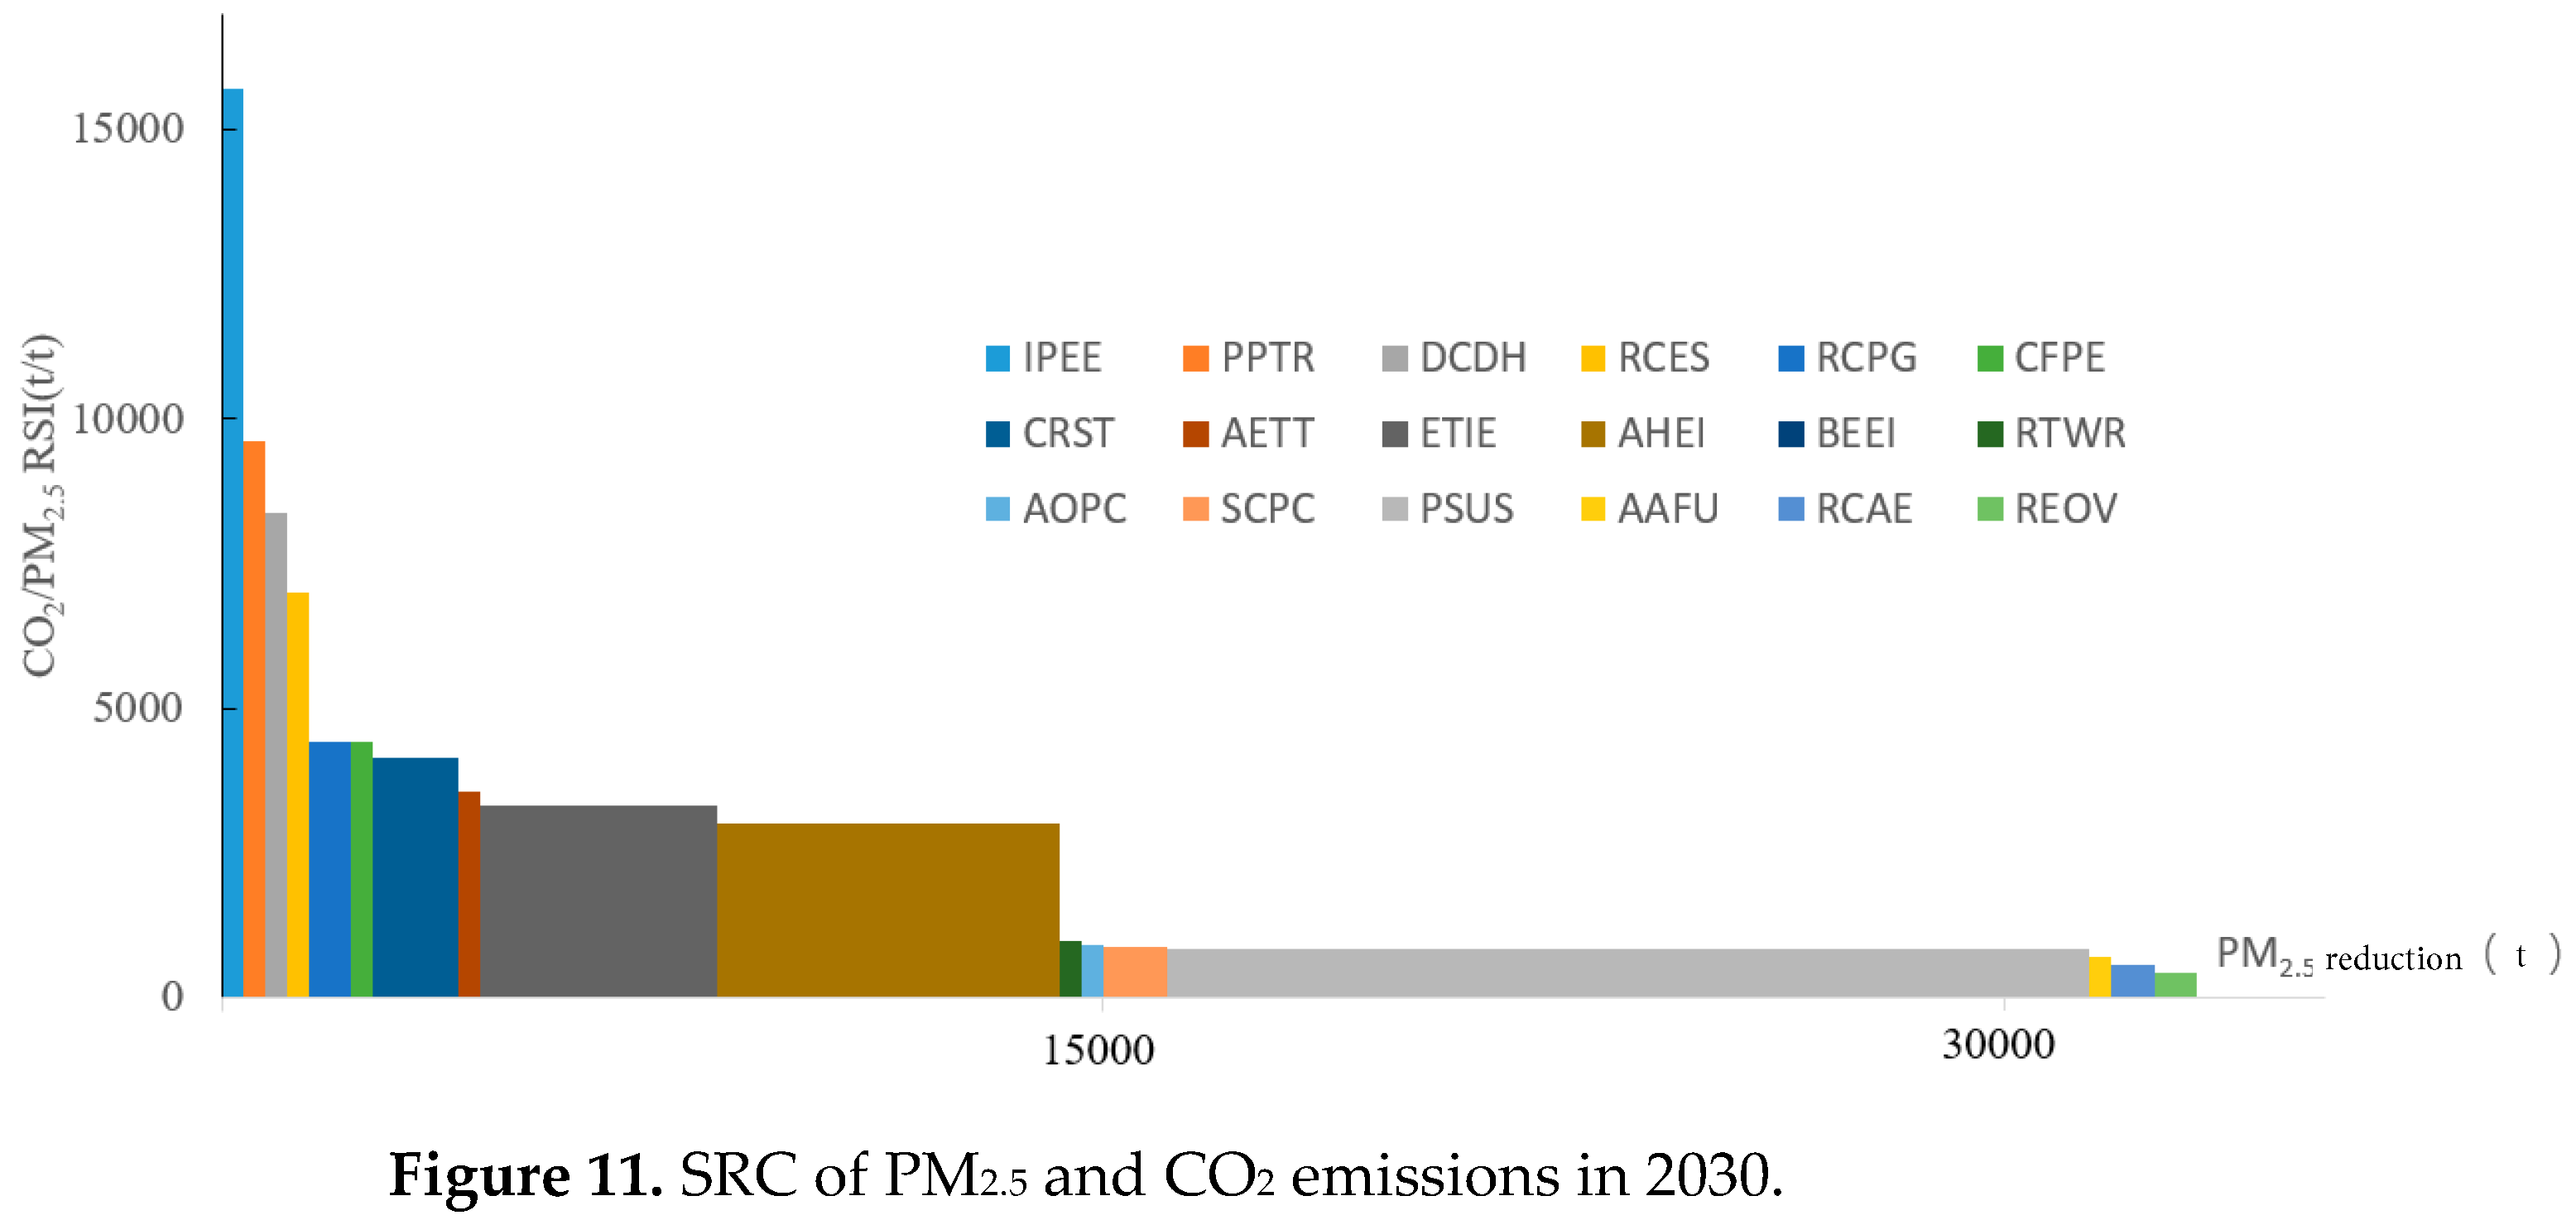
4.5.2. PM2.5 and CO2 Emission
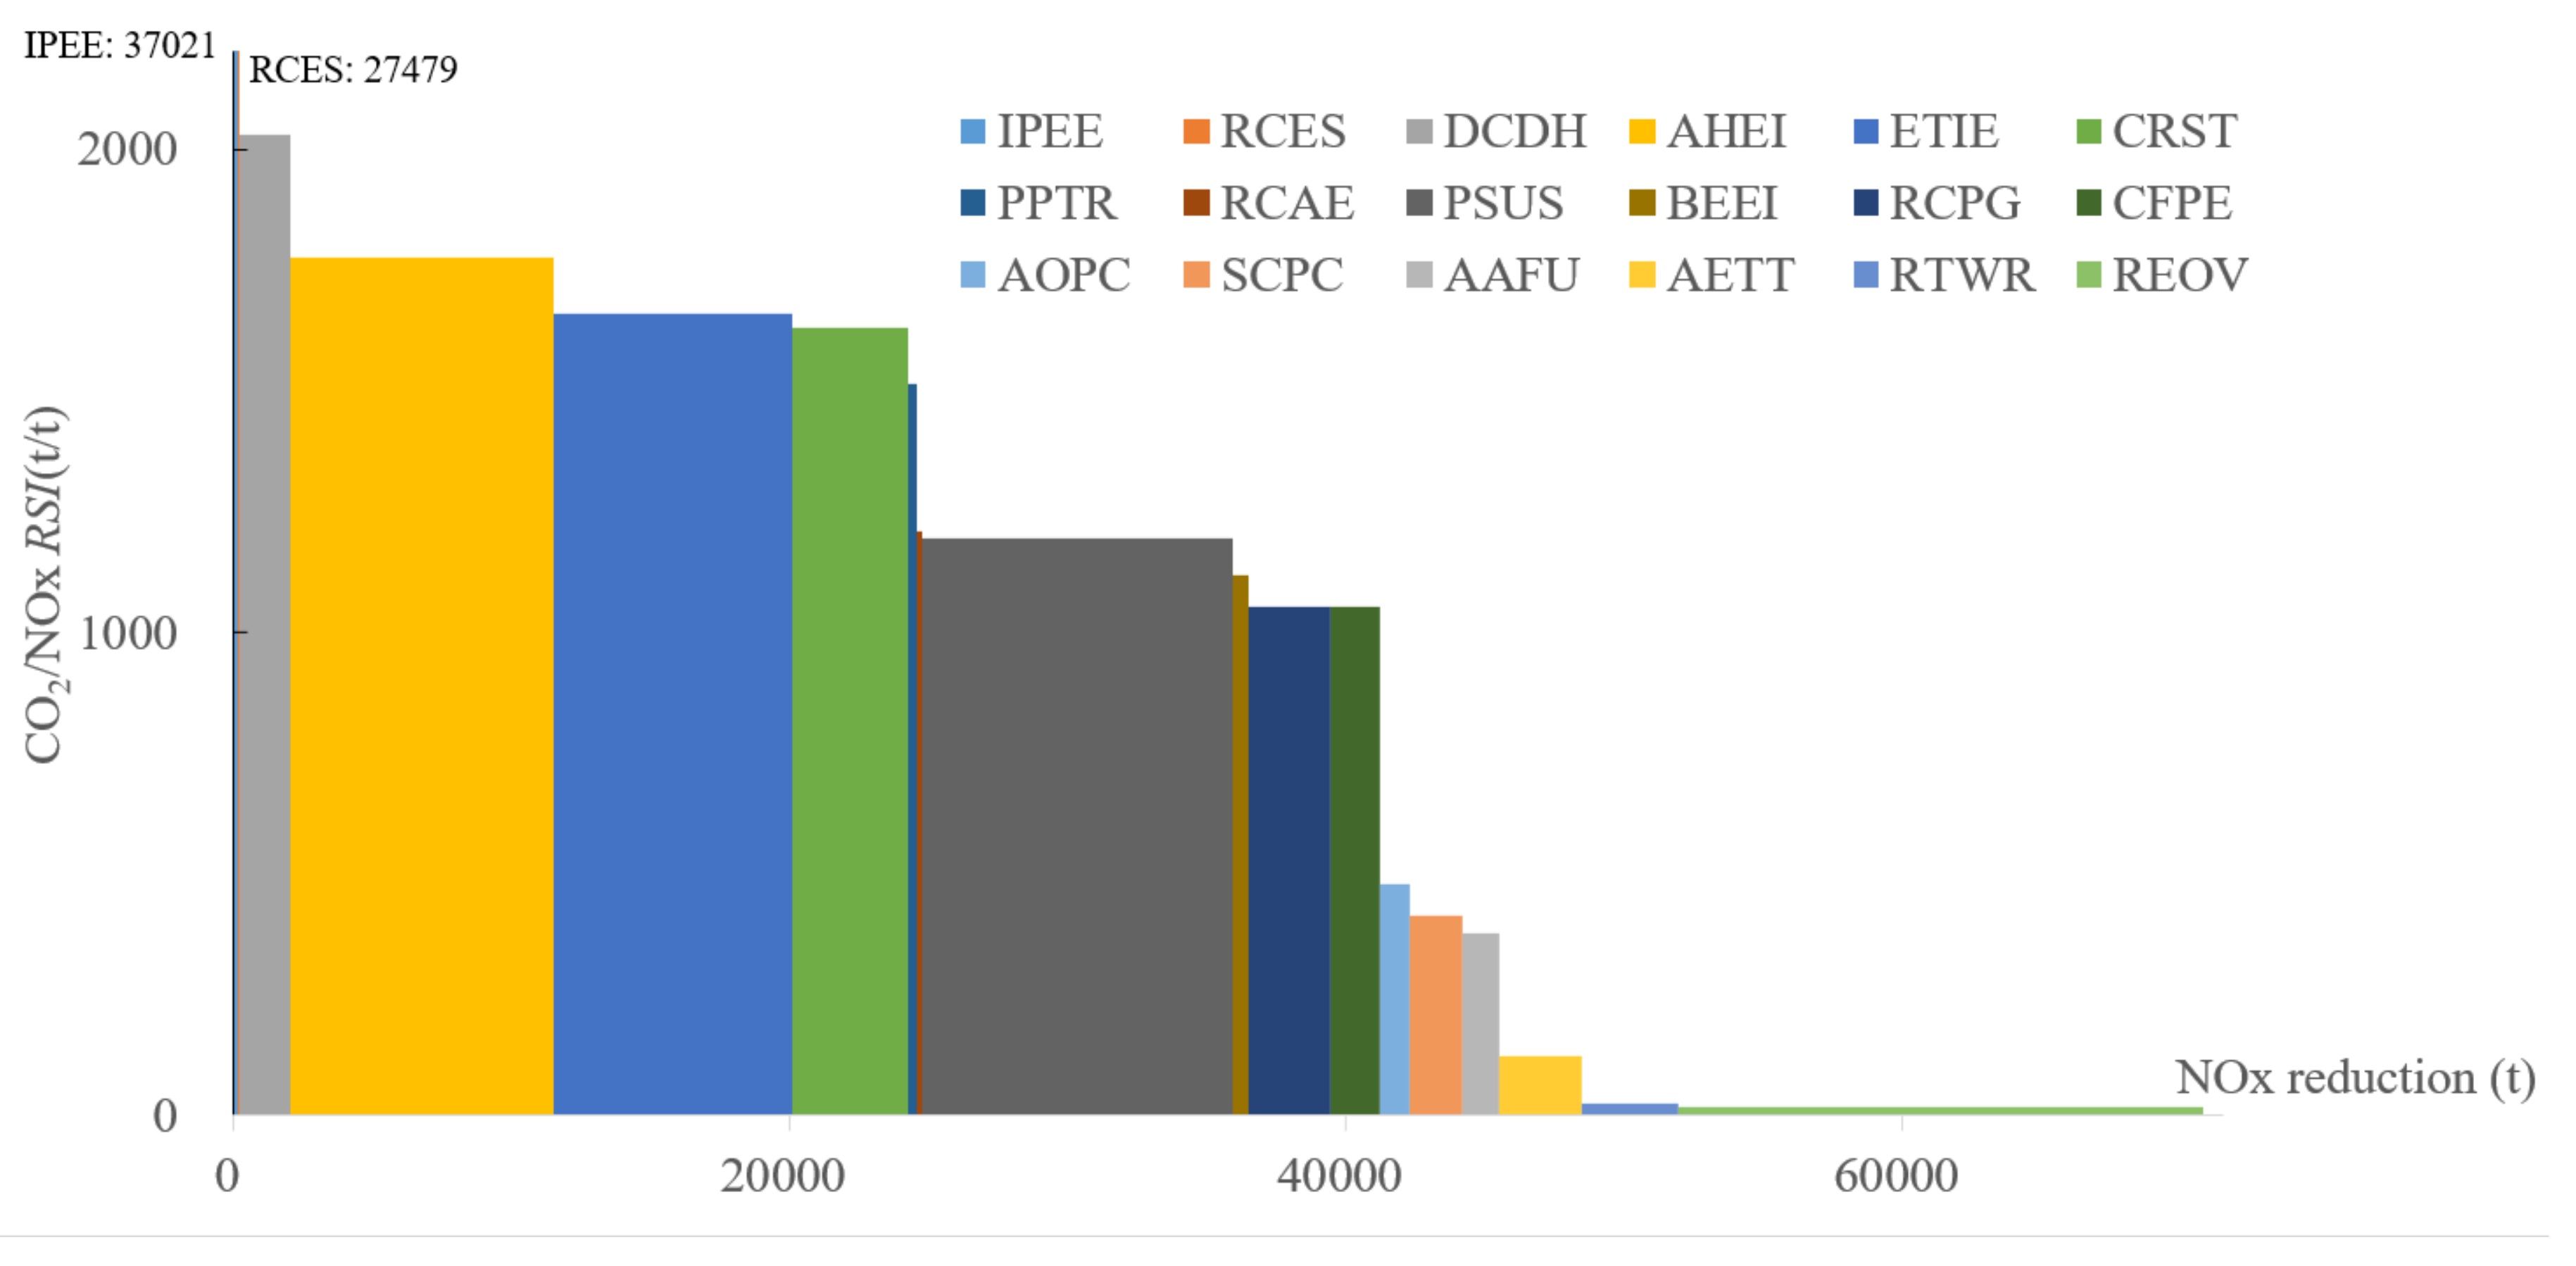
4.5.3. NOx and CO2 Emission
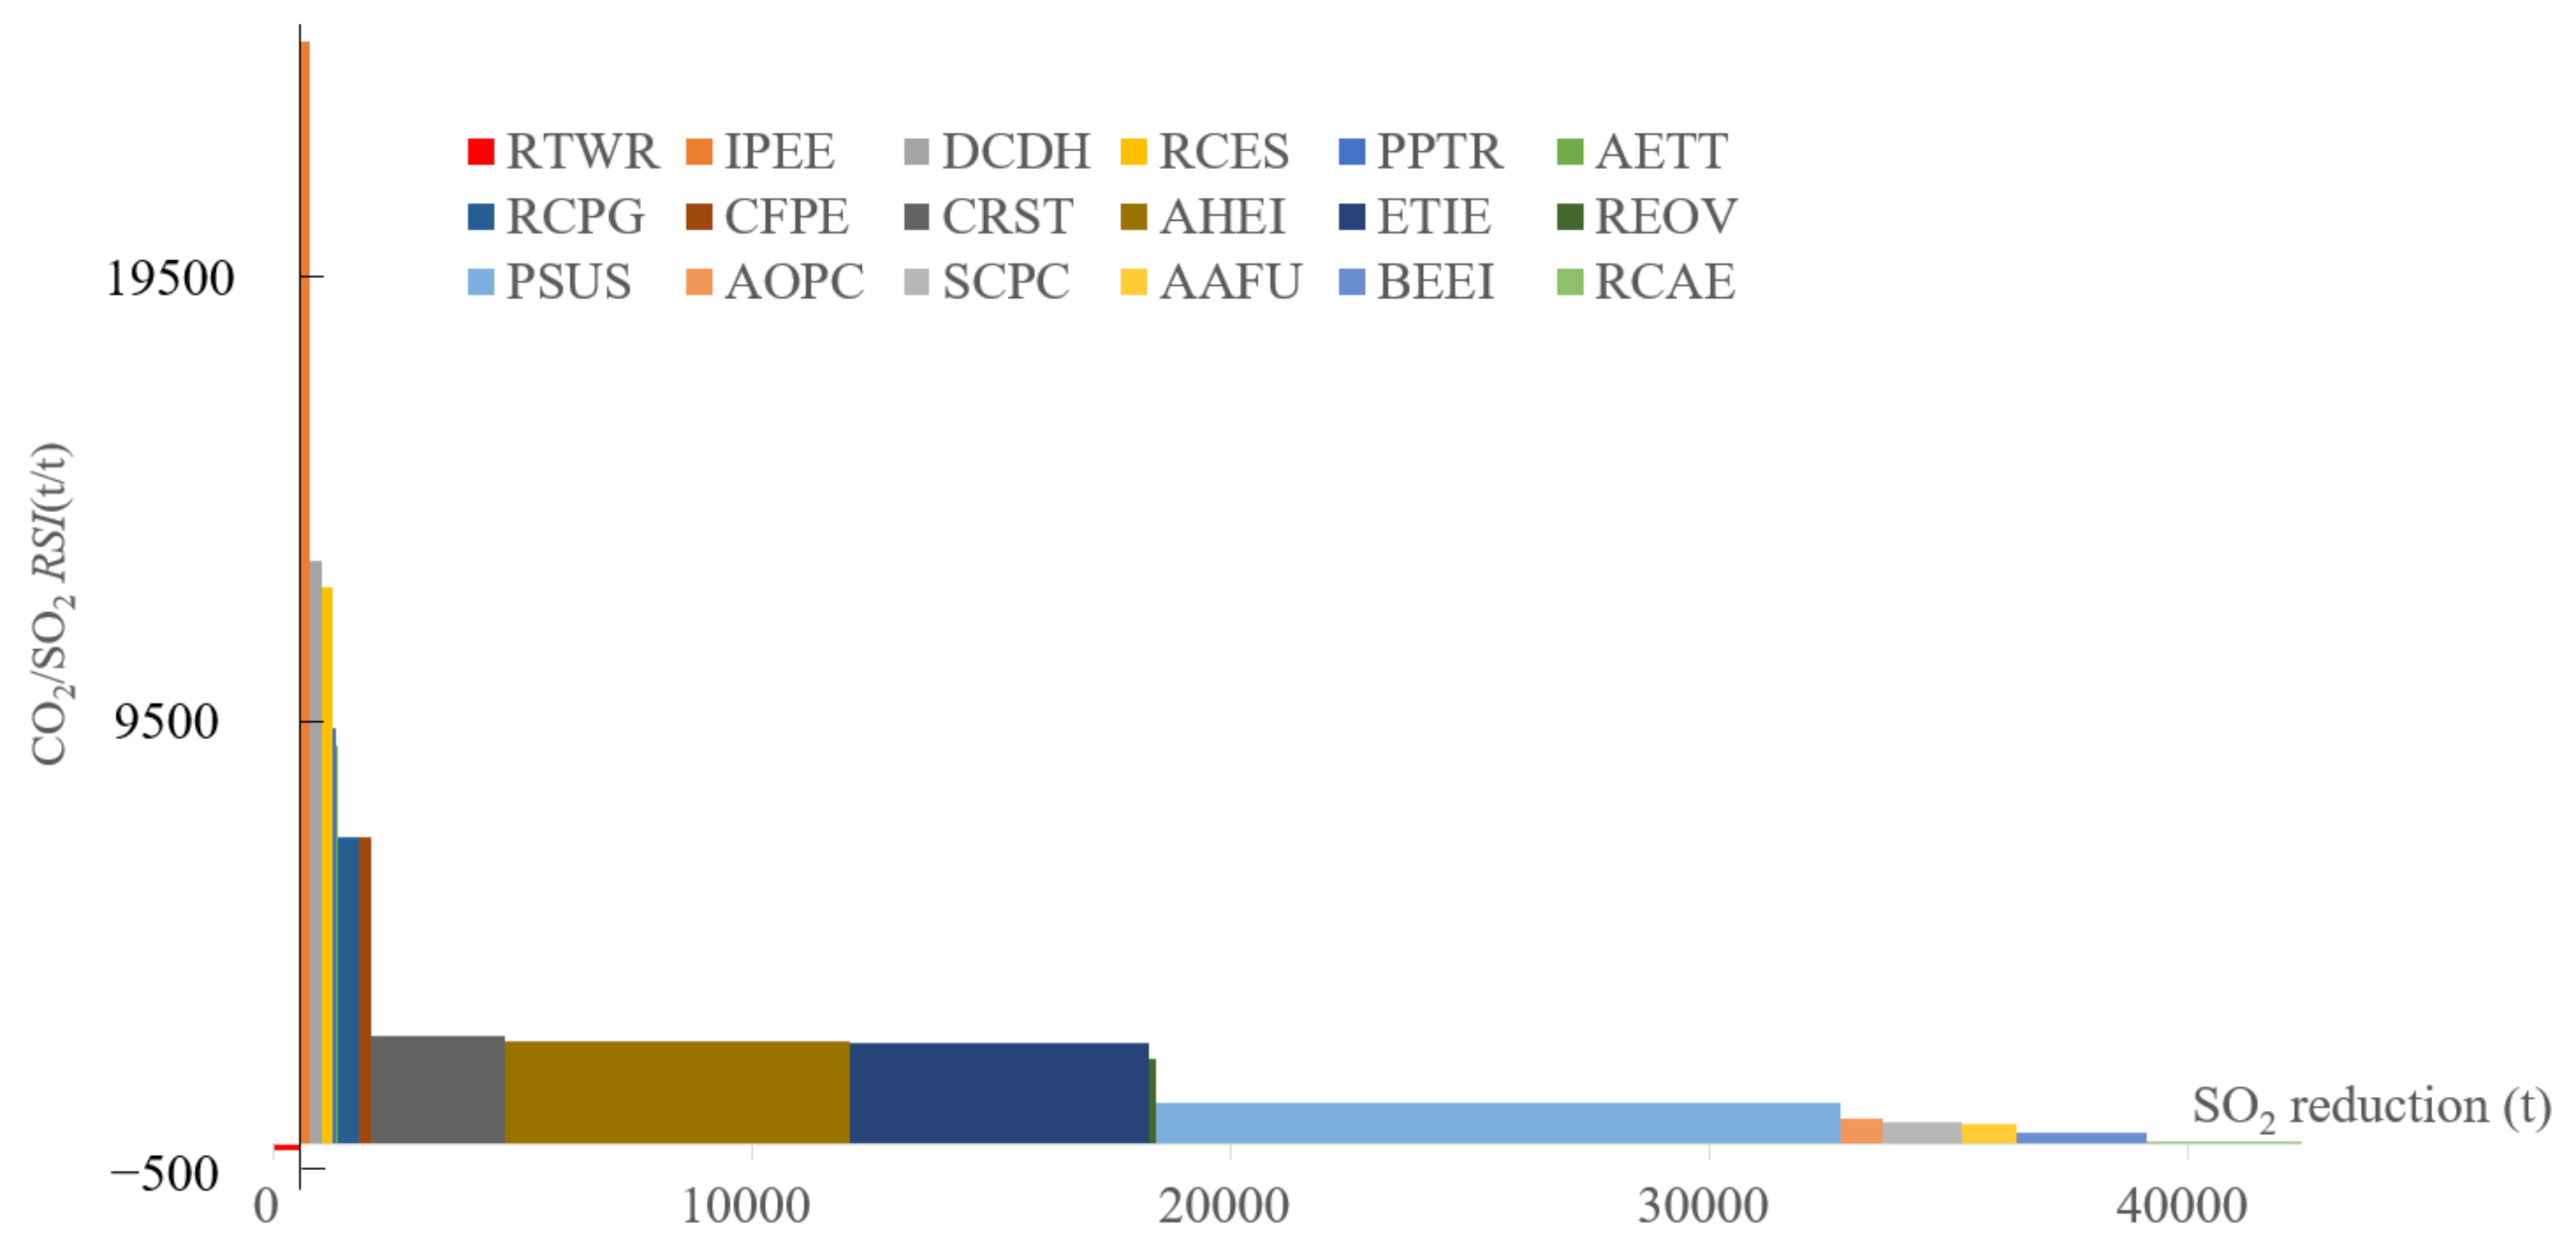
4.5.4. SO2 and CO2
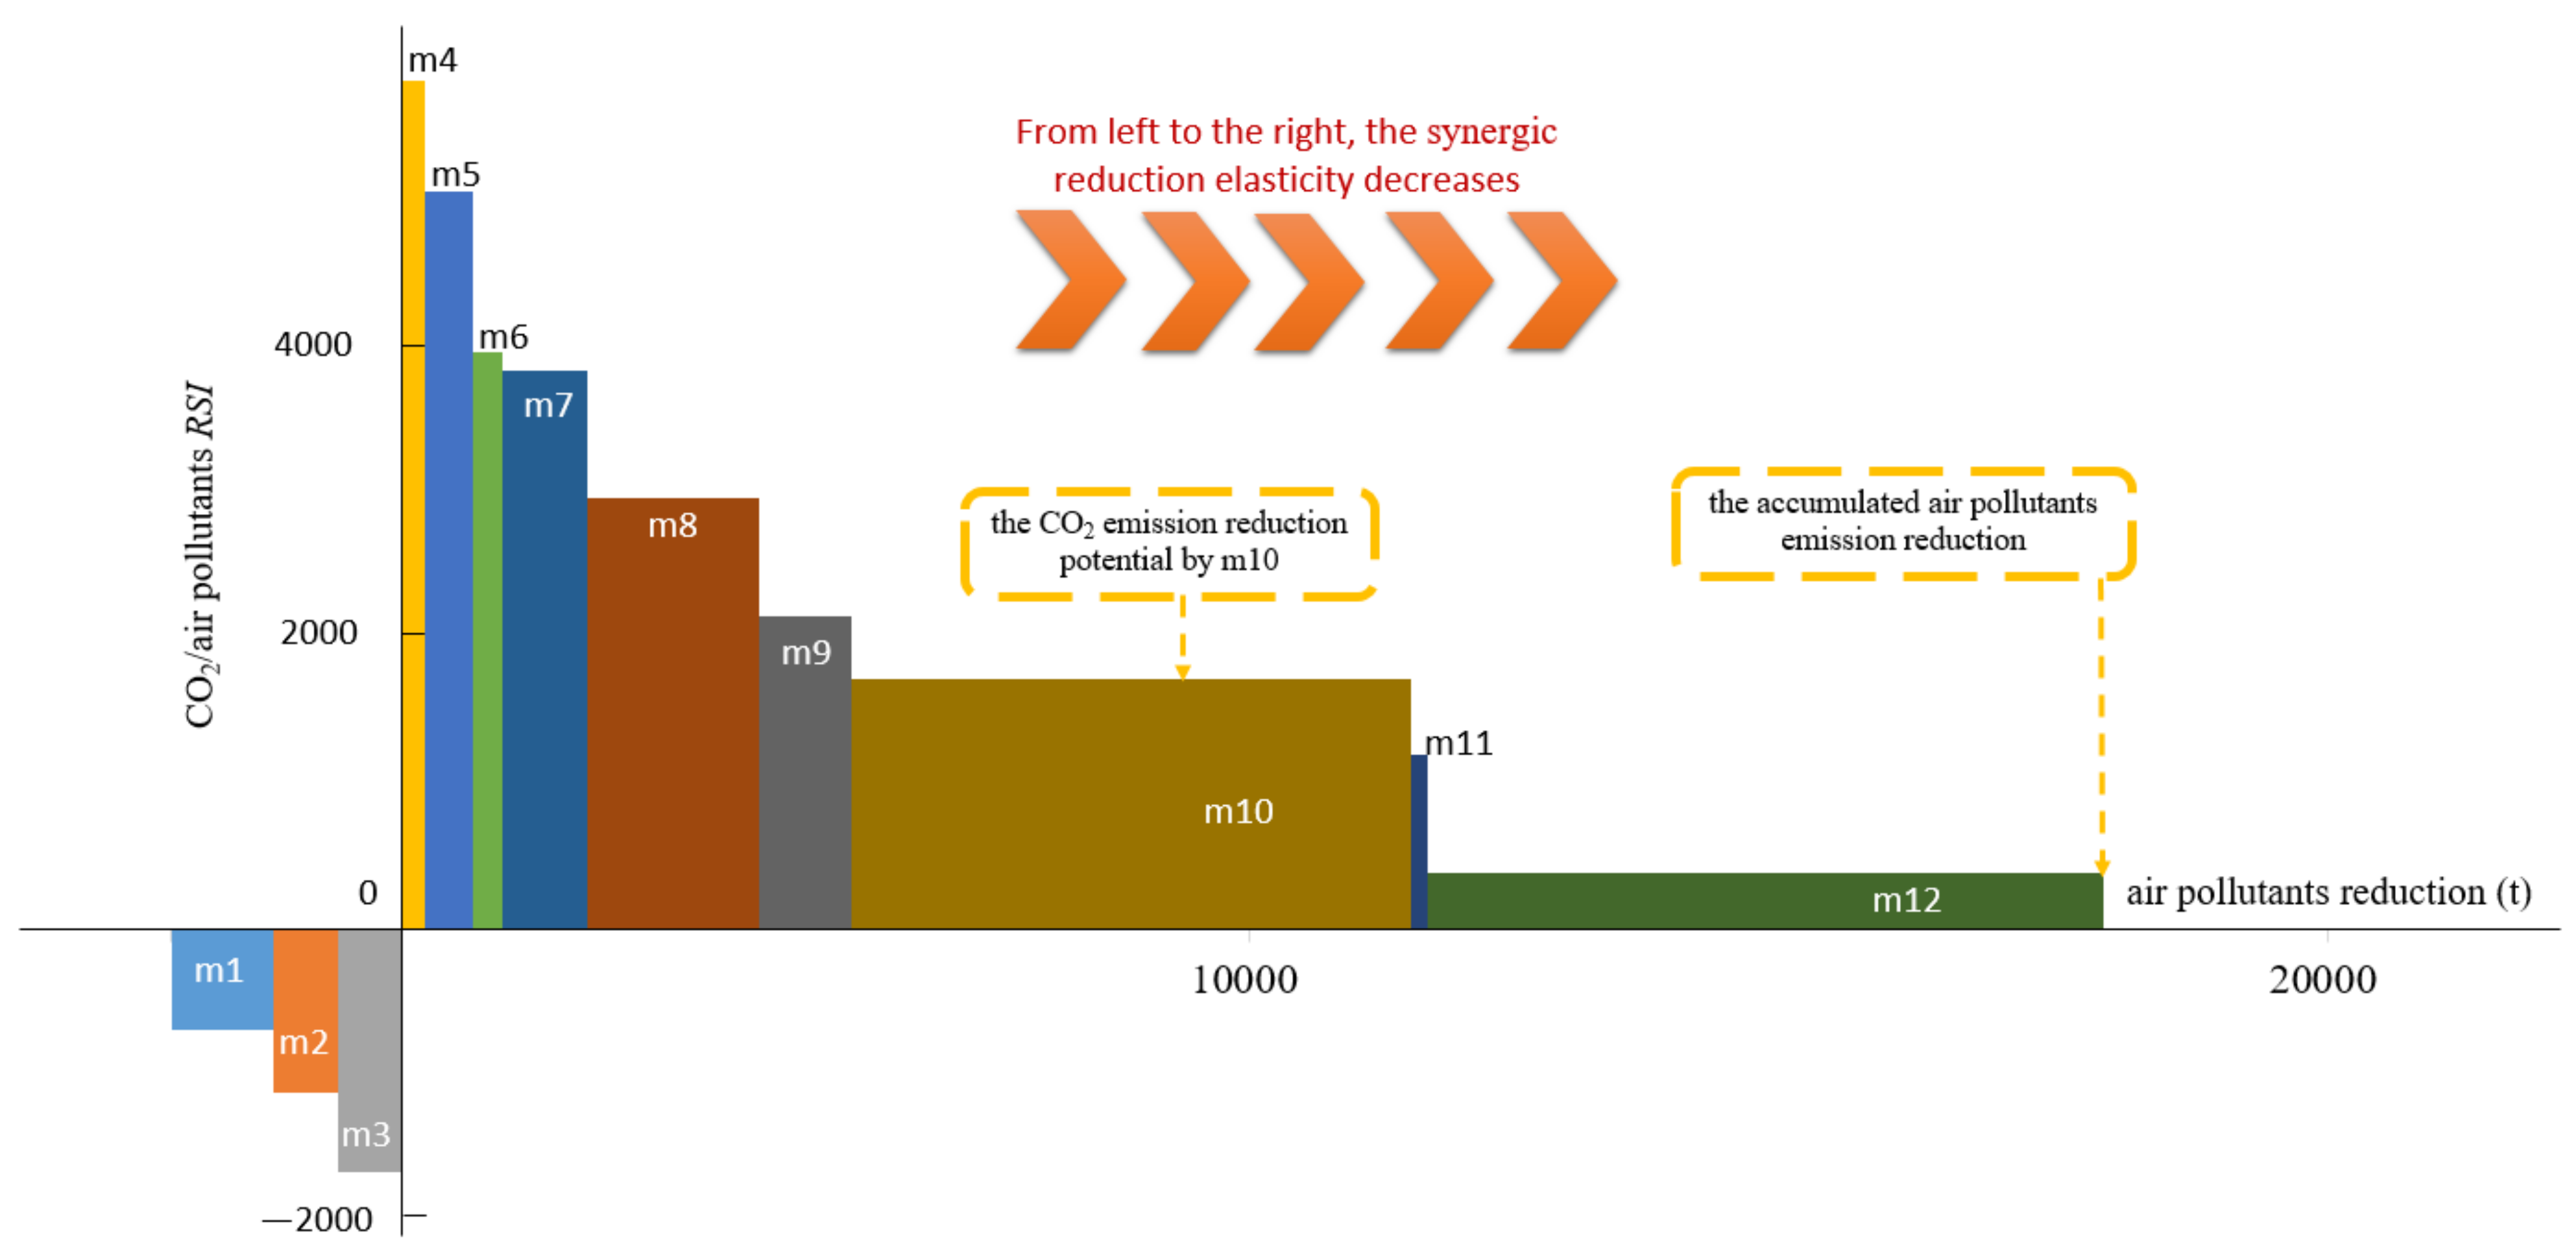
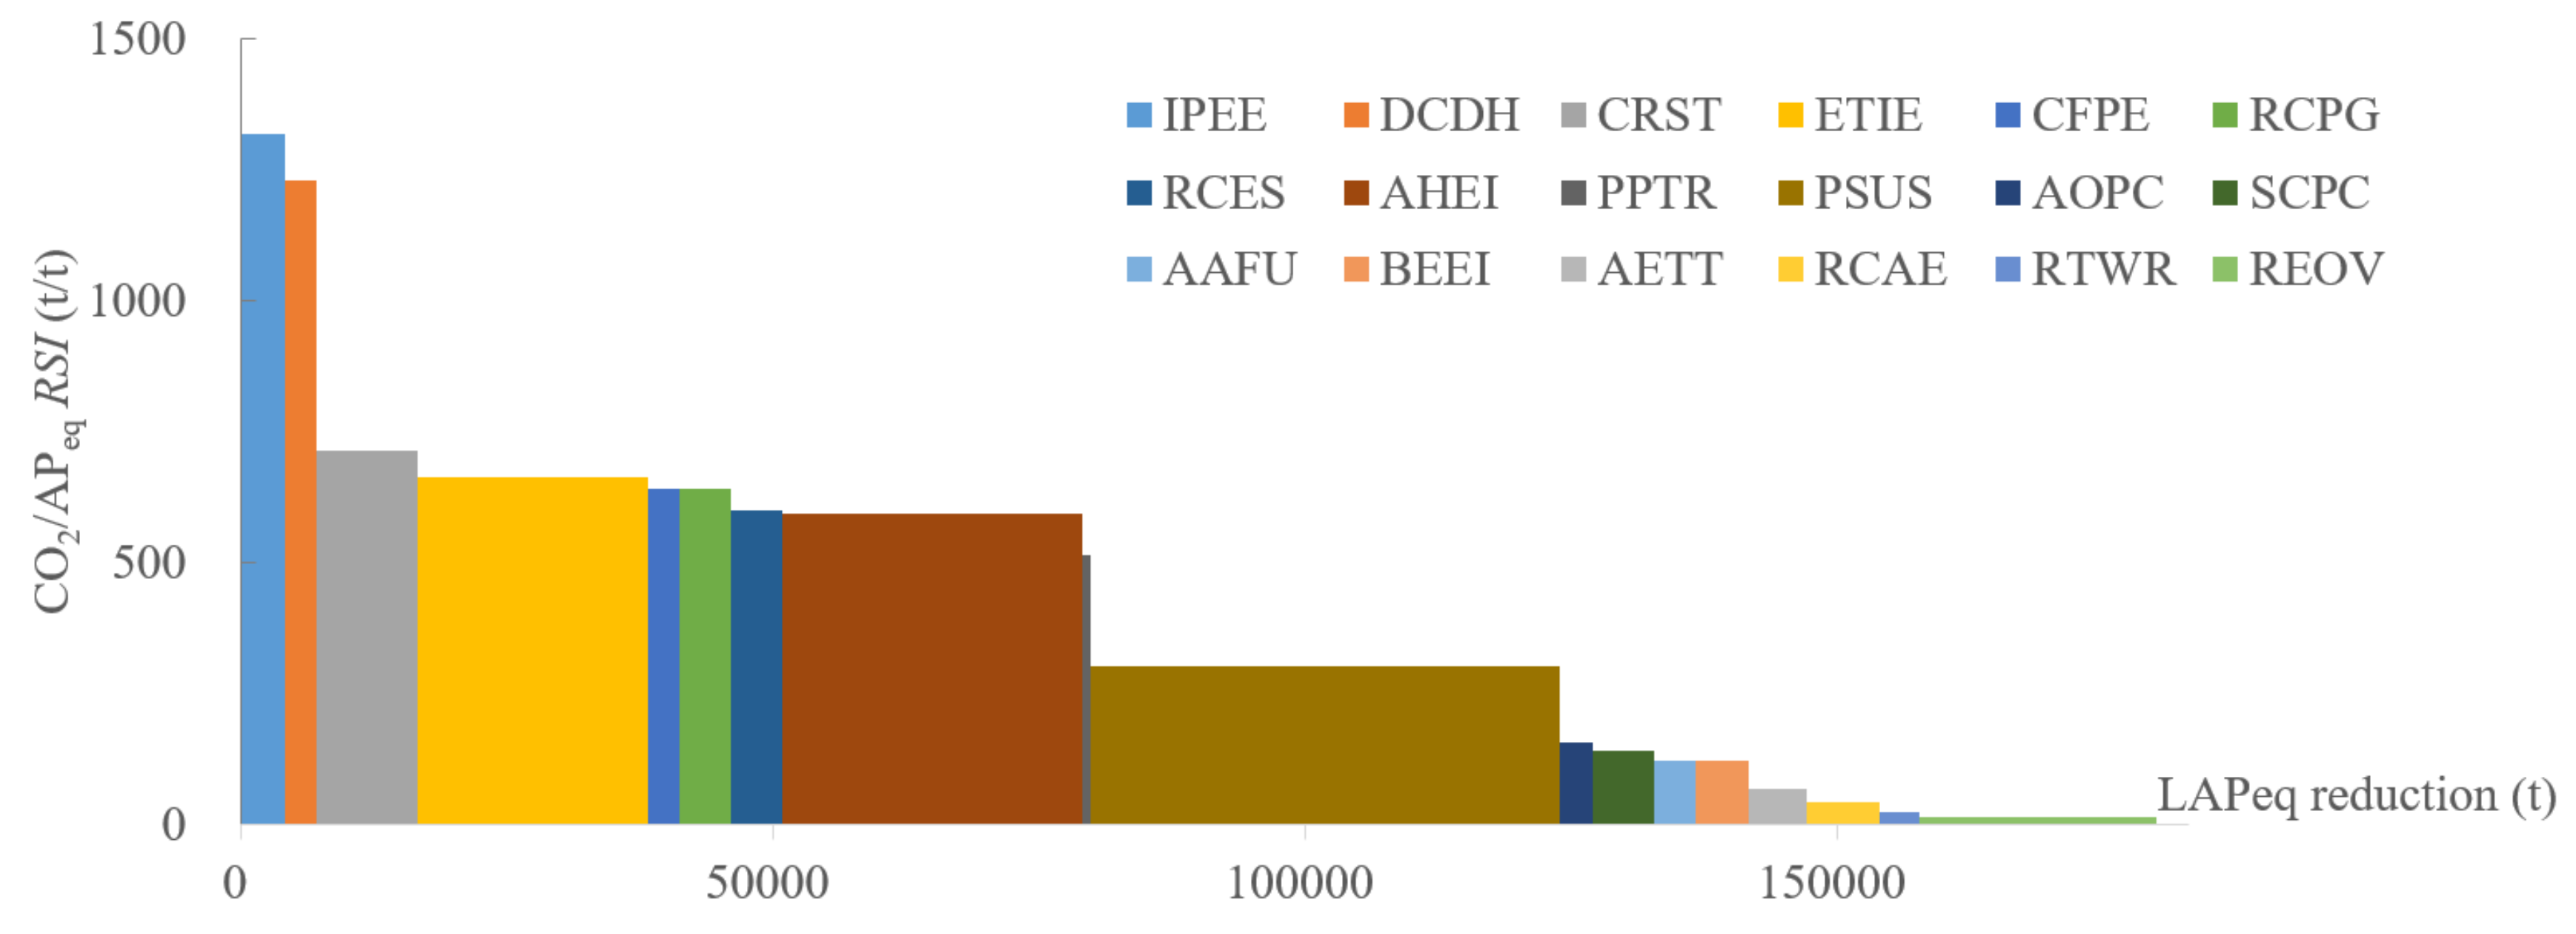
4.5.5. Air Pollutant Equivalent and CO2 Emission
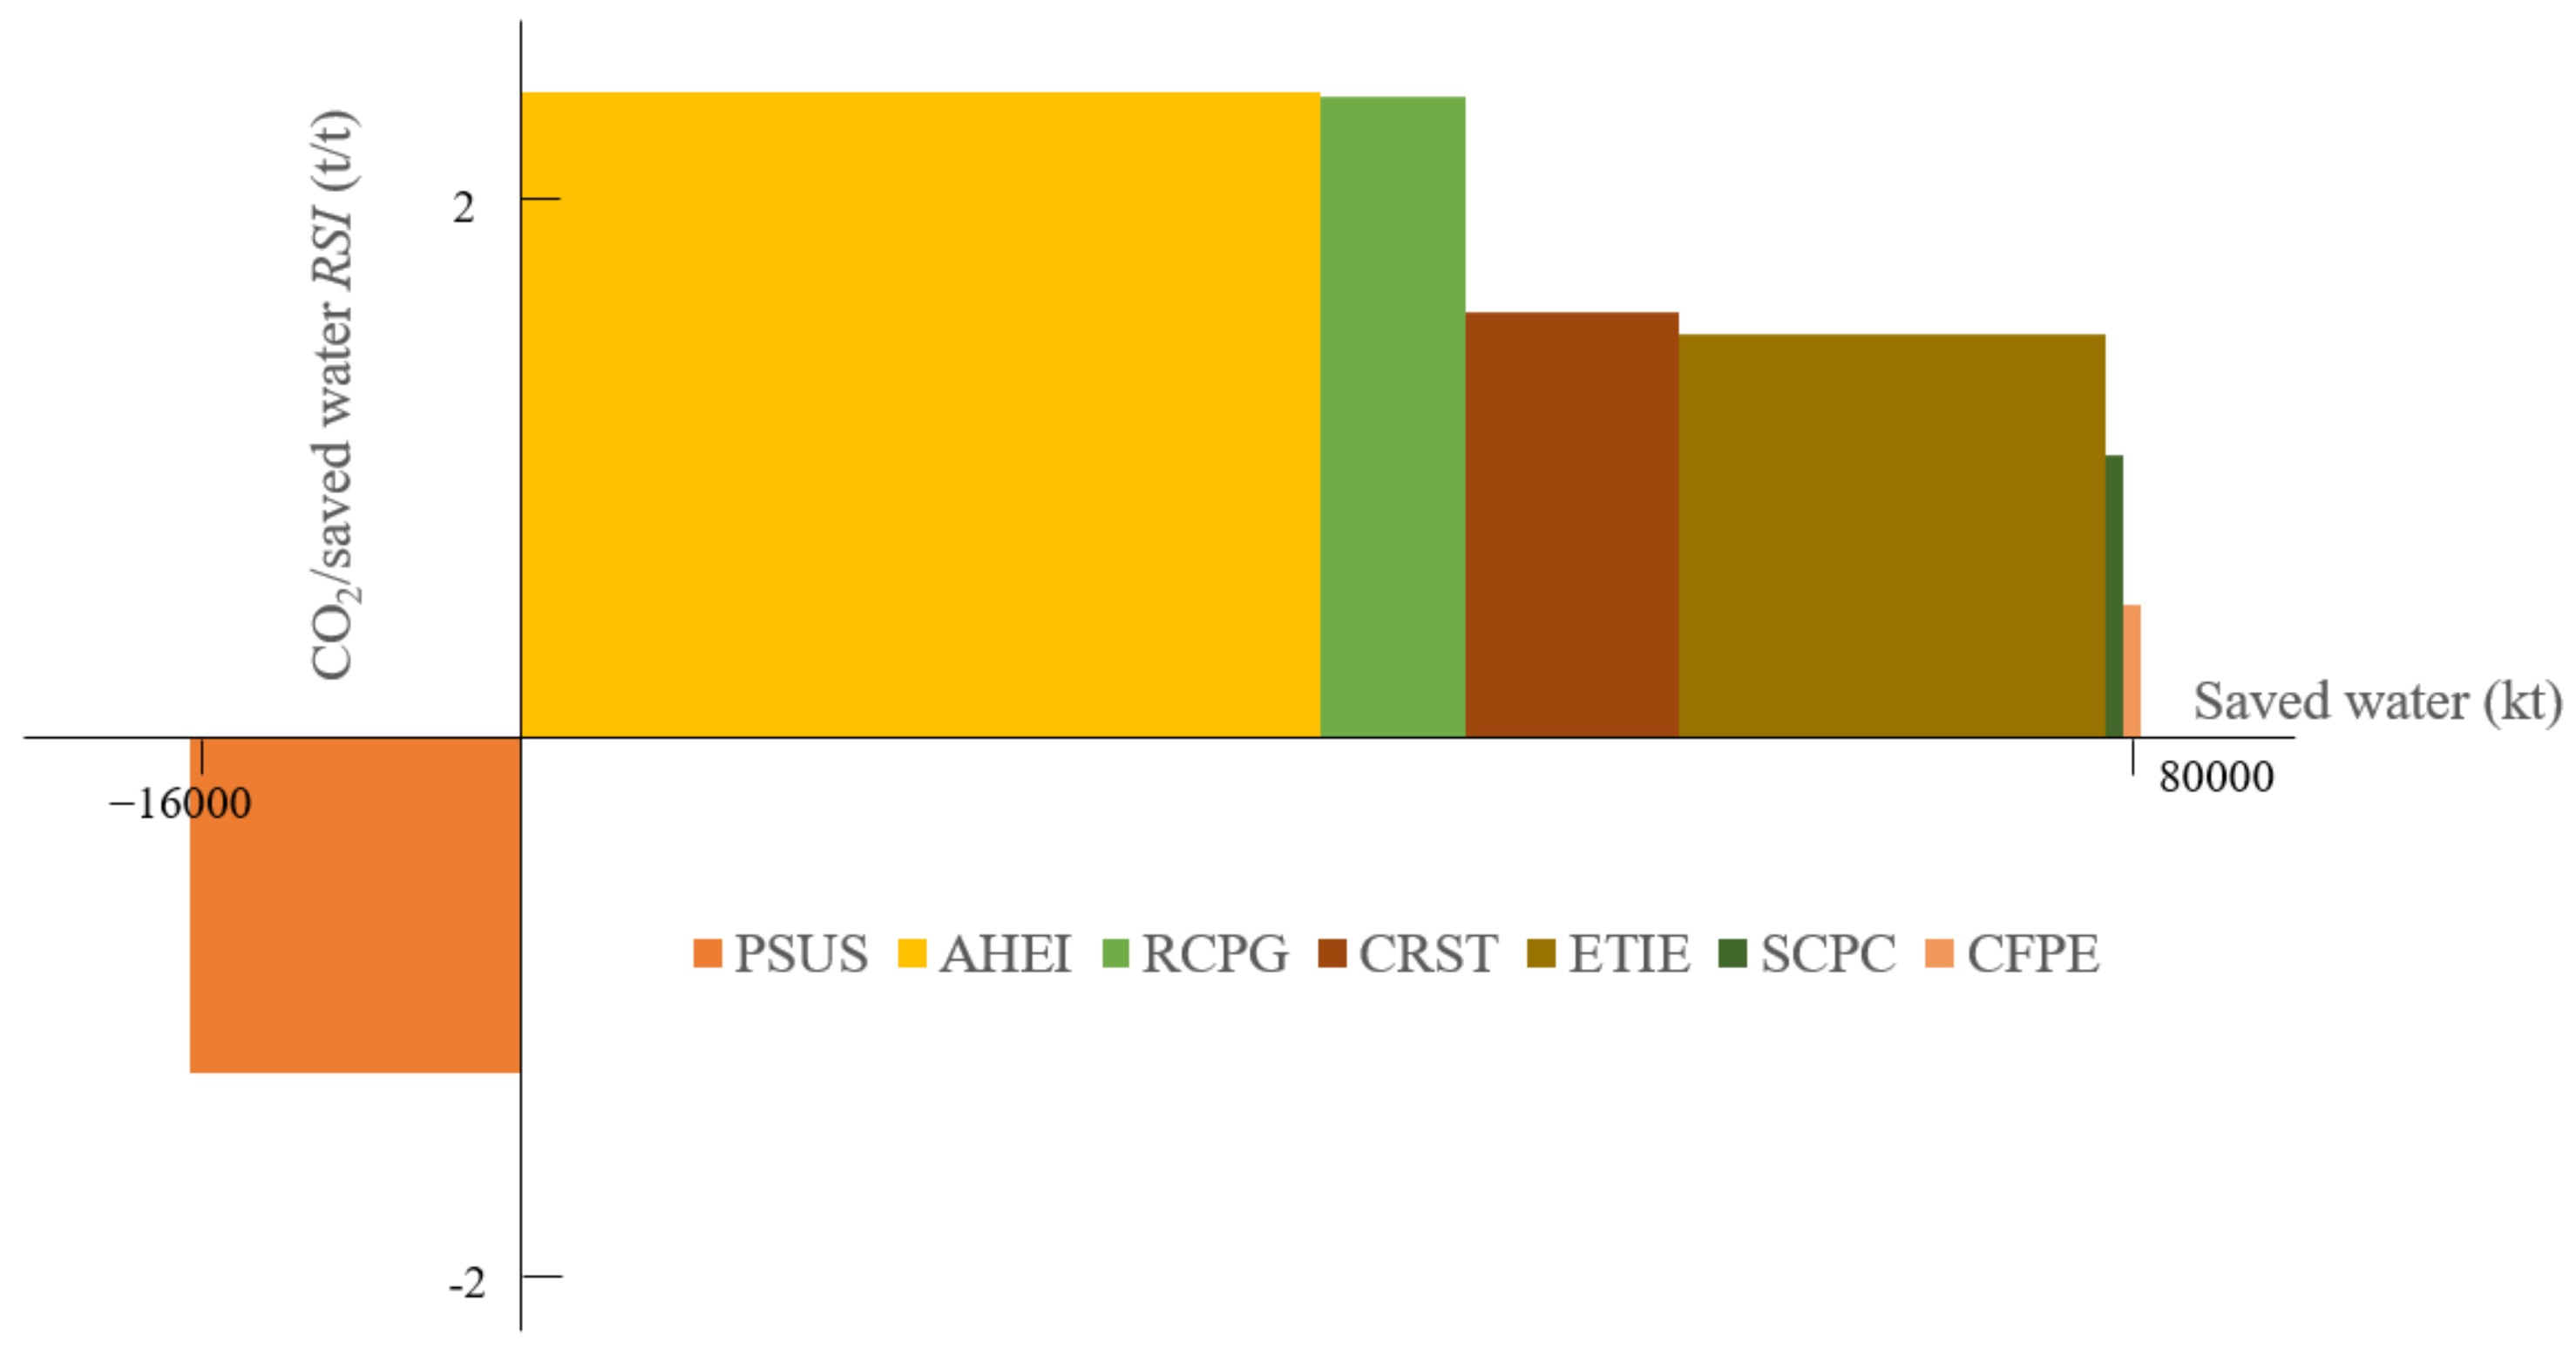
4.5.6. Water Saving and CO2
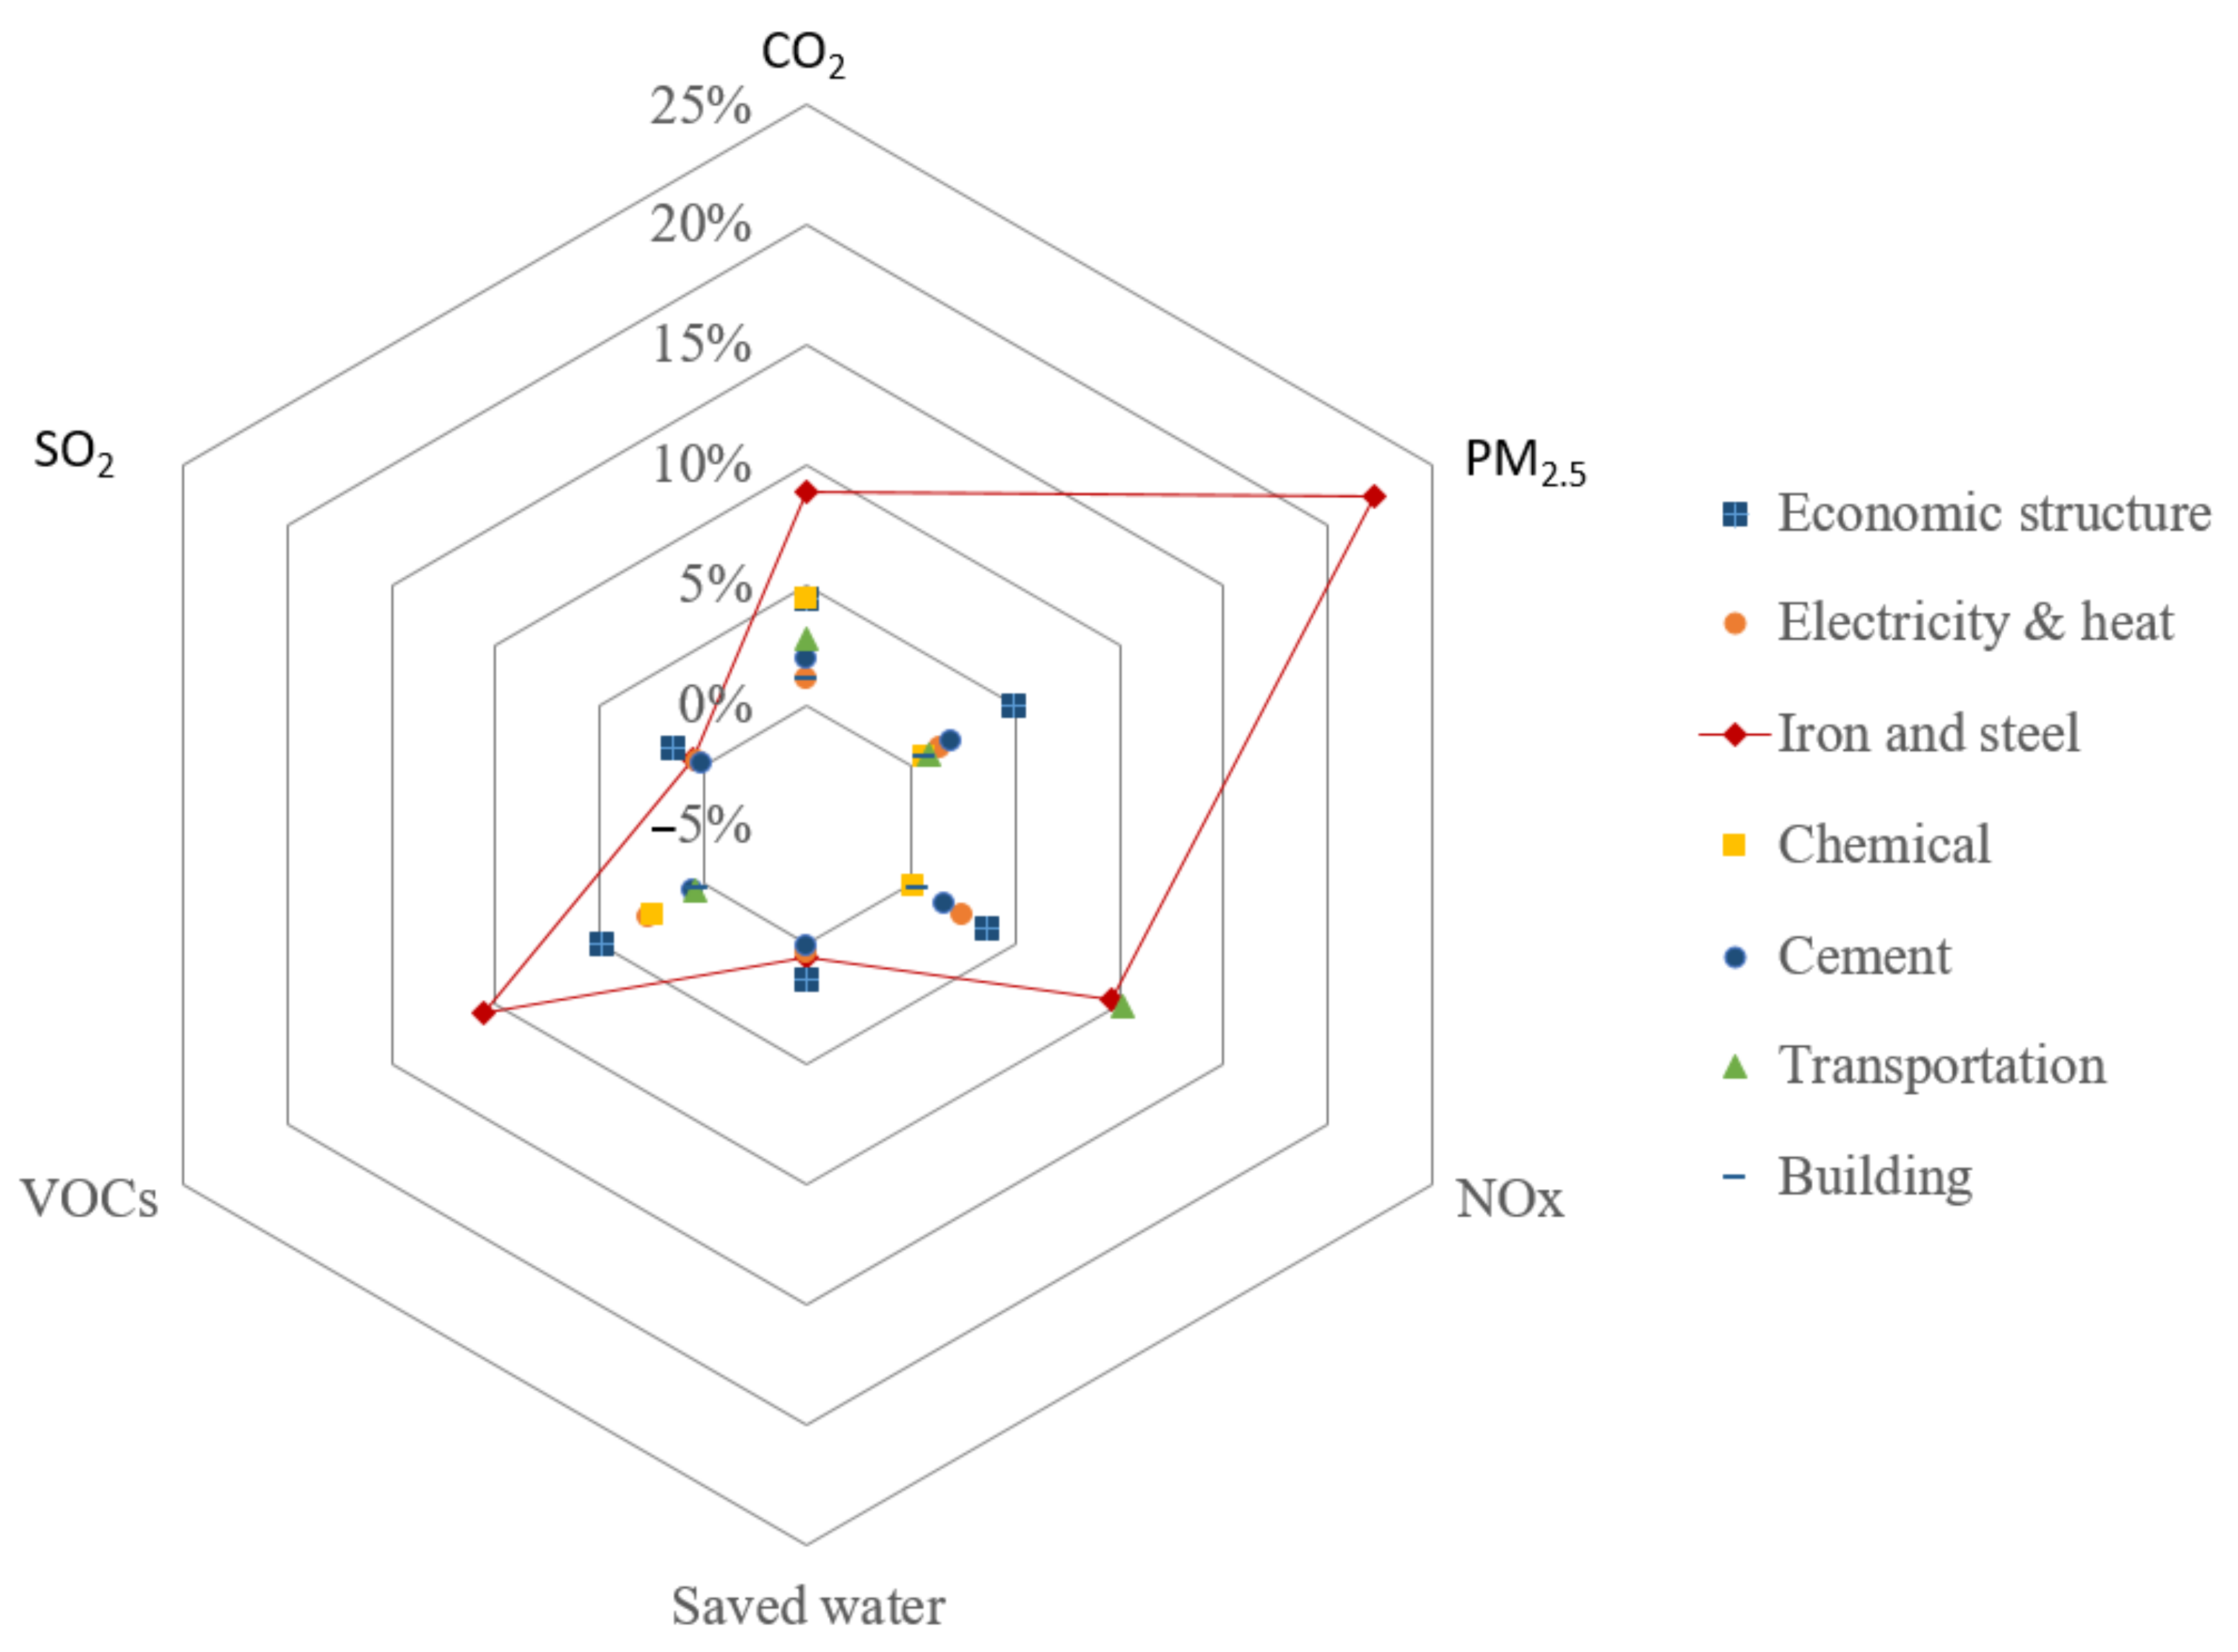
4.6. Multi-Objective Reduction Analysis
5. Conclusions
- Adopting ambitious measures enables the city to obtain more synergic benefits. The CEP-plan-related measures are source-type governing choices, which can usually lead to positive synergic benefits environmentally. To make the targets stronger, less air pollutants and CO2 will be emitted, and a lower water consumption is required. However, it also ought to carefully set the targets to make sure it is bearable and does not violate the safety of supply chains;
- Sticking tirelessly to promote economic restructuring. Economic adjustment is the most efficient way to remove CO2 and air pollutant emissions and water consumption through the transition toward strategic emerging industries and low-carbon and high-efficiency industries;
- Energy efficiency improvements ought to be online all the time. As illustrated in the results, energy efficiency improvement in industries plays a significant role in reducing air pollutants, CO2, and water consumption. The synergic reduction ability is also of priority. Improving the energy efficiency can bring synergic benefits continuously;
- End-of-pipe measures might still be necessary for controlling air pollutants. Even though all the above-mentioned policies can reduce air pollutants significantly (20~30%), they still exist in large quantities. To deeply improve the air quality, strict emission standards ought to be carried out to further decrease air pollutants;
- Being careful about iron and steel transformation. Controlling the product yield and improving energy efficiency contribute to positive synergic benefits. However, the electric steelmaking process consumes much more water than the traditional technique. The transformation pathway can be optimized by considering the relevant air pollutants, CO2 emissions, and water consumption requirements;
- The transportation sector requires specific attention. The transformation of freight transport from the road toward waterways might increase SO2 emissions, due to the higher emission factor of ships. It might be necessary to increase the emission standard of the fuel oil quality and also the emission standards of fuel engines to avoid a negative synergic effect.
Author Contributions
Funding
Institutional Review Board Statement
Informed Consent Statement
Data Availability Statement
Conflicts of Interest
Appendix A
| CO2 | SO2 | NOx | VOCs | Preliminary PM2.5 | |
|---|---|---|---|---|---|
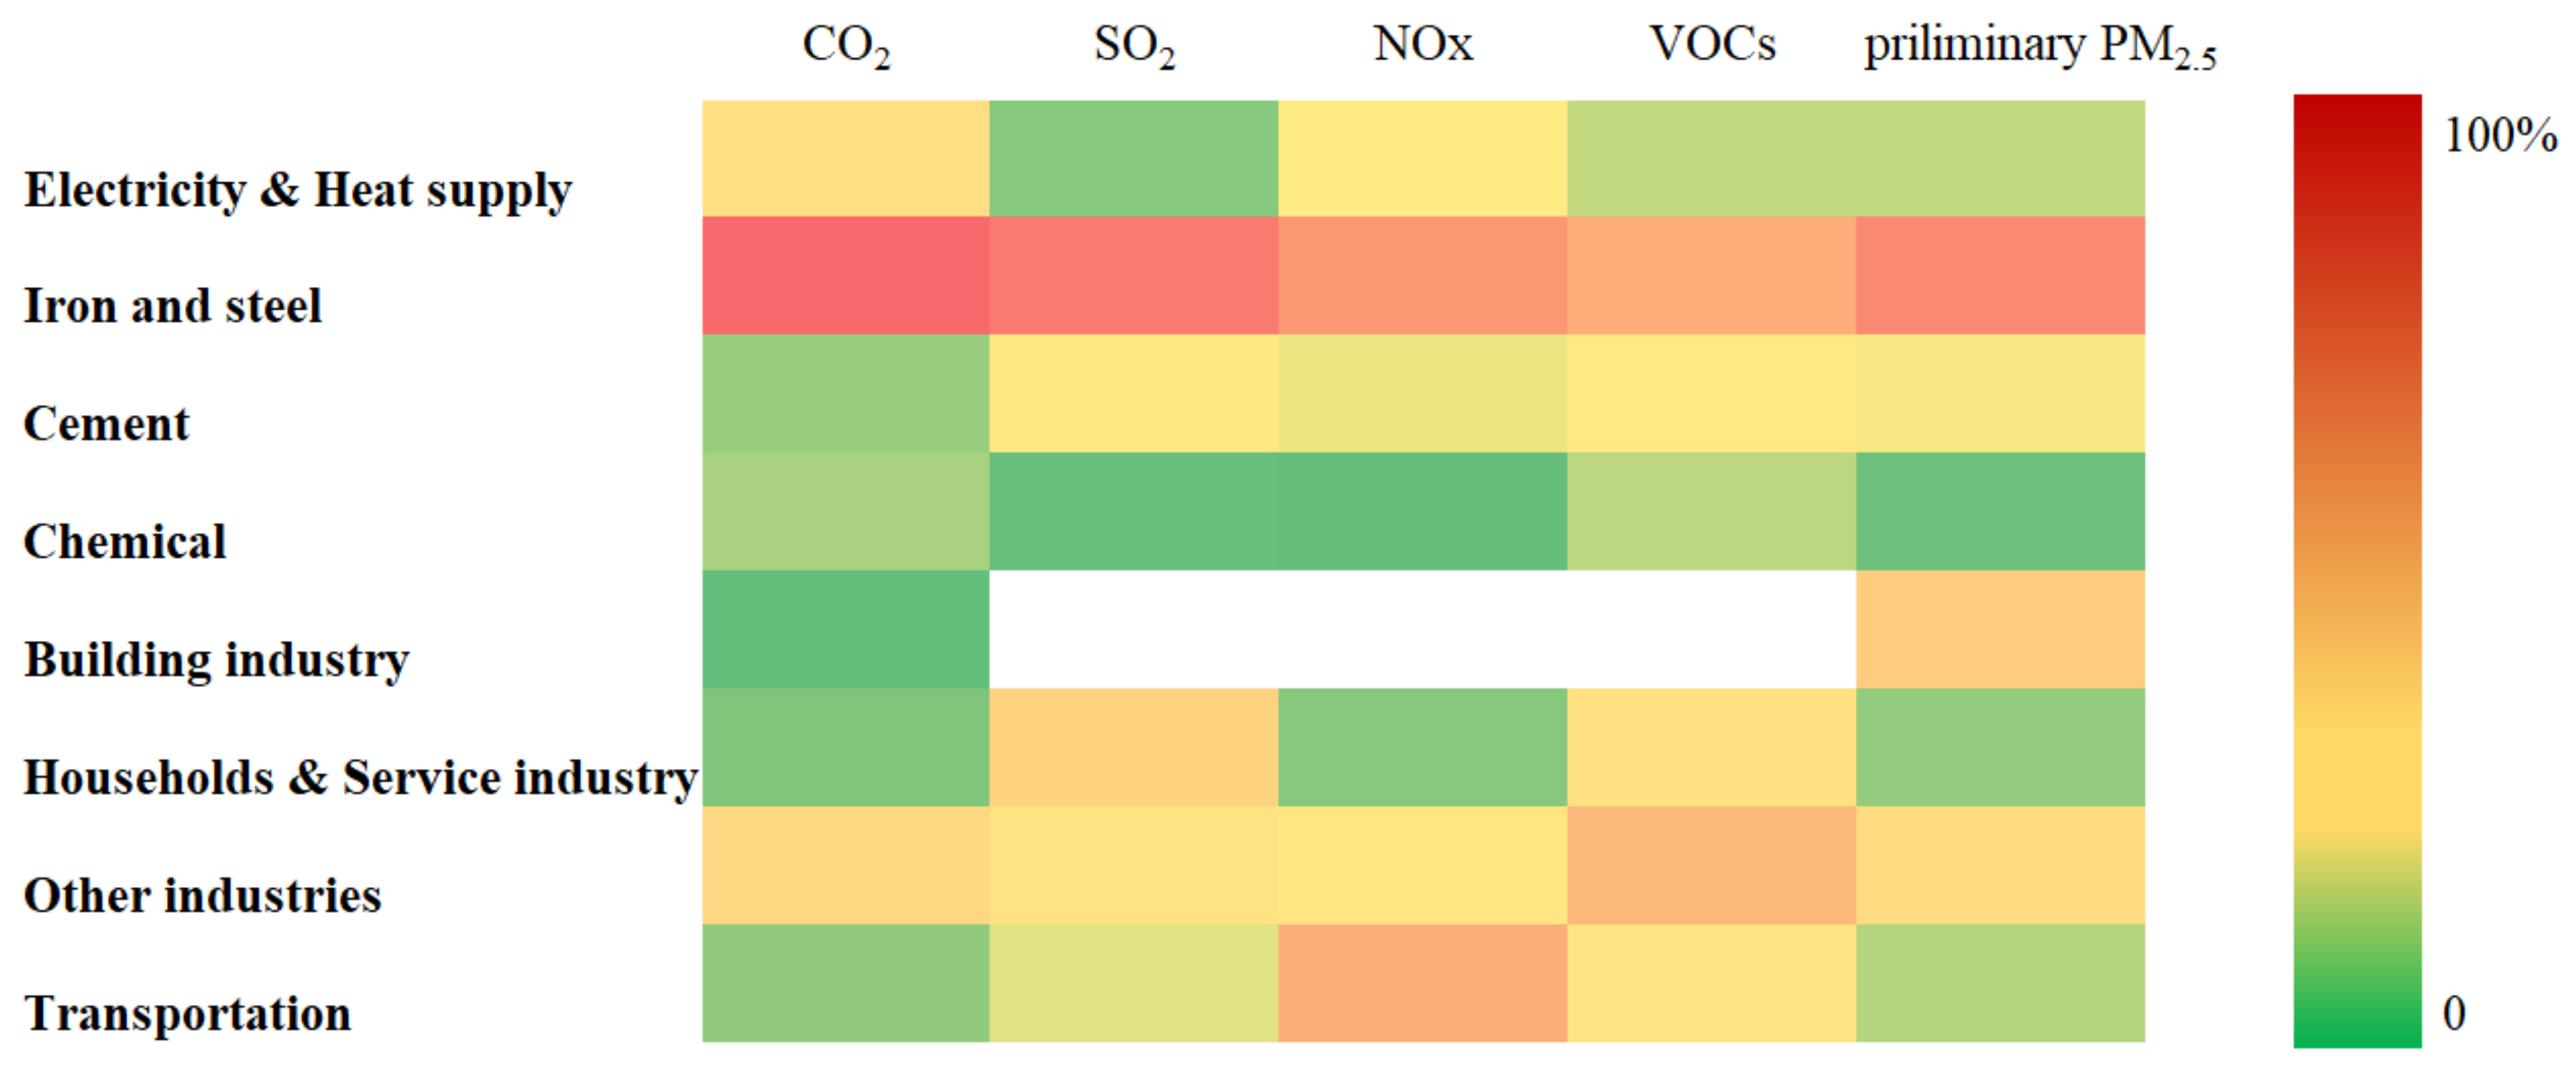
| Electricity and heat supply | 12.0% | 1.5% | 6.5% | 4.0% | 4.0% |
| Iron and steel | 64.1% | 56.9% | 43.7% | 34.4% | 50.0% |
| Cement | 2.3% | 8.5% | 5.8% | 7.7% | 6.2% |
| Chemical | 2.9% | 0.3% | 0.2% | 3.7% | 0.5% |
| Building industry | 0.1% | - | - | - | 20.3% |
| Households and service industry | 1.2% | 17.4% | 1.5% | 11.3% | 2.0% |
| Other industries | 15.5% | 10.2% | 8.8% | 29.1% | 13.8% |
| Transportation | 1.9% | 5.3% | 33.6% | 9.7% | 3.4% |
References
- MFA. Statement by H.E. Xi Jinping President of the People’s Republic of China At the General Debate of the 75th Session of The United Nations General Assembly. 2020. Available online: https://www.fmprc.gov.cn/mfa_eng/zxxx_662805/t1817098.shtml (accessed on 15 April 2022).
- The State Council. The White Paper on Responding to Climate Change: China’s Policies and Actions. 2021. Available online: http://www.scio.gov.cn/xwfbh/xwbfbh/wqfbh/44687/47299/wz47301/Document/1715453/1715453.htm (accessed on 15 April 2022).
- MEE. Ministry of Ecology and Environment Released a Summary of China’s Ecological and Environmental Quality in 2020. 2021. Available online: http://www.mee.gov.cn/xxgk2018/xxgk/xxgk15/202103/t20210302_823100.html (accessed on 15 April 2022).
- Ekins, P. The secondary benefits of CO2 abatement: How much emission reduction do they justify? Ecol. Econ. 1996, 16, 13–24. [Google Scholar] [CrossRef]
- van Vuuren, D.P.; Cofala, J.; Eerens, H.E.; Oostenrijk, R.; Heyes, C.; Klimont, Z.; den Elzen, M.G.J.; Amann, M. Exploring the ancillary benefits of the Kyoto Protocol for air pollution in Europe. Energy Policy 2006, 34, 444–460. [Google Scholar] [CrossRef] [Green Version]
- West, J.J.; Osnaya, P.; Laguna, I.; Martínez, J.; Fernández, A. Co-control of urban air pollutants and greenhouse gases in Mexico City. Environ. Sci. Technol. 2004, 38, 3474–3481. [Google Scholar] [CrossRef] [PubMed]
- Shrestha, R.M.; Pradhan, S. Co-benefits of CO2 emission reduction in a developing country. Energy Policy 2010, 38, 2586–2597. [Google Scholar] [CrossRef]
- Chae, Y. Co-benefit analysis of an air quality management plan and greenhouse gas reduction strategies in the Seoul metropolitan area. Environ. Sci. Policy 2010, 13, 205–216. [Google Scholar] [CrossRef]
- Mao, X.; Yang, S.; Liu, Q.; Tu, J.; Jaccard, M. Achieving CO2 emission reduction and the co-benefits of local air pollution abatement in the transportation sector of China. Environ. Sci. Policy 2012, 21, 1–13. [Google Scholar] [CrossRef]
- Mao, X.; Zeng, A.; Hu, T.; Xing, Y.; Shengqiang, L. Study of coordinate control effect assessment of technological measures for emissions reduction. China Popul. Environ. 2011, 21, 1–7. [Google Scholar]
- Jiao, J.; Huang, Y.; Liao, C. Co-benefits of reducing CO2 and air pollutant emissions in the urban transport sector: A case of Guangzhou. Energy Sustain. Dev. 2020, 59, 131–143. [Google Scholar] [CrossRef]
- Duan, L.; Hu, W.; Deng, D.; Fang, W.; Xiong, M.; Lu, P.; Li, Z.; Zhai, C. Impacts of reducing air pollutants and CO2 emissions in urban road transport through 2035 in Chongqing, China. Environ. Sci. Ecotechnol. 2021, 8, 100125. [Google Scholar] [CrossRef]
- The State Council. “14th Five-Year Plan” Comprehensive Work Plan for Energy Conservation and Emission Reduction. 2021. Available online: http://www.gov.cn/zhengce/content/2022-01/24/content_5670202.htm (accessed on 15 April 2022).
- The State Council. Action Plan for Carbon Dioxide Peaking Before 2030. 2021. Available online: http://www.gov.cn/zhengce/content/2021-10/26/content_5644984.htm (accessed on 1 December 2021).
- NDRC. (National Development and Reform Commission) and MWR (Ministry of Water Resources of the P.R. China). The 14th Five-Year Plan for Water Security Guarantee. 2022. Available online: http://www.mwr.gov.cn/zwgk/gknr/202201/t20220111_1559199.html (accessed on 1 March 2022).
- Wang, X.; Jiang, P.; Yang, L.; van Fan, Y.; Klemeš, J.J.; Wang, Y. Extended water-energy nexus contribution to environmentally-related sustainable development goals. Renew. Sustain. Energy Rev. 2021, 150, 111485. [Google Scholar] [CrossRef]
- Sun, Y.; Zhang, J.; Mao, X.; Yin, X.; Liu, G.; Zhao, Y.; Yang, W. Effects of different types of environmental taxes on energy–water nexus. J. Clean. Prod. 2021, 289, 125763. [Google Scholar] [CrossRef]
- Tan, Q.; Liu, Y.; Ye, Q. The impact of clean development mechanism on energy-water-carbon nexus optimization in Hebei, China: A hierarchical model based discussion. J. Environ. Manag. 2020, 264, 110441. [Google Scholar] [CrossRef] [PubMed]
- Wang, X.; Klemeš, J.J.; Wang, Y.; Dong, X.; Wei, H.; Xu, Z.; Varbanov, P.S. Water-Energy-Carbon Emissions nexus analysis of China: An environmental input-output model-based approach. Appl. Energy 2020, 261, 114431. [Google Scholar] [CrossRef]
- Wang, P.P.; Li, Y.P.; Huang, G.H.; Wang, S.G. A multivariate statistical input–output model for analyzing water-carbon nexus system from multiple perspectives-Jing-Jin-Ji region. Appl. Energy 2022, 310, 118560. [Google Scholar] [CrossRef]
- Liang, M.S.; Huang, G.H.; Chen, J.P.; Li, Y.P. Energy-water-carbon nexus system planning: A case study of Yangtze River Delta urban agglomeration. China Appl. Energy 2022, 308, 118144. [Google Scholar] [CrossRef]
- Wang, J.; Yu, Z.; Zeng, X.; Wang, Y.; Li, K.; Deng, S. Water-energy-carbon nexus: A life cycle assessment of post-combustion carbon capture technology from power plant level. J. Clean. Prod. 2021, 312, 127727. [Google Scholar] [CrossRef]
- Gómez-Gardars, E.B.; Rodríguez-Macias, A.; Tena-García, J.L.; Fuentes-Cortés, L.F. Assessment of the water–energy–carbon nexus in energy systems: A multi-objective approach. Appl. Energy 2022, 305, 117872. [Google Scholar] [CrossRef]
- Saray, M.H.; Baubekova, A.; Gohari, A.; Eslamian, S.S.; Klove, B.; Haghighi, A.T. Optimization of Water-Energy-Food Nexus considering CO2 emissions from cropland: A case study in northwest Iran. Appl. Energy 2022, 307, 118236. [Google Scholar] [CrossRef]
- He, L.; Xu, Z.; Wang, S.; Bao, J.; Fan, Y.; Daccache, A. Optimal crop planting pattern can be harmful to reach carbon neutrality: Evidence from food-energy-water-carbon nexus perspective. Appl. Energy 2022, 308, 118364. [Google Scholar] [CrossRef]
- Wang, X.; Zhang, Q.; Xu, L.; Tong, Y.; Jia, X.; Tian, H. Water-energy-carbon nexus assessment of China’s iron and steel industry: Case study from plant level. J. Clean. Prod. 2020, 253, 119910. [Google Scholar] [CrossRef]
- Hu, G.; Ma, X.; Ji, J. Scenarios and policies for sustainable urban energy development based on LEAP model—A case study of a postindustrial city: Shenzhen China. Appl. Energy 2019, 238, 876–886. [Google Scholar] [CrossRef]
- Yang, D.; Liu, D.; Huang, A.; Lin, J.; Xu, L. Critical transformation pathways and socio-environmental benefits of energy substitution using a LEAP scenario modeling. Renew. Sustain. Energy Rev. 2021, 135, 110116. [Google Scholar] [CrossRef]
- Jiang, J.; Ye, B.; Shao, S.; Zhou, N.; Wang, D.; Zeng, Z.; Liu, J. Two-Tier Synergic Governance of Greenhouse Gas Emissions and Air Pollution in China’s Megacity, Shenzhen: Impact Evaluation and Policy Implication. Environ. Sci. Technol. 2021, 55, 7225–7236. [Google Scholar] [CrossRef]
- Yu, P.Y.; Li, C.M. Can the water-saving potential of industrial sectors be quantified? An empirical approach applied on chemical and steel industries of Tianjin and Zhejiang provinces. China Sci. Total Environ. 2021, 784, 147023. [Google Scholar] [CrossRef] [PubMed]
- Tan, H.; Cao, R.; Wang, S.; Wang, Y.; Deng, S.; Duić, N. Proposal and techno-economic analysis of a novel system for waste heat recovery and water saving in coal-fired power plants: A case study. J. Clean. Prod. 2021, 281, 124372. [Google Scholar] [CrossRef]
- Min, R. Research on Co-Control of Energy, Air Pollutants, and Water in the Iron and Steel Industry of Beijing-Tianjin-Hebei Region; China Univresity of Mining & Technology: Beijing, China, 2018. [Google Scholar]
- Huang, Y.H.; Wu, J.H. Bottom-up analysis of energy efficiency improvement and CO2 emission reduction potentials in the cement industry for energy transition: An application of extended marginal abatement cost curves. J. Clean. Prod. 2021, 296, 126619. [Google Scholar] [CrossRef]
- Liu, Y.H.; Liao, W.Y.; Li, L.; Huang, Y.T.; Xu, W.J.; Zeng, X.L. Reduction measures for air pollutants and greenhouse gas in the transportation sector: A cost-benefit analysis. J. Clean. Prod. 2019, 207, 1023–1032. [Google Scholar] [CrossRef]
- Alimujiang, A.; Jiang, P. Synergy and co-benefits of reducing CO2 and air pollutant emissions by promoting electric vehicles—A case of Shanghai. Energy Sustain. Dev. 2020, 55, 181–189. [Google Scholar] [CrossRef]
- Zhang, Q.Y.; Cai, B.F.; Wang, M.D.; Wang, J.X.; Xing, Y.K.; Dong, G.X.; Zhang, Z.; Mao, X.Q. City level CO2 and local air pollutants co-control performance evaluation: A case study of 113 key environmental protection cities in China. Adv. Clim. Chang. Res. 2022, 13, 118–130. [Google Scholar] [CrossRef]
- Zeng, A.; Mao, X.; Hu, T.; Xing, Y.; Gao, Y.; Zhou, J.; Qian, Y. Regional co-control plan for local air pollutants and CO2 reduction: Method and practice. J. Clean. Prod. 2017, 140, 1226–1235. [Google Scholar] [CrossRef]
- Nauclér, T.; Enkvist, P. Pathways to a Low-Carbon Economy: Version 2 of the Global Greenhouse Gas Abatement Cost Curve; McKinsey Co.: Chicago, IL, USA, 2009; p. 192. Available online: http://scholar.google.com/scholar?hl=en&btnG=Search&q=intitle:Pathways+to+a+Low-Carbon+Economy:+version+2+of+the+Global+Greenhouse+Gas+Abatement+Cost+Curve#0 (accessed on 10 March 2022).
- Tangshan Statistics Bureau. Tangshan Statistical Yearbook; Tangshan Statistics Bureau: Tangshan, China, 2019. Available online: http://www.tangshan.gov.cn/zhuzhan/jjsj/ (accessed on 10 March 2022).
- HBDRC (Hebei Development and Reform Commission). Guidelines for Accounting Methods and Reporting of Greenhouse Gas Emissions of Chemical Manufacturing Enterprises in Hebei Province (for Trial Implementation); HBDRC: Hebei, China, 2015. [Google Scholar]
- HBDRC (Hebei Development and Reform Commission). Guidelines for Accounting Methods and Reporting of Greenhouse Gas Emissions of Iron and Steel Production Enterprises in Hebei Province (for Trial Implementation); HBDRC: Hebei, China, 2015. [Google Scholar]
- HBDRC (Hebei Development and Reform Commission). Guidelines for Accounting and Reporting Greenhouse Gas Emissions China Cement Production Enterprises Instructions; HBDRC: Hebei, China, 2015. [Google Scholar]
- The National People’s Congress of the People’s Republic of China. Environmental Protection Tax Law of the People’s Republic of China. 2016. Available online: http://www.npc.gov.cn/npc/c12435/201612/c305c6c912054177bbc3143628983e87.shtm (accessed on 10 March 2022).
| Sectors/Sub-Sectors | Activity Level | Energy Structure | |
|---|---|---|---|
| Primary industry | Added value | Anthracite, bituminous, hard coal briquettes, diesel, electricity | |
| Secondary industry | Iron and steel | Added value | Bituminous, coke, other washed coal, coke oven gas, natural gas, diesel, electricity |
| Petroleum-processing coking industry | Added value | Bituminous, electricity, diesel, coke oven gas | |
| Chemical industry | Added value | Bituminous, coke, other washed coal, coke oven gas, natural gas, diesel, electricity, heat | |
| Building materials | Added value | Bituminous, natural gas, electricity, biomass, municipal sewage sludge | |
| Other parts of the secondary industry | Added value | Bituminous, coke, coke oven gas, LPG, heat | |
| Building industry | Added value | Bituminous, diesel, fuel oil, electricity | |
| Electricity and heat supply | Added value | Bituminous, natural gas, biomass, wind, solar, domestic waste | |
| Tertiary industry | Service industry | Added value | Bituminous, diesel, natural gas, LPG, electricity, heat |
| Transportation: passengers | Number of vehicles, mileage | Gasoline, diesel, CNG, electricity | |
| Transportation: freight | Freight turnover | Gasoline, diesel, CNG, electricity, biofuels | |
| Households | Urban | Population | Bituminous, natural gas, electricity, heat, LPG |
| Rural | Population | Bituminous, natural gas, diesel, electricity, LPG | |
| Sector/Industries | Reduction Policies/Measures | Reference Scenario (REF) | Green Low Carbon Scenario (GLC) | Abbreviation |
|---|---|---|---|---|
| Economic Structure Adjustment |
| By 2025, the proportion of the secondary industry will drop to 50%. By 2035, the proportion of the secondary industry will drop to 45%, and the proportion of low-carbon and high-efficiency industries in the secondary industry will increase by 10 percentage points | By 2025, the proportion of the secondary industry will drop to 50%. By 2035, the proportion of the secondary industry will drop to 40%, and the proportion of low-carbon and high-efficiency industries in the secondary industry will increase by 30 percentage points | AHEI |
| Electricity and heat supply |
| By 2035, coal consumption per kWh electricity generated will reduce 10% compared with the base year | By 2035, coal consumption per kWh electricity generated will reduce 20% compared with the base year | CFPE |
| By 2035, the electricity generated by coal power plant will increase no more than 50% compared with the base year | By 2035, the electricity generated by coal power plant will increase no more than 30% compared with the base year | RCPG | |
| By 2035, the electricity generated by photovoltaic energy and wind will increase by 5 and 12, respectively | By 2035, the electricity generated by photovoltaic energy and wind will increase by 10 and 14 times, respectively | EERE | |
| By 2035, 15% of the district heating will be provided by renewable energy or industrial waste heat | By 2035, 30% of district heating will be provided by renewable energy or industrial waste heat | DCDH | |
| Iron and steel |
| The production of crude steel will peak until the end of 2025, about 20% higher than the base year | The production of crude steel will peak around 2023, about 15% higher than the base year | CRST |
| By 2035, the proportion of crude steel production using scrap steel short process will increase to 10% | By 2035, the proportion of crude steel production using scrap steel short process will increase to 20% | PSUS | |
| By 2035, the energy consumption per CNY 10,000 of added value will decrease by 7% | By 2035, reduce energy consumption per 10,000 yuan of added value by 15% | ETIE | |
| Chemical Industry |
| By 2035, the proportion of coal consumption will decrease by 10%, the proportion of natural gas consumption will increase by 5%, and the proportion of electricity consumption will increase by 5% | By 2035, the proportion of coal consumption will decrease by 20%, the proportion of natural gas consumption will increase by 15%, and the proportion of electricity consumption will increase by 10% | RCES |
| By 2035, the energy consumption per CNY 10,000 of added value will reduce 15% | By 2035, the energy consumption per CNY 10,000 of added value will reduce 30% | IPEE | |
| Cement production |
| The production of cement clinker will peak at the end of the 14th Five-Year Plan | The production of cement clinker will peak in the early period of the “14th Five-Year Plan” | SCPC |
| By 2035, coal consumption will decrease 8% | By 2035, coal consumption will decrease 15% | AAFU | |
| By 2030, eliminate all 2000 t/day production lines, and production lines with energy efficiency levels that are 30% or more higher than the national leading value; by 2035, energy consumption per CNY 10,000 of added value will reduce by 7% | By 2030, eliminate all 2000 t/day production lines, and production lines with energy efficiency levels that are 30% or more higher than the national leading value; by 2035, energy consumption per CNY 10,000 of added value will reduce by 15% | AOPC | |
| Transportation |
| Eliminating all yellow-label cars and old cars by 2025, and phasing out all the cars with emission standards below national 4 by 2035 | By 2025, eliminating all the cars with emission standards below national 3, and phasing out those below national 5 by 2035. | REOV |
| By 2035, the proportion of biofuel oil consumption in the freight transportation will reach 4% | By 2035, the proportion of biofuel oil consumption in the freight transportation will reach 10% | IABF | |
| By 2035, the electrification rate of buses, private cars and freight vehicles will reach 80%, 10% and 10%, respectively | By 2035, the electrification rate of buses, private cars and freight vehicles will reach 100%, 20% and 20%, respectively | AETT | |
| By 2035, the city’s public transport trip share rate will increase 10 percentage points | By 2035, the city’s public transit trip share rate will increase by 20 percentage points | PPTR | |
| By 2035, the railway and water freight turnover will increase by 5% and 10%, respectively | By 2035, the railway and water freight turnover will increase by 10% and 15%, respectively | RTWR | |
| Building |
| By 2035, the energy consumption per unit building area will decrease 10% | By 2035, the energy consumption per unit building area will decrease 20% | BEEI |
| By 2035, the electricity in the energy mix will increase 10 percentage points, and the proportion of coal consumption will decrease 10 percentage points | By 2035, the electricity in the energy mix will increase 20 percentage points and the proportion of coal consumption will decrease 20 percentage points | RCAE |
| 2021–2025 | 2026–2030 | 2031–2035 | |
|---|---|---|---|
| Annual GDP increase | 5.5% | 5% | 4.5% |
| Annual population growth | 0.4% | 0.2% | 0.1% |
| Annual urbanization growth | 1.03% | 1.0% | 1.0% |
| Air Pollutants | Pollution Equivalent Value |
|---|---|
| PM2.5 | 4 |
| SO2 | 0.95 |
| NOx | 0.95 |
| VOCs | 0.95 |
| Sector | Measures | PM2.5 | NOx | VOCs | SO2 | APeq | Water |
|---|---|---|---|---|---|---|---|
| Adjust economic structure | AHEI | 0.987 | 1.356 | 1.090 | 1.123 | 1.183 | 3.349 |
| Electricity and heat supply | CFPE | 1.455 | 0.790 | 1.767 | 3.378 | 1.275 | 15.796 |
| RCPG | 1.452 | 0.791 | 1.763 | 3.367 | 1.274 | 3.242 | |
| EERE | - | - | - | - | - | - | |
| DCDH | 2.763 | 1.534 | 3.344 | 6.306 | 2.439 | - | |
| Iron and steel | CRST | 1.364 | 1.249 | 2.518 | 1.181 | 1.432 | 5.183 |
| PSUS | 0.253 | 0.913 | 0.710 | 0.432 | 0.594 | −6.815 | |
| ETIE | 1.100 | 1.280 | 1.991 | 1.110 | 1.342 | 5.670 | |
| Chemical industry | RCES | 2.328 | 21.413 | 0.354 | 6.218 | 1.206 | - |
| IPEE | 5.210 | 28.651 | 0.805 | 12.727 | 2.651 | - | |
| Cement production | SCPC | 0.285 | 0.315 | 0.277 | 0.235 | 0.278 | 7.656 |
| AAFU | 0.230 | 0.287 | 0.236 | 0.206 | 0.244 | - | |
| AOPC | 0.300 | 0.364 | 0.307 | 0.265 | 0.313 | - | |
| Transportation | REOV | 0.146 | 0.012 | 0.083 | 0.932 | 0.027 | - |
| IABF | - | - | - | - | - | - | |
| AETT | 1.173 | 0.092 | 0.088 | 4.355 | 0.134 | - | |
| PPTR | 3.176 | 1.141 | 0.488 | 4.540 | 1.019 | - | |
| RTWR | 0.316 | 0.020 | 0.082 | −0.080 | 0.048 | - | |
| Building | BEEI | 0.812 | 0.843 | 0.218 | 0.104 | 0.237 | - |
| RCAE | 0.180 | 0.911 | 0.229 | 0.024 | 0.081 | - |
Publisher’s Note: MDPI stays neutral with regard to jurisdictional claims in published maps and institutional affiliations. |
© 2022 by the authors. Licensee MDPI, Basel, Switzerland. This article is an open access article distributed under the terms and conditions of the Creative Commons Attribution (CC BY) license (https://creativecommons.org/licenses/by/4.0/).
Share and Cite
Yang, R.; Wang, M.; Zhao, M.; Feng, X. Synergic Benefits of Air Pollutant Reduction, CO2 Emission Abatement, and Water Saving under the Goal of Achieving Carbon Emission Peak: The Case of Tangshan City, China. Int. J. Environ. Res. Public Health 2022, 19, 7145. https://doi.org/10.3390/ijerph19127145
Yang R, Wang M, Zhao M, Feng X. Synergic Benefits of Air Pollutant Reduction, CO2 Emission Abatement, and Water Saving under the Goal of Achieving Carbon Emission Peak: The Case of Tangshan City, China. International Journal of Environmental Research and Public Health. 2022; 19(12):7145. https://doi.org/10.3390/ijerph19127145
Chicago/Turabian StyleYang, Rupu, Min Wang, Mengxue Zhao, and Xiangzhao Feng. 2022. "Synergic Benefits of Air Pollutant Reduction, CO2 Emission Abatement, and Water Saving under the Goal of Achieving Carbon Emission Peak: The Case of Tangshan City, China" International Journal of Environmental Research and Public Health 19, no. 12: 7145. https://doi.org/10.3390/ijerph19127145
APA StyleYang, R., Wang, M., Zhao, M., & Feng, X. (2022). Synergic Benefits of Air Pollutant Reduction, CO2 Emission Abatement, and Water Saving under the Goal of Achieving Carbon Emission Peak: The Case of Tangshan City, China. International Journal of Environmental Research and Public Health, 19(12), 7145. https://doi.org/10.3390/ijerph19127145


