
Do Active Commuters Feel More Competent and Vital? A Self-Organizing Maps Analysis in University Students

 ,
,  ,
,  ,
,  and
and 
Abstract
:1. Introduction
2. Materials and Methods
2.1. Sample
2.2. Measures
2.2.1. Leisure-Time Physical Activity
2.2.2. Subjective Vitality
2.2.3. Perceived Physical Ability
2.2.4. Active Commuting to and from University
2.2.5. Demographic and Anthropometric Data
2.3. Data Analysis
3. Results
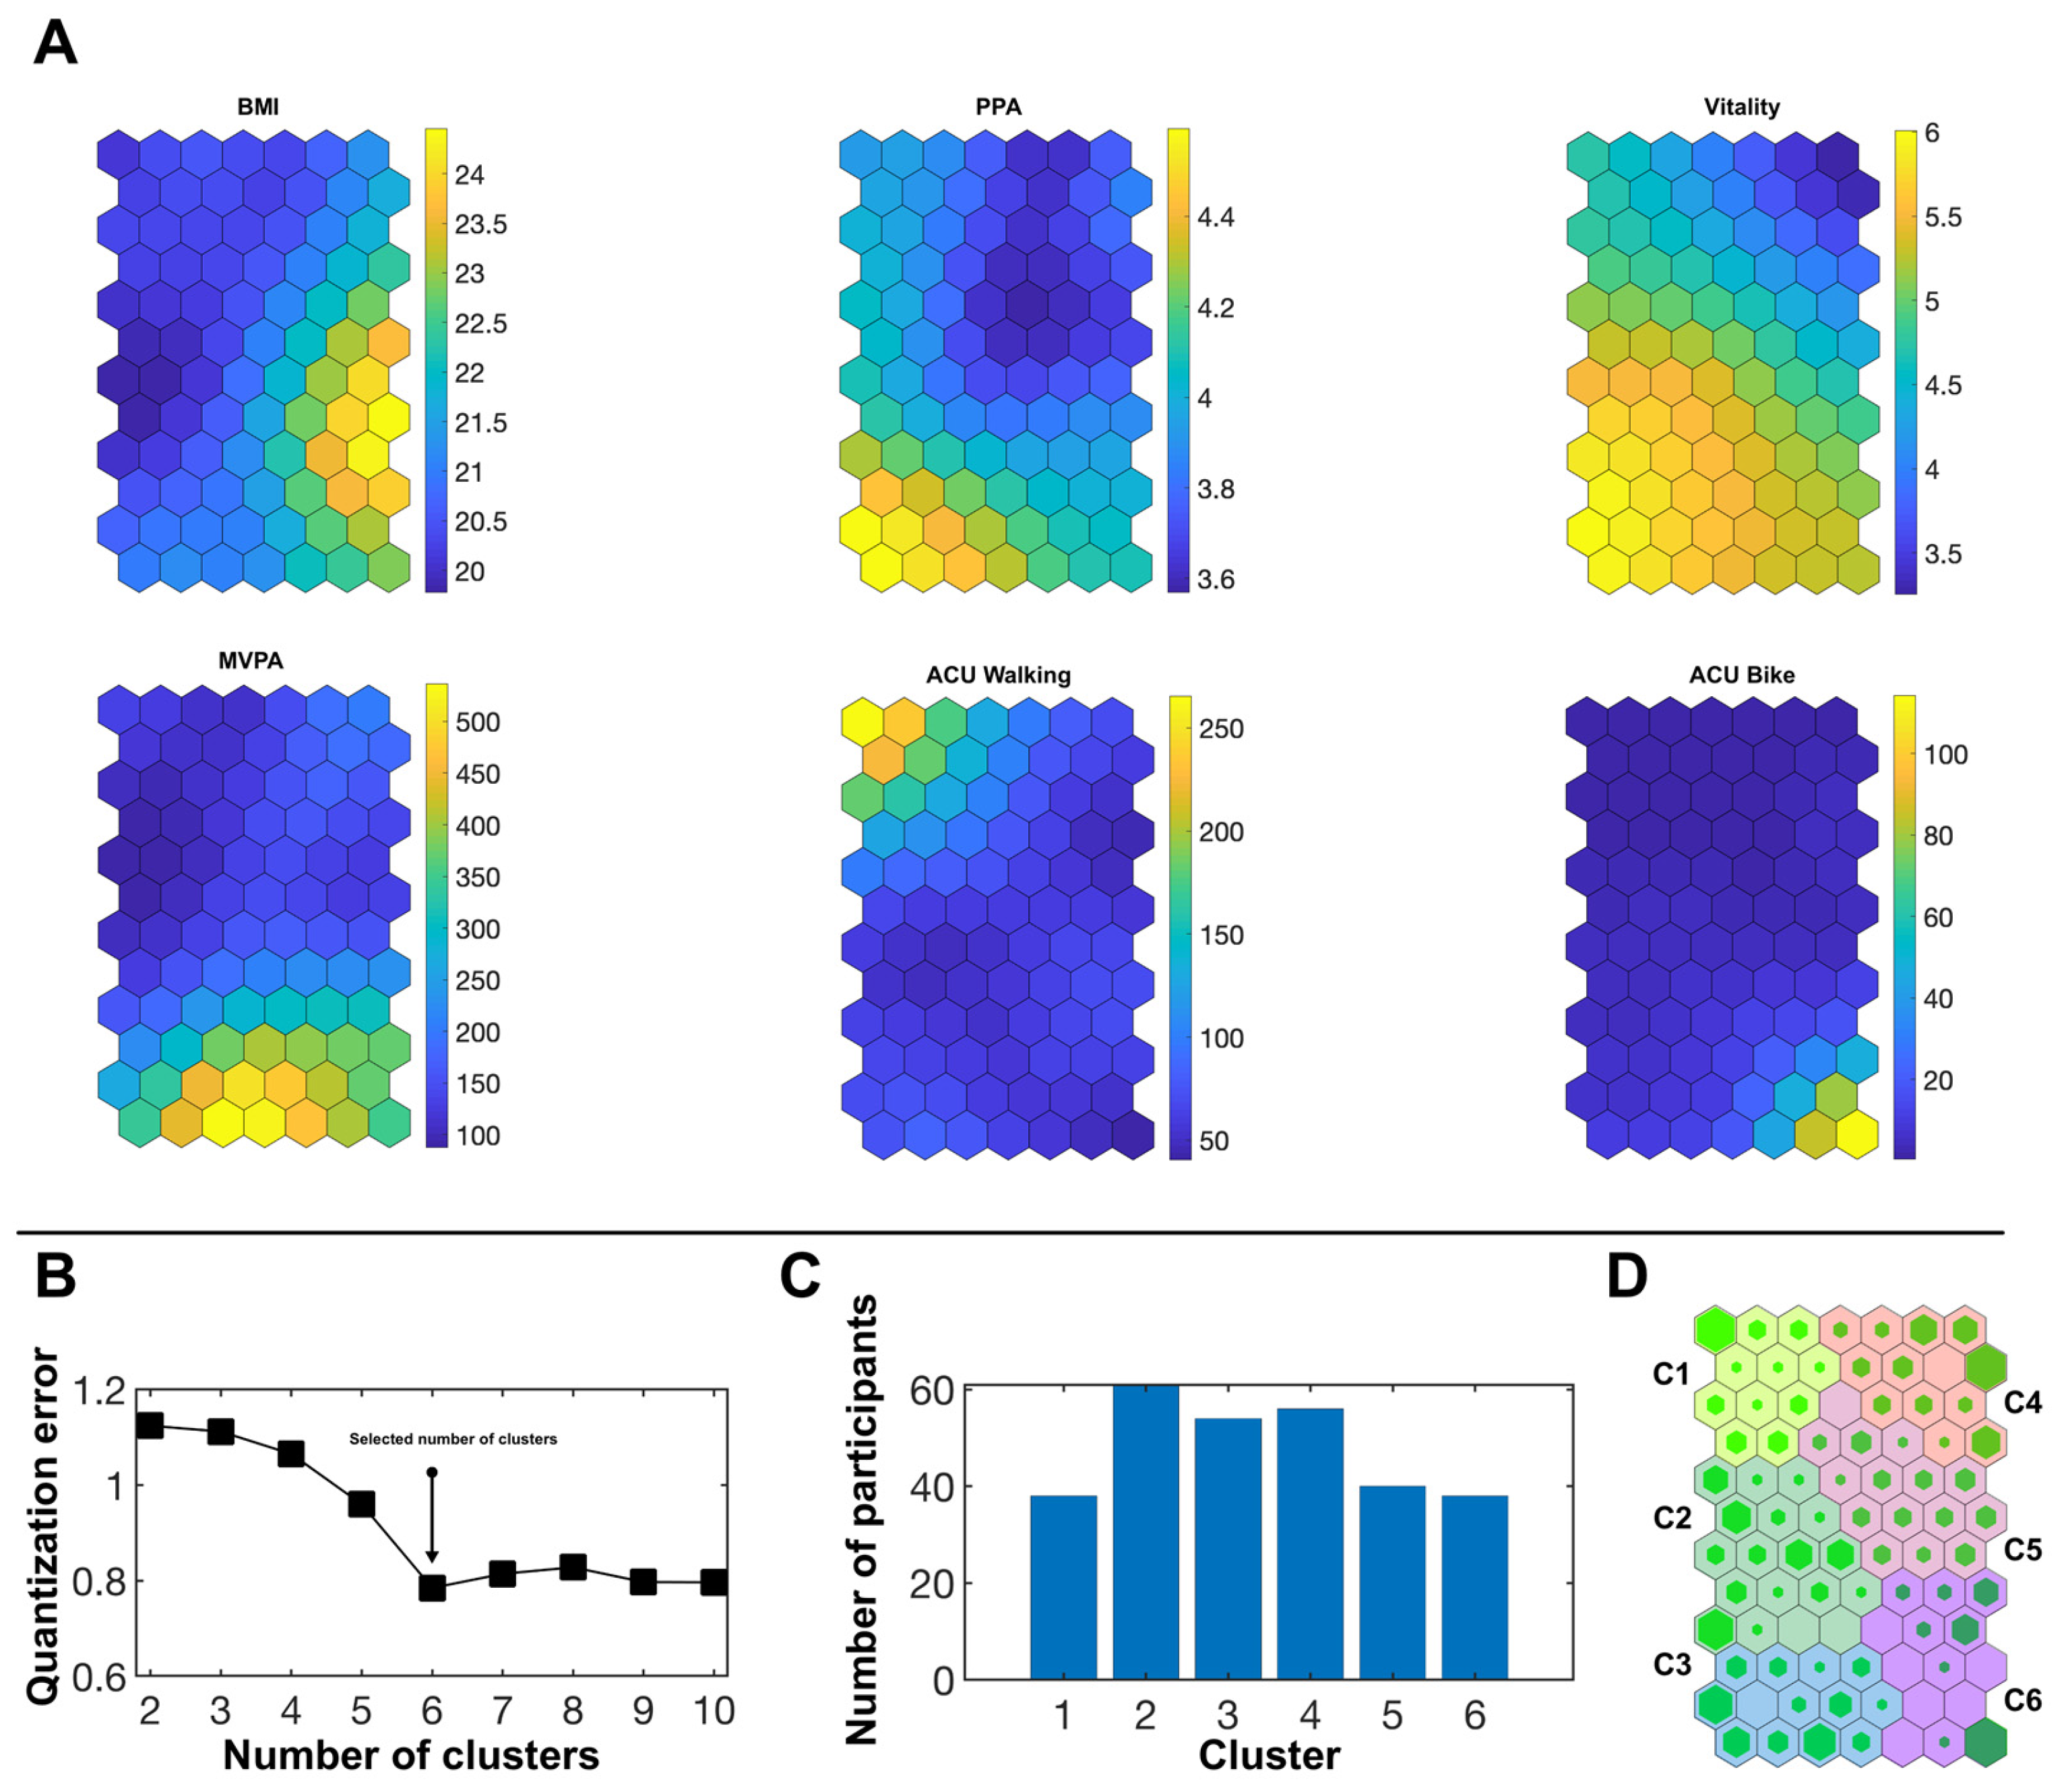
3.1. Females
3.2. Males
4. Discussion
5. Conclusions
Supplementary Materials
Author Contributions
Funding
Institutional Review Board Statement
Informed Consent Statement
Data Availability Statement
Acknowledgments
Conflicts of Interest
References
- Bull, F.C.; Al-Ansari, S.S.; Biddle, S.; Borodulin, K.; Buman, M.P.; Cardon, G.; Carty, C.; Chaput, J.-P.; Chastin, S.; Chou, R.; et al. World Health Organization 2020 guidelines on physical activity and sedentary behaviour. Br. J. Sports Med. 2020, 54, 1451–1462. [Google Scholar] [CrossRef] [PubMed]
- Warburton, D.E.R.; Nicol, C.W.; Bredin, S.S.D. Health benefits of physical activity: The evidence. Can. Med. Assoc. J. 2006, 174, 801–809. [Google Scholar] [CrossRef] [PubMed] [Green Version]
- Hankinson, A.L.; Daviglus, M.L.; Bouchard, C.; Carnethon, M.; Lewis, C.E.; Schreiner, P.J.; Liu, K.; Sidney, S. Maintaining a high physical activity level over 20 years and weight gain. JAMA 2010, 304, 2603–2610. [Google Scholar] [CrossRef] [PubMed] [Green Version]
- Molina-García, J.; Castillo, I.; Queralt, A. Leisure-time physical activity and psychological well-being in university students. Psychol. Rep. 2011, 109, 453–460. [Google Scholar] [CrossRef]
- Ryan, R.M.; Frederick, C. On Energy, Personality, and Health: Subjective Vitality as a Dynamic Reflection of Well-Being. J. Pers. 1997, 65, 529–565. [Google Scholar] [CrossRef]
- Castillo, I.; Tomas, I.; Balaguer, I. The Spanish-Version of the Subjective Vitality Scale: Psychometric Properties and Evidence of Validity. Span. J. Psychol. 2017, 20, E26. [Google Scholar] [CrossRef]
- Rozanski, A. Integrating psychologic approaches into the behavioral management of cardiac patients. Psychosom. Med. 2005, 67, S67–S73. [Google Scholar] [CrossRef]
- Rozanski, A.; Blumenthal, J.A.; Davidson, K.W.; Saab, P.G.; Kubzansky, L. The epidemiology, pathophysiology, and management of psychosocial risk factors in cardiac practice: The emerging field of behavioral cardiology. J. Am. Coll. Cardiol. 2005, 45, 637–651. [Google Scholar] [CrossRef] [Green Version]
- Maynard, S.; Keijzers, G.; Hansen, A.M.; Osler, M.; Molbo, D.; Bendix, L.; Møller, P.; Loft, S.; Moreno-Villanueva, M.; Bürkle, A.; et al. Associations of subjective vitality with DNA damage, cardiovascular risk factors and physical performance. Acta Physiol. 2015, 213, 156–170. [Google Scholar] [CrossRef] [Green Version]
- Swencionis, C.; Wylie-Rosett, J.; Lent, M.R.; Ginsberg, M.; Cimino, C.; Wassertheil-Smoller, S.; Caban, A.; Segal-Isaacson, C.J. Weight change, psychological well-being, and vitality in adults participating in a cognitive-behavioral weight loss program. Health Psychol. 2013, 32, 439–446. [Google Scholar] [CrossRef] [Green Version]
- Thayer, R.E. Energy, tiredness, and tension effects of a sugar snack versus moderate exercise. J. Pers. Soc. Psychol. 1987, 52, 119–125. [Google Scholar] [CrossRef] [PubMed]
- Thøgersen-Ntoumani, C.; Loughren, E.A.; Taylor, I.M.; Duda, J.L.; Fox, K.R. A step in the right direction? Change in mental well-being and self-reported work performance among physically inactive university employees during a walking intervention. Ment. Health Phys. Act. 2014, 7, 89–94. [Google Scholar] [CrossRef] [Green Version]
- Ryan, R.M.; Weinstein, N.; Bernstein, J.; Brown, K.W.; Mistretta, L.; Gagné, M. Vitalizing effects of being outdoors and in nature. J. Environ. Psychol. 2010, 30, 159–168. [Google Scholar] [CrossRef]
- Goldbeck, F.; Hautzinger, M.; Wolkenstein, L. Validation of the German Version of the Subjective Vitality Scale a Cross-Sectional Study and a Randomized Controlled Trial. J. Well-Being Assess 2019, 3, 17–37. [Google Scholar] [CrossRef]
- Tyrväinen, L.; Ojala, A.; Korpela, K.; Lanki, T.; Tsunetsugu, Y.; Kagawa, T. The influence of urban green environments on stress relief measures: A field experiment. J. Environ. Psychol. 2014, 38, 1–9. [Google Scholar] [CrossRef]
- Ellingson, L.D.; Kuffel, A.E.; Vack, N.J.; Cook, D.B. Active and sedentary behaviors influence feelings of energy and fatigue in women. Med. Sci. Sports Exerc. 2014, 46, 192–200. [Google Scholar] [CrossRef]
- Deci, E.L.; Ryan, R.M. Self-determination theory: A macrotheory of human motivation, development, and health. Can. Psychol. 2008, 49, 182–185. [Google Scholar] [CrossRef] [Green Version]
- Vlachopoulos, S.P. The role of self-determination theory variables in predicting middle school students’ subjective vitality in physical education. Hell J. Psychol. 2012, 9, 179–204. [Google Scholar]
- Williams, D.M. Exercise, Affect, and Adherence: An Integrated Model and a Case for Self-Paced Exercise. J. Sport Exerc. Psychol. 2008, 30, 471–496. [Google Scholar] [CrossRef]
- Lewis, P.; Kimiecik, J.; Horn, T.S.; Zullig, K.J.; Ward, R.M. Can Becoming My Self Influence My Health?: Exploring the Effects of a Eudaimonic-Enhancement Process on Psychological Indicators of Well-Being and Physical Activity. Appl. Res. Qual. Life 2014, 9, 643–665. [Google Scholar] [CrossRef]
- Ryan, R.M.; Deci, E.L. From ego depletion to vitality: Theory and findings concerning the facilitation of energy available to the self. Soc. Pers. Psychol. Compass 2008, 2, 702–717. [Google Scholar] [CrossRef]
- Kang, J.-H.; Ji, Y.-H.; Baek, W.-Y.; Byon, K.K. Structural Relationship among Physical Self-Efficacy, Psychological Well-Being, and Organizational Citizenship Behavior among Hotel Employees: Moderating Effects of Leisure-Time Physical Activity. Int. J. Environ. Res. Public Health 2020, 17, 8856. [Google Scholar] [CrossRef] [PubMed]
- Yu, C.-A.; Rouse, P.C.; Van Zanten, J.V.J.; Metsios, G.S.; Ntoumanis, N.; Kitas, G.D.; Duda, J.L. Motivation-related predictors of physical activity engagement and vitality in rheumatoid arthritis patients. Health Psychol. Open 2015, 2, 1–9. [Google Scholar] [CrossRef] [PubMed] [Green Version]
- Chung, P.-K.; Zhong, T.; Liu, J.-D.; Zhang, C.-Q.; Wong, M.Y.C. Development and initial validation of the Psychological Need Frustration Scale for Physical Activity. PeerJ 2020, 8, 9210. [Google Scholar] [CrossRef] [PubMed]
- Taylor, I.M.; Lonsdale, C. Cultural differences in the relationships among autonomy support, psychological need satisfaction, subjective vitality, and effort in British and Chinese physical education. J. Sport Exerc. Psychol. 2010, 32, 655–673. [Google Scholar] [CrossRef] [PubMed] [Green Version]
- Yu, S.; Zhang, F.; Nunes, L.D.; Deng, Y.; Levesque-Bristol, C. Basic psychological needs as a predictor of positive affects: A look at peace of mind and vitality in Chinese and American college students. J. Posit. Psychol. 2019, 15, 488–499. [Google Scholar] [CrossRef]
- Wilson, P.M.; Longley, K.; Muon, S.; Rodgers, W.M.; Murray, T.C. Examining the contributions of perceived psychological need satisfaction to well-being in exercise. J. Appl. Biobehav. Res. 2006, 11, 243–264. [Google Scholar] [CrossRef]
- Gunnell, K.E.; Crocker, P.R.E.; Mack, D.E.; Wilson, P.M.; Zumbo, B.D. Goal contents, motivation, psychological need satisfaction, well-being and physical activity: A test of self-determination theory over 6 months. Psychol. Sport Exerc. 2014, 15, 19–29. [Google Scholar] [CrossRef]
- Gunnell, K.E.; Crocker, P.R.E.; Wilson, P.M.; Mack, D.E.; Zumbo, B.D. Psychological need satisfaction and thwarting: A test of Basic Psychological Needs Theory in physical activity contexts. Psychol. Sport Exerc. 2013, 14, 599–607. [Google Scholar] [CrossRef]
- León, J.; Núñez, J.L. Causal Ordering of Basic Psychological Needs and Well-Being. Soc. Indicat. Res. 2013, 114, 243–253. [Google Scholar] [CrossRef]
- Sheldon, K.M.; Ryan, R.; Reis, H.T. What makes for a good day? Competence and autonomy in the day and in the person. Pers Soc. Psychol. Bull. 1996, 22, 1270–1279. [Google Scholar] [CrossRef]
- Reis, H.T.; Sheldon, K.M.; Gable, S.L.; Roscoe, J.; Ryan, R.M. Daily Well-Being: The Role of Autonomy, Competence, and Relatedness. Pers. Soc. Psychol. Bull. 2000, 26, 419–435. [Google Scholar] [CrossRef]
- Ryan, R.M.; Bernstein, J.H.; Warren Brown, K. Weekends, work, and well-being: Psychological need satisfactions and day of the week effects on mood, vitality, and physical symptoms. J. Soc. Clin. Psychol. 2010, 29, 95–122. [Google Scholar] [CrossRef]
- Gagné, M. Autonomy Support and Need Satisfaction in the Motivation and Well-Being of Gymnasts. J. Appl. Sport Psychol. 2003, 15, 372–390. [Google Scholar] [CrossRef]
- World Health Organization. Global Action Plan on Physical Activity 2018–2030: More Active People for a Healthier World; World Health Organization: Geneva, Switzerland, 2018.
- Wanner, M.; Gotschi, T.; Martin-Diener, E.; Kahlmeier, S.; Martin, B.W. Active transport, physical activity, and body weight in adults: A systematic review. Am. J. Prev. Med. 2012, 42, 493–502. [Google Scholar] [CrossRef] [Green Version]
- Martin, A.; Goryakin, Y.; Suhrcke, M. Does active commuting improve psychological wellbeing? Longitudinal evidence from eighteen waves of the British Household Panel Survey. Prev. Med. 2014, 69, 296–303. [Google Scholar] [CrossRef]
- Ramanathan, S.; O’Brien, C.; Faulkner, G.; Stone, M. Happiness in motion: Emotions, well-being, and active school travel. J. Sch. Health 2014, 84, 516–523. [Google Scholar] [CrossRef]
- Ruiz-Ariza, A.; de la Torre-Cruz, M.J.; Redecillas-Peiro, M.T.; Martinez-Lopez, E.J. Influence of active commuting on happiness, well-being, psychological distress and body shape in adolescents. Gac. Sanit. 2015, 29, 454–457. [Google Scholar] [CrossRef] [Green Version]
- Kleszczewska, D.; Mazur, J.; Bucksch, J.; Dzielska, A.; Brindley, C.; Michalska, A. Active Transport to School May Reduce Psychosomatic Symptoms in School-Aged Children: Data from Nine Countries. Int. J. Environ. Res. Public Health 2020, 17, 8709. [Google Scholar] [CrossRef]
- Molina-García, J.; Castillo, I.; Pablos, C. Determinants of leisure-time physical activity and future intention to practice in Spanish college students. Span. J. Psychol. 2009, 12, 128–137. [Google Scholar] [CrossRef]
- Deforche, B.; Van Dyck, D.; Deliens, T.; De Bourdeaudhuij, I. Changes in weight, physical activity, sedentary behaviour and dietary intake during the transition to higher education: A prospective study. Int. J. Behav. Nutr. Phys. Activ. 2015, 12, 16. [Google Scholar] [CrossRef] [PubMed] [Green Version]
- Clemente, F.M.; Nikolaidis, P.T.; Martins, F.M.; Mendes, R.S. Physical Activity Patterns in University Students: Do They Follow the Public Health Guidelines? PLoS ONE 2016, 11, e0152516. [Google Scholar] [CrossRef] [PubMed]
- Molina-García, J.; Queralt, A.; Castillo, I.; Sallis, J.F. Changes in Physical Activity Domains During the Transition Out of High School: Psychosocial and Environmental Correlates. J. Phys. Act. Health 2015, 12, 1414–1420. [Google Scholar] [CrossRef] [PubMed]
- Parra-Saldias, M.; Castro-Pinero, J.; Castillo Paredes, A.; Palma Leal, X.; Diaz Martinez, X.; Rodriguez-Rodriguez, F. Active Commuting Behaviours from High School to University in Chile: A Retrospective Study. Int. J. Environ. Res. Public Health 2018, 16, 53. [Google Scholar] [CrossRef] [PubMed] [Green Version]
- Bray, S.R.; Born, H.A. Transition to university and vigorous physical activity: Implications for health and psychological well-being. J. Am. Coll. Health 2004, 52, 181–188. [Google Scholar] [CrossRef] [PubMed]
- World Health Organization. Global Recommendations on Physical Activity for Health; World Health Organization: Geneva, Switzerland, 2010.
- Cocca, A.; Liukkonen, J.; Mayorga-Vega, D.; Viciana-Ramirez, J. Health-related physical activity levels in Spanish youth and young adults. Percept. Mot. Skills 2014, 118, 247–260. [Google Scholar] [CrossRef]
- Keating, X.D.; Guan, J.; Pinero, J.C.; Bridges, D.M. A meta-analysis of college students’ physical activity behaviors. J. Am. Coll. Health 2005, 54, 116–125. [Google Scholar] [CrossRef]
- Molina-García, J.; Sallis, J.F.; Castillo, I. Active commuting and sociodemographic factors among university students in Spain. J. Phys. Act. Health 2014, 11, 359–363. [Google Scholar] [CrossRef]
- Garcia-Hermoso, A.; Quintero, A.P.; Hernandez, E.; Correa-Bautista, J.E.; Izquierdo, M.; Tordecilla-Sanders, A.; Prieto-Benavides, D.; Sandoval-Cuellar, C.; Gonzalez-Ruiz, K.; Villa-Gonzalez, E.; et al. Active commuting to and from university, obesity and metabolic syndrome among Colombian university students. BMC Publ. Health 2018, 18, 523. [Google Scholar] [CrossRef] [Green Version]
- Strong, K.A.; Parks, S.L.; Anderson, E.; Winett, R.; Davy, B.M. Weight gain prevention: Identifying theory-based targets for health behavior change in young adults. J. Am. Diet Assoc. 2008, 108, 1708–1715. [Google Scholar] [CrossRef] [Green Version]
- Bechter, B.E.; Dimmock, J.A.; Howard, J.L.; Whipp, P.R.; Jackson, B. Student motivation in high school physical education: A latent profile analysis approach. J. Sport Exerc. Psychol. 2018, 40, 206–216. [Google Scholar] [CrossRef] [PubMed]
- Bergman, L.R.; Andersson, H. The person and the variable in developmental psychology. Z. Psychol. 2010, 218, 155–165. [Google Scholar] [CrossRef]
- Bergman, L.R.; Lundh, L.-G. Introduction: The Person-Oriented Approach: Roots and Roads to the Future. J. Pers. Oriented Res. 2015, 1, 1–6. [Google Scholar] [CrossRef] [Green Version]
- Gut, V.; Schmid, J.; Conzelmann, A. The interaction of behavioral context and motivational-volitional factors for exercise and sport in adolescence: Patterns matter. BMC Publ. Health 2020, 20, 570. [Google Scholar] [CrossRef]
- Bull, F.C.; Maslin, T.S.; Armstrong, T. Global physical activity questionnaire (GPAQ): Nine country reliability and validity study. J. Phys. Act. Health 2009, 6, 790–804. [Google Scholar] [CrossRef] [Green Version]
- Ryckman, R.M.; Robbins, M.A.; Thornton, B.; Cantrell, P. Development and validation of a physical self-efficacy scale. J. Pers. Soc. Psychol. 1982, 42, 891–900. [Google Scholar] [CrossRef]
- Molina-García, J.; García-Massó, X.; Estevan, I.; Queralt, A. Built Environment, Psychosocial Factors and Active Commuting to School in Adolescents: Clustering a Self-Organizing Map Analysis. Int. J. Environ. Res. Public Health 2019, 16, 83. [Google Scholar] [CrossRef] [Green Version]
- Molina-García, J.; Castillo, I.; Sallis, J.F. Psychosocial and environmental correlates of active commuting for university students. Prev. Med. 2010, 51, 136–138. [Google Scholar] [CrossRef]
- Kohonen, T. The Self-Organizing Map; Springer: Berlin/Heidelberg, Germany, 1995. [Google Scholar]
- Vesanto, J.; Himberg, J.; Alhoniemi, E.; Parhankangas, J. Self-organizing map in Matlab: The SOM Toolbox. In Proceedings of the Matlab DSP Conference, Espoo, Finland, 16–17 November 1999; pp. 16–17. [Google Scholar]
- Herrero-Herrero, M.; García-Massó, X.; Martínez-Corralo, C.; Prades-Piñón, J.; Sanchis-Alfonso, V. Relationship between the practice of physical activity and quality of movement in adolescents: A screening tool using self-organizing maps. Phys. Sportsmed. 2017, 45, 271–279. [Google Scholar] [CrossRef]
- Budayan, C.; Dikmen, I.; Birgonul, M.T. Comparing the performance of traditional cluster analysis, self-organizing maps and fuzzy C-means method for strategic grouping. Expert Syst. Appl. 2009, 36, 11772–11781. [Google Scholar] [CrossRef]
- Melo Riveros, N.A.; Cardenas Espitia, B.A.; Aparicio Pico, L.E. Comparison between K-means and Self-Organizing Maps algorithms used for diagnosis spinal column patients. Inform. Med. Unlocked 2019, 16, 100206. [Google Scholar] [CrossRef]
- Pellicer-Chenoll, M.; García-Massó, X.; Morales, J.; Serra-Ano, P.; Solana-Tramunt, M.; Gonzalez, L.M.; Toca-Herrera, J.L. Physical activity, physical fitness and academic achievement in adolescents: A self-organizing maps approach. Health Educ. Res. 2015, 30, 436–448. [Google Scholar] [CrossRef] [PubMed] [Green Version]
- Oliver Gasch, E.; Vallés Pérez, I.; Baños Rivera, R.M.; Cebolla i Martí, A.J.; Botella Arbona, C.; Soria Olivas, E. Visual data mining with self-organizing maps for “self-monitoring” data analysis. Soc. Meth. Res. 2018, 47, 492–506. [Google Scholar] [CrossRef] [Green Version]
- Estevan, I.; García-Massó, X.; Molina-García, J.; Barnett, L.M. Identifying profiles of children at risk of being less physically active: An exploratory study using a self-organised map approach for motor competence. J. Sports Sci. 2019, 37, 1356–1364. [Google Scholar] [CrossRef]
- Kohonen, T.; Nieminen, I.T.; Honkela, T. On the Quantization Error in SOM vs. VQ: A Critical and Systematic Study. In International Workshop on Self-Organizing Maps; Springer: Berlin/Heidelberg, Germany, 2009. [Google Scholar]
- Jackson, C.E.; DiPlacido, J. Vitality as a Mediator between Diet Quality and Subjective Wellbeing among College Students. J Happiness Stud. 2020, 21, 1617–1639. [Google Scholar] [CrossRef]
- Bartzokas-Tsiompras, A.; Photis, Y.N.; Tsagkis, P.; Panagiotopoulos, G. Microscale walkability indicators for fifty-nine European central urban areas: An open-access tabular dataset and a geospatial web-based platform. Data Br. 2021, 36, 107048. [Google Scholar] [CrossRef]
- Gibson, A.-M.; Muggeridge, D.J.; Hughes, A.R.; Kelly, L.; Kirk, A. An examination of objectively-measured sedentary behavior and mental well-being in adults across week days and weekends. PLoS ONE 2017, 12, e0185143. [Google Scholar] [CrossRef] [Green Version]
- Cheval, B.; Sivaramakrishnan, H.; Maltagliati, S.; Fessler, L.; Forestier, C.; Sarrazin, P.; Orsholits, D.; Chalabaev, A.; Sander, D.; Ntoumanis, N.; et al. Relationships between changes in self-reported physical activity, sedentary behaviour and health during the coronavirus (COVID-19) pandemic in France and Switzerland. J. Sports Sci. 2021, 39, 699–704. [Google Scholar] [CrossRef]
- Schmitt, A.; Belschak, F.D.; Den Hartog, D.N. Feeling vital after a good night’s sleep: The interplay of energetic resources and self-efficacy for daily proactivity. J. Occup. Health Psychol. 2017, 22, 443–454. [Google Scholar] [CrossRef]
- Carmeli, A.; Peng, A.C.; Schaubroeck, J.M.; Amir, I. Social support as a source of vitality among college students: The moderating role of social self-efficacy. Psychol. Sch. 2021, 58, 351–363. [Google Scholar] [CrossRef]
- Trost, S.G. State of the Art Reviews: Measurement of Physical Activity in Children and Adolescents. Am. J. Lifestyle Med. 2007, 1, 299–314. [Google Scholar] [CrossRef]
- Hänggi, J.M.; Phillips, L.R.; Rowlands, A.V. Validation of the GT3X ActiGraph in children and comparison with the GT1M ActiGraph. J. Sci. Med. Sport 2013, 16, 40–44. [Google Scholar] [CrossRef] [PubMed]
- Yang, Y.; Diez Roux, A.V.; Bingham, C.R. Variability and seasonality of active transportation in USA: Evidence from the 2001 NHTS. Int. J. Behav. Nutr. Phys. Act. 2011, 8, 96. [Google Scholar] [CrossRef] [PubMed] [Green Version]
- Børrestad, L.A.; Andersen, L.B.; Bere, E. Seasonal and socio-demographic determinants of school commuting. Prev. Med. 2011, 52, 133–135. [Google Scholar] [CrossRef] [PubMed]


| Weight Status (% Normal/Overweight) | SES | Age (Years) | BMI (kg/m2) | PPA | Subjective Vitality | ACU Walking (min/Week) | ACU Bike (min/Week) | MVPA (min/Week) | |
|---|---|---|---|---|---|---|---|---|---|
| Men | 83.2/16.8 | 3.09 | 21.54 | 23.26 | 4.51 | 5.32 | 79.25 | 18.02 | 520.25 |
| (n = 197) | (0.66) | (2.29) | (2.43) | (0.53) | (0.97) | (88.27) | (46.30) | (400.94) | |
| Women | 92.7/7.3 | 3.07 | 21.11 | 21.34 | 4.01 | 4.90 | 85.55 | 14.11 | 217.06 |
| (n = 287) | (0.67) | (2.61) | (2.68) a | (0.53) a | (1.04) a | (88.34) | (45.88) | (283.93) a | |
| Total | 88.8/11.2 | 3.08 | 21.29 | 22.12 | 4.21 | 5.07 | 82.99 | 15.70 | 340.46 |
| (n = 484) | (0.66) | (2.49) | (2.75) | (0.59) | (1.03) | (88.27) | (46.04) | (367.70) |
| Weight Status (% Normal/Overweight) | SES | Age (Years) | BMI (kg/m2) | PPA | Subjective Vitality | ACU Walking (min/Week) | ACU Bike (min/Week) | MVPA (min/Week) | |
|---|---|---|---|---|---|---|---|---|---|
| Cluster 1 | 100/0 | 3.05 | 20.97 | 20.40 | 4.04 | 4.66 | 230.52 | 0.00 | 117.11 |
| (n = 38) | (0.40) | (2.81) | (1.77) 5,6 | (0.38) 3,4,5 | (0.60) 2,3,4,6 | (101.73) all | (0.00) 6 | (144.67) 3,6 | |
| Cluster 2 | 100/0 | 3.02 | 20.52 | 19.57 | 4.00 | 5.58 | 51.13 | 5.43 | 94.75 |
| (n = 61) | (0.65) | (2.59) 3 | (1.36) 3,4,5,6 | (0.40) 3,4,5 | (0.52) 1,3,4,5 | (44.36) 1 | (17.07) 6 | (114.14) 3,6 | |
| Cluster 3 | 98.1/1.9 | 3.26 | 21.56 | 20.89 | 4.61 | 5.84 | 71.70 | 6.44 | 505.65 |
| (n = 54) | (0.62) 4,5 | (2.65) 2 | (1.68) 2,5,6 | (0.41) all | (0.56) all | (70.97) 1 | (20.77) 6 | (353.99) all | |
| Cluster 4 | 98.2/1.8 | 2.98 | 21.16 | 21.18 | 3.77 | 3.35 | 66.02 | 3.75 | 155.36 |
| (n = 56) | (0.67) 3 | (2.94) | (2.21) 2,5,6 | (0.46) all | (0.56) all | (60.30) 1 | (17.22) 6 | (269.63) 3,6 | |
| Cluster 5 | 90.0/10.0 | 2.90 | 21.08 | 22.56 | 3.44 | 4.58 | 72.20 | 0.00 | 131.63 |
| (n = 40) | (0.63) 3 | (2.42) | (2.75) all | (0.37) all | (0.49) 2,3,4,6 | (54.15) 1 | (0.00) 6 | (182.95) 3,6 | |
| Cluster 6 | 60.5/39.5 | 3.18 | 21.53 | 24.71 | 4.06 | 5.36 | 58.34 | 83.16 | 284.08 |
| (n = 38) | (0.93) | (1.98) | (3.23) all | (0.32)3,4,5 | (0.59) 1,3,4,5 | (75.68) 1 | (95.13) all | (288.97) all | |
| Total | 92.7/7.3 | 3.07 | 21.11 | 21.34 | 4.01 | 4.90 | 85.55 | 14.11 | 217.06 |
| (n = 287) | (0.67) | (2.61) | (2.68) | (0.53) | (1.04) | (88.34) | (45.88) | (283.93) |
| BMI | PPA | Subjective Vitality | ACU Walking | ACU Bike | MVPA | |
|---|---|---|---|---|---|---|
| Cluster 1 “walkers” | - | o | - | ++ | o | o |
| Cluster 2 “vital sloths” | - | o | + | o | o | o |
| Cluster 3 “feel-good leisure-time actives” | o | ++ | ++ | o | o | ++ |
| Cluster 4 “unvitals” | o | - | - - | o | o | o |
| Cluster 5 “perceived incompetents” | + | - - | - | o | o | o |
| Cluster 6 “bikers” | ++ | o | + | o | + | + |
| Weight Status (% Normal/Overweight) | SES | Age (Years) | BMI (kg/m2) | PPA | Subjective Vitality | ACU Walking (min/Week) | ACU Bike (min/Week) | MVPA (min/Week) | |
|---|---|---|---|---|---|---|---|---|---|
| Cluster 1 | 92.9/7.1 | 3.21 | 22.00 | 22.74 | 4.59 | 5.36 | 15.93 | 102.71 | 822.14 |
| (n = 28) | (0.63) 3 | (2.64) 6 | (1.72) | (0.38) 4,6 | (0.77) 4,6 | (27.38) 2,3,4,6 | (74.31) all | (602.02) 3,4,5,6 | |
| Cluster 2 | 81.2/18.8 | 3.06 | 20.81 | 23.46 | 4.55 | 5.25 | 102.37 | 6.25 | 674.69 |
| (n = 16) | (0.57) | (1.33) 4 | (2.12) | (0.33) 4,6 | (0.34) 4,6 | (26.07) all | (17.46) 1 | (315.91) 3,5,6 | |
| Cluster 3 | 72.4/27.6 | 2.83 | 20.97 | 23.66 | 4.44 | 5.04 | 239.31 | 0.69 | 433.28 |
| (n = 29) | (0.76) 1,5 | (2.11) 4 | (2.28) | (0.41) 4,6 | (0.77) 4,5,6 | (87.71) all | (3.71) 1 | (324.74) 1,2,4 | |
| Cluster 4 | 91.7/8.3 | 3.04 | 22.15 | 23.10 | 4.96 | 6.22 | 63.19 | 1.98 | 627.60 |
| (n = 48) | (0.74) | (2.27) 2,3,6 | (1.94) | (0.40) all | (0.53) all | (56.30) 1,2,3,5 | (8.43) 1 | (383.54) 1,3,5,6 | |
| Cluster 5 | 76.7/23.3 | 3.28 | 21.77 | 23.89 | 4.46 | 5.53 | 34.28 | 2.98 | 393.72 |
| (n = 43) | (0.63) 3 | (2.17) | (3.41) 6 | (0.38) 4,6 | (0.50) 3,4,6 | (34.31) 2,3,4,6 | (11.17) 1 | (222.59) 1,2,4 | |
| Cluster 6 | 81.8/18.2 | 3.06 | 20.82 | 22.67 | 3.91 | 3.96 | 63.09 | 10.00 | 274.39 |
| (n = 33) | (0.50) | (2.43) 1,4 | (2.18) 5 | (0.55) all | (0.86) all | (58.91) 1,2,3,5 | (25.98) 1 | (242.94) 1,2,4 | |
| Total | 83.2/16.8 | 2.11 | 21.54 | 23.26 | 4.51 | 5.32 | 79.25 | 18.02 | 520.25 |
| (n = 197) | (0.57) | (2.29) | (2.43) | (0.53) | (0.97) | (88.27) | (46.30) | (400.94) |
| BMI | PPA | Subjective Vitality | ACU Walking | ACU Bike | MVPA | |
|---|---|---|---|---|---|---|
| Cluster 1 “cycling leisure-time actives” | o | o | o | - | ++ | ++ |
| Cluster 2 “walking leisure-time actives” | o | o | o | + | o | + |
| Cluster 3 “walkers” | + | o | - | ++ | o | o |
| Cluster 4 “feel-good leisure-time actives” | o | ++ | ++ | o | o | + |
| Cluster 5 “passive commuters” | + | o | o | - | o | o |
| Cluster 6 “feel-bad sloths” | o | - - | - - | o | o | - |
Publisher’s Note: MDPI stays neutral with regard to jurisdictional claims in published maps and institutional affiliations. |
© 2022 by the authors. Licensee MDPI, Basel, Switzerland. This article is an open access article distributed under the terms and conditions of the Creative Commons Attribution (CC BY) license (https://creativecommons.org/licenses/by/4.0/).
Share and Cite
Bachner, J.; García-Massó, X.; Castillo, I.; Mess, F.; Molina-García, J. Do Active Commuters Feel More Competent and Vital? A Self-Organizing Maps Analysis in University Students. Int. J. Environ. Res. Public Health 2022, 19, 7239. https://doi.org/10.3390/ijerph19127239
Bachner J, García-Massó X, Castillo I, Mess F, Molina-García J. Do Active Commuters Feel More Competent and Vital? A Self-Organizing Maps Analysis in University Students. International Journal of Environmental Research and Public Health. 2022; 19(12):7239. https://doi.org/10.3390/ijerph19127239
Chicago/Turabian StyleBachner, Joachim, Xavier García-Massó, Isabel Castillo, Filip Mess, and Javier Molina-García. 2022. "Do Active Commuters Feel More Competent and Vital? A Self-Organizing Maps Analysis in University Students" International Journal of Environmental Research and Public Health 19, no. 12: 7239. https://doi.org/10.3390/ijerph19127239
APA StyleBachner, J., García-Massó, X., Castillo, I., Mess, F., & Molina-García, J. (2022). Do Active Commuters Feel More Competent and Vital? A Self-Organizing Maps Analysis in University Students. International Journal of Environmental Research and Public Health, 19(12), 7239. https://doi.org/10.3390/ijerph19127239