
Influence of Sport Practice and Body Weight on Physical Fitness in Schoolchildren Living in the Campania Region

 , ,
, ,  ,
, 

Abstract
:1. Introduction
2. Materials and Methods
2.1. Study Design
2.2. Participants
2.3. Anthropometric Measures
2.4. Physical Fitness Test
2.5. Statistical Analysis
3. Results
4. Discussion
5. Conclusions
Author Contributions
Funding
Institutional Review Board Statement
Informed Consent Statement
Conflicts of Interest
References
- World Health Organization. Global Health Risks: Mortality and Burden of Disease Attributable to Selected Major Risks; WHO: Geneva, Switzerland, 2009. [Google Scholar]
- Fernandez-Jimenez, R.; Mohamed Al-Kazaz, M.; Jaslow, R.; Carvajal, I.; Fuster, V. Children Present a Window of Opportunity for Promoting Health: JACC Review Topic of the Week. J. Am. Coll. Cardiol. 2018, 72, 3310–3319. [Google Scholar] [CrossRef] [PubMed]
- Gruppo di Ricercar HBSC Italia. Stili di Vita e Salute dei Giovani Italiani tra 11 e 15 Anni (2018–2019). 2018. Available online: https://www.epicentro.iss.it/hbsc/pdf/report/campania-2018.pdf (accessed on 1 February 2022).
- Available online: https://www.epicentro.iss.it/okkioallasalute/report-regionale-2019/campania-2019.pdf (accessed on 1 February 2022).
- Andersen, L.B.; Harro, M.; Sardinha, L.B.; Froberg, K.; Ekelund, U.; Brage, S.; Anderssen, S.A. Physical activity and clustered cardiovascular risk in children: A cross-sectional study (The European Youth Heart Study). Lancet 2006, 368, 299–304. [Google Scholar] [CrossRef]
- Brage, S.; Wedderkopp, N.; Ekelund, U.; Franks, P.W.; Wareham, N.J.; Andersen, L.B.; Froberg, K. Features of the metabolic syndrome are associated with objectively measured physical activity and fitness in Danish children: The European Youth Heart Study (EYHS). Diabetes Care 2004, 27, 2141–2148. [Google Scholar] [CrossRef] [PubMed] [Green Version]
- Rizzo, N.S.; Ruiz, J.R.; Hurtig-Wennlof, A.; Ortega, F.B.; Sjostrom, M. Relationship of physical activity, fitness, and fatness with clustered metabolic risk in children and adolescents: The European youth heart study. J. Pediatr. 2007, 150, 388–394. [Google Scholar] [CrossRef] [PubMed]
- Ruiz, J.R.; Ortega, F.B.; Meusel, D.; Harro, M.; Oja, P.; Sjöström, M. Cardiorespiratory fitness is associated with features of metabolic risk factors in children. Should cardiorespiratory fit- ness be assessed in a European health monitoring system? The European youth heart study. J. Public Health 2006, 14, 94–102. [Google Scholar] [CrossRef]
- Janz, K.F.; Dawson, J.D.; Mahoney, L.T. Increases in physical fitness during childhood improve cardiovascular health during adolescence: The Muscatine study. Int. J. Sports Med. 2002, 23, 15–21. [Google Scholar] [CrossRef] [PubMed]
- Boreham, C.; Twisk, J.; Murray, L.; Savage, M.; Strain, J.J.; Cran, G. Fitness, fatness, and coronary heart disease risk in adolescents: The Northern Ireland young hearts project. Med. Sci. Sports Exerc. 2001, 33, 270–274. [Google Scholar] [CrossRef]
- Boreham, C.; Twisk, J.; Neville, C.; Savage, M.; Murray, L.; Gallagher, A. Associations between physical fitness and activity patterns during adolescence and cardiovascular risk factors in young adulthood: The Northern Ireland young hearts project. Int. J. Sports Med. 2002, 23, 22–26. [Google Scholar] [CrossRef]
- Hasselstrøm, H.; Hansen, S.E.; Froberg, K.; Andersen, L.B. Physical fitness and physical activity during adolescence as predictors of cardiovascular disease risk in young adulthood. Danish youth and sports study. An eight-year follow-up study. Int. J. Sports Med. 2002, 23, 27–31. [Google Scholar] [CrossRef]
- Gil-Campos, M.; Pérez-Ferreirós, A.; Llorente-Cantarero, F.J.; Anguita-Ruiz, A.; Bedoya-Carpente, J.J.; Kalén, A.; Moreno, L.A.; Bueno, G.; Gil, Á.; Aguilera, C.M.; et al. Association of Diet, Physical Activity Guidelines and Cardiometabolic Risk Markers in Children. Nutrients 2021, 13, 2954. [Google Scholar] [CrossRef]
- Pérez-Bey, A.; Segura-Jiménez, V.; Fernández-Santos, J.D.R.; Esteban-Cornejo, I.; Gómez-Martínez, S.; Veiga, O.L.; Marcos, A.; Ortega, F.B.; Castro-Piñero, J. The influence of cardiorespiratory fitness on clustered cardiovascular disease risk factors and the mediator role of body mass index in youth: The UP&DOWN Study. Pediatr. Diabetes 2019, 20, 32–40. [Google Scholar]
- García-Hermoso, A.; Ramírez-Vélez, R.; García-Alonso, Y.; Alonso-Martínez, A.M.; Izquierdo, M. Association of Cardiorespiratory Fitness Levels During Youth With Health Risk Later in Life: A Systematic Review and Meta-analysis. JAMA Pediatr. 2020, 174, 952–960. [Google Scholar] [CrossRef]
- Alvarez-Pitti, J.; Casajús-Mallén, J.A.; Leis-Trabazo, R.; Lucía, A.; de Lara, D.L.; Moreno-Aznar, L.A.; Rodríguez-Martínez, G. Exercise as medicine in chronic diseases during childhood and adolescence. An. Pediatría 2020, 92, e1–e173. [Google Scholar] [CrossRef]
- Chaput, J.P.; Willumsen, J.; Bull, F.; Chou, R.; Ekelund, U.; Firth, J.; Jago, R.; Francisco, B.; Ortega, F.B.; Katzmarzyk, P.T. 2020 WHO guidelines on physical activity and sedentary behaviour for children and adolescents aged 5–17 years: Summary of the evidence. Int. J. Behav. Nutr. 2020, 17, 141. [Google Scholar] [CrossRef]
- Committee of Experts on Sports Research. EUROFIT: Handbook for the EUROFIT Tests of Physical Fitness, 2nd ed.; Committee of Experts on Sports Research: Strasbourg, France, 1993. [Google Scholar]
- Instituto de Ciencias de la Educaciόn Física y del Deporte (Madrid). Eurofit Test Europeo de Aptitud Fisica; Ministerio de Educacion y Ciencia: Madrid, Spain, 1992.
- Sauka, M.; Priedite, I.S.; Artjuhova, L.; Larins, V.; Selga, G.; Dahlström, O.; Timpka, T. Physical fitness in northern European youth: Reference values from the Latvian Physical Health in Youth Study. Scand. J. Public Health 2011, 39, 35–43. [Google Scholar] [CrossRef]
- Tomkinson, G.R.; Olds, T.S.; Borms, J. Who are the Eurofittest? Med. Sport Sci. 2007, 50, 104–128. [Google Scholar]
- Castro-Piñero, J.; Artero, E.G.; España-Romero, V.; Ortega, F.B.; Sjöström, M.; Suni, J.; Ruiz, J.R. Criterion-related validity of field-based fitness tests in youth: A systematic review. Br. J. Sports Med. 2010, 44, 934–943. [Google Scholar] [CrossRef]
- Artero, E.G.; Espana-Romero, V.; Castro-Pinero, J.; Ortega, F.B.; Suni, J.; Castillo-Garzon, M.J.; Ruiz, J.R. Reliability of field-based fitness tests in youth. Int. J. Sports Med. 2011, 32, 159–169. [Google Scholar] [CrossRef]
- Ruiz, J.R.; Castro-Piñero, J.; España-Romero, V.; Artero, E.G.; Ortega, F.B.; Cuenca, M.M.; Jimenez-Pavón, D.; Chillón, P.; Girela-Rejón, M.J.; Mora, J.; et al. Field-based fitness assessment in young people: The ALPHA health-related fitness test battery for children and adolescents. Br. J. Sports Med. 2011, 45, 518–524. [Google Scholar] [CrossRef]
- Tomkinson, G.; Olds, T. Field tests of fitness. In Paediatric Exercise Science and Medicine, 2nd ed.; Armstrong, N., Van Mechelen, W., Eds.; Oxford University Press: Oxford, UK, 2008; pp. 109–128. [Google Scholar]
- Cilia, G.; Bellucci, M.; Riva, M.; Venerucci, I. Eurofit; Edizioni ISEF: Roma, Italy, 1995. [Google Scholar]
- Fiori, F.; Bravo, G.; Parpinel, M.; Messina, G.; Malavolta, R.; Lazzer, S. Relationship between body mass index and physical fitness in Italian prepubertal schoolchildren. PLoS ONE 2020, 15, e0233362. [Google Scholar] [CrossRef]
- Bianco, A.; Mammina, C.; Jemni, M.; Filippi, A.R.; Patti, A.; Thomas, E.; Paoli, A.; Palma, A.; Tabacchi, G. A fitness index model for Italian adolescents living in Southern Italy: The ASSO project. J. Sports Med. Phys. Fit. 2016, 56, 1279–1288. [Google Scholar]
- Eid, L. Motorfit: Monitoraggio dello Stato di Benessere Fisico e Motorio Degli Studenti della Lombardia, Milano; Agenzia Nazionale per lo Sviluppo dell’Autonomia Scolastica Nucleo Territoriale Lombardia: Milano, Italy, 2008. [Google Scholar]
- Ortega, F.B.; Ruiz, J.R.; Castillo, M.J.; Moreno, L.A.; González-Gross, M.; Wärnberg, J.; Gutiérrez, Á.; the AVENA Group. Low Level of Physical Fitness in Spanish Adolescents. Relevance for Future Cardiovascular Health (AVENA Study). Rev. Esp. Cardiol. 2005, 58, 898–909. [Google Scholar] [CrossRef]
- Subirana, J.A.P. La Bateria Eurofit a Catalunya, 1st ed.; Direcciό General de l’Esport (Departament de la Presidència de la Generalitat de Catalunya): Barcelona, Spain, 1993; ISBN 84-393-2634-3. [Google Scholar]
- Dobosz, J.; Mayorga-Vega, D.; Viciana, J. Percentile values of physical fitness levels among polish children aged 7 to 19 years a population-based study. Cent. Eur. J. Public Health 2015, 23, 340–351. [Google Scholar] [CrossRef] [Green Version]
- Ortega, F.B.; Artero, E.G.; Ruiz, J.R.; España-Romero, V.; Jiménez-Pavón, D.; Vicente-Rodriguez, G.; Moreno, L.A.; Manios, Y.; Béghin, L.; Ottevaere, C.; et al. Physical fitness levels among European adolescents: The HELENA study. Br. J. Sports Med. 2011, 45, 20–29. [Google Scholar] [CrossRef] [PubMed] [Green Version]
- Tomkinson, G.R.; Carver, K.D.; Atkinson, F.; Daniell, N.D.; Lewis, L.K.; Fitzgerald, J.S.; Lang, J.J.; Ortega, F.B. European normative values for physical fitness in children and adolescents aged 9–17 years: Results from 2,779,165 Eurofit performances representing 30 countries. Br. J. Sports Med. 2018, 52, 1445–1456. [Google Scholar] [CrossRef] [PubMed] [Green Version]
- Bagordo, F.; De Donno, A.; Grassi, T.; Guido, M.; Devoti, G.; Ceretti, E.; Zani, C.; Feretti, D.; Villarini, M.; Moretti, M.; et al. Lifestyles and socio-cultural factors among children aged 6–8 years from five Italian towns: The MAPEC_LIFE study cohort. BMC Public Health 2017, 17, 233. [Google Scholar] [CrossRef] [Green Version]
- Gallotta, M.C.; Zimatore, G.; Falcioni, L.; Migliaccio, S.; Lanza, M.; Schena, F.; Biino, V.; Giuriato, M.; Bellafiore, M.; Palma, A.; et al. Influence of Geographical Area and Living Setting on Children’s Weight Status, Motor Coordination, and Physical Activity. Front. Pediatr. 2021, 9, 794284. [Google Scholar] [CrossRef] [PubMed]
- Martínez-Martínez, J.; González-Víllora, S.; Valcárcel, J.V.; Pastor-Vicedo, J.C. How Does the Family Influence the Physical Condition and Health of Children in a Rural Environment? Int. J. Environ. Res. Public Health 2020, 17, 4622. [Google Scholar] [CrossRef] [PubMed]
- Cacciari, E.; Milani, S.; Balsamo, A. Directive Council of SIEDP. Italian cross-sectional growth charts for height, weight and BMI (2 to 20 yr). J. Endocrinol. Investig. 2006, 29, 581–593. [Google Scholar] [CrossRef] [PubMed]
- Good Clinical Practice. Available online: https://www.ema.europa.eu/en/human-regulatory/research-development/compliance/good-clinical-practice (accessed on 1 February 2022).
- Léger, L.A.; Mercier, D.; Gadoury, C.; Lambert, J. The multistage 20 meter shuttle run test for aerobic fitness. J. Sports Sci. 1988, 6, 93–101. [Google Scholar] [CrossRef] [PubMed]
- Ruiz, J.R.; Cavero-Redondo, I.; Ortega, F.B.; Welk, G.J.; Andersen, L.B.; Martinez-Vizcaino, V. Cardiorespiratory fitness cut points to avoid cardiovascular disease risk in children and adolescents; what level of fitness should raise a red flag? A systematic review and meta-analysis. Br. J. Sports Med. 2016, 50, 1451–1458. [Google Scholar] [CrossRef]
- Cole, T.J.; Green, P.J. Smoothing reference centile curves: The LMS method and penalized likelihood. Stat. Med. 1992, 11, 1305–1319. [Google Scholar] [CrossRef]
- The Jamovi Project, Jamovi (Version 2.2) [Computer Software]. 2021. Available online: https://www.jamovi.org/about.html (accessed on 15 October 2021).
- Tremblay, M.S.; Aubert, S.; Barnes, J.D.; Saunders, T.J.; Carson, V.; Latimer-Cheung, A.E.; Chastin, S.F.M.; Altenburg, T.M.; Chinapaw, M.J.M. Sedentary behavior research network (SBRN)—Terminology consensus project process and outcome. Int. J. Behav. Nutr. Phys. Act. 2017, 14, 75. [Google Scholar] [CrossRef] [Green Version]
- Guthold, R.; Stevens, G.A.; Riley, L.M.; Bull, F.C. Global trends in insufficient physical activity among adolescents: A pooled analysis of 298 population based surveys with 1.6 million participants. Lancet Child Adolesc. Health 2020, 4, 23–35. [Google Scholar] [CrossRef]
- Available online: https://www.istat.it/it/files//2020/05/15_Campania_Scheda_DEF.pdf (accessed on 10 May 2022).
- Available online: https://www.openpolis.it/wp-content/uploads/2021/06/minori_sport_.pdf (accessed on 10 May 2022).
- Dong, X.; Ding, L.; Zhang, R.; Ding, M.; Wang, B.; Yi, X. Physical Activity, Screen-Based Sedentary Behavior and Physical Fitness in Chinese Adolescents: A Cross-Sectional Study. Front. Pediatr. 2021, 9, 722079. [Google Scholar] [CrossRef]
- Barnett, L.M.; van Beurden, E.; Morgan, P.J.; Brooks, L.O.; Beard, J.R. Gender differences in motor skill proficiency from childhood to adolescence: A longitudinal study. Res. Q. Exerc. Sport 2010, 81, 162–170. [Google Scholar]
- Malina, R.M.; Bouchard, C. Growth, Maturation, and Physical Activity; Human Kinetics Books: Champaign, IL, USA, 1991. [Google Scholar]
- Handelsman, D.J.; Hirschberg, A.L.; Bermon, S. Circulating Testosterone as the Hormonal Basis of Sex Differences in Athletic Performance. Endocr. Rev. 2018, 39, 803–829. [Google Scholar] [CrossRef] [Green Version]
- Handelsman, D.J. Sex differences in athletic performance emerge coinciding with the onset of male puberty. Clin. Endocrinol. 2017, 87, 68–72. [Google Scholar] [CrossRef] [Green Version]
- De Miguel-Etayo, P.; Gracia-Marco, L.; Ortega, F.B.; Intemann, T.; Foraita, R.; Lissner, L.; Oja, L.; Barba, G.; Michels, N.; Tornaritis, M.; et al. Physical fitness reference standards in European children: The IDEFICS study Multicenter Study. Int. J. Obes. 2014, 38, S57–S66. [Google Scholar] [CrossRef] [Green Version]
- Rodríguez-Negro, J.; Huertas-Delgado, F.J.; Yanci, J. Motor skills differences by gender in early elementary education students. Early Child Dev. Care 2021, 191, 281–291. [Google Scholar] [CrossRef]
- Kelly, P.M.; Diméglio, A. Lower-limb growth: How predictable are predictions? J. Child Orthop. 2008, 2, 407–415. [Google Scholar] [CrossRef] [Green Version]
- Milanese, M.; Sandri, M.; Cavedon, V.; Zancanaro, C. The role of age, sex, anthropometry, and body composition as determinants of physical fitness in nonobese children aged 6–12. PeerJ 2020, 17, e8657. [Google Scholar] [CrossRef] [PubMed]
- Bieć, E.; Kuczyński, M. Postural control in 13-year-old soccer players. Eur. J. Appl. Physiol. 2010, 110, 703–708. [Google Scholar] [CrossRef] [Green Version]
- Sozen, H. The effect of volleyball training on the physical fitness of high school students. Proc. Soc. Behav. Sci. 2012, 46, 1455–1460. [Google Scholar] [CrossRef] [Green Version]
- Selmanović, A.; Milanović, D.; Custonja, Z. Effects of an additional basketball and volleyball program on motor abilities of fifth grade elementary school students. Coll. Antropol. 2013, 37, 391–400. [Google Scholar] [PubMed]
- Michailidis, Y.; Metaxas, T.I.; Stefanidis, P.; Christoulas, K. Fitness effects of one-year soccer training of 8–10 and 10–12-year-old school children. J. Sports Med. Phys. Fit. 2019, 59, 725–732. [Google Scholar] [CrossRef] [PubMed]
- Zemková, E.; Hamar, D. Sport-Specific Assessment of the Effectiveness of Neuromuscular Training in Young Athletes. Front. Physiol. 2018, 9, 264. [Google Scholar] [CrossRef] [Green Version]
- Zemková, E.; Hamar, D. The effect of 6-week combined agility-balance training on neuromuscular performance in basketball players. J. Sports Med. Phys. Fit. 2010, 50, 262–267. [Google Scholar]
- Graf, C.; Koch, B.; Kratschmann-Kandel, E.; Falkowski, G.; Christ, H.; Coburger, S.; Lehmacher, W.; Bjarnason-Wehrens, B.; Platen, P.; Tokarski, W.; et al. Correlation between BMI, leisure habits and motor abilities in childhood (CHILT-project). Int. J. Obes. Relat. Metab. Disord. 2004, 28, 22–26. [Google Scholar] [CrossRef] [Green Version]
- Okely, A.D.; Booth, M.L.; Chey, T. Relationships between body composition and fundamental movement skills among children and adolescents. Res. Q. Exerc. Sport. 2004, 75, 238–247. [Google Scholar] [CrossRef]
- Raudsepp, L.; Jürimäe, T. Relationships of physical activity and somatic characteristics with physical fitness and motor skill in prepubertal girls. Am. J. Hum. Biol. 1997, 9, 513–521. [Google Scholar] [CrossRef]
- Ding, C.; Jiang, Y. The Relationship between Body Mass Index and Physical Fitness among Chinese University Students: Results of a Longitudinal Study. Healthcare 2020, 8, 570. [Google Scholar] [CrossRef]
- Mendoza-Muñoz, M.; Adsuar, J.C.; Pérez-Gómez, J.; Muñoz-Bermejo, L.; Garcia-Gordillo, M.A.; Carlos-Vivas, J. Influence of Body Composition on Physical Fitness in Adolescents. Medicina 2020, 56, 328. [Google Scholar] [CrossRef]
- Brunet, M.; Chaput, J.P.; Tremblay, A. The association between low physical fitness and high body mass index or waist circumference is increasing with age in children: The ‘Québec en Forme’ project. Int. J. Obes. 2007, 31, 637–643. [Google Scholar] [CrossRef] [Green Version]
- Sacchetti, R.; Ceciliani, A.; Garulli, A.; Masotti, A.; Poletti, G.; Beltrami, P.; Leoni, E. Physical fitness of primary school children in relation to overweight prevalence and physical activity habits. J. Sports Sci. 2012, 30, 633–640. [Google Scholar] [CrossRef]
- Júdice, P.B.; Silva, A.M.; Berria, J.; Petroski, E.; Ekelund, U.; Sardinha, N.B. Sedentary patterns, physical activity and health-related physical fitness in youth: A cross-sectional study. Int. J. Behav. Nutr. Phys. Act. 2017, 14, 7–9. [Google Scholar] [CrossRef] [Green Version]
- Dewi, R.C.; Rimawati, N.; Purbodjati, P. Body mass index, physical activity, and physical fitness of adolescence. J. Public Health Res. 2021, 10, 2230. [Google Scholar] [CrossRef]
- López-Gil, J.F.; Brazo-Sayavera, J.; Yuste Lucas, J.L.; Cavichiolli, F.R. Weight Status Is Related to Health-Related Physical Fitness and Physical Activity but Not to Sedentary Behaviour in Children. Int. J. Environ. Res. Public Health 2020, 17, 4518. [Google Scholar] [CrossRef]
- Siervogel, R.M.; Demerath, E.W.; Schubert, C.; Remsberg, K.E.; William Cameron Chumlea, W.C.; Sun, S.; Czerwinski, S.A.; Towne, B. Puberty and body composition. Horm. Res. 2003, 60, 36–45. [Google Scholar] [CrossRef]
- Tønnessen, E.; Svendsen, I.S.; Olsen, I.C.; Guttormsen, A.; Haugen, T. Performance Development in Adolescent Track and Field Athletes According to Age, Sex and Sport Discipline. PLoS ONE 2015, 10, e0129014. [Google Scholar] [CrossRef] [Green Version]
- Kohl, H.W., III; Cook, H.D. Educating the Student Body: Taking Physical Activity and Physical Education to School; Food and Nutrition Board, Institute of Medicine: Washington, DC, USA; National Academies Press (US): Washington, DC, USA, 2013. [Google Scholar]
- Al-Mallah, M.H.; Sakr, S.; Al-Qunaibet, A. Cardiorespiratory Fitness and Cardiovascular Disease Prevention: An Update. Curr. Atheroscler. Rep. 2018, 20, 1–9. [Google Scholar] [CrossRef]
- Ortega, F.B.; Ruiz, J.R.; Castillo, M.J.; Sjöström, M. Physical fitness in childhood and adolescence: A powerful marker of health. Int. J. Obes. 2008, 32, 1–11. [Google Scholar] [CrossRef] [Green Version]
- Hillman, C.H.; Erickson, K.I.; Kramer, A.F. Be smart, exercise your heart: Exercise effects on brain and cognition. Nat. Rev. Neurosci. 2008, 9, 58–65. [Google Scholar] [CrossRef]
- Carnethon, M.R.; Gidding, S.S.; Nehgme, R.; Sidney, S.; Jacobs, D.R., Jr.; Liu, K. Cardiorespiratory fitness in young adulthood and the development of cardiovascular disease risk factors. JAMA 2003, 290, 3092–3100. [Google Scholar] [CrossRef] [PubMed] [Green Version]
- Boreham, C.A.; Ferreira, I.; Twisk, J.W.; Gallagher, A.M.; Savage, M.J.; Murray, L.J. Cardiorespiratory fitness, physical activity, and arterial stiffness: The Northern Ireland Young Hearts Project. Hypertension 2004, 44, 721–726. [Google Scholar] [CrossRef] [PubMed] [Green Version]
- Ferreira, I.; Twisk, J.W.; Stehouwer, C.D.; van Mechelen, W.; Kemper, H.C.G. Longitudinal changes in VO2max: Associations with carotid IMT and arterial stiffness. Med. Sci. Sports Exerc. 2003, 35, 1670–1678. [Google Scholar] [CrossRef] [PubMed]
- Högström, G.; Nordström, A.; Nordström, P. High aerobic fitness in late adolescence isassociated with a reduced risk of myocardial infarction later in life: A nationwide cohort study in men. Eur. Heart J. 2014, 35, 3133–3140. [Google Scholar] [CrossRef] [Green Version]
- España-Romero, V.; Artero, E.G.; Jimenez-Pavón, D.; Cuenca-Garcia, M.; Ortega, F.B.; Castro-Piñero, J.; Sjöstrom, M.; Castillo-Garzon, M.J.; Ruiz, J.R. Assessing health-related fitness tests in the school setting: Reliability, feasibility and safety; the ALPHA study. Int. J. Sports Med. 2010, 31, 490–497. [Google Scholar] [CrossRef] [PubMed] [Green Version]
- Hallal, P.C.; Andersen, L.B.; Bull, F.C.; Guthold, R.; Haskell, W.; Ekelund, U.; Lancet Physical Activity Series Working Group. Global physical activity levels: Surveillance progress, pitfalls, and prospects. Lancet 2012, 380, 247–257. [Google Scholar] [CrossRef]
- Carson, V.; Lee, E.Y.; Hewitt, L.; Jennings, C.; Hunter, S.; Kuzik, N.; Stearns, J.A.; Unrau, S.P.; Poitras, V.J.; Gray, C.; et al. Systematic review of the relationships between physical activity and health indicators in the early years (0–4 years). BMC Public Health 2017, 17, 854. [Google Scholar]
- De Rezende, L.F.; Rodrigues Lopes, M.; Rey-Lopez, J.P.; Matsudo, V.K.; Luiz Odo, C. Sedentary behavior and health outcomes: An overview of systematic reviews. PLoS ONE 2014, 9, e105620. [Google Scholar] [CrossRef]
- Tremblay, M.S.; Carson, V.; Chaput, J.P.; Connor Gorber, S.; Dinh, T.; Duggan, M.; Faulkner, G.; Gray, C.E.; Gruber, R.; Janson, K.; et al. Canadian 24-hour movement guidelines for children and youth: An integration of physical activity, sedentary behaviour, and sleep. Appl. Physiol. Nutr. Metab. 2016, 41, S311–S327. [Google Scholar] [CrossRef]
- Ortega, F.B.; Silventoinen, S.P.; Rasmussen, F. Muscular strength in male adolescents and premature death: Cohort study of one million participants. BMJ 2012, 345, e7279. [Google Scholar] [CrossRef] [Green Version]

| Variable (Units) | Total (n = 565) | Male (n = 353) | Female (n = 212) | Mean Dif. (%) |
|---|---|---|---|---|
| Age (years) | 11.7 ± 1.0 | 11.7 ± 1.0 | 11.6 ± 1.0 | 1 |
| Weight (kg) | 50.4 ± 11.5 | 51.9 ± 11.4 * | 47.8 ± 11.3 | 8.2 |
| Height (cm) | 153.3 ± 10.2 | 154.3 ± 10.4 * | 151.7 ± 9.6 | 1.7 |
| BMI (kg/m2) | 21.2 ± 3.3 | 21.6 ± 3.0 * | 20.6 ± 3.6 | 4.7 |
| Overweight/obese (%) | 27.8 | 35.8 * | 14.5 | 21.3 |
| Sport practice (%) | 77 | 86 * | 63 | 23 |
| Flamingo Balance (falls/min) | 12.2 ± 5.0 | 11.9 ± 4.5 | 12.9 ± 5.9 | 8.5 |
| Plate Tapping (s) | 14.3 ± 3.7 | 13.4 ± 3.4 * | 15.6 ± 3.7 | 15.4 |
| Sit-and-Reach (cm) | 20.7 ± 8.5 | 18.2 ± 6.7 | 24.5 ± 9.5 * | 30.5 |
| Standing Broad Jump (cm) | 142.3 ± 28.4 | 151.5 ± 26.6 * | 126.6 ± 24.2 | 17.5 |
| Bent-Arm Hang (s) | 4.9 ± 4.0 | 6.6 ± 4.7 * | 2.9 ± 1.5 | 75.5 |
| 10 × 5 m Shuttle Run (s) | 21.5 ± 2.9 | 20.9 ± 2.6 * | 23.1 ± 3.0 | 10.2 |
| 20-m Shuttle Run (stage) | 5.8 ± 3.1 | 6.7 ± 3.1 | - | - |
| BOYS | ||||||||||||
|---|---|---|---|---|---|---|---|---|---|---|---|---|
| Variable (Units) | No Sport | Sport | p | Effect | 95% CI | Normal Weight | Overweight/Obese | p | Effect | 95% CI | ||
| (n:51) | (n:302) | Size | Lower | Upper | (n:227) | (n:126) | Size | Lower | Upper | |||
| FB (falls/min) | 16.9 ± 4.4 | 11.7 ± 4.4 | <0.001 | 1.396 | 0.463 | 2.239 | 12.0 ± 4.5 | 11.9 ± 4.3 | NS | // | // | // |
| PT (s) | 17.1 ± 3.8 | 13.2 ± 3.3 | 0.001 | 1.335 | 0.251 | 1.975 | 13.4 ± 3.7 | 13.6 ± 2.0 | NS | // | // | // |
| SiR (cm) | 12.3 ± 5.4 | 18.5 ± 6.6 | 0.008 | −0.83 | −1.519 | −0.111 | 17.9 ± 6.2 | 17.8 ± 6.7 | NS | // | // | // |
| SBJ (cm) | 135.3 ± 38.6 | 154.0 ± 25.4 | <0.001 | −0.725 | −1.056 | −0.387 | 157.4 ± 25.0 | 140.6 ± 26.0 | <0.001 | 0.585 | 0.359 | 0.81 |
| BAH (s) | 4.5 ± 2.7 | 7.0 ± 4.8 | NS | // | // | // | 7.2 ± 4.6 | 5.5 ± 4.5 | NS | // | // | // |
| 10 × 5 m (s) | 21.2 ± 1.9 | 20.9 ± 2.6 | NS | // | // | // | 20.8 ± 2.7 | 21.1 ± 2.4 | NS | // | // | // |
| 20 m (stage) | 3.6 ± 0.1 | 6.8 ± 3.1 | 0.013 | −1.301 | −2.667 | 0.152 | 6.9 ± 3.3 | 6.1 ± 2.4 | 0.042 | 0.277 | −0.188 | 0.742 |
| GIRLS | ||||||||||||
| Variable (Units) | No Sport | Sport | p | Effect | 95% CI | Normal Weight | Overweight/Obese | p | Effect | 95% CI | ||
| (n:81) | (n:131) | Size | Lower | Upper | (n:181) | (n:31) | Size | Lower | Upper | |||
| FB (falls/min) | 20.5 ± 5.3 | 11.4 ± 4.8 | <0.001 | 1.837 | 1.051 | 2.6 | 12.6 ± 5.9 | 14.2 ± 6.0 | NS | // | // | // |
| PT (s) | 15.7 ± 3.3 | 15.6 ± 3.8 | NS | // | // | // | 15.4 ± 3.5 | 16.9 ± 4.0 | 0.036 | −0.458 | −0.884 | 0.028 |
| SiR (cm) | 20.7 ± 8.4 | 25.7 ± 9.6 | 0.01 | −0.48 | −0.855 | −0.099 | 24.8 ± 9.2 | 22.9 ± 11.1 | NS | // | // | // |
| SBJ (cm) | 124.2 ± 22.0 | 127.9 ± 25.3 | NS | // | // | // | 128.9 ± 22.8 | 111.6 ± 27.7 | <0.001 | 0.813 | 0.398 | 1.225 |
| BAH (s) | 2.7 ± 1.4 | 3.0 ± 1.5 | NS | // | // | // | 2.9 ± 1.5 | 2.2 ± 0.5 | NS | // | // | // |
| 10 × 5 m (s) | // | 23.1 ± 3.0 | // | // | // | // | 22.7 ± 2.8 | 25.5 ± 2.9 | 0.003 | −1.119 | −1.846 | −0.382 |
| R = 0.274 | R2 = 0.075 | Adjusted R2 = 0.070 | F = 14.0 | df1 = 2 | df2 = 344 | p < 0.001 | |
|---|---|---|---|---|---|---|---|
| 95% Confidence Interval | |||||||
| Predictor | b | SE | t | p | Stand. b | Lower | Upper |
| Intercept | 158.63 | 11.019 | 14.4 | 0.018 | |||
| BMI | −1.11 | 0.47 | −2.36 | 0.227 | −0.123 | −0.225 | −0.026 |
| Sport practice: | |||||||
| Yes—No | 17.3 | 3.861 | 4.48 | <0.001 | 0.669 | 0.375 | 0.963 |
| R = 0.299 | R2 = 0.090 | Adjusted R2 = 0.070 | F = 3.98 | df1 = 2 | df2 = 81 | p = 0.022 | |
|---|---|---|---|---|---|---|---|
| 95% Confidence Interval | |||||||
| Predictor | b | SE | t | p | Stand. b | Lower | Upper |
| Intercept | 5.74 | 2.38 | 2.41 | 0.018 | |||
| BMI | −0.11 | 0.091 | −1.22 | 0.227 | −0.13 | −0.341 | 0.082 |
| Sport practice: | |||||||
| Yes—No | 3.11 | 1.283 | 2.42 | 0.018 | 1.205 | 0.216 | 2.193 |
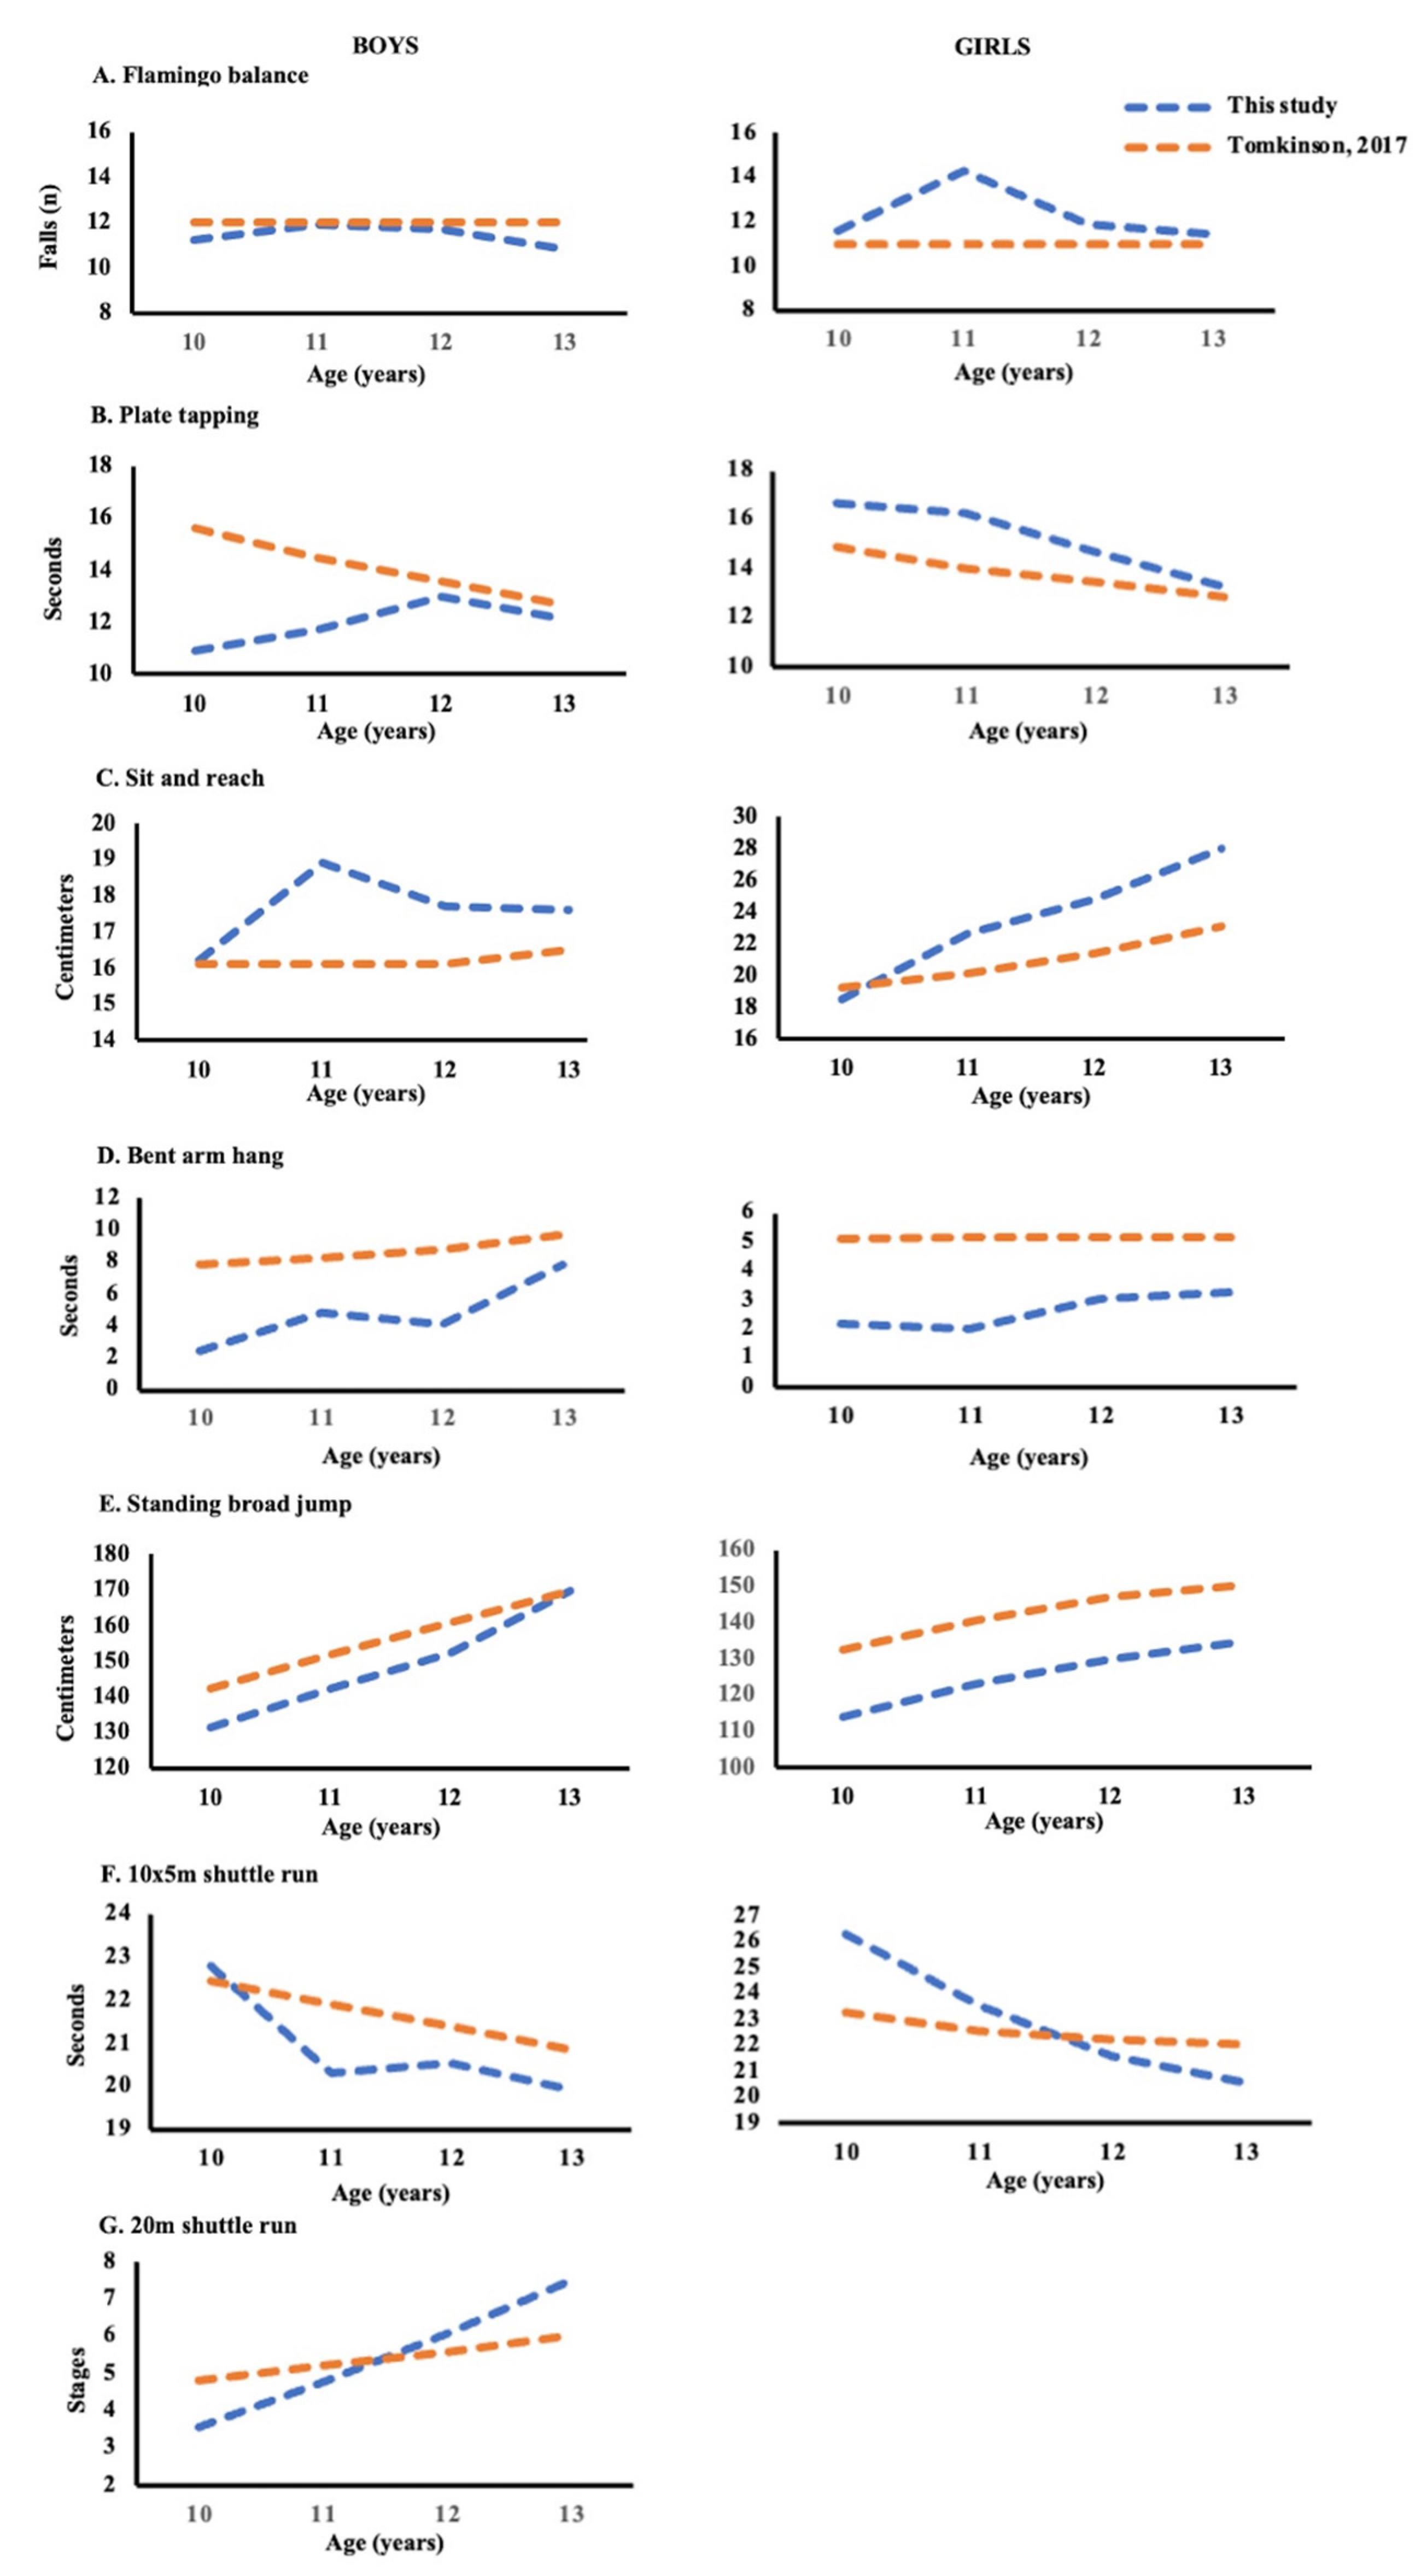
| BOYS | GIRLS | |||||||
|---|---|---|---|---|---|---|---|---|
| Age (years) | 10 | 11 | 12 | 13 | 10 | 11 | 12 | 13 |
| FB (falls/min) | 11.2 | 11.9 | 11.7 | 10.8 | 11.6 | 14.3 | 11.9 | 11.5 |
| PT (s) | 10.9 | 11.7 | 13 | 12.1 | 16.7 | 16.3 | 14.7 | 13.3 |
| SiR (cm) | 16.2 | 18.9 | 17.7 | 17.6 | 18.5 | 22.6 | 24.8 | 28 |
| SBJ (cm) | 131.3 | 142.3 | 152.1 | 169.8 | 113.9 | 122.9 | 129.6 | 134.5 |
| BAH (s) | 2.5 | 4.9 | 4.1 | 7.9 | 2.2 | 2 | 3.1 | 3.3 |
| 10 × 5 m (s) | 22.8 | 20.3 | 20.6 | 19.9 | 26.3 | 23.6 | 21.6 | 20.6 |
| 20 m (stages) | 3.6 | 4.8 | 6.1 | 7.5 | // | // | // | // |
Publisher’s Note: MDPI stays neutral with regard to jurisdictional claims in published maps and institutional affiliations. |
© 2022 by the authors. Licensee MDPI, Basel, Switzerland. This article is an open access article distributed under the terms and conditions of the Creative Commons Attribution (CC BY) license (https://creativecommons.org/licenses/by/4.0/).
Share and Cite
Mancini, A.; Martone, D.; Vitucci, D.; Capobianco, A.; Alfieri, A.; Buono, P.; Orrù, S. Influence of Sport Practice and Body Weight on Physical Fitness in Schoolchildren Living in the Campania Region. Int. J. Environ. Res. Public Health 2022, 19, 7412. https://doi.org/10.3390/ijerph19127412
Mancini A, Martone D, Vitucci D, Capobianco A, Alfieri A, Buono P, Orrù S. Influence of Sport Practice and Body Weight on Physical Fitness in Schoolchildren Living in the Campania Region. International Journal of Environmental Research and Public Health. 2022; 19(12):7412. https://doi.org/10.3390/ijerph19127412
Chicago/Turabian StyleMancini, Annamaria, Domenico Martone, Daniela Vitucci, Adriano Capobianco, Andreina Alfieri, Pasqualina Buono, and Stefania Orrù. 2022. "Influence of Sport Practice and Body Weight on Physical Fitness in Schoolchildren Living in the Campania Region" International Journal of Environmental Research and Public Health 19, no. 12: 7412. https://doi.org/10.3390/ijerph19127412