
Methods Used in the Spatial and Spatiotemporal Analysis of COVID-19 Epidemiology: A Systematic Review

 ,
,  , , , and
Abstract
:1. Introduction
2. Materials and Methods
2.1. Data Source and Search Strategy
2.2. Eligibility, Inclusion and Exclusion Criteria
2.3. Data Extraction and Synthesis
2.4. Quality Assessment
3. Results
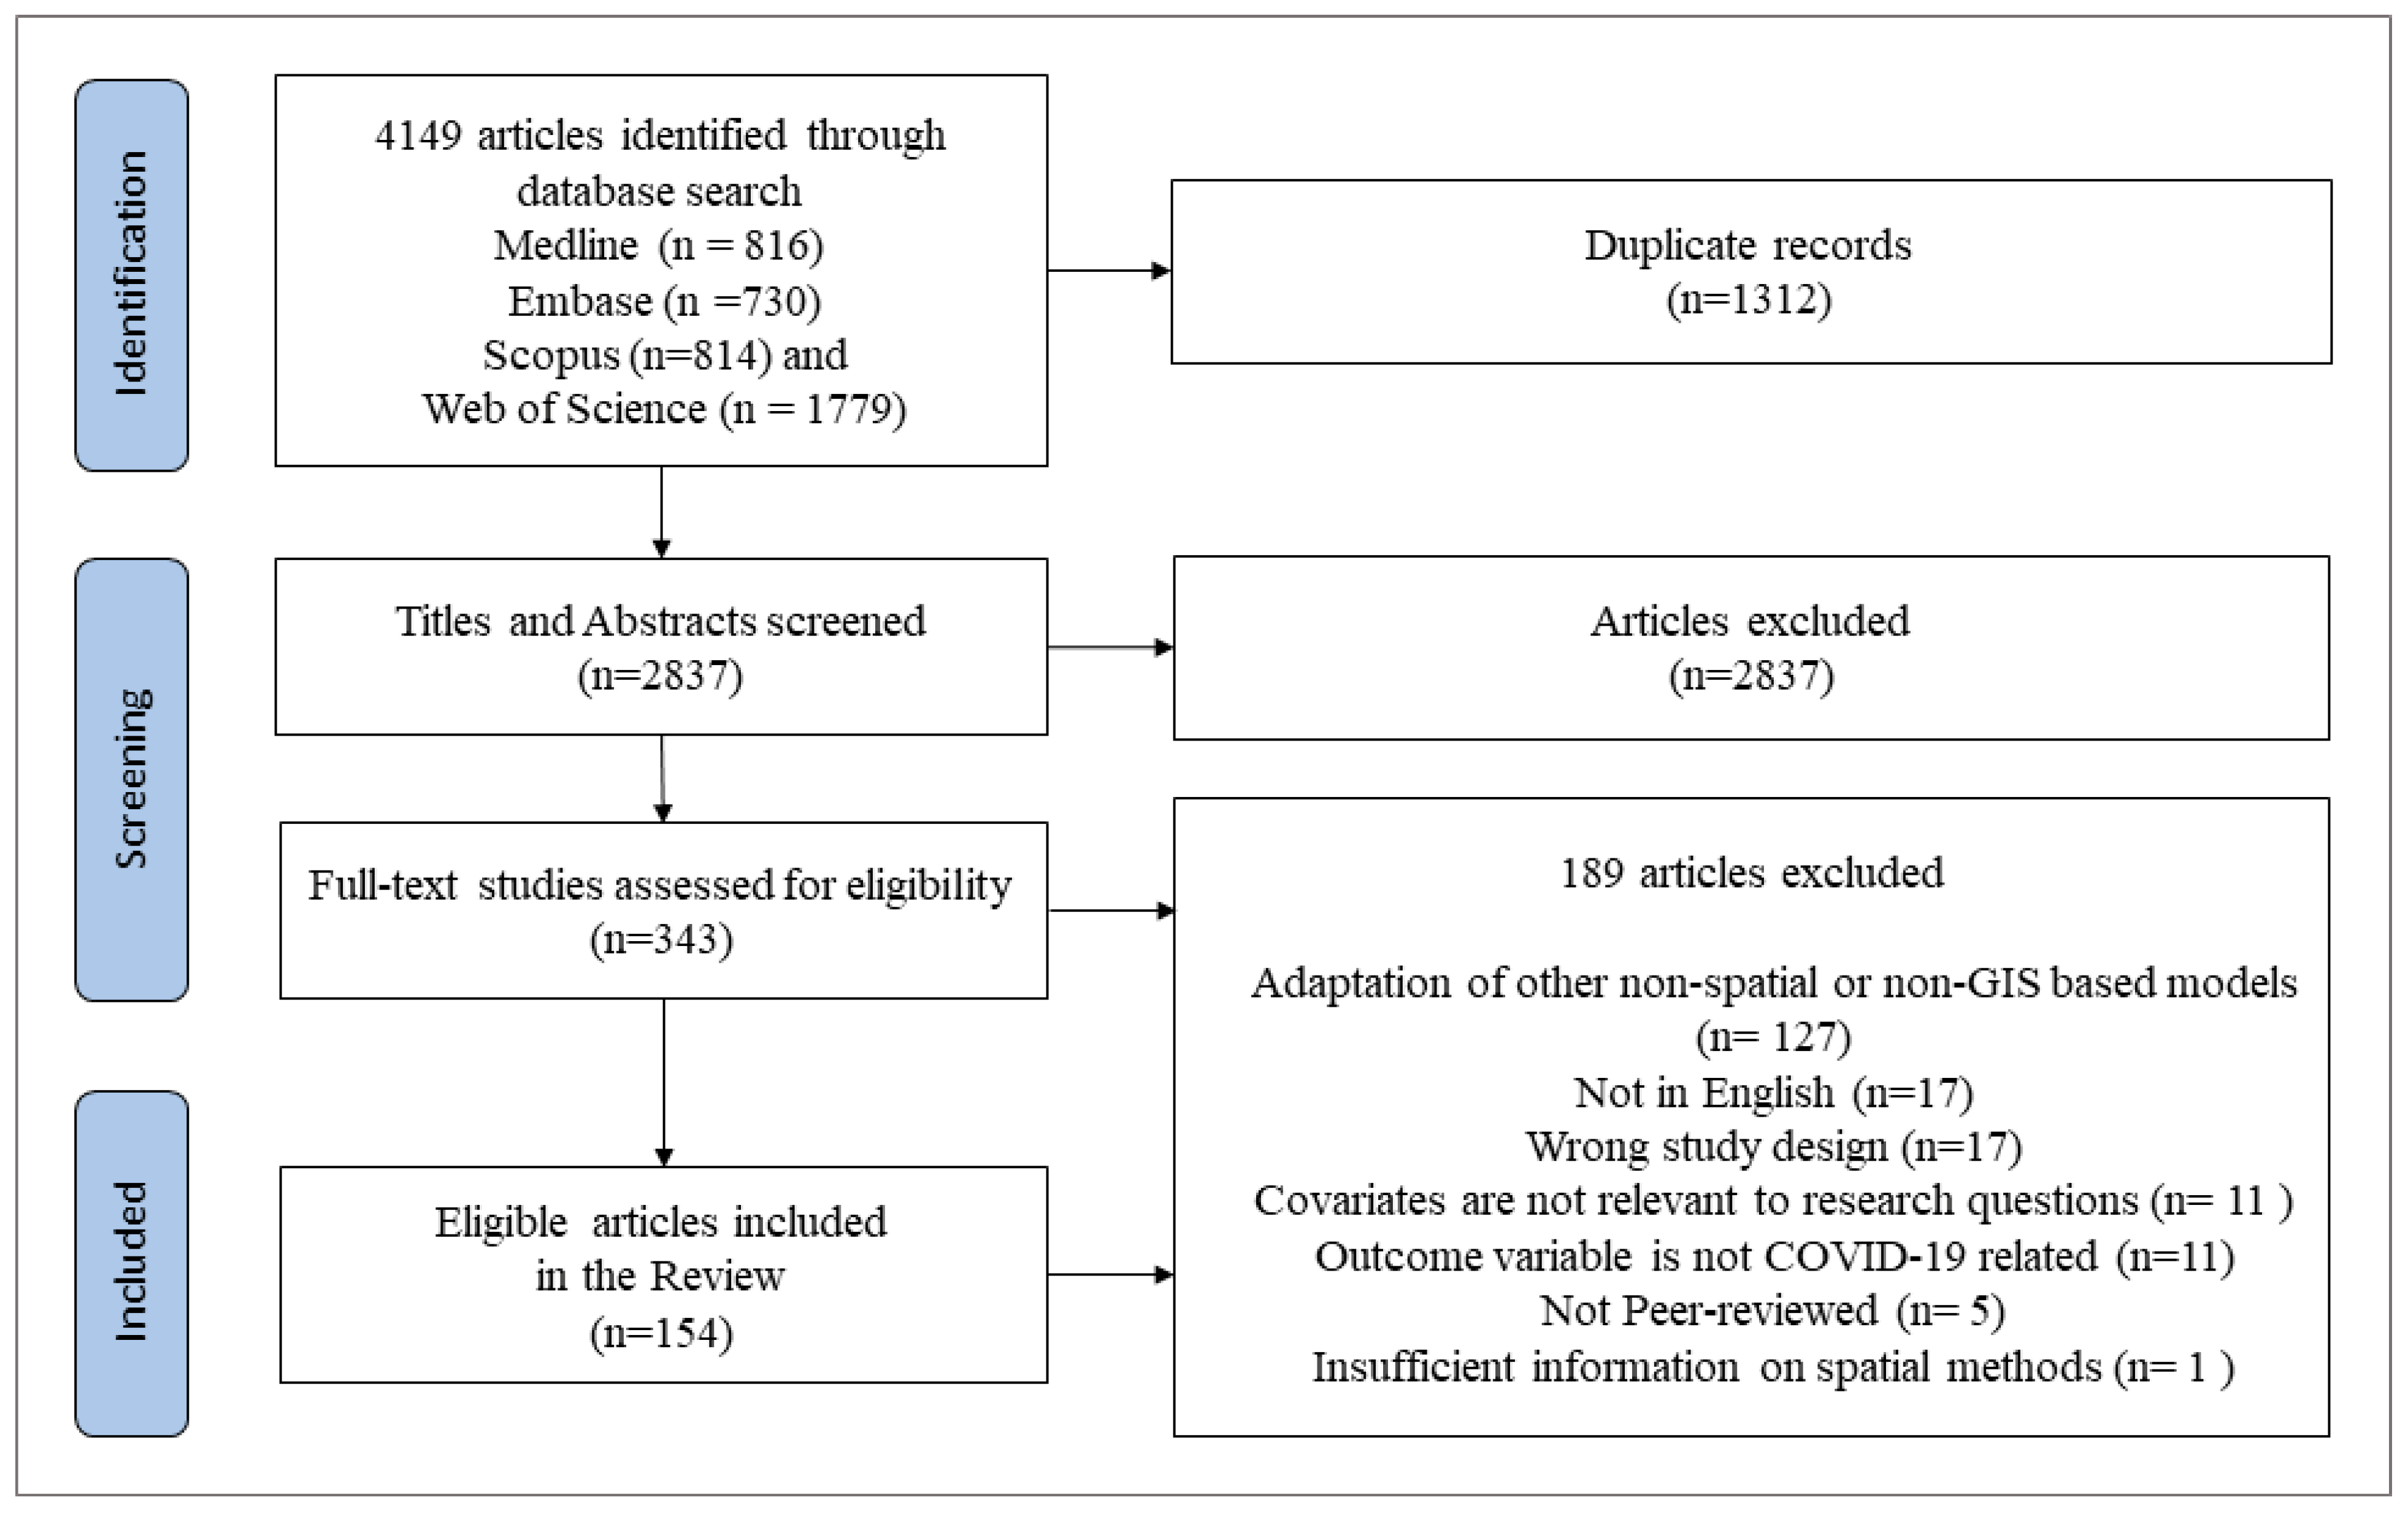
3.1. Literature Search
3.2. General Characteristics of the Selected Studies
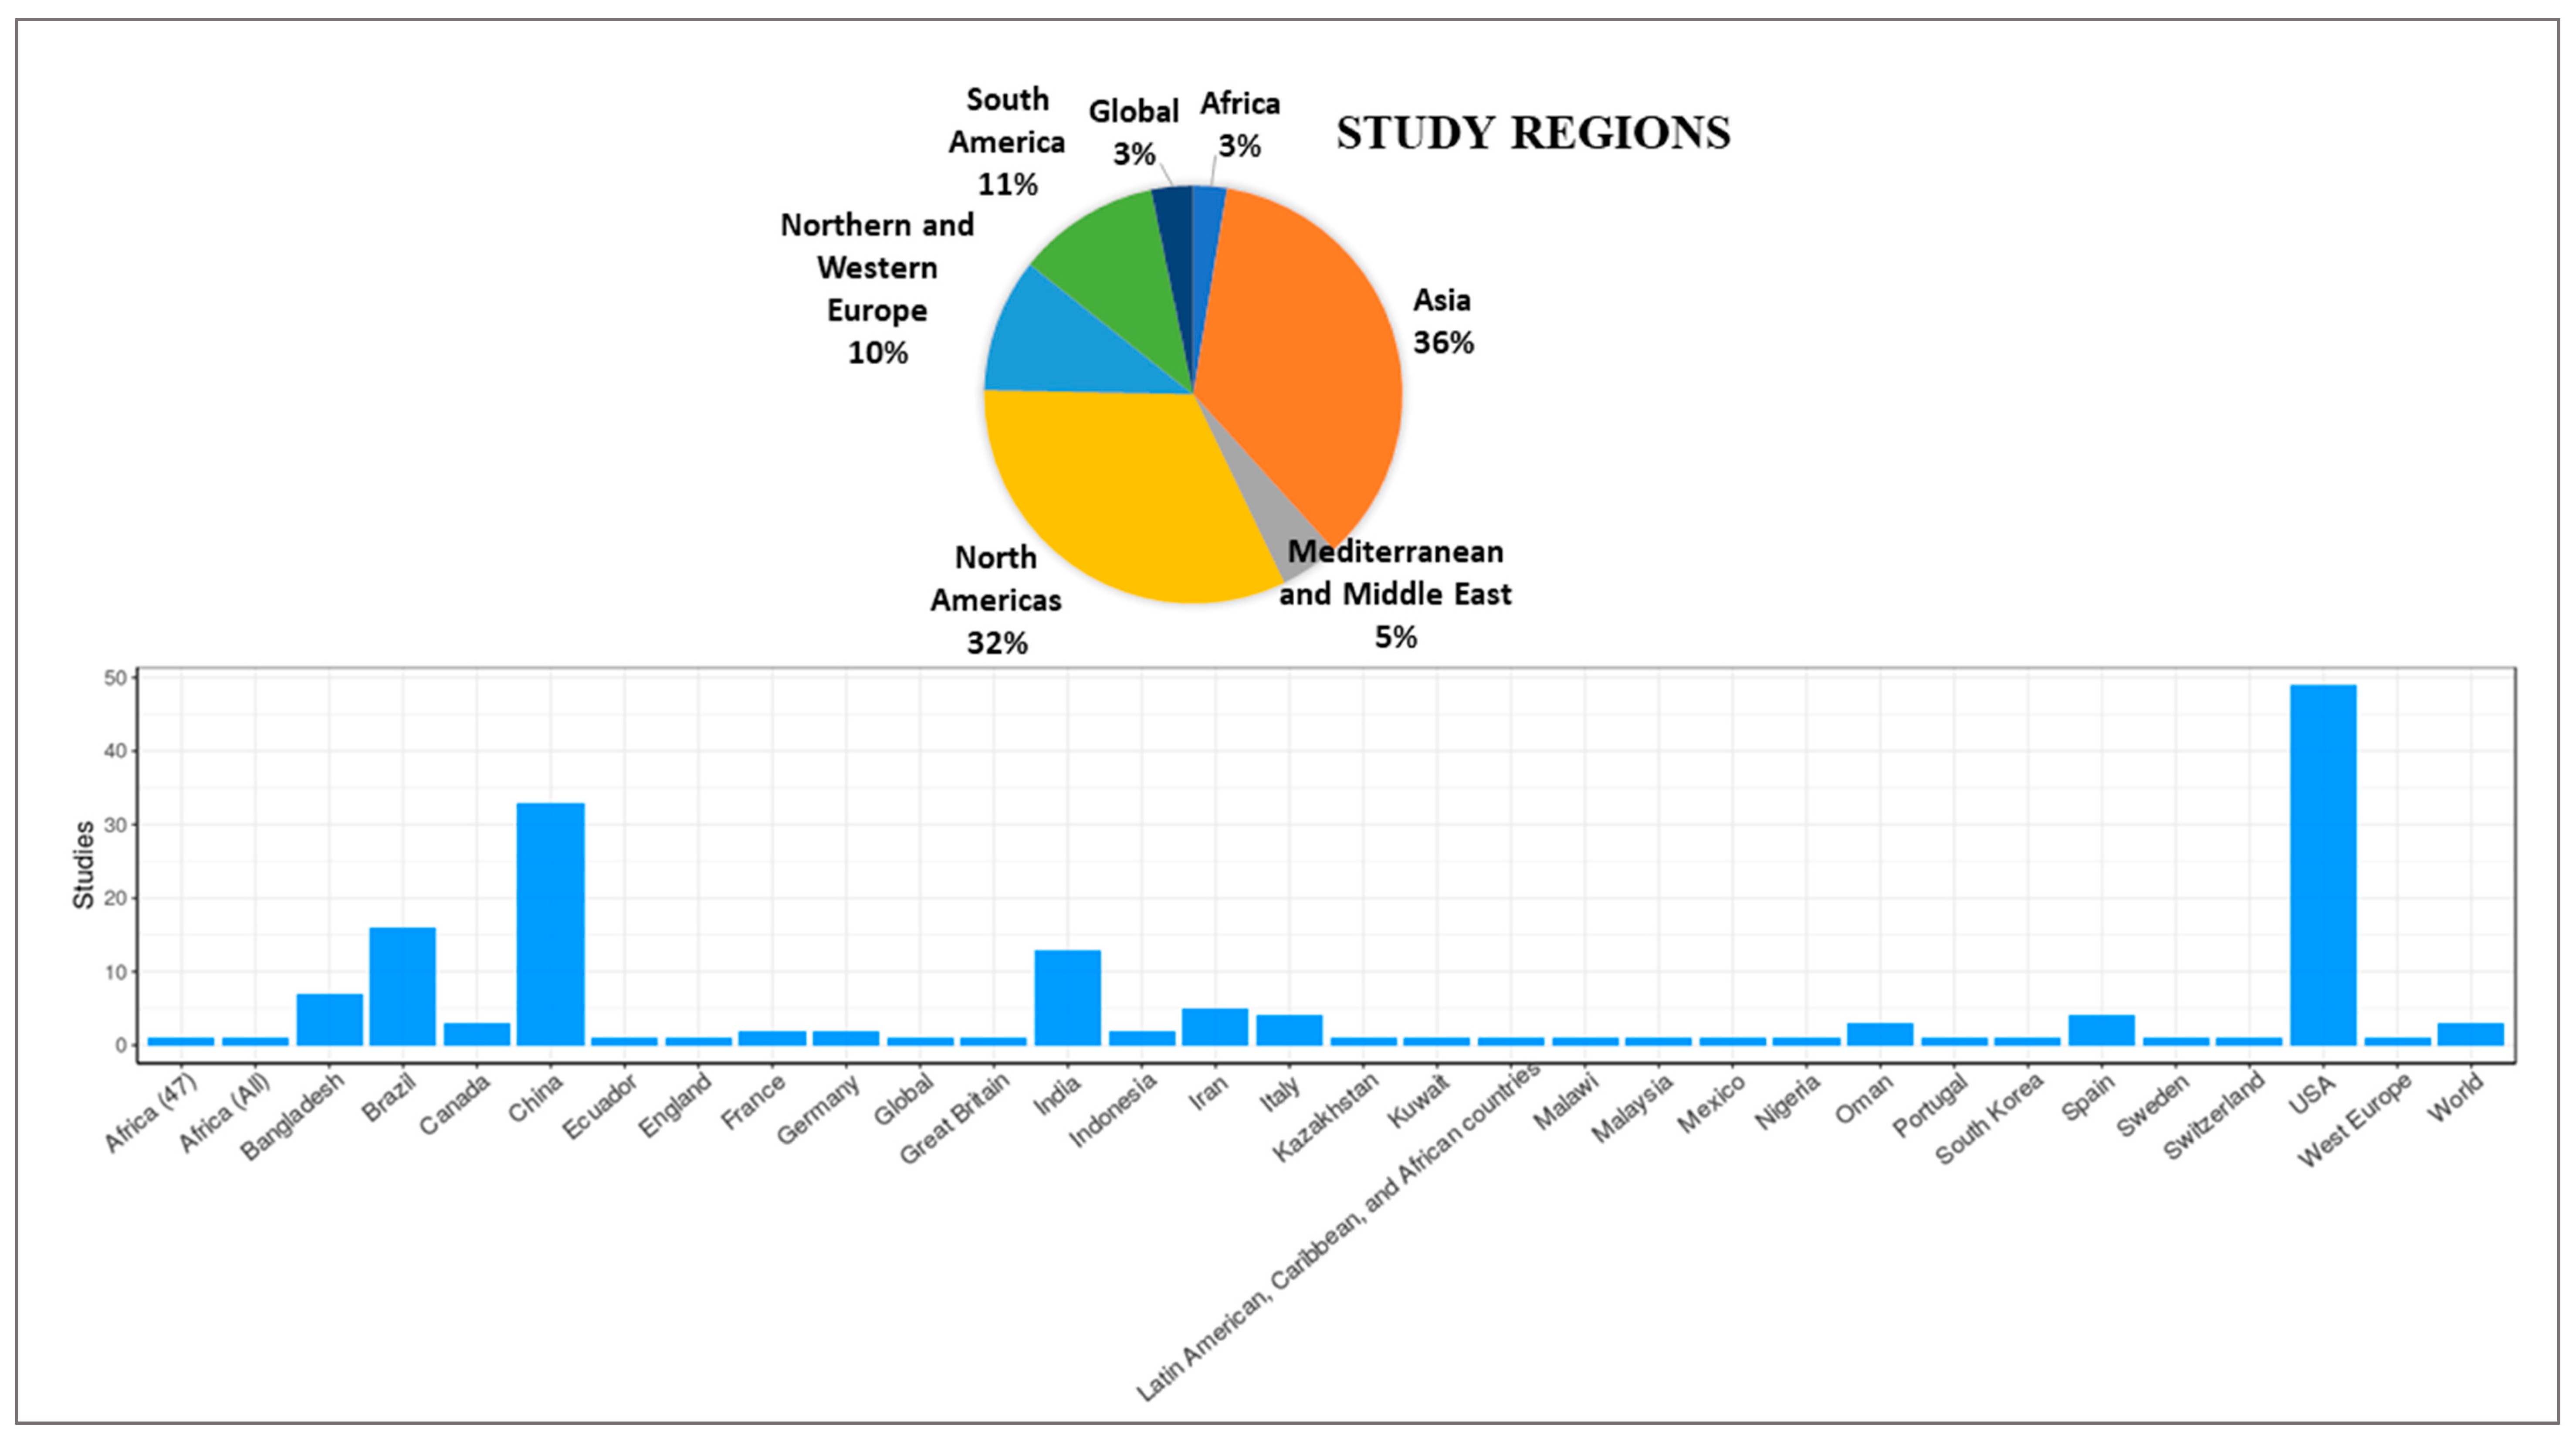
3.3. Time Intervals and Geographic Regions
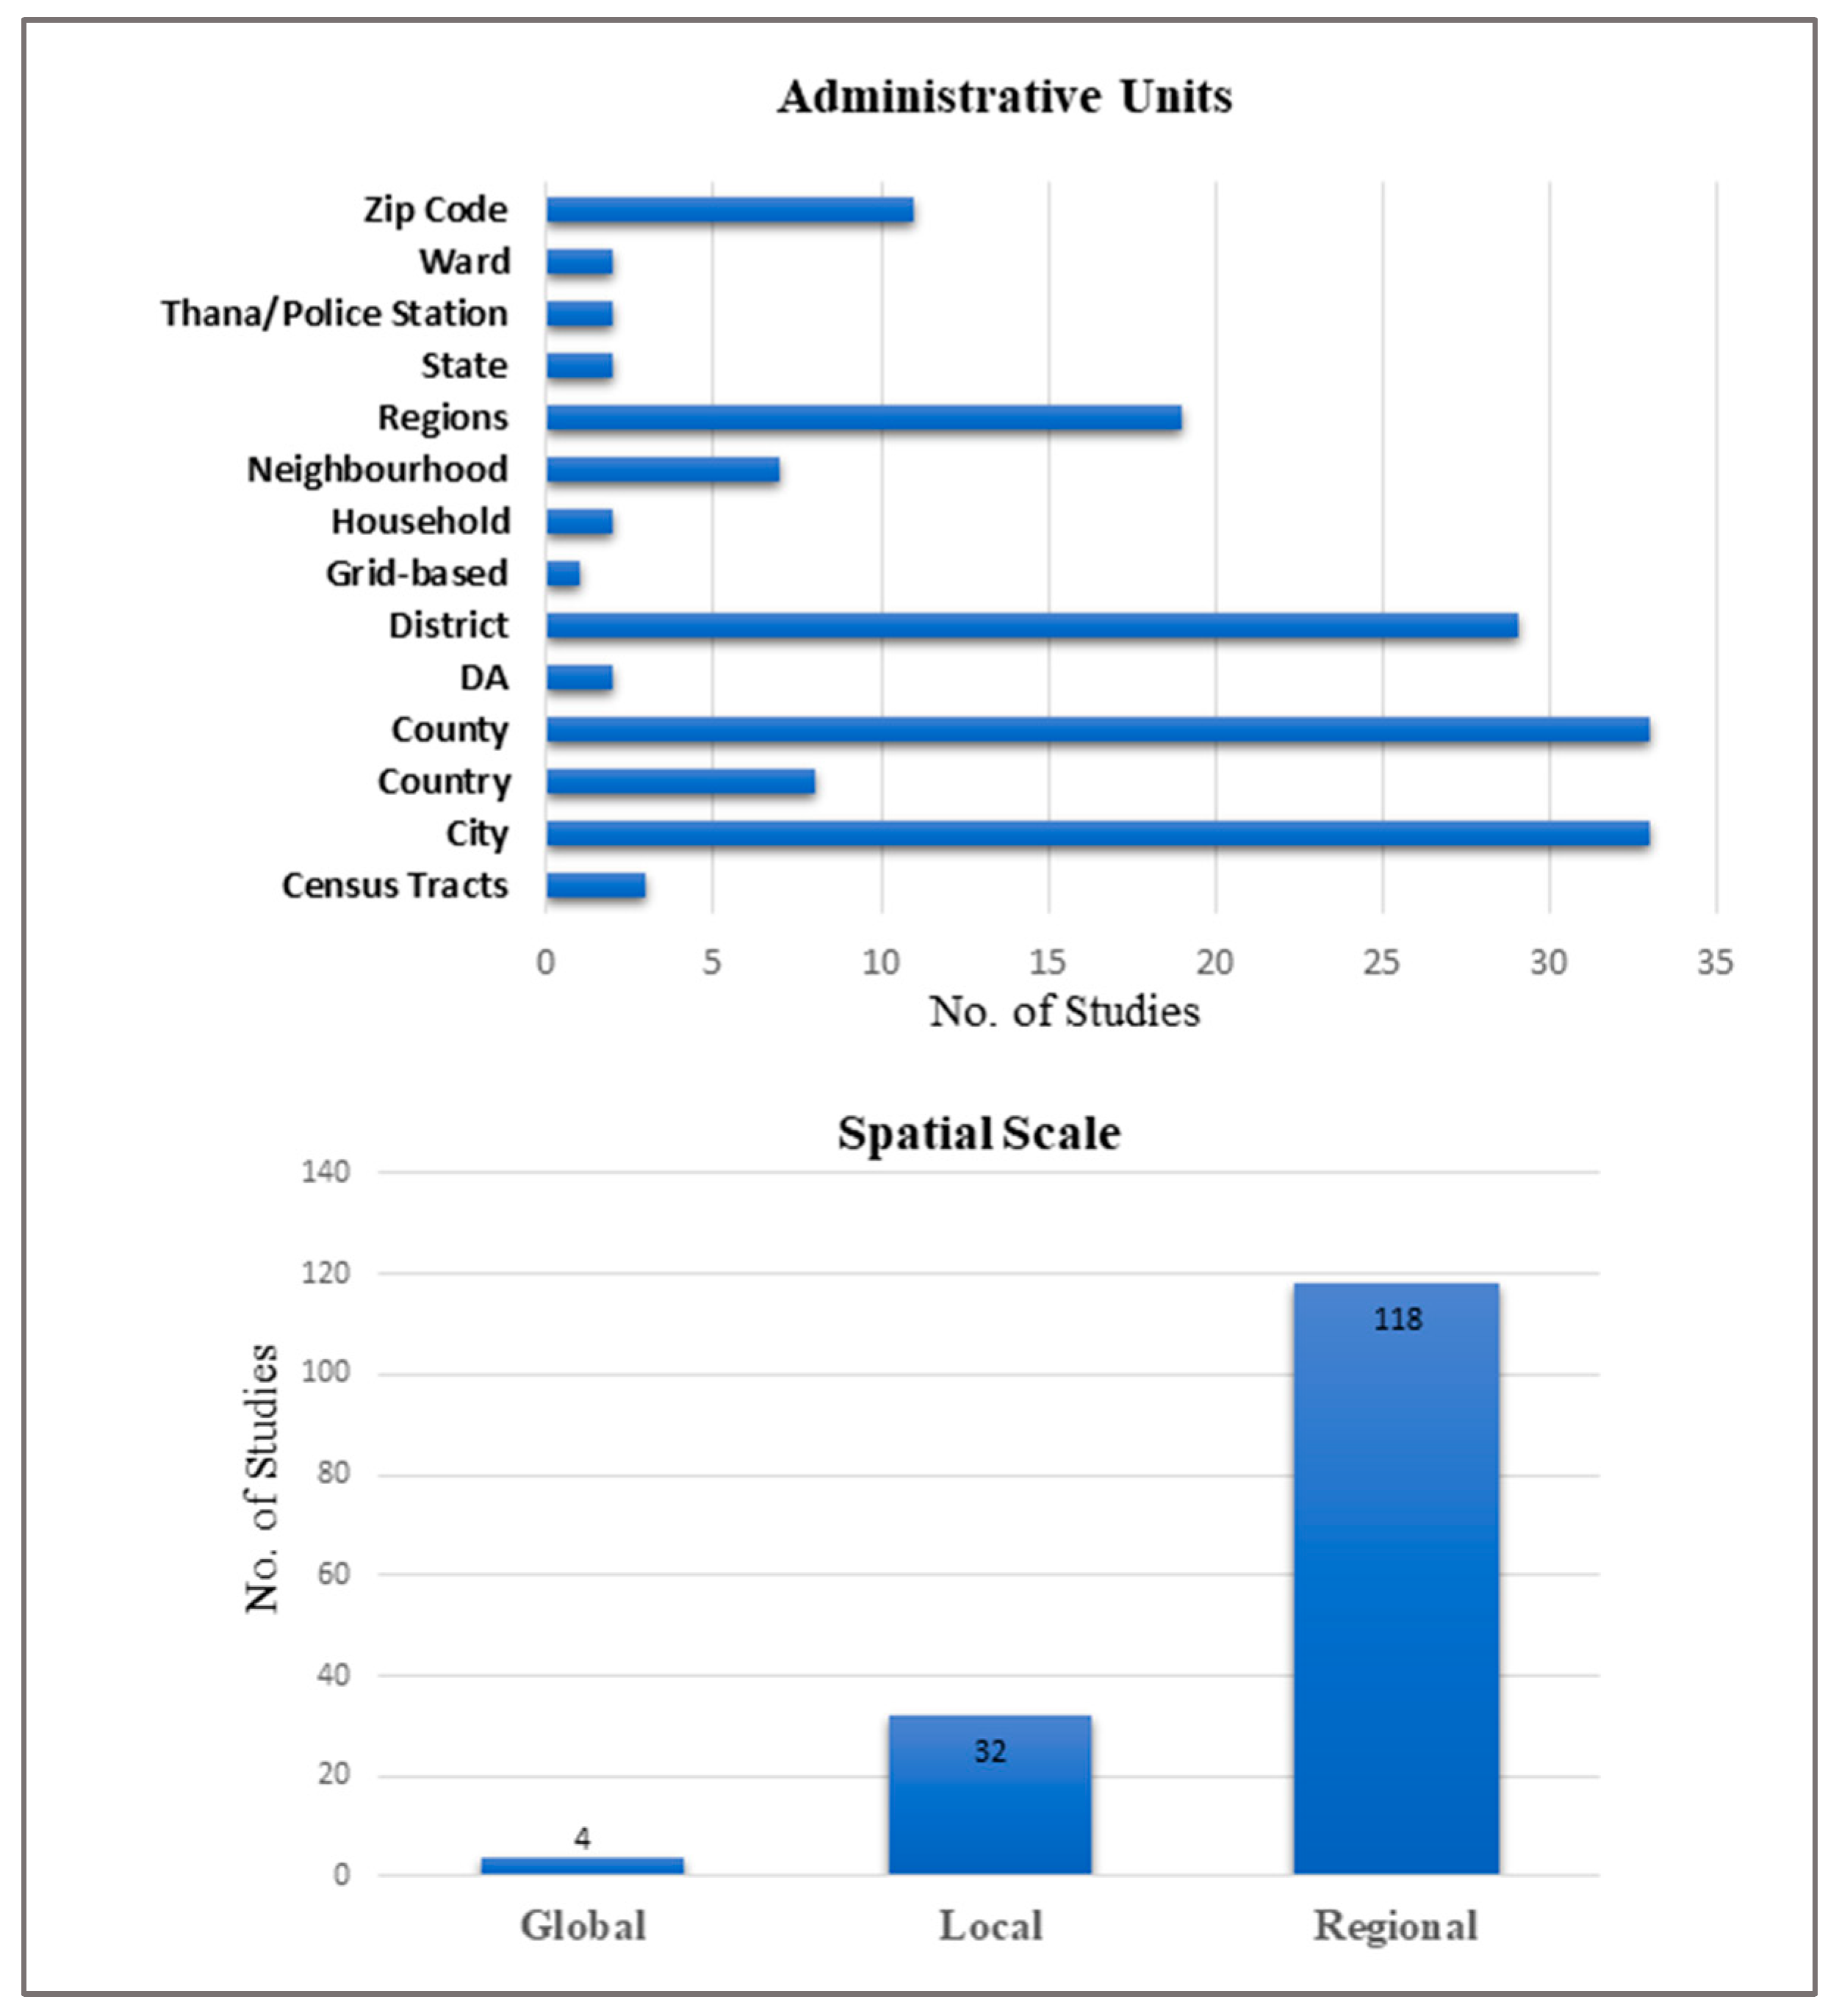
3.4. Data Used and Scale of Analysis
3.5. Study Design Perspective
3.6. Software
3.7. Methods Used to Identify Spatial Variations of COVID-19 and Associated Risk Factors
3.8. Spatial Interpolation Methods
3.9. Spatial Statistical Models (Frequentist)
3.10. Bayesian Spatial and Spatiotemporal Statistical Models
3.11. Relative Risk Estimation
3.12. Bayesian Model Selection
3.13. Model Implementation
3.14. Sensitivity Tests of Priors
3.15. Factors Associated with the Risk for COVID-19
3.16. Assessment of Quality
4. Discussion
Supplementary Materials
Author Contributions
Funding
Institutional Review Board Statement
Informed Consent Statement
Data Availability Statement
Acknowledgments
Conflicts of Interest
Abbreviations
| BAS | Bayesian Adaptive Sampling |
| BCV | Bayesian cross-validation criterion |
| BPM | Bayesian Purity Model |
| BYM | Besag–York–Mollié model |
| CAR | Conditional autoregressive |
| CRPS | Continuous Ranked Probability Score |
| DIC | Deviance Information Criterion |
| GIS | Geographic information system |
| GLMM | Generalized linear mixed models |
| GWR | Geographically weighted regression |
| HPM | Highest probability model |
| INLA | Integrated nested Laplace approximations |
| IWLS | Iterative Weighted Least Square |
| JBI | Joanna Briggs Institute (JBI) |
| PRISMA | Preferred reporting items for systematic review and meta-analysis |
| MAPE | Mean Absolute Percentage Error |
| MCMC | Markov chain Monte Carlo |
| RMSE | Root Mean Squared Error |
| RW | Random Walk |
| SAM | Spatial autoregressive model |
| WAIC | Watanabe–Akaike Information Criterion |
Appendix A
Appendix A.1. Search Strings
Appendix A.2. Embase
- sars-related coronavirus
- (coronavirinae/ or betacoronavirus/ or coronavirus infection/) and (epidemic/ or pandemic/)
- (nCoV* or 2019nCoV or 19nCoV or COVID19* or COVID or SARS-COV-2 or SARSCOV-2 or SARS-COV2 or SARSCOV2 or Severe Acute Respiratory Syndrome Coronavirus 2 or Severe Acute Respiratory Syndrome Corona Virus 2)
- ((new or novel or “19” or “2019” or Wuhan or Hubei or China or Chinese) adj3 (coronavirus* or corona virus* or betacoronavirus* or CoV or HCoV))
- ((coronavirus* or corona virus* or betacoronavirus*) adj3 (pandemic* or epidemic* or outbreak* or crisis))
- ((Wuhan or Hubei) adj5 pneumonia)
- or/1-6
- limit 7 to yr = ”2019 -Current”
- (Space-time clustering
- OR spati*regres*.mp
- OR spat* temp* pattern*.mp OR
- geography* distribut*.mp OR spat* temp*
- distribut*.mp OR heterogen* distribut.mp OR
- spacetime cluster*mp OR space-time cluster*mp
- OR hotspot.mp Or hot spots. mp OR geographically weighted regression OR cluster analysis OR spatial autocorrelation analysis OR GWR OR GIS OR geographic Information Systems)
- 10.
- 8 AND 9
Appendix A.3. Medline
- (coronavirus/ or betacoronavirus/ or coronavirus infections/) and (disease outbreaks/ or epidemics/ or pandemics/)
- (nCoV* or 2019nCoV or 19nCoV or COVID19* or COVID or SARS-COV-2 or SARSCOV-2 or SARSCOV2 or Severe Acute Respiratory Syndrome Coronavirus 2 or Severe Acute Respiratory Syndrome Corona Virus 2)
- ((new or novel or “19” or “2019” or Wuhan or Hubei or China or Chinese) adj3 (coronavirus* or corona virus* or betacoronavirus* or CoV or HCoV))
- ((coronavirus* or corona virus* or betacoronavirus*) adj3 (pandemic* or epidemic* or outbreak* or crisis))
- ((Wuhan or Hubei) adj5 pneumonia)
- or/1-5
- limit 6 to yr = ”2019 -Current”
- (Space-time clustering
- OR spati*regres*.mp
- OR spat* temp* pattern*.mp OR
- geography* distribut*.mp OR spat* temp*
- distribut*.mp OR heterogen* distribut.mp OR
- spacetime cluster*mp OR space-time cluster*mp
- OR hotspot.mp Or hot spots. mp OR geographically weighted regression OR cluster analysis OR spatial autocorrelation analysis OR GWR OR GIS OR geographic Information Systems)
- 9.
- 7 AND 8
Appendix A.4. Scopus
Appendix A.5. Web of Science
Appendix A.6. AND
- (Spatial cluster) OR
- (Spatial hotspot)
- (Spatiotemporal hotspot) OR
- (Spatiotemporal cluster)
- (Geographic Mapping) OR
- (geographic distribution) OR
- (spatial regression) OR
- (spatial autocorrelation analysis) OR
- (Spatiotemporal analysis) OR
- (hotspot) OR (geographically weighted regression) OR (Clustering analysis)
References
- Shereen, M.A.; Khan, S.; Kazmi, A.; Bashir, N.; Siddique, R. COVID-19 infection: Origin, transmission, and characteristics of human coronaviruses. J. Adv. Res. 2020, 24, 91–98. [Google Scholar] [CrossRef]
- Martin, A.; Markhvida, M.; Hallegatte, S.; Walsh, B. Socio-Economic Impacts of COVID-19 on Household Consumption and Poverty. Econ. Dis. Clim. Chang. 2020, 4, 453–479. [Google Scholar] [CrossRef]
- WHO. World Health Organization: COVID-19 Dashboard. Available online: https://covid19.who.int/ (accessed on 1 January 2020).
- Kan, Z.; Kwan, M.-P.; Wong, M.S.; Huang, J.; Liu, D. Identifying the space-time patterns of COVID-19 risk and their associations with different built environment features in Hong Kong. Sci. Total Environ. 2021, 772, 145379. [Google Scholar] [CrossRef]
- Islam, A.; Sayeed, M.A.; Rahman, M.K.; Ferdous, J.; Islam, S.; Hassan, M.M. Geospatial dynamics of COVID-19 clusters and hotspots in Bangladesh. Transbound. Emerg. Dis. 2021, 68, 3643–3657. [Google Scholar] [CrossRef]
- Carballada, A.M.; Balsa-Barreiro, J. Geospatial Analysis and Mapping Strategies for Fine-Grained and Detailed COVID-19 Data with GIS. ISPRS Int. J. Geo-Inf. 2021, 10, 602. [Google Scholar] [CrossRef]
- Carroll, L.N.; Au, A.P.; Detwiler, L.T.; Fu, T.; Painter, I.S.; Abernethy, N.F. Visualization and analytics tools for infectious disease epidemiology: A systematic review. J. Biomed. Inform. 2014, 51, 287–298. [Google Scholar] [CrossRef] [Green Version]
- Elliott, P.; Wartenberg, D. Spatial epidemiology: Current approaches and future challenges. Environ. Health Perspect. 2004. [Google Scholar] [CrossRef]
- Marshall, R.J. A Review of Methods for the Statistical Analysis of Spatial Patterns of Disease. J. R. Stat. Soc. Ser. A 1991, 154, 421–441. [Google Scholar] [CrossRef]
- Rosli, N.M.; Shah, S.A.; Mahmood, M.I. Geographical Information System (GIS). Application in Tuberculosis Spatial Clustering Studies: A Systematic Review. Malays. J. Public Health Med. 2018, 18, 70–80. [Google Scholar]
- Jones, K.E.; Patel, N.G.; Levy, M.A.; Storeygard, A.; Balk, D.; Gittleman, J.L.; Daszak, P. Global trends in emerging infectious diseases. Nature 2008, 451, 990–993. [Google Scholar] [CrossRef]
- Rozenfeld, Y.; Beam, J.; Maier, H.; Haggerson, W.; Boudreau, K.; Carlson, J.; Medows, R. A model of disparities: Risk factors associated with COVID-19 infection. Int. J. Equity Health 2020, 19, 126. [Google Scholar] [CrossRef]
- Nykiforuk, C.I.; Flaman, L.M. Geographic Information Systems (GIS) for Health Promotion and Public Health: A Review. Health Promot. Pract. 2011, 12, 63–73. [Google Scholar] [CrossRef]
- Krieger, N. Place, Space, and Health: GIS and Epidemiology. Epidemiology 2003, 14, 384–385. [Google Scholar] [CrossRef]
- Rytkönen, M.J. Not all maps are equal: GIS and spatial analysis in epidemiology. Int. J. Circumpolar Health 2004, 63, 9–24. [Google Scholar] [CrossRef]
- Torabi, M. Spatial modeling using frequentist approach for disease mapping. J. Appl. Stat. 2012, 39, 2431–2439. [Google Scholar] [CrossRef]
- Wintle, B.A.; McCarthy, M.A.; Volinsky, C.T.; Kavanagh, R.P. The Use of Bayesian Model Averaging to Better Represent Uncertainty in Ecological Models. Conserv. Biol. 2003, 17, 1579–1590. [Google Scholar] [CrossRef]
- van de Schoot, R.; Depaoli, S.; King, R.; Kramer, B.; Märtens, K.; Tadesse, M.G.; Vannucci, M.; Gelman, A.; Veen, D.; Willemsen, J.; et al. Bayesian statistics and modelling. Nat. Rev. Methods Primers 2021, 1, 1. [Google Scholar] [CrossRef]
- Knorr-Held, L.; Besag, J. Modelling risk from a disease in time and space. Stat. Med. 1998, 17, 2045–2060. [Google Scholar] [CrossRef]
- Lai, P.-C.; So, F.-M.; Chan, K.-W. Spatial Epidemiological Approaches in Disease Mapping and Analysis; CRC Press: Boca Raton, FL, USA, 2008. [Google Scholar]
- Manley, D. Scale, Aggregation, and the Modifiable Areal Unit Problem. In Handbook of Regional Science; Fischer, M.M., Nijkamp, P., Eds.; Springer: Berlin/Heidelberg, Germany, 2014; pp. 1157–1171. [Google Scholar]
- Manley, D.; Flowerdew, R.; Steel, D. Scales, levels and processes: Studying spatial patterns of British census variables. Comput. Environ. Urban Syst. 2006, 30, 143–160. [Google Scholar] [CrossRef]
- Franch-Pardo, I.; Napoletano, B.M.; Rosete-Verges, F.; Billa, L. Spatial analysis and GIS in the study of COVID-19. A review. Sci. Total Environ. 2020, 739, 140033. [Google Scholar] [CrossRef]
- Fatima, M.; O’Keefe, K.J.; Wei, W.; Arshad, S.; Gruebner, O. Geospatial Analysis of COVID-19: A Scoping Review. Int. J. Environ. Res. Public Health 2021, 18, 2336. [Google Scholar] [CrossRef]
- The PRISMA 2020 Statement: An Updated Guideline for Reporting Systematic Reviews|The EQUATOR Network. Available online: https://www.equator-network.org/reporting-guidelines/prisma/ (accessed on 11 March 2022).
- CADTH COVID-19 Search Strings. CADTH COVID-19 Evidence Portal. Available online: https://covid.cadth.ca/literature-searching-tools/cadth-covid-19-search-strings/ (accessed on 11 March 2022).
- Covidence-Better Systematic Review Management. Available online: https://www.covidence.org/ (accessed on 11 March 2022).
- critical-appraisal-tools-Critical Appraisal Tools|Joanna Briggs Institute. Available online: https://jbi.global/critical-appraisal-tools (accessed on 11 March 2022).
- Mo, C.; Tan, D.; Mai, T.; Bei, C.; Qin, J.; Pang, W.; Zhang, Z. An analysis of spatiotemporal pattern for COVID-19 in China based on space-time cube. J. Med. Virol. 2020, 92, 1587–1595. [Google Scholar] [CrossRef] [Green Version]
- Sedgwick, P. Ecological studies: Advantages and disadvantages. BMJ 2014, 348, g2979. [Google Scholar] [CrossRef]
- Alkhamis, M.A.; Al Youha, S.; Khajah, M.M.; Haider, N.B.; Alhardan, S.; Nabeel, A.; Al Mazeedi, S.; Al-Sabah, S.K. Spatiotemporal dynamics of the COVID-19 pandemic in the State of Kuwait. Int. J. Infect. Dis. 2020, 98, 153–160. [Google Scholar] [CrossRef]
- Alcântara, E.; Mantovani, J.; Rotta, L.; Park, E.; Rodrigues, T.; Carvalho, F.C.; Souza Filho, C.R. Investigating spatiotemporal patterns of the COVID-19 in São Paulo State, Brazil. Geospat. Health 2020, 15. [Google Scholar] [CrossRef]
- Al-Kindi, K.M.; Alkharusi, A.; Alshukaili, D.; Al Nasiri, N.; Al-Awadhi, T.; Charabi, Y.; El Kenawy, A.M. Spatiotemporal Assessment of COVID-19 Spread over Oman Using GIS Techniques. Earth Syst. Environ. 2020, 4, 797–811. [Google Scholar] [CrossRef]
- Arauzo-Carod, J.-M. A first insight about spatial dimension of COVID-19: Analysis at municipality level. J. Public Health 2021, 43, 98–106. [Google Scholar] [CrossRef]
- Bhunia, G.S.; Roy, S.; Shit, P.K. Spatio-temporal analysis of COVID-19 in India—A geostatistical approach. Spat. Inf. Res. 2021, 29, 661–672. [Google Scholar] [CrossRef]
- Bilal, U.; Tabb, L.P.; Barber, S.; Diez Roux, A.V. Spatial Inequities in COVID-19 Testing, Positivity, Confirmed Cases, and Mortality in 3 U.S. Cities: An Ecological Study. Ann. Intern. Med. 2021, 174, 936–944. [Google Scholar] [CrossRef]
- Cao, Y.; Hiyoshi, A.; Montgomery, S. COVID-19 case-fatality rate and demographic and socioeconomic influencers: Worldwide spatial regression analysis based on country-level data. BMJ Open 2020, 10, e043560. [Google Scholar] [CrossRef]
- Castro, R.R.; Santos, R.S.C.; Sousa, G.J.B.; Pinheiro, Y.T.; Martins, R.R.I.M.; Pereira, M.L.D.; Silva, R.A.R. Spatial dynamics of the COVID-19 pandemic in Brazil. Epidemiol. Infect. 2021, 149, e60. [Google Scholar] [CrossRef]
- Cordes, J.; Castro, M.C. Spatial analysis of COVID-19 clusters and contextual factors in New York City. Spat. Spatio-Temporal Epidemiol. 2020, 34, 100355. [Google Scholar] [CrossRef]
- Coura-Vital, W.; Cardoso, D.T.; Ker, F.T.D.O.; Magalhães, F.D.C.; Bezerra, J.M.T.; Viegas, A.M.; Morais, M.H.F.; Bastos, L.S.; Reis, I.A.; Carneiro, M.; et al. Spatiotemporal dynamics and risk estimates of COVID-19 epidemic in Minas Gerais State: Analysis of an expanding process. Revista do Instituto de Medicina Tropical de São Paulo 2021, 63, e21. [Google Scholar] [CrossRef]
- de Souza, C.D.F.; Machado, M.F.; da Silva Junior, A.G.; Nunes, B.E.B.R.; do Carmo, R.F. Airports, highways and COVID-19: An analysis of spatial dynamics in Brazil. J. Transp. Health. 2021, 21, 101067. [Google Scholar] [CrossRef]
- Fonseca-Rodríguez, O.; Gustafsson, P.E.; San Sebastián, M.; Connolly, A.-M.F. Spatial clustering and contextual factors associated with hospitalisation and deaths due to COVID-19 in Sweden: A geospatial nationwide ecological study. BMJ Glob. Health 2021, 6, e006247. [Google Scholar] [CrossRef]
- Gaudart, J.; Landier, J.; Huiart, L.; Legendre, E.; Lehot, L.; Bendiane, M.K.; Chiche, L.; Petitjean, A.; Mosnier, E.; Kirakoya-Samadoulougou, F.; et al. Factors associated with the spatial heterogeneity of the first wave of COVID-19 in France: A nationwide geo-epidemiological study. Lancet Public Health 2021, 6, e222–e231. [Google Scholar] [CrossRef]
- Gomes, D.S.; Andrade, L.A.; Ribeiro, C.J.N.; Peixoto, M.V.S.; Lima, S.V.M.A.; Duque, A.M.; Cirilo, T.M.; Góes, M.A.O.; Lima, A.G.C.F.; Santos, M.B.; et al. Risk clusters of COVID-19 transmission in Northeastern Brazil: Prospective space-time modeling. Epidemiol. Infect. 2020, 148, e188. [Google Scholar] [CrossRef]
- Hu, T.; Yue, H.; Wang, C.; She, B.; Ye, X.; Liu, R.; Zhu, X.; Guan, W.W.; Bao, S. Racial Segregation, Testing Site Access, and COVID-19 Incidence Rate in Massachusetts, USA. Int. J. Environ. Res. Public Health 2020, 17, 9528. [Google Scholar] [CrossRef]
- Han, L.; Jia, J. Reductions of migrant population reduces the number of COVID-19 epidemic: A case study in China. Environ. Sci. Pollut. Res. 2021, 28, 58364–58374. [Google Scholar] [CrossRef]
- Hassaan, M.A.; Abdelwahab, R.G.; Elbarky, T.A.; Ghazy, R.M. GIS-Based Analysis Framework to Identify the Determinants of COVID-19 Incidence and Fatality in Africa. J. Prim. Care Community Health 2021, 12, 21501327211041210. [Google Scholar] [CrossRef]
- Huang, Z. Spatiotemporal Evolution Patterns of the COVID-19 Pandemic Using Space-Time Aggregation and Spatial Statistics: A Global Perspective. ISPRS Int. J. Geo-Inf. 2021, 10, 519. [Google Scholar] [CrossRef]
- Iyanda, A.E.; Boakye, K.A.; Lu, Y.; Oppong, J.R. Racial/Ethnic Heterogeneity and Rural-Urban Disparity of COVID-19 Case Fatality Ratio in the USA: A Negative Binomial and GIS-Based Analysis. J. Racial Ethn. Health Disparities 2021, 9, 708–721. [Google Scholar] [CrossRef]
- Kang, D.; Choi, H.; Kim, J.H.; Choi, J. Spatial epidemic dynamics of the COVID-19 outbreak in China. Int. J. Infect. Dis. 2020, 94, 96–102. [Google Scholar] [CrossRef]
- Kim, B.; Rundle, A.G.; Goodwin, A.T.S.; Morrison, C.N.; Branas, C.C.; El-Sadr, W.; Duncan, D.T. COVID-19 testing, case, and death rates and spatial socio-demographics in New York City: An ecological analysis as of June 2020. Health Place 2021, 68, 102539. [Google Scholar] [CrossRef]
- Kim, S.; Castro, M.C. Spatiotemporal pattern of COVID-19 and government response in South Korea (as of May 31, 2020). Int. J. Infect. Dis. 2020, 98, 328–333. [Google Scholar] [CrossRef]
- Kulu, H.; Dorey, P. Infection rates from COVID-19 in Great Britain by geographical units: A model-based estimation from mortality data. Health Place 2021, 67, 102460. [Google Scholar] [CrossRef]
- Kuznetsov, A.; Sadovskaya, V. Spatial variation and hotspot detection of COVID-19 cases in Kazakhstan, 2020. Spat. Spatio-Temporal Epidemiol. 2021, 39, 100430. [Google Scholar] [CrossRef]
- Li, H.; Li, H.; Ding, Z.; Hu, Z.; Chen, F.; Wang, K.; Peng, Z.; Shen, H. Spatial statistical analysis of coronavirus disease 2019 (Covid-19) in China. Geospat. Health 2020, 15. [Google Scholar] [CrossRef]
- Lin, Q.; Ou, G.; Wang, R.; Li, Y.; Zhao, Y.; Dong, Z. The Spatiotemporal Characteristics and Climatic Factors of COVID-19 in Wuhan, China. Sustainability 2021, 13, 8112. [Google Scholar] [CrossRef]
- Liu, L.; Hu, T.; Bao, S.; Wu, H.; Peng, Z.; Wang, R. The Spatiotemporal Interaction Effect of COVID-19 Transmission in the United States. ISPRS Int. J. Geo-Inf. 2021, 10, 387. [Google Scholar] [CrossRef]
- Liu, M.; Liu, M.; Li, Z.; Zhu, Y.; Liu, Y.; Wang, X.; Tao, L.; Guo, X. The spatial clustering analysis of COVID-19 and its associated factors in mainland China at the prefecture level. Sci. Total Environ. 2021, 777, 145992. [Google Scholar] [CrossRef]
- Ma, Q.; Gao, J.; Zhang, W.; Wang, L.; Li, M.; Shi, J.; Zhai, Y.; Sun, D.; Wang, L.; Chen, B.; et al. Spatio-temporal distribution characteristics of COVID-19 in China: A city-level modeling study. BMC Infect. Dis. 2021, 21, 816. [Google Scholar] [CrossRef] [PubMed]
- Maroko, A.R.; Nash, D.; Pavilonis, B.T. COVID-19 and Inequity: A Comparative Spatial Analysis of New York City and Chicago Hot Spots. J. Urban Health 2020, 97, 461–470. [Google Scholar] [CrossRef] [PubMed]
- Parvin, F.; Ali, S.A.; Hashmi, S.N.I.; Ahmad, A. Spatial prediction and mapping of the COVID-19 hotspot in India using geostatistical technique. Spat. Inf. Res. 2021, 29, 479–494. [Google Scholar] [CrossRef]
- Raymundo, C.E.; Oliveira, M.C.; Eleuterio, T.D.A.; André, S.R.; da Silva, M.G.; Queiroz, E.R.D.S.; Medronho, R.D.A. Spatial analysis of COVID-19 incidence and the sociodemographic context in Brazil. PLoS ONE 2021, 16, e0247794. [Google Scholar] [CrossRef]
- Rendana, M.; Idris, W.M.R.; Abdul Rahim, S. Spatial distribution of COVID-19 cases, epidemic spread rate, spatial pattern, and its correlation with meteorological factors during the first to the second waves. J. Infect. Public Health 2021, 14, 1340–1348. [Google Scholar] [CrossRef]
- Sun, Y.; Hu, X.; Xie, J. Spatial inequalities of COVID-19 mortality rate in relation to socioeconomic and environmental factors across England. Sci. Total Environ. 2020, 758, 143595. [Google Scholar] [CrossRef]
- Vaz, E. COVID-19 in Toronto: A Spatial Exploratory Analysis. Sustainability 2021, 13, 498. [Google Scholar] [CrossRef]
- Wang, P.; Ren, H.; Zhu, X.; Fu, X.; Liu, H.; Hu, T. Spatiotemporal characteristics and factor analysis of SARS-CoV-2 infections among healthcare workers in Wuhan, China. J. Hosp. Infect. 2021, 110, 172–177. [Google Scholar] [CrossRef]
- Wang, Q.; Dong, W.; Yang, K.; Ren, Z.; Huang, D.; Zhang, P.; Wang, J. Temporal and spatial analysis of COVID-19 transmission in China and its influencing factors. Int. J. Infect. Dis. 2021, 105, 675–685. [Google Scholar] [CrossRef]
- Xie, Z.; Qin, Y.; Li, Y.; Shen, W.; Zheng, Z.; Liu, S. Spatial and temporal differentiation of COVID-19 epidemic spread in mainland China and its influencing factors. Sci. Total Environ. 2020, 744, 140929. [Google Scholar] [CrossRef] [PubMed]
- Xiong, Y.; Wang, Y.; Chen, F.; Zhu, M. Spatial statistics and influencing factors of the COVID-19 epidemic at both prefecture and county levels in Hubei Province, China. Int. J. Environ. Res. Public Health 2020, 17, 3903. [Google Scholar] [CrossRef] [PubMed]
- Ye, L.; Hu, L. Spatiotemporal distribution and trend of COVID-19 in the Yangtze river Delta region of the People’s Republic of China. Geospat. Health 2020, 15. [Google Scholar] [CrossRef] [PubMed]
- Zhai, W.; Liu, M.; Fu, X.; Peng, Z.-R. American Inequality Meets COVID-19: Uneven Spread of the Disease across Communities. Ann. Am. Assoc. Geogr. 2021, 111, 2023–2043. [Google Scholar] [CrossRef]
- Zhang, S.; Yang, Z.; Wang, M.; Zhang, B. “Distance-Driven” Versus “Density-Driven”: Understanding the Role of “Source-Case” Distance and Gathering Places in the Localized Spatial Clustering of COVID-19—A Case Study of the Xinfadi Market, Beijing (China). GeoHealth 2021, 5, e2021GH000458. [Google Scholar] [CrossRef]
- Zhang, X.; Rao, H.; Wu, Y.; Huang, Y.; Dai, H. Comparison of spatiotemporal characteristics of the COVID-19 and SARS outbreaks in mainland China. BMC Infect. Dis. 2020, 20, 805. [Google Scholar] [CrossRef]
- Chen, Y.; Li, Q.; Karimian, H.; Chen, X.; Li, X. Spatio-temporal distribution characteristics and influencing factors of COVID-19 in China. Sci. Rep. 2021, 11, 3717. [Google Scholar] [CrossRef]
- Mollalo, A.; Rivera, K.M.; Vahabi, N. Spatial statistical analysis of pre-existing mortalities of 20 diseases with COVID-19 mortalities in the continental United States. Sustain. Cities Soc. 2021, 67, 102738. [Google Scholar] [CrossRef]
- Sannigrahi, S.; Pilla, F.; Basu, B.; Basu, A.S.; Molter, A. Examining the association between socio-demographic composition and COVID-19 fatalities in the European region using spatial regression approach. Sustain. Cities Soc. 2020, 62, 102418. [Google Scholar] [CrossRef]
- Shariati, M.; Mesgari, T.; Kasraee, M.; Jahangiri-rad, M. Spatiotemporal analysis and hotspots detection of COVID-19 using geographic information system (March and April, 2020). J. Environ. Health Sci. Eng. 2020, 18, 1499–1507. [Google Scholar] [CrossRef]
- Silva, A.P.D.S.C.; Holanda, E.R.D.; Abreu, P.D.D.; Freitas, M.V.D.A. COVID-19 in children in the state of Pernambuco: Spatial analysis of confirmed severe cases and the Human Development Index. Revista da Sociedade Brasileira de Medicina Tropical 2021, 54, e0782-2020. [Google Scholar] [CrossRef] [PubMed]
- Wu, X.; Zhang, J. Exploration of spatial-temporal varying impacts on COVID-19 cumulative case in Texas using geographically weighted regression (GWR). Environ. Sci. Pollut. Res. 2021, 28, 43732–43746. [Google Scholar] [CrossRef] [PubMed]
- Bag, R.; Ghosh, M.; Biswas, B.; Chatterjee, M. Understanding the spatio-temporal pattern of COVID-19 outbreak in India using GIS and India’s response in managing the Pandemic. Reg. Sci. Policy Pract. 2020, 12, 1063–1103. [Google Scholar] [CrossRef]
- Fan, J.; Liu, X.; Pan, W.; Douglas, M.W.; Bao, S. Epidemiology of Coronavirus Disease in Gansu Province, China, 2020. Emerg. Infect. Dis. 2020, 26, 1257–1265. [Google Scholar] [CrossRef] [PubMed]
- Feng, Y.; Li, Q.; Tong, X.; Wang, R.; Zhai, S.; Gao, C.; Lei, Z.; Chen, S.; Zhou, Y.; Wang, J.; et al. Spatiotemporal spread pattern of the COVID-19 cases in China. PLoS ONE 2020, 15, e0244351. [Google Scholar] [CrossRef]
- Ferreira, M.C. Spatial association between the incidence rate of Covid-19 and poverty in the São Paulo municipality, Brazil. Geospat. Health 2020, 15. [Google Scholar] [CrossRef]
- Ghosh, P.; Cartone, A. A Spatio-temporal analysis of COVID-19 outbreak in Italy. Reg. Sci. Policy Pract. 2020, 12, 1047–1062. [Google Scholar] [CrossRef]
- Gupta, D.; Biswas, D.; Kabiraj, P. COVID-19 outbreak and Urban dynamics: Regional variations in India. GeoJournal 2021. [Google Scholar] [CrossRef]
- Han, Y.; Yang, L.; Jia, K.; Li, J.; Feng, S.; Chen, W.; Zhao, W.; Pereira, P. Spatial distribution characteristics of the COVID-19 pandemic in Beijing and its relationship with environmental factors. Sci. Total Environ. 2021, 761, 144257. [Google Scholar] [CrossRef]
- Jackson, S.L.; Derakhshan, S.; Blackwood, L.; Lee, L.; Huang, Q.; Habets, M.; Cutter, S.L. Spatial Disparities of COVID-19 Cases and Fatalities in United States Counties. Int. J. Environ. Res. Public Health 2021, 18, 8259. [Google Scholar] [CrossRef]
- MohammadEbrahimi, S.; Mohammadi, A.; Bergquist, R.; Dolatkhah, F.; Olia, M.; Tavakolian, A.; Pishgar, E.; Kiani, B. Epidemiological characteristics and initial spatiotemporal visualisation of COVID-19 in a major city in the Middle East. BMC Public Health 2021, 21, 1373. [Google Scholar] [CrossRef] [PubMed]
- Kim, S.J.; Bostwick, W. Social Vulnerability and Racial Inequality in COVID-19 Deaths in Chicago. Health Educ. Behav. 2020, 47, 509–513. [Google Scholar] [CrossRef] [PubMed]
- Li, S.; Ma, S.; Zhang, J. Association of built environment attributes with the spread of COVID-19 at its initial stage in China. Sustain. Cities Soc. 2021, 67, 102752. [Google Scholar] [CrossRef] [PubMed]
- Liu, W.; Wang, D.; Hua, S.; Xie, C.; Wang, B.; Qiu, W.; Xu, T.; Ye, Z.; Yu, L.; Yang, M.; et al. Spatiotemporal analysis of COVID-19 outbreaks in Wuhan, China. Sci. Rep. 2021, 11, 13648. [Google Scholar] [CrossRef] [PubMed]
- Niu, B.; Liang, R.; Zhang, S.; Zhang, H.; Qu, X.; Su, Q.; Zheng, L.; Chen, Q. Epidemic analysis of COVID-19 in Italy based on spatiotemporal geographic information and Google Trends. Transbound. Emerg. Dis. 2021, 68, 2384–2400. [Google Scholar] [CrossRef] [PubMed]
- Niu, X.; Yue, Y.; Zhou, X.; Zhang, X. How Urban Factors Affect the Spatiotemporal Distribution of Infectious Diseases in Addition to Intercity Population Movement in China. ISPRS Int. J. Geo-Inf. 2020, 9, 615. [Google Scholar] [CrossRef]
- Ramírez-Aldana, R.; Gomez-Verjan, J.C.; Bello-Chavolla, O.Y. Spatial analysis of COVID-19 spread in Iran: Insights into geographical and structural transmission determinants at a province level. PLoS Negl. Trop. Dis. 2020, 14, e0008875. [Google Scholar] [CrossRef]
- Sarkar, S.K.; Ekram, K.M.M.; Das, P.C. Spatial modeling of COVID-19 transmission in Bangladesh. Spat. Inf. Res. 2021, 29, 715–726. [Google Scholar] [CrossRef]
- Scarpone, C.; Brinkmann, S.T.; Große, T.; Sonnenwald, D.; Fuchs, M.; Walker, B.B. A multimethod approach for county-scale geospatial analysis of emerging infectious diseases: A cross-sectional case study of COVID-19 incidence in Germany. Int. J. Health Geogr. 2020, 19, 32. [Google Scholar] [CrossRef]
- Shi, J.; Gao, X.; Xue, S.; Li, F.; Nie, Q.; Lv, Y.; Wang, J.; Xu, T.; Du, G.; Li, G. Spatio-temporal evolution and influencing mechanism of the COVID-19 epidemic in Shandong province, China. Sci. Rep. 2021, 11, 7811. [Google Scholar] [CrossRef]
- Yu, X.; Wong, M.S.; Kwan, M.P.; Nichol, J.E.; Zhu, R.; Heo, J.; Chan, P.W.; Chin, D.C.; Kwok, C.Y.T.; Kan, Z. COVID-19 Infection and Mortality: Association with PM2.5 Concentration and Population Density—An Exploratory Study. ISPRS Int. J. Geo-Inf. 2021, 10, 123. [Google Scholar] [CrossRef]
- Huang, X.; Zhou, H.; Yang, X.; Zhou, W.; Huang, J.; Yuan, Y. Spatial Characteristics of Coronavirus Disease 2019 and Their Possible Relationship With Environmental and Meteorological Factors in Hubei Province, China. Geohealth 2021, 5, e2020GH000358. [Google Scholar] [CrossRef] [PubMed]
- Alves, J.D.; Abade, A.S.; Peres, W.P.; Borges, J.E.; Santos, S.M.; Scholze, A.R. Impact of COVID-19 on the indigenous population of Brazil: A geo-epidemiological study. Epidemiol. Infect. 2021, 149, e185. [Google Scholar] [CrossRef] [PubMed]
- Ameh Yaro, C.; Udama Eneche, P.S.; Abu Anyebe, D. Risk analysis and hot spots detection of SARS-CoV-2 in Nigeria using demographic and environmental variables: An early assessment of transmission dynamics. Int. J. Environ. Health Res. 2020, 32, 1111–1122. [Google Scholar] [CrossRef]
- Das, A.; Ghosh, S.; Das, K.; Basu, T.; Das, M.; Dutta, I. Modeling the effect of area deprivation on COVID-19 incidences: A study of Chennai megacity, India. Public Health 2020, 185, 266–269. [Google Scholar] [CrossRef]
- Das, A.; Ghosh, S.; Das, K.; Basu, T.; Dutta, I.; Das, M. Living environment matters: Unravelling the spatial clustering of COVID-19 hotspots in Kolkata megacity, India. Sustain. Cities Soc. 2020, 65, 102577. [Google Scholar] [CrossRef]
- Islam, A.; Sayeed, M.A.; Rahman, M.K.; Ferdous, J.; Shano, S.; Choudhury, S.D.; Hassan, M.M. Spatiotemporal patterns and trends of community transmission of the pandemic COVID-19 in South Asia: Bangladesh as a case study. Biosaf. Health 2021, 3, 39–49. [Google Scholar] [CrossRef]
- Lak, A.; Sharifi, A.; Badr, S.; Zali, A.; Maher, A.; Mostafavi, E.; Khalili, D. Spatio-temporal patterns of the COVID-19 pandemic, and place-based influential factors at the neighborhood scale in Tehran. Sustain. Cities Soc. 2021, 72, 103034. [Google Scholar] [CrossRef]
- Mylona, E.K.; Shehadeh, F.; Kalligeros, M.; Benitez, G.; Chan, P.A.; Mylonakis, E. Real-Time Spatiotemporal Analysis of Microepidemics of Influenza and COVID-19 Based on Hospital Network Data: Colocalization of Neighborhood-Level Hotspots. Am. J. Public Health 2020, 110, 1817–1824. [Google Scholar] [CrossRef]
- Nasiri, R.; Akbarpour, S.; Zali, A.R.; Khodakarami, N.; Boochani, M.H.; Noory, A.R.; Soori, H. Spatio-temporal analysis of COVID-19 incidence rate using GIS: A case study-Tehran metropolitan, Iran. GeoJournal 2021. [Google Scholar] [CrossRef]
- Park, Y.M.; Kearney, G.D.; Wall, B.; Jones, K.; Howard, R.J.; Hylock, R.H. COVID-19 Deaths in the United States: Shifts in Hot Spots over the Three Phases of the Pandemic and the Spatiotemporally Varying Impact of Pandemic Vulnerability. Int. J. Environ. Res. Public Health 2021, 18, 8987. [Google Scholar] [CrossRef] [PubMed]
- Pierce, J.B.; Harrington, K.; McCabe, M.E.; Petito, L.C.; Kershaw, K.N.; Pool, L.R.; Allen, N.B.; Khan, S.S. Racial/ethnic minority and neighborhood disadvantage leads to disproportionate mortality burden and years of potential life lost due to COVID-19 in Chicago, Illinois. Health Place 2021, 68, 102540. [Google Scholar] [CrossRef] [PubMed]
- Rahman, M.R.; Islam, A.H.M.H.; Islam, M.N. Geospatial modelling on the spread and dynamics of 154 day outbreak of the novel coronavirus (COVID-19) pandemic in Bangladesh towards vulnerability zoning and management approaches. Modeling Earth Syst. Environ. 2021, 7, 2059–2087. [Google Scholar] [CrossRef] [PubMed]
- Sugg, M.M.; Spaulding, T.J.; Lane, S.J.; Runkle, J.D.; Harden, S.R.; Hege, A.; Iyer, L.S. Mapping community-level determinants of COVID-19 transmission in nursing homes: A multi-scale approach. Sci. Total Environ. 2021, 752, 141946. [Google Scholar] [CrossRef]
- Paul, R.; Arif, A.A.; Adeyemi, O.; Ghosh, S.; Han, D. Progression of COVID-19 From Urban to Rural Areas in the United States: A Spatiotemporal Analysis of Prevalence Rates. J. Rural. Health 2020, 36, 591–601. [Google Scholar] [CrossRef]
- Andrade, L.A.; Gomes, D.S.; Lima, S.V.M.A.; Duque, A.M.; Melo, M.S.; Góes, M.A.O.; Ribeiro, C.J.N.; Peixoto, M.V.S.; Souza, C.D.F.; Santos, A.D. COVID-19 Mortality in an area of northeast brazil: Epidemiological characteristics and prospective spatiotemporal modeling. Epidemiol. Infect. 2020, 148, E288. [Google Scholar] [CrossRef]
- Andrade, L.A.; Gomes, D.S.; de Oliveira Góes, M.A.; de Souza, M.S.F.; Teixeira, D.C.P.; Ribeiro, C.J.N.; Alves, J.A.B.; de Araújo, K.C.G.M.; dos Santos, A.D. Surveillance of the first cases of COVID-19 in sergipe using a prospective spatiotemporal analysis: The spatial dispersion and its public health implications. Rev. Soc. Bras. Med. Trop. 2020. [Google Scholar] [CrossRef]
- Liu, S.; Qin, Y.; Xie, Z.; Zhang, J. The Spatio-Temporal Characteristics and Influencing Factors of Covid-19 Spread in Shenzhen, China-An Analysis Based on 417 Cases. Int. J. Environ. Res. Public Health 2020, 17, 7450. [Google Scholar] [CrossRef]
- Li, X.; Zhou, L.; Jia, T.; Peng, R.; Fu, X.; Zou, Y. Associating COVID-19 Severity with Urban Factors: A Case Study of Wuhan. Int. J. Environ. Res. Public Health 2020, 17, 6712. [Google Scholar] [CrossRef]
- Rex, F.E.; de Borges, C.A.S.; Käfer, P.S. Spatial analysis of the COVID-19 distribution pattern in São Paulo State, Brazil. Ciência Saúde Coletiva 2020, 25, 3377–3384. [Google Scholar] [CrossRef]
- Al Kindi, K.M.; Al-Mawali, A.; Akharusi, A.; Alshukaili, D.; Alnasiri, N.; Al-Awadhi, T.; Charabi, Y.; El Kenawy, A.M. Demographic and socioeconomic determinants of COVID-19 across Oman-A geospatial modelling approach. Geospat. Health 2021, 16. [Google Scholar] [CrossRef]
- Andersen, L.M.; Harden, S.R.; Sugg, M.M.; Runkle, J.D.; Lundquist, T.E. Analyzing the spatial determinants of local Covid-19 transmission in the United States. Sci. Total Environ. 2021, 754, 142396. [Google Scholar] [CrossRef]
- Benita, F.; Gasca-Sanchez, F. The main factors influencing COVID-19 spread and deaths in Mexico: A comparison between phases I and II. Appl. Geogr. 2021, 134, 102523. [Google Scholar] [CrossRef]
- Chakraborty, J. Social inequities in the distribution of COVID-19: An intra-categorical analysis of people with disabilities in the U.S. Disabil. Health J. 2021, 14, 101007. [Google Scholar] [CrossRef]
- Deguen, S.; Kihal-Talantikite, W. Geographical Pattern of COVID-19-Related Outcomes over the Pandemic Period in France: A Nationwide Socio-Environmental Study. Int. J. Environ. Res. Public Health 2021, 18, 1824. [Google Scholar] [CrossRef]
- Escobar, G.J.; Adams, A.S.; Liu, V.X.; Soltesz, L.; Chen, Y.F.I.; Parodi, S.M.; Ray, G.T.; Myers, L.C.; Ramaprasad, C.M.; Dlott, R.; et al. Racial Disparities in COVID-19 Testing and Outcomes: Retrospective Cohort Study in an Integrated Health System. Ann. Intern. Med. 2021, 174, 786–793. [Google Scholar] [CrossRef]
- Ladoy, A.; Opota, O.; Carron, P.N.; Guessous, I.; Vuilleumier, S.; Joost, S.; Greub, G. Size and duration of COVID-19 clusters go along with a high SARS-CoV-2 viral load: A spatio-temporal investigation in Vaud state, Switzerland. Sci. Total Environ. 2021, 787, 147483. [Google Scholar] [CrossRef]
- Ullah, S.; Nor, N.H.M.; Daud, H.; Zainuddin, N.; Gandapur, M.S.J.; Ali, I.; Khalil, A. Spatial cluster analysis of COVID-19 in Malaysia (Mar-Sep, 2020). Geospat. Health 2021, 16. [Google Scholar] [CrossRef]
- Ballesteros, P.; Salazar, E.; Sánchez, D.; Bolanos, C. Spatial and spatiotemporal clustering of the COVID-19 pandemic in Ecuador. Revista de la Facultad de Medicina 2020, 69. [Google Scholar] [CrossRef]
- Xu, M.; Cao, C.; Zhang, X.; Lin, H.; Yao, Z.; Zhong, S.; Huang, Z.; Shea Duerler, R. Fine-Scale Space-Time Cluster Detection of COVID-19 in Mainland China Using Retrospective Analysis. Int. J. Environ. Res. Public Health 2021, 18, 3583. [Google Scholar] [CrossRef]
- Desjardins, M.R.; Hohl, A.; Delmelle, E.M. Rapid surveillance of COVID-19 in the United States using a prospective space-time scan statistic: Detecting and evaluating emerging clusters. Appl. Geogr. 2020, 118, 10202. [Google Scholar] [CrossRef]
- Hohl, A.; Delmelle, E.M.; Desjardins, M.R.; Lan, Y. Daily surveillance of COVID-19 using the prospective space-time scan statistic in the United States. Spat. Spatio-Temporal Epidemiol. 2020, 34, 100354. [Google Scholar] [CrossRef]
- Huang, Q.; Jackson, S.; Derakhshan, S.; Lee, L.; Pham, E.; Jackson, A.; Cutter, S.L. Urban-rural differences in COVID-19 exposures and outcomes in the South: A preliminary analysis of South Carolina. PLoS ONE 2021, 16, e0246548. [Google Scholar] [CrossRef]
- Lebel, G.; Fortin, É.; Lo, E.; Boivin, M.-C.; Tandonnet, M.; Gravel, N. Detection of COVID-19 case clusters in Québec, May–October 2020. Can. J. Public Health 2021, 112, 807–817. [Google Scholar] [CrossRef]
- Martines, M.R.; Ferreira, R.V.; Toppa, R.H.; Assunção, L.M.; Desjardins, M.R.; Delmelle, E.M. Detecting space–time clusters of COVID-19 in Brazil: Mortality, inequality, socioeconomic vulnerability, and the relative risk of the disease in Brazilian municipalities. J. Geogr. Syst. 2021, 23, 7–36. [Google Scholar] [CrossRef]
- Masrur, A.; Yu, M.; Luo, W.; Dewan, A. Space-time patterns, change, and propagation of covid-19 risk relative to the intervention scenarios in bangladesh. Int. J. Environ. Res. Public Health 2020, 17, 5911. [Google Scholar] [CrossRef]
- Moniz, M.; Soares, P.; Nunes, C. COVID-19 Transmission Dynamics: A Space-and-Time Approach. PJP 2020, 38, 4–10. [Google Scholar] [CrossRef]
- Qi, C.; Zhu, Y.C.; Li, C.Y.; Hu, Y.C.; Liu, L.L.; Zhang, D.D.; Wang, X.; She, K.L.; Jia, Y.; Liu, T.X.; et al. Epidemiological characteristics and spatial-temporal analysis of COVID-19 in Shandong Province, China. Epidemiol. Infect. 2020, 148. [Google Scholar] [CrossRef]
- Rosillo, N.; Del-Águila-Mejía, J.; Rojas-Benedicto, A.; Guerrero-Vadillo, M.; Peñuelas, M.; Mazagatos, C.; Segú-Tell, J.; Ramis, R.; Gómez-Barroso, D. Real time surveillance of COVID-19 space and time clusters during the summer 2020 in Spain. BMC Public Health 2021, 21, 961. [Google Scholar] [CrossRef]
- Tyrovolas, S.; Giné-Vázquez, I.; Fernández, D.; Morena, M.; Koyanagi, A.; Janko, M.; Haro, J.M.; Lin, Y.; Lee, P.; Pan, W.; et al. Estimating the COVID-19 Spread Through Real-time Population Mobility Patterns: Surveillance in Low- and Middle-Income Countries. J. Med. Internet Res. 2021, 23, e22999. [Google Scholar] [CrossRef]
- Wang, Y.; Liu, Y.; Struthers, J.; Lian, M. Spatiotemporal Characteristics of the COVID-19 Epidemic in the United States. Clin. Infect. Dis. 2020, 72, 643–651. [Google Scholar] [CrossRef]
- Xu, F.; Beard, K. A comparison of prospective space-time scan statistics and spatiotemporal event sequence based clustering for COVID-19 surveillance. PLoS ONE 2021, 16, e0252990. [Google Scholar] [CrossRef]
- Zhang, J.; Wu, X.; Chow, T.E. Space-Time Cluster’s Detection and Geographical Weighted Regression Analysis of COVID-19 Mortality on Texas Counties. Int. J. Environ. Res. Public Health 2021, 18, 5541. [Google Scholar] [CrossRef]
- Maiti, A.; Zhang, Q.; Sannigrahi, S.; Pramanik, S.; Chakraborti, S.; Cerda, A.; Pilla, F. Exploring spatiotemporal effects of the driving factors on COVID-19 incidences in the contiguous United States. Sustain. Cities Soc. 2021, 68, 102784. [Google Scholar] [CrossRef]
- Sun, F.; Matthews, S.A.; Yang, T.C.; Hu, M.H. A spatial analysis of the COVID-19 period prevalence in U.S. counties through June 28, 2020: Where geography matters? Ann. Epidemiol. 2020, 52, 54–59. [Google Scholar] [CrossRef]
- Mansour, S.; Al Kindi, A.; Al-Said, A.; Al-Said, A.; Atkinson, P. Sociodemographic determinants of COVID-19 incidence rates in Oman: Geospatial modelling using multiscale geographically weighted regression (MGWR). Sustain. Cities Soc. 2021, 65, 102627. [Google Scholar] [CrossRef]
- Mollalo, A.; Vahedi, B.; Rivera, K.M. GIS-based spatial modeling of COVID-19 incidence rate in the continental United States. Sci. Total Environ. 2020, 728, 138884. [Google Scholar] [CrossRef]
- Rahman, M.d.H.; Zafri, N.M.; Ashik, F.R.; Waliullah, M.; Khan, A. Identification of risk factors contributing to COVID-19 incidence rates in Bangladesh: A GIS-based spatial modeling approach. Heliyon 2021, 7, e06260. [Google Scholar] [CrossRef]
- Urban, R.C.; Nakada, L.Y.K. GIS-based spatial modelling of COVID-19 death incidence in São Paulo, Brazil. Environ. Urban. 2021, 33, 229–238. [Google Scholar] [CrossRef]
- van Holm, E.J.; Wyczalkowski, C.K.; Dantzler, P.A. Neighborhood conditions and the initial outbreak of COVID-19: The case of Louisiana. J. Public Health 2021, 43, 219–224. [Google Scholar] [CrossRef]
- You, H.; Wu, X.; Guo, X. Distribution of covid-19 morbidity rate in association with social and economic factors in wuhan, china: Implications for urban development. Int. J. Environ. Res. Public Health 2020, 17, 3417. [Google Scholar] [CrossRef]
- Feinhandler, I.; Cilento, B.; Beauvais, B.; Harrop, J.; Fulton, L. Predictors of Death Rate during the COVID-19 Pandemic. Healthcare 2020, 8, 339. [Google Scholar] [CrossRef]
- Karaye, I.M.; Horney, J.A. The Impact of Social Vulnerability on COVID-19 in the U.S.: An Analysis of Spatially Varying Relationships. Am. J. Prev. Med. 2020, 59, 317–325. [Google Scholar] [CrossRef]
- Oluyomi, A.O.; Gunter, S.M.; Leining, L.M.; Murray, K.O.; Amos, C. COVID-19 Community Incidence and Associated Neighborhood-Level Characteristics in Houston, Texas, USA. Int. J. Environ. Res. Public Health 2021, 18, 1495. [Google Scholar] [CrossRef]
- Chen, Y.; Chen, M.; Huang, B.; Wu, C.; Shi, W. Modeling the Spatiotemporal Association Between COVID-19 Transmission and Population Mobility Using Geographically and Temporally Weighted Regression. GeoHealth 2021, 5, e2021GH000402. [Google Scholar] [CrossRef]
- Hassan, M.; Bhuiyan, M.A.H.; Tareq, F.; Bodrud-Doza, M.; Tanu, S.M.; Rabbani, K.A. Relationship between COVID-19 infection rates and air pollution, geo-meteorological, and social parameters. Environ. Monit. Assess. 2021, 193, 29. [Google Scholar] [CrossRef]
- Liu, C.; Liu, Z.; Guan, C. The impacts of the built environment on the incidence rate of COVID-19: A case study of King County, Washington. Sustain. Cities Soc. 2021, 74, 103144. [Google Scholar] [CrossRef]
- Middya, A.I.; Roy, S. Geographically varying relationships of COVID-19 mortality with different factors in India. Sci. Rep. 2021, 11, 7890. [Google Scholar] [CrossRef]
- Razavi-Termeh, S.V.; Sadeghi-Niaraki, A.; Choi, S.-M. Coronavirus disease vulnerability map using a geographic information system (GIS) from 16 April to 16 May 2020. Phys. Chem. Earth Parts A B C 2021, 126, 103043. [Google Scholar] [CrossRef]
- Troppy, S.; Wilt, G.E.; Whiteman, A.; Hallisey, E.; Crockett, M.; Sharpe, J.D.; Haney, G.; Cranston, K.; Klevens, R.M. Geographic Associations Between Social Factors and SARS-CoV-2 Testing Early in the COVID-19 Pandemic, February-June 2020, Massachusetts. Public Health Rep. 2021, 136, 765–773. [Google Scholar] [CrossRef]
- Yellow Horse, A.J.; Yang, T.-C.; Huyser, K.R. Structural Inequalities Established the Architecture for COVID-19 Pandemic Among Native Americans in Arizona: A Geographically Weighted Regression Perspective. J. Racial Ethn. Health Disparities 2022, 9, 165–175. [Google Scholar] [CrossRef]
- Zhang, H.; Liu, Y.; Chen, F.; Mi, B.; Zeng, L.; Pei, L. The effect of sociodemographic factors on COVID-19 incidence of 342 cities in China: A geographically weighted regression model analysis. BMC Infect. Dis. 2021, 21, 428. [Google Scholar] [CrossRef]
- Wang, L.; Xu, C.; Wang, J.; Qiao, J.; Yan, M.; Zhu, Q. Spatiotemporal heterogeneity and its determinants of COVID-19 transmission in typical labor export provinces of China. BMC Infect. Dis. 2021, 21, 242. [Google Scholar] [CrossRef]
- Wu, X.; Yin, J.; Li, C.; Xiang, H.; Lv, M.; Guo, Z. Natural and human environment interactively drive spread pattern of COVID-19: A city-level modeling study in China. Sci. Total Environ. 2020, 756, 143343. [Google Scholar] [CrossRef]
- Chien, L.-C.; Chen, L.-W.A.; Lin, R.-T. Lagged meteorological impacts on COVID-19 incidence among high-risk counties in the United States—A spatiotemporal analysis. J. Expo. Sci. Environ. Epidemiol. 2021. [Google Scholar] [CrossRef]
- Feng, C. Spatial-temporal generalized additive model for modeling COVID-19 mortality risk in Toronto, Canada. Spat. Stat. 2021, 49, 100526. [Google Scholar] [CrossRef]
- Ramírez, I.J.; Lee, J. COVID-19 Emergence and Social and Health Determinants in Colorado: A Rapid Spatial Analysis. Int. J. Environ. Res. Public Health 2020, 17, 3856. [Google Scholar] [CrossRef]
- Arif, M.; Sengupta, S. Nexus between population density and novel coronavirus (COVID-19) pandemic in the south Indian states: A geo-statistical approach. Environ. Dev. Sustain. 2021, 23, 10246–10274. [Google Scholar] [CrossRef]
- de Lima, E.E.C.; Gayawan, E.; Baptista, E.A.; Queiroz, B.L. Spatial pattern of COVID-19 deaths and infections in small areas of Brazil. PLoS ONE 2021, 16, e0246808. [Google Scholar]
- DiMaggio, C.; Klein, M.; Berry, C.; Frangos, S. Black/African American Communities are at highest risk of COVID-19: Spatial modeling of New York City ZIP Code–level testing results. Ann. Epidemiol. 2020, 51, 7–13. [Google Scholar] [CrossRef]
- Whittle, R.S.; Diaz-Artiles, A. An ecological study of socioeconomic predictors in detection of COVID-19 cases across neighborhoods in New York City. BMC Med. 2020, 18, 271. [Google Scholar] [CrossRef]
- Millett, G.A.; Jones, A.T.; Benkeser, D.; Baral, S.; Mercer, L.; Beyrer, C.; Honermann, B.; Lankiewicz, E.; Mena, L.; Crowley, J.S.; et al. Assessing differential impacts of COVID-19 on black communities. Ann. Epidemiol. 2020, 47, 37–44. [Google Scholar] [CrossRef]
- Yang, T.-C.; Kim, S.; Zhao, Y.; Choi, S.-W.E. Examining spatial inequality in COVID-19 positivity rates across New York City ZIP codes. Health Place 2021, 69, 102574. [Google Scholar] [CrossRef]
- Bermudi, P.M.M.; Lorenz, C.; Aguiar BS de Failla, M.A.; Barrozo, L.V.; Chiaravalloti-Neto, F. Spatiotemporal ecological study of COVID-19 mortality in the city of São Paulo, Brazil: Shifting of the high mortality risk from areas with the best to those with the worst socio-economic conditions. Travel Med. Infect. Dis. 2021, 39, 101945. [Google Scholar] [CrossRef]
- Blangiardo, M.; Cameletti, M.; Pirani, M.; Corsetti, G.; Battaglini, M.; Baio, G. Estimating weekly excess mortality at sub-national level in Italy during the COVID-19 pandemic. PLoS ONE 2020, 15, e0240286. [Google Scholar] [CrossRef]
- Briz-Redón, Á.; Iftimi, A.; Correcher, J.F.; De Andrés, J.; Lozano, M.; Romero-García, C. A comparison of multiple neighborhood matrix specifications for spatio-temporal model fitting: A case study on COVID-19 data. Stoch. Environ. Res. Risk Assess. 2022, 36, 271–282. [Google Scholar] [CrossRef]
- Jalilian, A.; Mateu, J. A hierarchical spatio-temporal model to analyze relative risk variations of COVID-19: A focus on Spain, Italy and Germany. Stoch. Environ. Res. Risk Assess. 2021, 35, 797–812. [Google Scholar] [CrossRef]
- Jaya, I.G.N.M.; Folmer, H. Bayesian spatiotemporal forecasting and mapping of COVID-19 risk with application to West Java Province, Indonesia. J. Reg. Sci. 2021, 61, 849–881. [Google Scholar] [CrossRef]
- Johnson, D.P.; Ravi, N.; Braneon, C.V. Spatiotemporal Associations Between Social Vulnerability, Environmental Measurements, and COVID-19 in the Conterminous United States. GeoHealth 2021, 5, e2021GH000423. [Google Scholar] [CrossRef]
- Ngwira, A.; Kumwenda, F.; Munthali, E.C.S.; Nkolokosa, D. Spatial temporal distribution of COVID-19 risk during the early phase of the pandemic in Malawi. PeerJ 2021, 9, e11003. [Google Scholar] [CrossRef]
- Paul, R.; Adeyemi, O.; Ghosh, S.; Pokhrel, K.; Arif, A.A. Dynamics of Covid-19 mortality and social determinants of health: A spatiotemporal analysis of exceedance probabilities. Ann. Epidemiol. 2021, 62, 51–58. [Google Scholar] [CrossRef] [PubMed]
- Rawat, S.; Deb, S. A spatio-temporal statistical model to analyze COVID-19 spread in the USA. J. Appl. Stat. 2021. [Google Scholar] [CrossRef]
- Gayawan, E.; Awe, O.O.; Oseni, B.M.; Uzochukwu, I.C.; Adekunle, A.; Samuel, G.; Eisen, D.P.; Adegboye, O.A. The spatio-temporal epidemic dynamics of COVID-19 outbreak in Africa. Epidemiol. Infect. 2020, 148, e212. [Google Scholar] [CrossRef]
- Olmo, J.; Sanso-Navarro, M. Modeling the spread of COVID-19 in New York City. Pap. Reg. Sci. 2021, 100, 1209–1229. [Google Scholar] [CrossRef]
- Lam, N.S.-N. Spatial Interpolation Methods: A Review. Am. Cartogr. 1983, 10, 129–150. [Google Scholar] [CrossRef]
- Maritz, J.S.; Lwin, T. (Eds.) Empirical Bayes Methods, 2nd ed.; Chapman and Hall/CRC: New York, NY, USA, 2017. [Google Scholar]
- Besag, J.; York, J.; Mollié, A. Bayesian image restoration, with two applications in spatial statistics. Ann. Inst. Stat. Math. 1991, 43, 1–20. [Google Scholar] [CrossRef]
- Morris, M.; Wheeler-Martin, K.; Simpson, D.; Mooney, S.J.; Gelman, A.; DiMaggio, C. Bayesian hierarchical spatial models: Implementing the Besag York Mollié model in stan. Spat. Spatio-Temporal Epidemiol. 2019, 31, 100301. [Google Scholar] [CrossRef]
- Riebler, A.; Sørbye, S.H.; Simpson, D.; Rue, H. An intuitive Bayesian spatial model for disease mapping that accounts for scaling. Stat. Methods Med. Res. 2016, 25, 1145–1165. [Google Scholar] [CrossRef] [Green Version]
- Fahrmeir, L.; Lang, S. Bayesian inference for generalized additive mixed models based on Markov random field priors. J. R. Stat. Soc. Ser. C (Appl. Stat.) 2001, 50, 201–220. [Google Scholar] [CrossRef]
- Haining, R.; Li, G. Modelling Spatial and Spatial-Temporal Data: A Bayesian Approach, 1st ed.; CRC Press: Boca Raton, FL, USA, 2020. [Google Scholar]
- Knorr-Held, L. Bayesian modelling of inseparable space-time variation in disease risk. Stat. Med. 2000, 19, 2555–2567. [Google Scholar] [CrossRef] [Green Version]
- Leroux, B.G.; Lei, X.; Breslow, N. Estimation of Disease Rates in Small Areas: A new Mixed Model for Spatial Dependence. In Statistical Models in Epidemiology, the Environment, and Clinical Trials; Halloran, M.E., Berry, D., Eds.; Springer: New York, NY, USA, 2000; pp. 179–191. [Google Scholar]
- Raftery, A.E.; Madigan, D.; Hoeting, J.A. Bayesian Model Averaging for Linear Regression Models. J. Am. Stat. Assoc. 1997, 92, 179–191. [Google Scholar] [CrossRef]
- Anselin, L. Spatial externalities, spatial multipliers, and spatial econometrics. Int. Reg. Sci. Rev. 2003, 26, 153–166. [Google Scholar] [CrossRef]
- Spiegelhalter, D.J.; Best, N.G.; Carlin, B.P.; Van Der Linde, A. Bayesian measures of model complexity and fit. J. R. Stat. Soc. Ser. B Stat. Methodol. 2002, 64, 583–639. [Google Scholar] [CrossRef] [Green Version]
- Watanabe, S. Equations of states in singular statistical estimation. Neural Netw. 2010, 23, 20–34. [Google Scholar] [CrossRef] [PubMed] [Green Version]
- Moraga, P. Chapter 3 Bayesian inference and INLA. In Geospatial Health Data: Modeling and Visualization with R-INLA and Shiny; CRC Press: Boca Raton, FL, USA, 2019. [Google Scholar]
- Depaoli, S.; Yang, Y.; Felt, J. Using Bayesian Statistics to Model Uncertainty in Mixture Models: A Sensitivity Analysis of Priors. Struct. Equ. Modeling A Multidiscip. J. 2017, 24, 198–215. [Google Scholar] [CrossRef]
- Yin, H.; Liu, Z.; Kammen, D.M. Impacts of Early Interventions on the Age-Specific Incidence of COVID-19 in New York, Los Angeles, Daegu and Nairobi. medRxiv 2020. [Google Scholar] [CrossRef] [Green Version]
- Cressie, N.; Calder, C.A.; Clark, J.S.; Hoef, J.M.V.; Wikle, C.K. Accounting for uncertainty in ecological analysis: The strengths and limitations of hierarchical statistical modeling. Ecol. Appl. 2009, 19, 553–570. [Google Scholar] [CrossRef]
- Lau, H.; Khosrawipour, T.; Kocbach, P.; Ichii, H.; Bania, J.; Khosrawipour, V. Evaluating the massive underreporting and undertesting of COVID-19 cases in multiple global epicenters. Pulmonology 2021, 27, 110–115. [Google Scholar] [CrossRef]
- Wu, L. Mixed Effects Models for Complex Data; Chapman and Hall/CRC: New York, NY, USA, 2009. [Google Scholar]
- Best, N.; Richardson, S.; Thomson, A. A comparison of Bayesian spatial models for disease mapping. Stat. Methods Med. Res. 2005, 14, 35–59. [Google Scholar] [CrossRef]
- Duncan, E.W.; Mengersen, K.L. Comparing Bayesian spatial models: Goodness-of-smoothing criteria for assessing under- and over-smoothing. PLoS ONE 2020, 15, e0233019. [Google Scholar] [CrossRef]
- Blangiardo, M.; Cameletti, M.; Baio, G.; Rue, H. Spatial and spatio-temporal models with R-INLA. Spat. Spatio-Temporal Epidemiol. 2013, 4, 33–49. [Google Scholar] [CrossRef] [PubMed] [Green Version]
- Carroll, R.; Lawson, A.B.; Faes, C.; Kirby, R.S.; Aregay, M.; Watjou, K. Comparing INLA and OpenBUGS for hierarchical Poisson modeling in disease mapping. Spat. Spatio-Temporal Epidemiol. 2015, 14–15, 45–54. [Google Scholar] [CrossRef] [PubMed] [Green Version]

| Method Category | Method Name | No. of Articles N (%) | References |
|---|---|---|---|
| Frequentist Methods | |||
| Spatial Clustering | Global Moran’s I | 49 (31.8%) | [32,33,34,35,36,37,38,39,40,41,42,43,44,45,46,47,48,49,50,51,52,53,54,55,56,57,58,59,60,61,62,63,64,65,66,67,68,69,70,71,72,73,74,75,76,77,78,79,80] |
| Local Moran’s I (LISA) | 46 (29.8%) | [5,32,34,36,38,40,41,44,54,55,61,62,64,65,66,67,68,69,70,72,73,74,75,76,77,78,79,81,82,83,84,85,86,87,88,89,90,91,92,93,94,95,96,97,98,99] | |
| Average Nearest Neighbor (ANN) | 2 (1.3%) | [54,80] | |
| Getis-Ord GI*statistic | 36 (23.3%) | [5,29,33,35,41,46,48,49,54,55,56,58,59,60,61,67,69,74,76,77,80,84,88,100,101,102,103,104,105,106,107,108,109,110,111,112] | |
| Kernel Density Estimation | 9 (5.8%) | [29,31,88,92,113,114,115,116,117] | |
| K-means Cluster | 2 (1.3%) | [57,118] | |
| Ripley’s K function | 1 (0.6%) | [72] | |
| Kulldorff’s spatial scan statistic | 10 (6.5%) | [39,42,67,119,120,121,122,123,124,125] | |
| Spatiotemporal Clustering | Kulldorff’s space-time scan statistic | 24 (15.5%) | [4,5,31,40,44,52,59,92,100,126,127,128,129,130,131,132,133,134,135,136,137,138,139,140] |
| MST-DBSCAN | 1 (0.6%) | [124] | |
| Spatiotemporal event sequence-based clustering | 1 (0.6%) | [139] | |
| Spatial Regression | Spatial Regression Models (SEM/SLM) | 20 (13%) | [45,51,53,65,76,87,91,94,95,119,132,141,142,143,144,145,146,147,148,149] |
| Geographically Weighted Regression | 36 (23.3%) | [5,38,47,49,56,58,62,71,72,76,79,80,86,87,90,98,99,105,108,116,118,140,141,143,144,146,150,151,152,153,154,155,156,157,158,159] | |
| Geodetector Q statistic | 4 (2.6%) | [66,68,160,161] | |
| Spatial Statistical Modeling | Spatial autoregressive (SAR) | 1 (0.6%) | [64] |
| GLM Regression model | 1 (0.6%) | [118] | |
| Spatiotemporal Statistical Modeling | Poisson-based Distributed lagged nonlinear model with a spatial function | 1 (0.6%) | [162] |
| Generalized additive model | 2 (1.3%) | [43,163] | |
| Spatial Interpolation | Areal Interpolation | 1 (0.6%) | [151] |
| Inverse distance weighting (IDW) | 2 (1.3%) | [107,164] | |
| Thiessen Polygon method | 1 (0.6%) | [165] | |
| Bayesian Methods | |||
| Spatial Interpolation | Local empirical Bayesian Smoothing | 6 (3.9%) | [38,62,78,83,94,113] |
| Spatial Statistical Modeling | GLMM Spatial models | 5 (3.2%) | [166,167,168,169,170] |
| Spatiotemporal Statistical Modeling | GLMM spatiotemporal models | 11 (7.1%) | [112,160,171,172,173,174,175,176,177,178,179] |
| Geo-additive hurdle Poisson spatiotemporal model | 1 (0.6%) | [180] | |
| Bayesian Model Averaging | 1 (0.6%) | [181] | |
| Reference | Model | Space | Time | Space-Time | Model Validation | Bayesian Inference |
|---|---|---|---|---|---|---|
| Bermudi et al., 2021 [171] | Poisson latent Gaussian Bayesian model | BYM | RW (1) | Space-time interaction term | DIC | INLA |
| Blangiardo et al., 2020 [172] | Poisson Bayesian hierarchical model | BYM | RW (1), RW (2) | __ | __ | INLA |
| Briz-Redón et al., 2022 [173] | Poisson based Bayesian hierarchical model | BYM | RW (2) | Space-time interaction term | DIC and WAIC | INLA |
| Lima et al., 2021 [166] | Poisson Bayesian SAM | BYM | __ | __ | DIC and WAIC | INLA |
| DiMaggio et al., 2020 [167] | Poisson Bayesian hierarchical model | BYM | __ | __ | DIC | INLA |
| Gayawan et al., 2020 [180] | Geo-additive hurdle Poisson model | BYM | P-spline | Space-time interaction term | DIC | MCMC |
| Jalilian et al., 2021 [174] | Poisson Bayesian hierarchical model | BYM | RW (2) | __ | DIC, WAIC and BCV | INLA |
| Jaya et al., 2021 [175] | Poisson Bayesian hierarchical model | Leroux CAR | RW (1), RW (2) | Space-time interaction term | DIC and WAIC | INLA |
| Johnson et al., 2021 [176] | Poisson Bayesian hierarchical model | BYM | RW (1) | Space-time interaction term | DIC | INLA |
| Ngwira et al., 2021 [177] | Poisson Space-time inseperable model | BYM | RW (1), RW (2) | Space-time interaction term | DIC | INLA |
| Olmo et al., 2021 [181] | Bayesian Model Averaging | Autoregressive lagged spatial terms | Autoregressive lagged terms | __ | HPM and BPM | MCMC |
| Paul et al., 2021 [178] | Bayesian semi-parametric spatiotemporal Negative Binomial model | ICAR | RW (1) | With zero-mean Gaussian distribution | WAIC | INLA |
| Paul et al., 2020 [112] | Bayesian Spatiotemporal Model | __ | __ | Latent Gaussian | __ | MCMC |
| Rawat et al., 2021 [179] | Bayesian separable Gaussian spatiotemporal model | Exponentially decaying pattern | Exponentially decaying pattern | Gaussian process with zero mean | MAPE, RMSE, CRPS | INLA |
| Wang et al., 2021 [160] | Poisson Bayesian hierarchical model | Spatial term | Gaussian noise | Space-time interaction effect | __ | MCMC |
| Whittle et al., 2020 [168] | Poisson Bayesian hierarchical model | BYM2 | __ | __ | DIC | INLA |
| Millett et al., 2020 [169] | Zero-inflated negative binomial model | BYM | __ | __ | __ | INLA |
| Yang et al., 2021 [170] | Bayesian negative binomial hierarchical model | BYM | __ | __ | DIC | INLA |
| Indicator | Risk Factors | No. of Studies (+,− Association) | References | Risk Factors | No. of Studies (+,− Association) | References |
|---|---|---|---|---|---|---|
| Demographic | %Asian | 3 (2,1) | [45,64,142] | Aging population | 21 (15,6) | [42,43,45,47,90,94,105,108,116,118,143,147,148,151,155,156,157,170,176,177,181] |
| %Black | 12 (12,0) | [45,51,64,108,112,119,142,149,151,168,169,178] | Middle Age population | 2 (2,0) | [112,140] | |
| %Black female | 1 (1,0) | [144] | Young population | 1 (1,0) | [168] | |
| %Disabled population | 1 (1,0) | [119] | BIPOC | 1 (1, 0) | [49] | |
| %Hispanic | 3 (3,0) | [51,142,149] | Ethnic minority | 2 (2,0) | [147,170] | |
| %Native American | 3 (3,0) | [142,149,158] | Immigrants | 2 (2,0) | [42,118] | |
| %Urban population | 1 (1,0) | [145] | English proficiency | 2 (2,0) | [119,157] | |
| % White | 1 (0,1) | [168] | Migration | 2 (1,1) | [141,152] | |
| %Non-White | 1 (1,0) | [176] | Population density | 22 (22,0) | [5,38,42,47,53,65,80,86,91,95,98,105,118,142,143,146,148,149,153,156,160,168] | |
| Population size | 2 (2,0) | [37,118,155,181] | Immigrants | 1 (1,0) | [151] | |
| Ethnic minority | 3 (3,0) | [141,150,154] | Lower Education | 1 (1,0) | [176] | |
| Socioeconomic | Deprivation Index | 2 (2,0) | [53,151] | Income | 9 (5,4) | [38,71,76,140,141,144,154,168,181] |
| GDP | 3 (1,2) | [148,159,160] | Poor housing | 4 (2,2) | [51,150,158,176] | |
| GINI Index | 2 (2,0) | [62,132] | Poverty level | 4 (1,3) | [47,147,153,177] | |
| Health expenditures | 1 (1,0) | [47] | Social Vulnerability Index | 2 (2,0) | [65,87] | |
| Higher education | 3 (0,3) | [151,155,178] | Spatial interaction index | 1 (1,0) | [118] | |
| Unemployment rate | 4 (4,0) | [64,71,149,178] | Total purchase power index | 1 (1,0) | [118] | |
| Climatic | Precipitation | 3 (2,1) | [58,162,176] | Water vapor | 1 (0,1) | [153] |
| Relative humidity | 3 (2,1) | [58,64,162] | Wind pressure | 1 (1,0) | [153] | |
| Rainfall | 1 (1,0) | [153] | Wind speed | 3 (2,1) | [56,58,153] | |
| Temperature | 5 (3,2) | [56,94,161,162,176] | LST | 2 (1,1) | [153,176] |
Publisher’s Note: MDPI stays neutral with regard to jurisdictional claims in published maps and institutional affiliations. |
© 2022 by the authors. Licensee MDPI, Basel, Switzerland. This article is an open access article distributed under the terms and conditions of the Creative Commons Attribution (CC BY) license (https://creativecommons.org/licenses/by/4.0/).
Share and Cite
Nazia, N.; Butt, Z.A.; Bedard, M.L.; Tang, W.-C.; Sehar, H.; Law, J. Methods Used in the Spatial and Spatiotemporal Analysis of COVID-19 Epidemiology: A Systematic Review. Int. J. Environ. Res. Public Health 2022, 19, 8267. https://doi.org/10.3390/ijerph19148267
Nazia N, Butt ZA, Bedard ML, Tang W-C, Sehar H, Law J. Methods Used in the Spatial and Spatiotemporal Analysis of COVID-19 Epidemiology: A Systematic Review. International Journal of Environmental Research and Public Health. 2022; 19(14):8267. https://doi.org/10.3390/ijerph19148267
Chicago/Turabian StyleNazia, Nushrat, Zahid Ahmad Butt, Melanie Lyn Bedard, Wang-Choi Tang, Hibah Sehar, and Jane Law. 2022. "Methods Used in the Spatial and Spatiotemporal Analysis of COVID-19 Epidemiology: A Systematic Review" International Journal of Environmental Research and Public Health 19, no. 14: 8267. https://doi.org/10.3390/ijerph19148267