
The Considerable Water Evaporation Induced by Human Perspiration and Respiration in Megacities: Quantifying Method and Case Study in Beijing


Abstract
:1. Introduction
2. Study Area and Methods
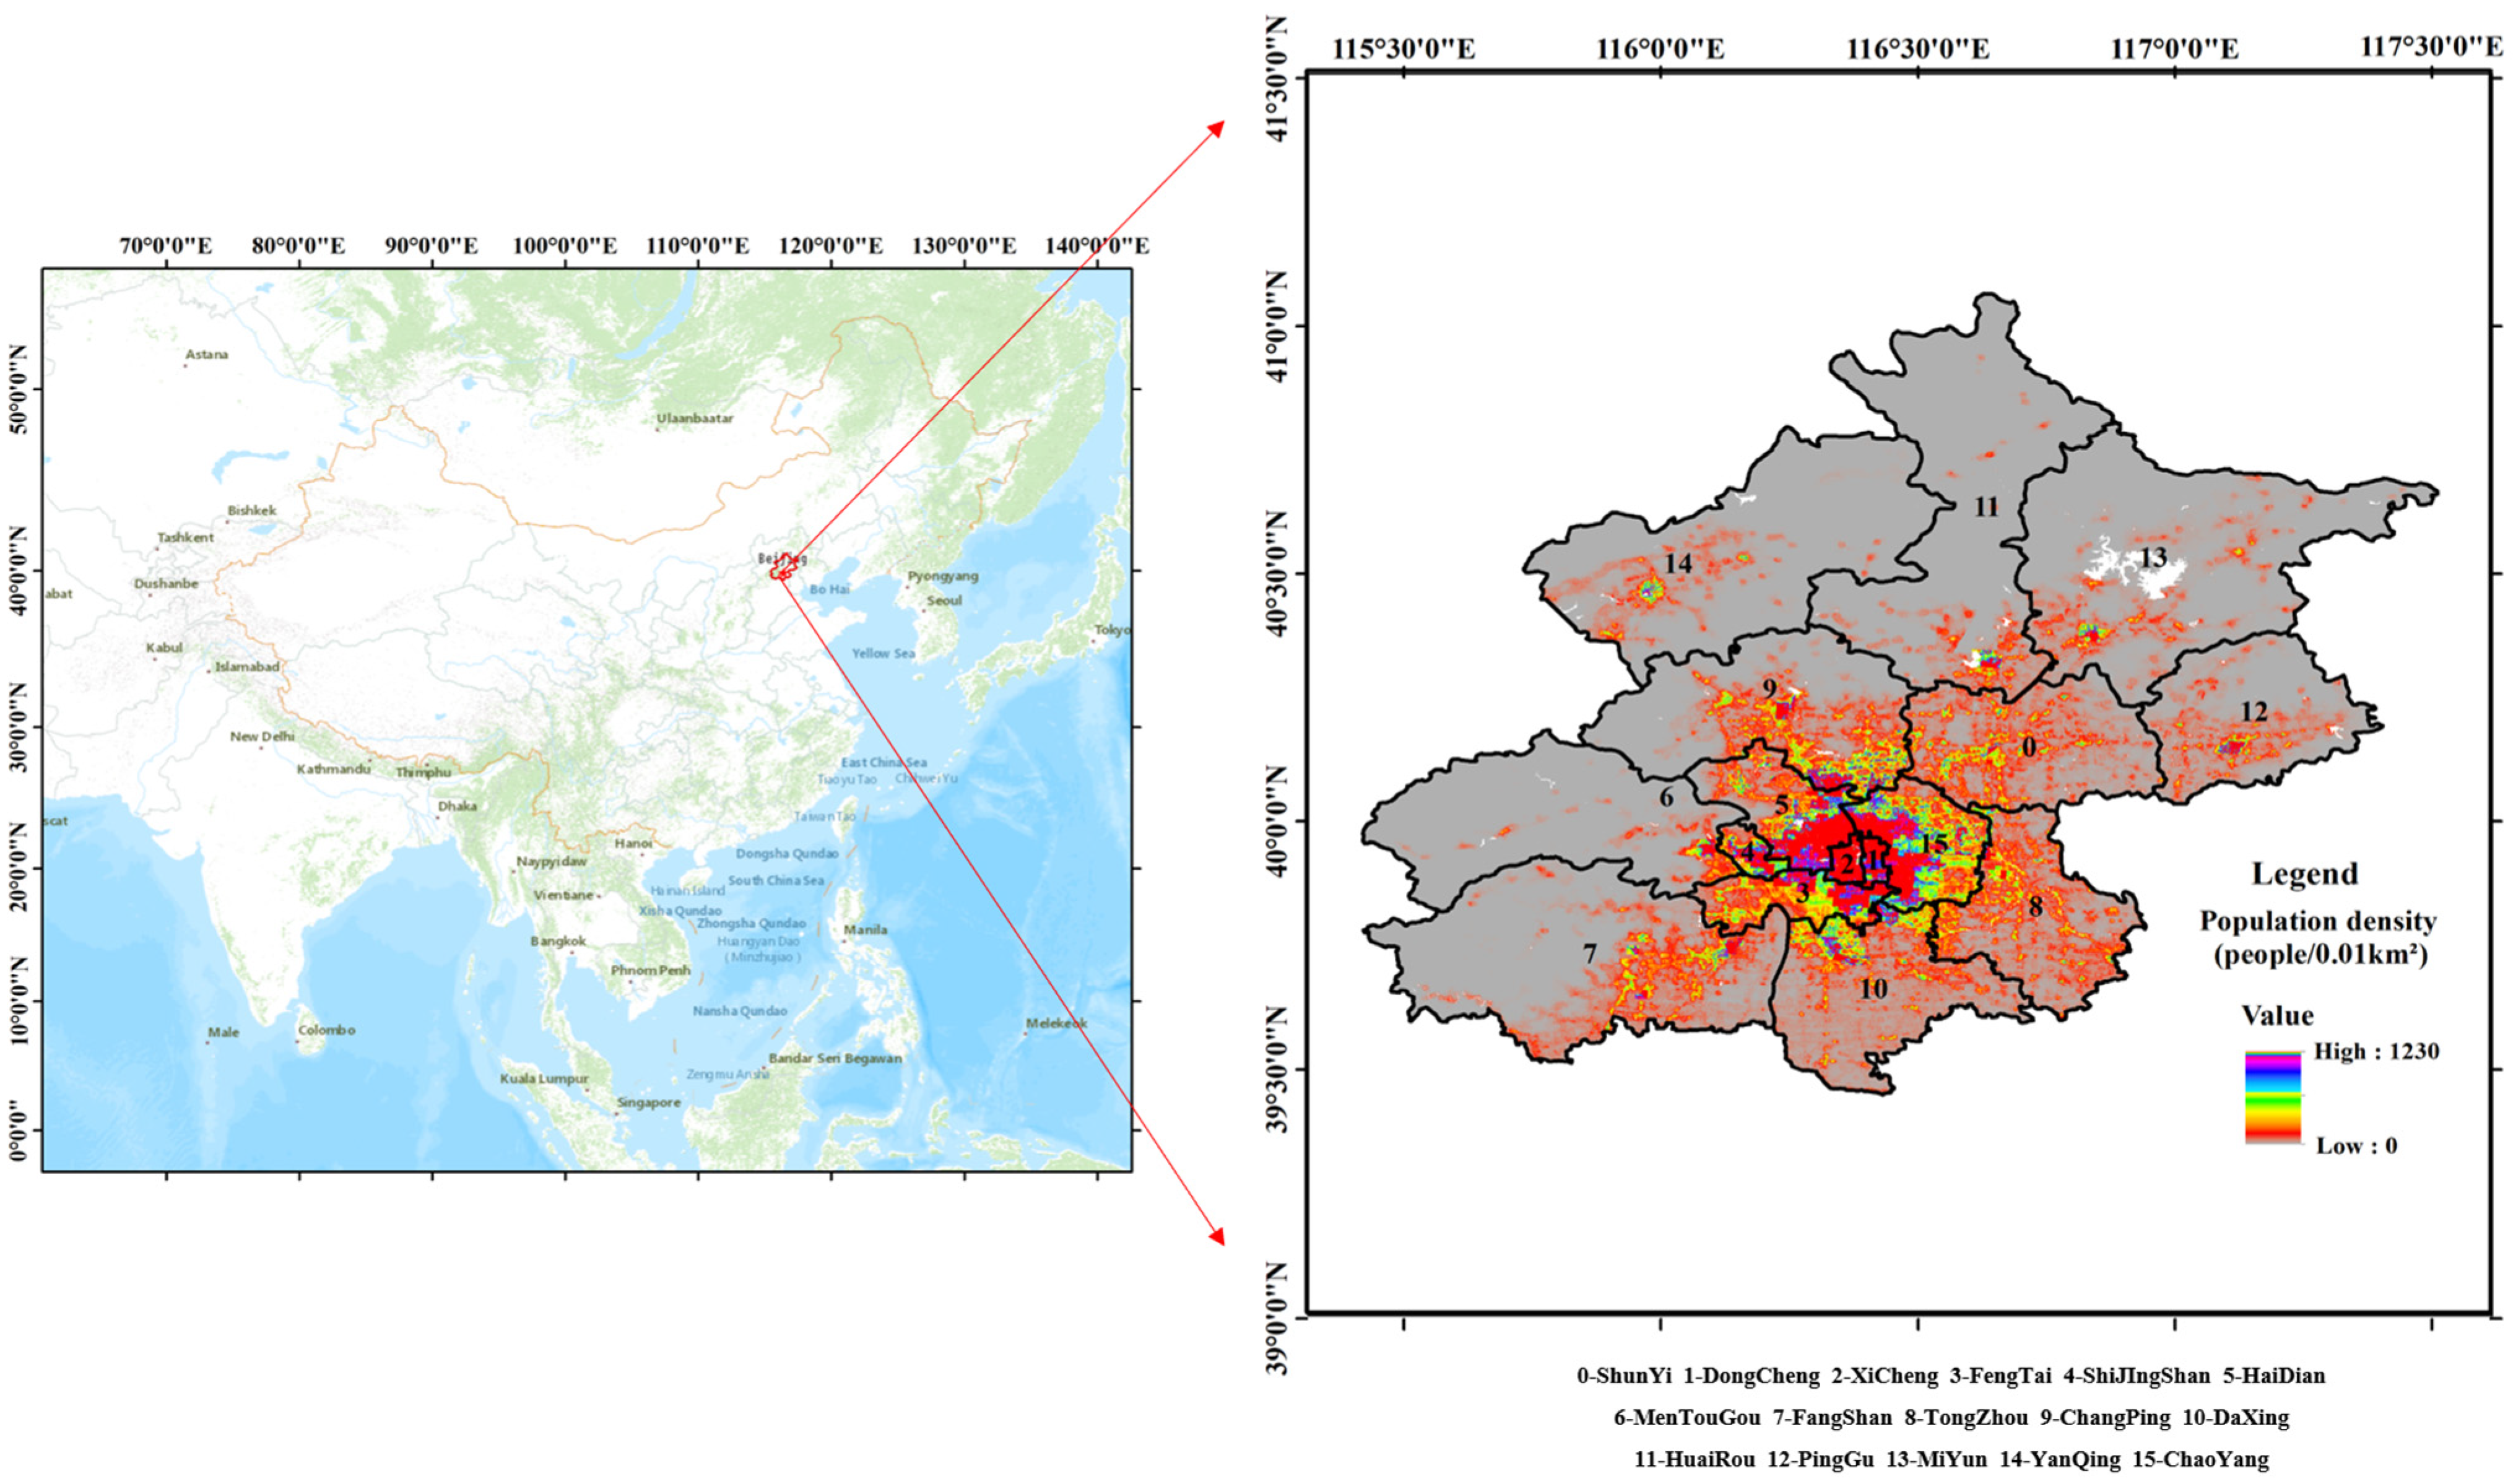
2.1. Study Area
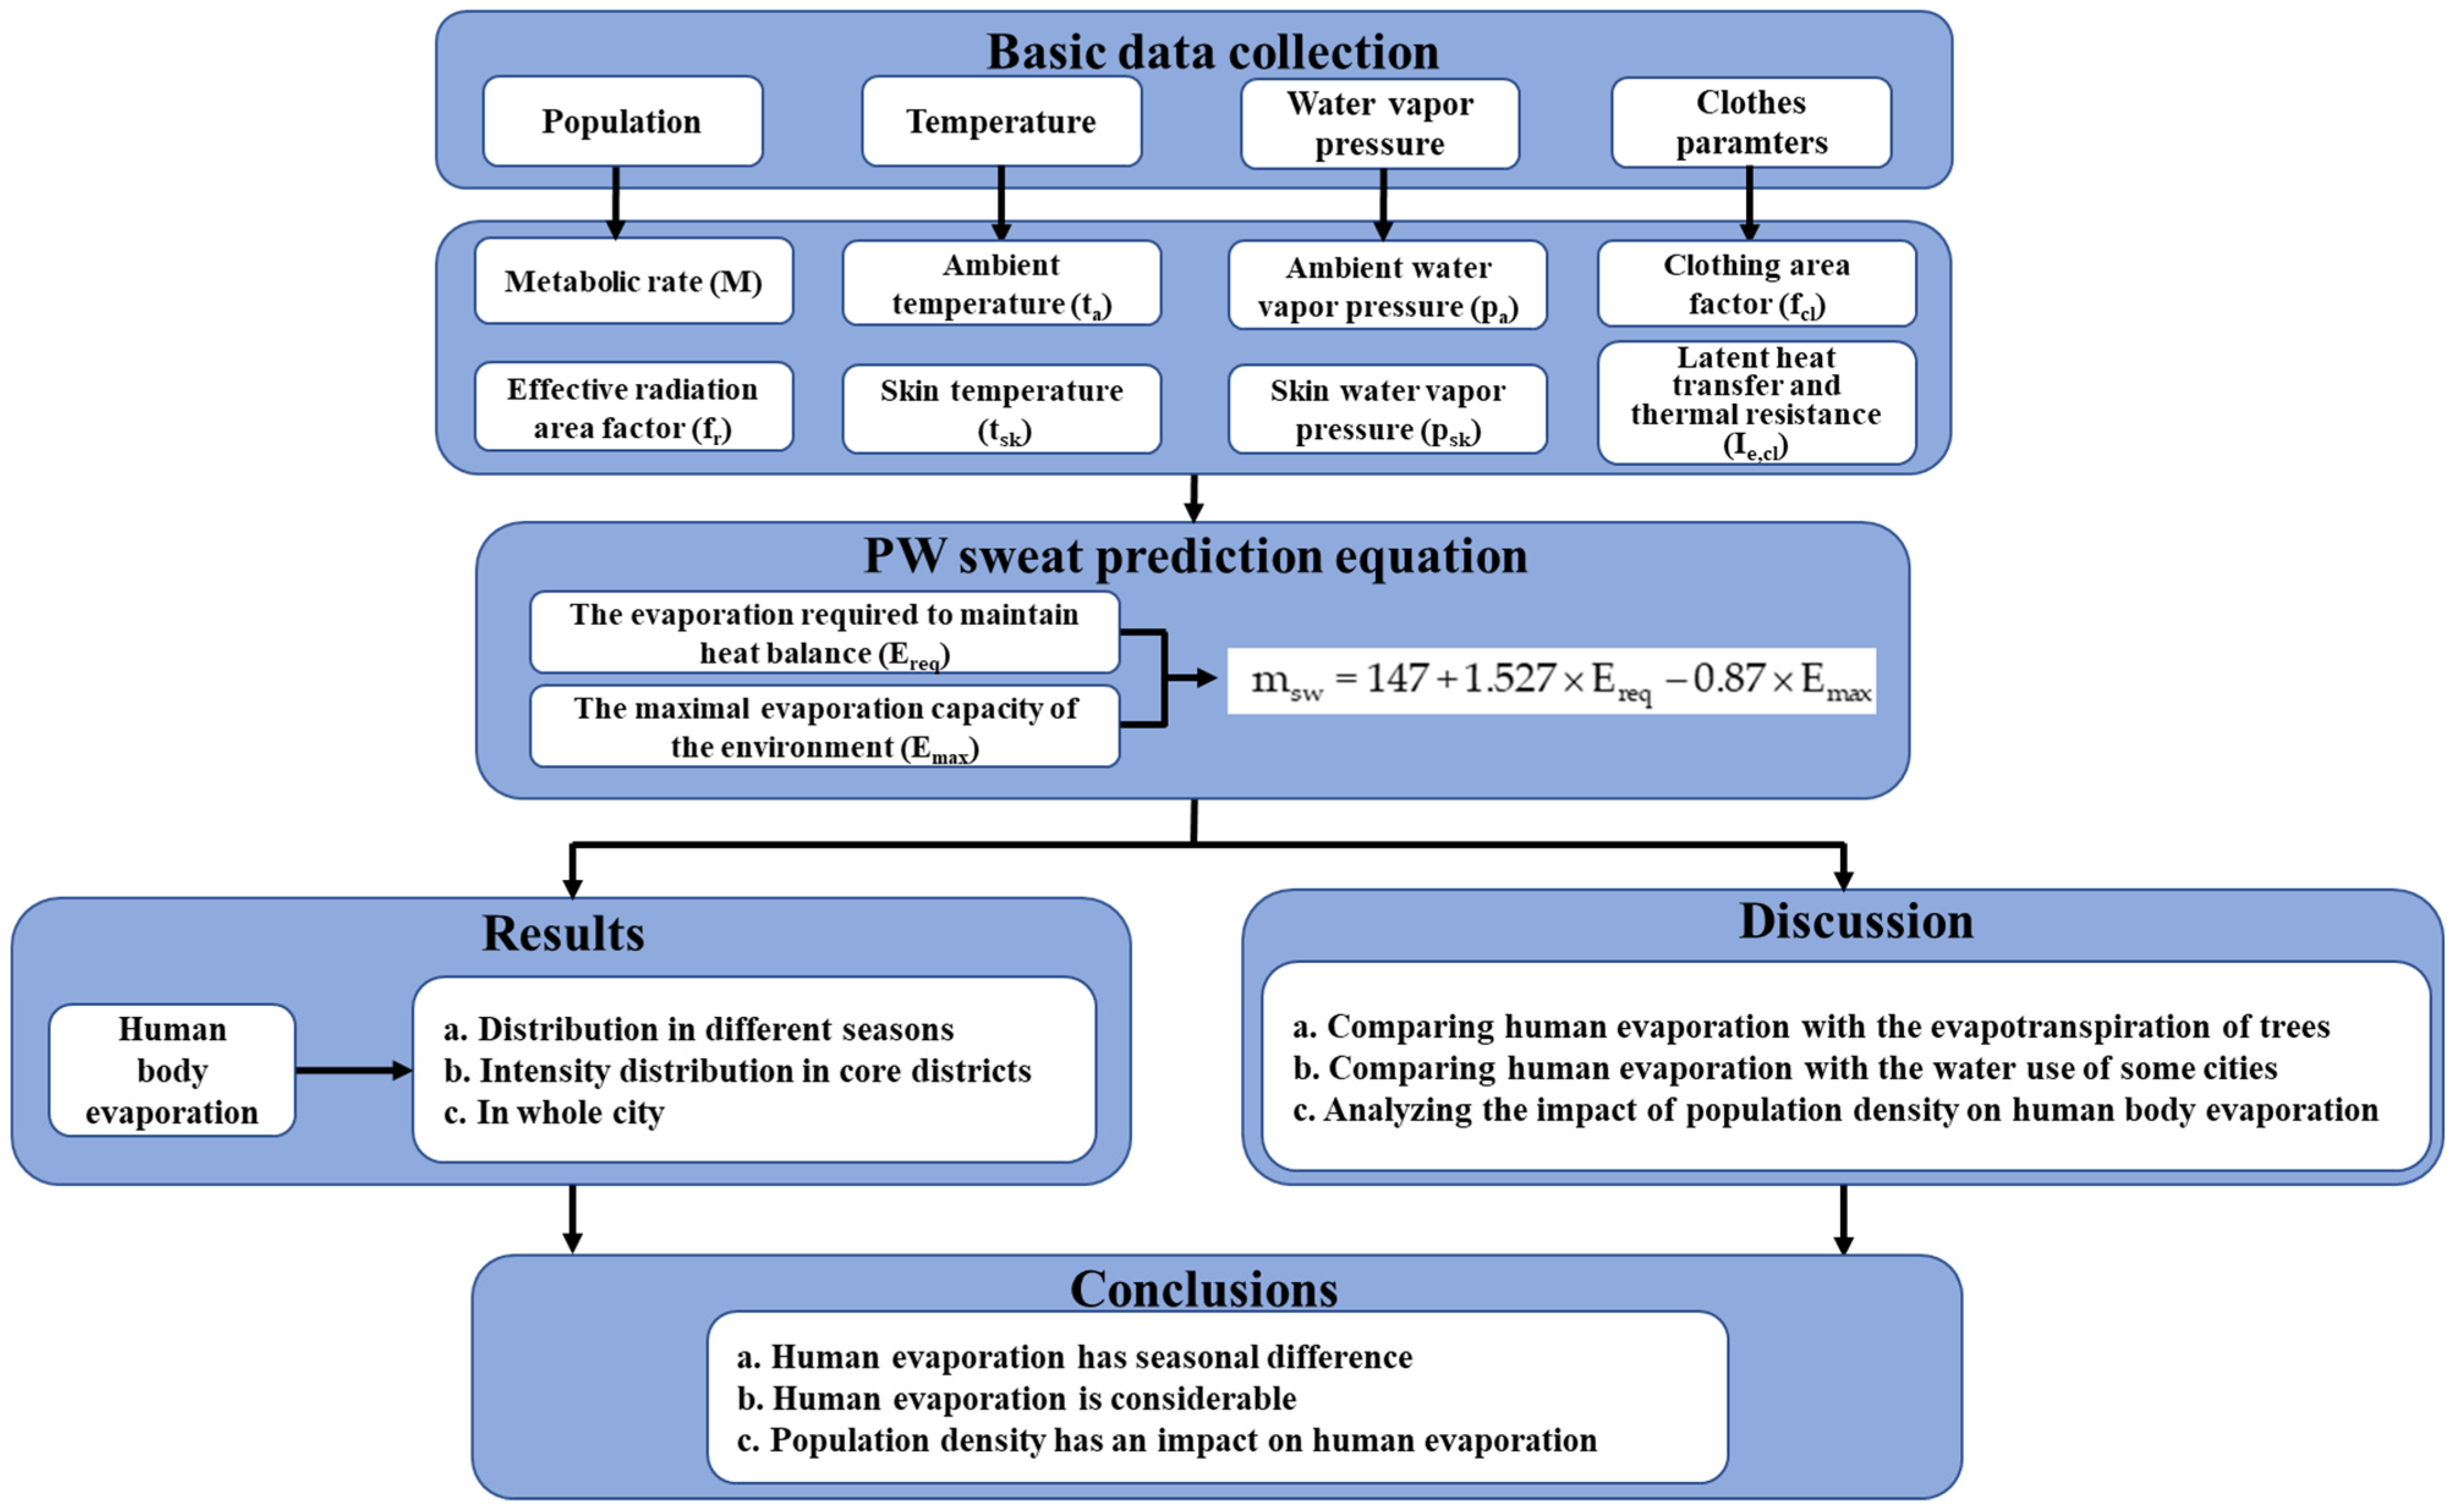
2.2. Methods
3. Results
3.1. Distribution of Human Body Perspiration in Different Seasons
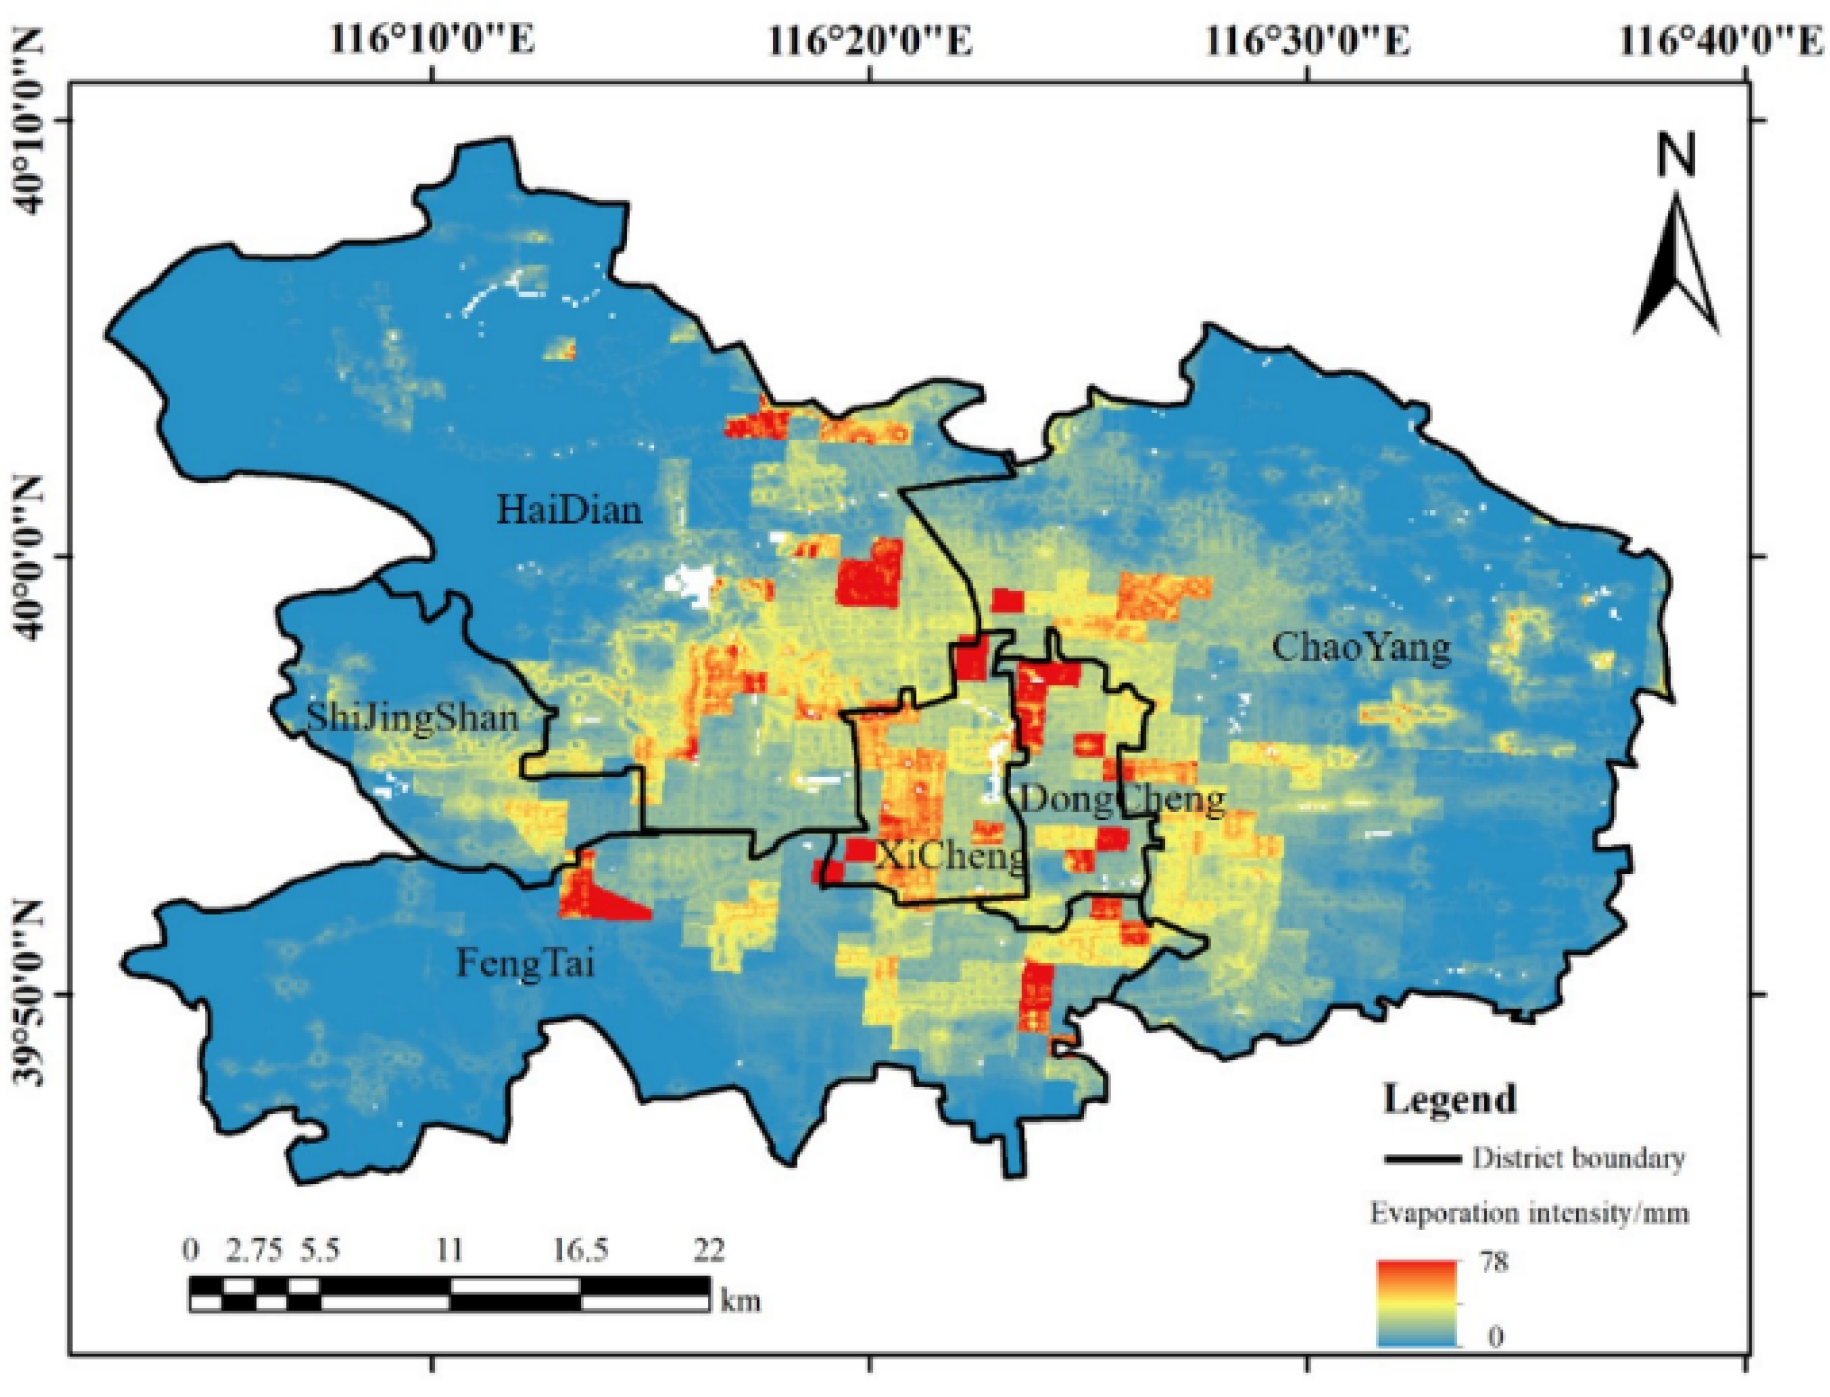
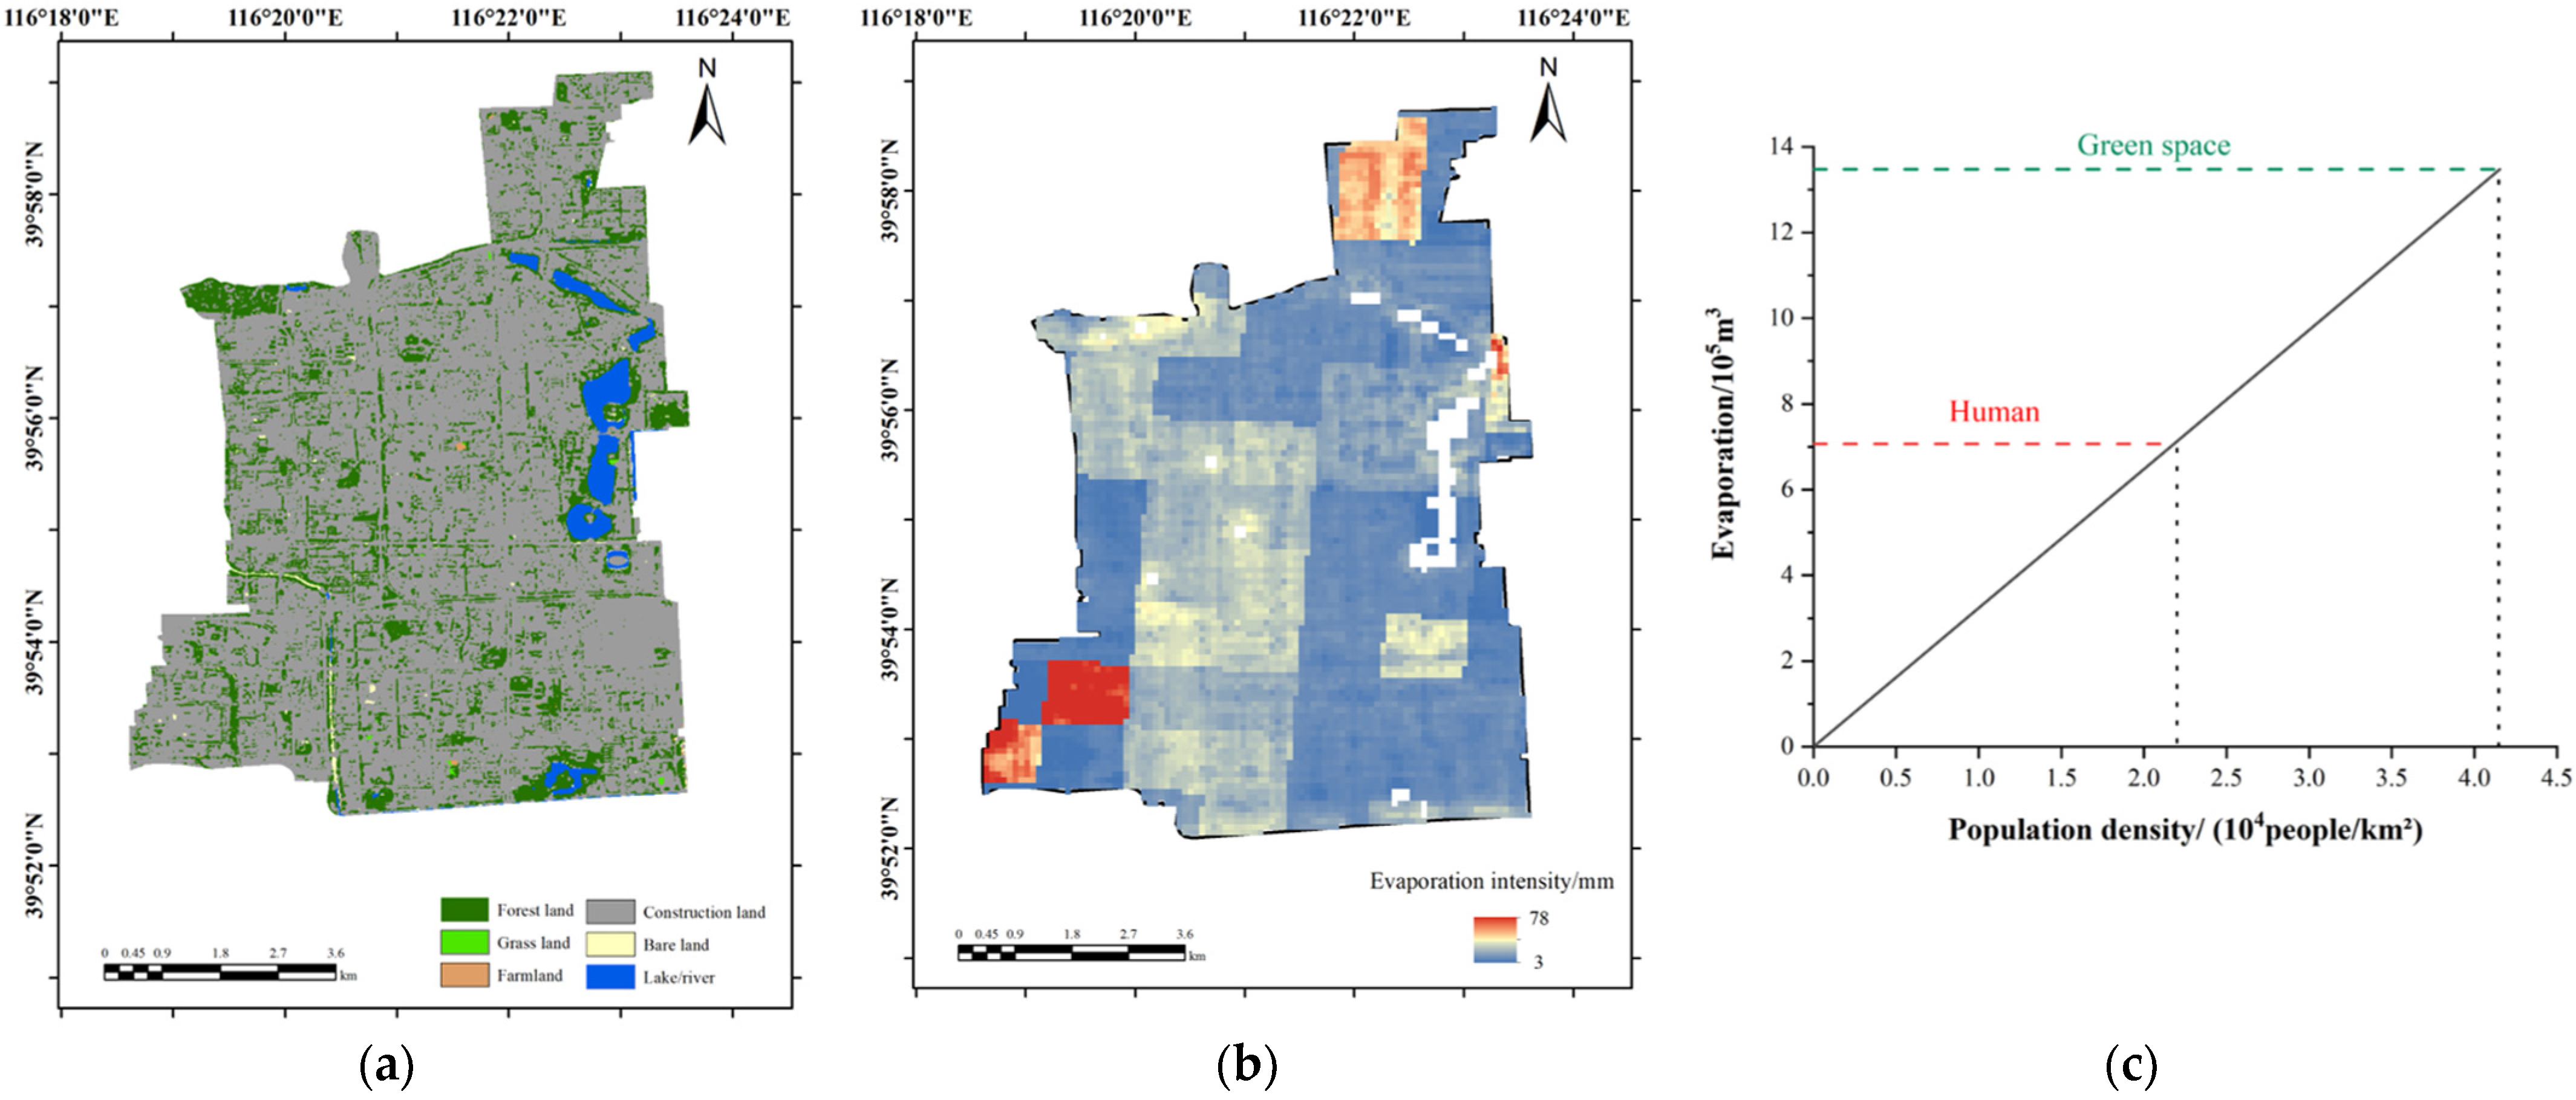
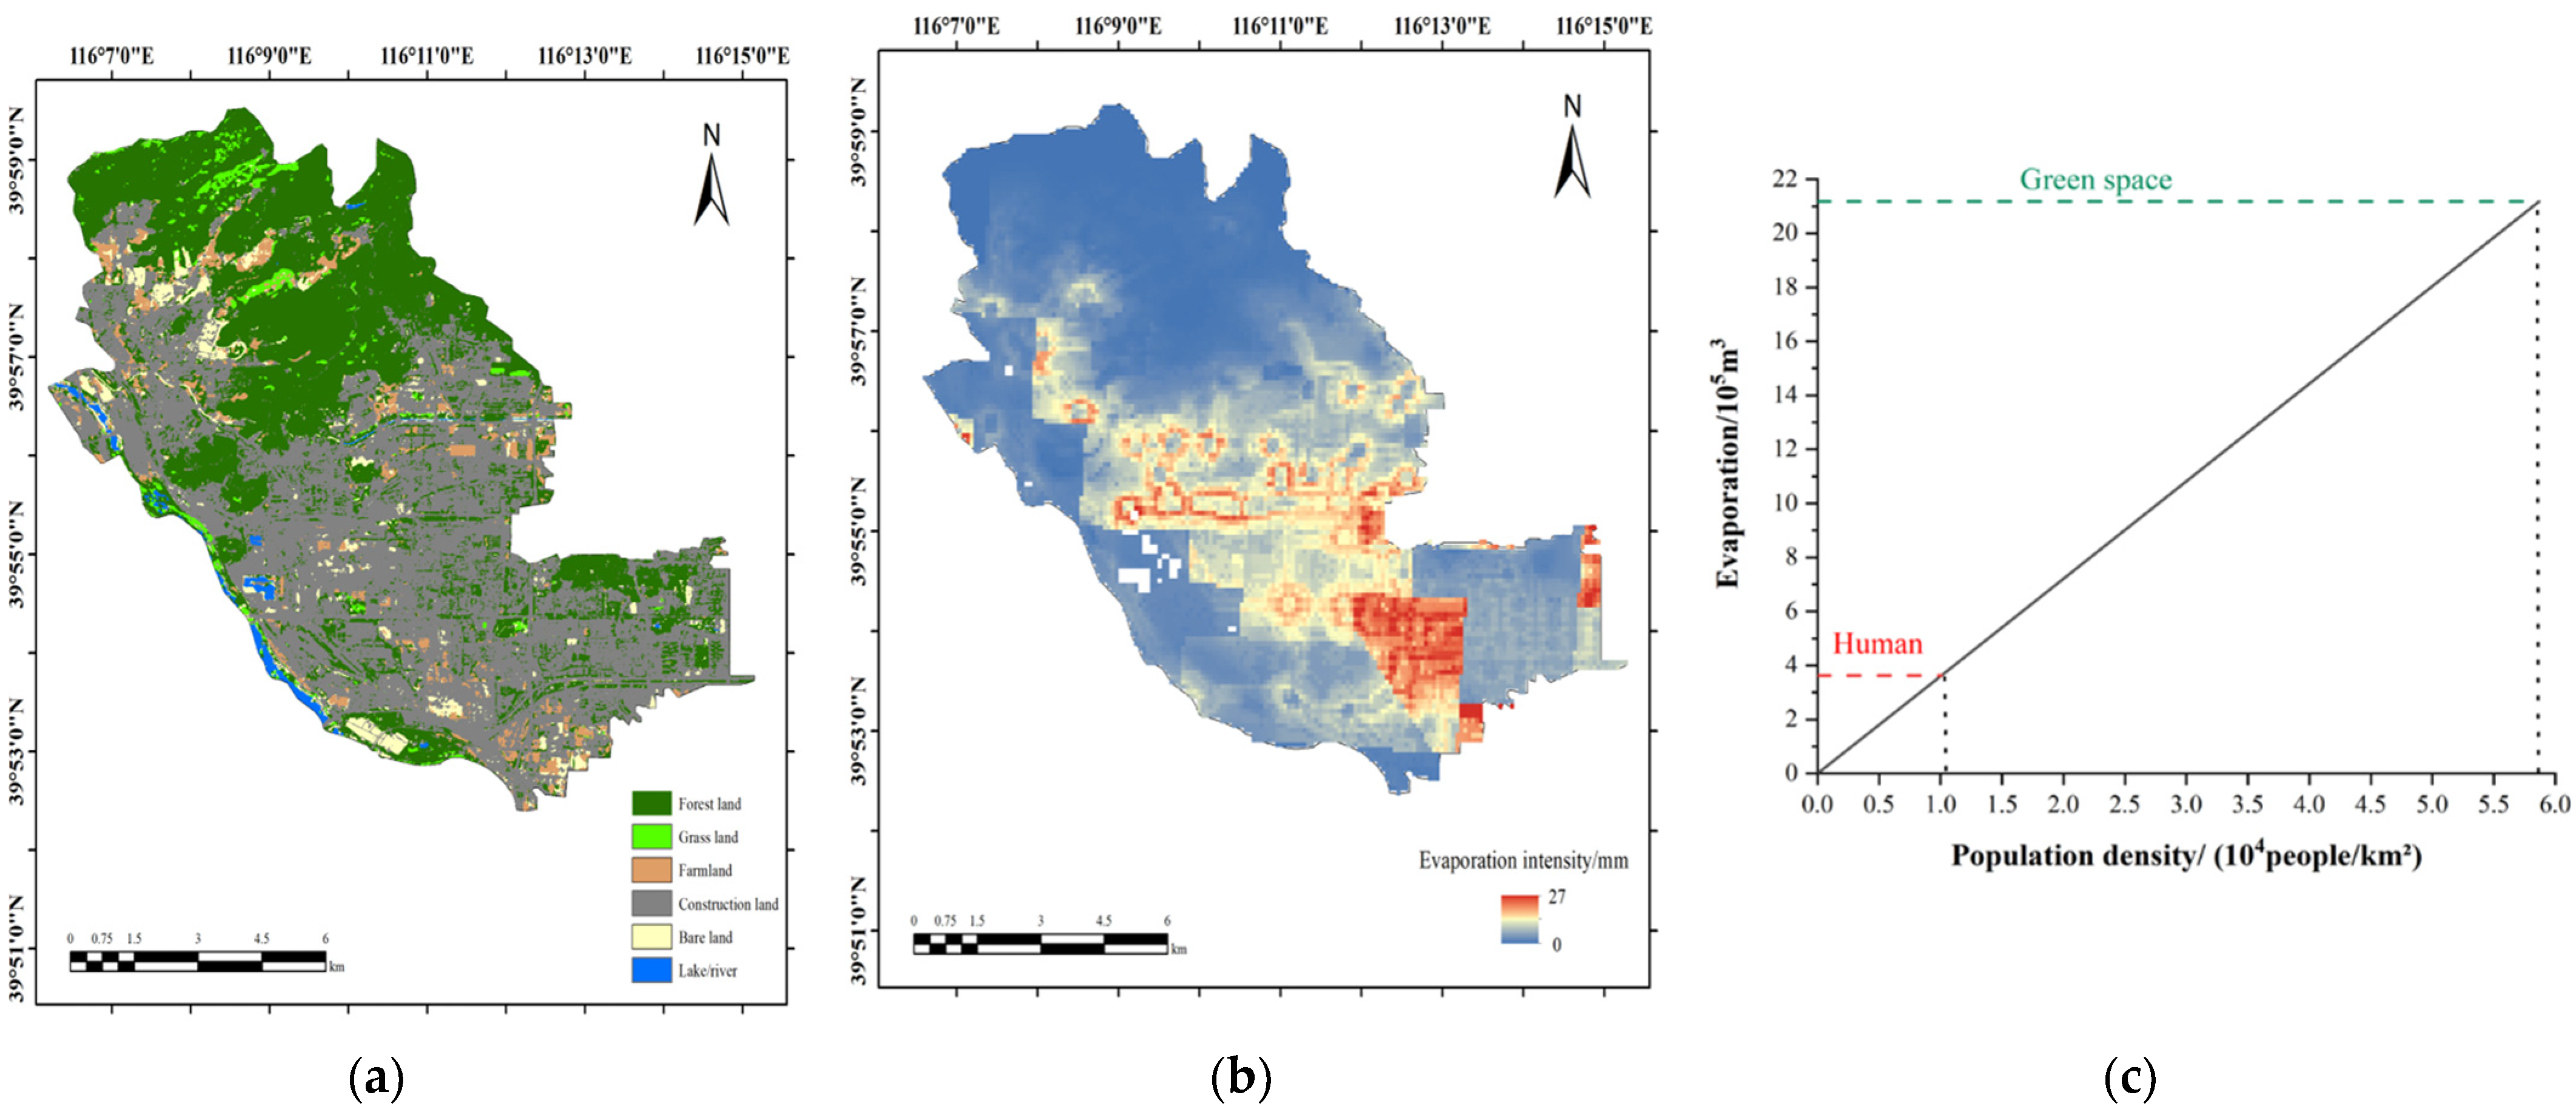
3.2. Distribution of Human Body Perspiration Intensity in Six Core Districts
4. Discussion
5. Conclusions
- (1)
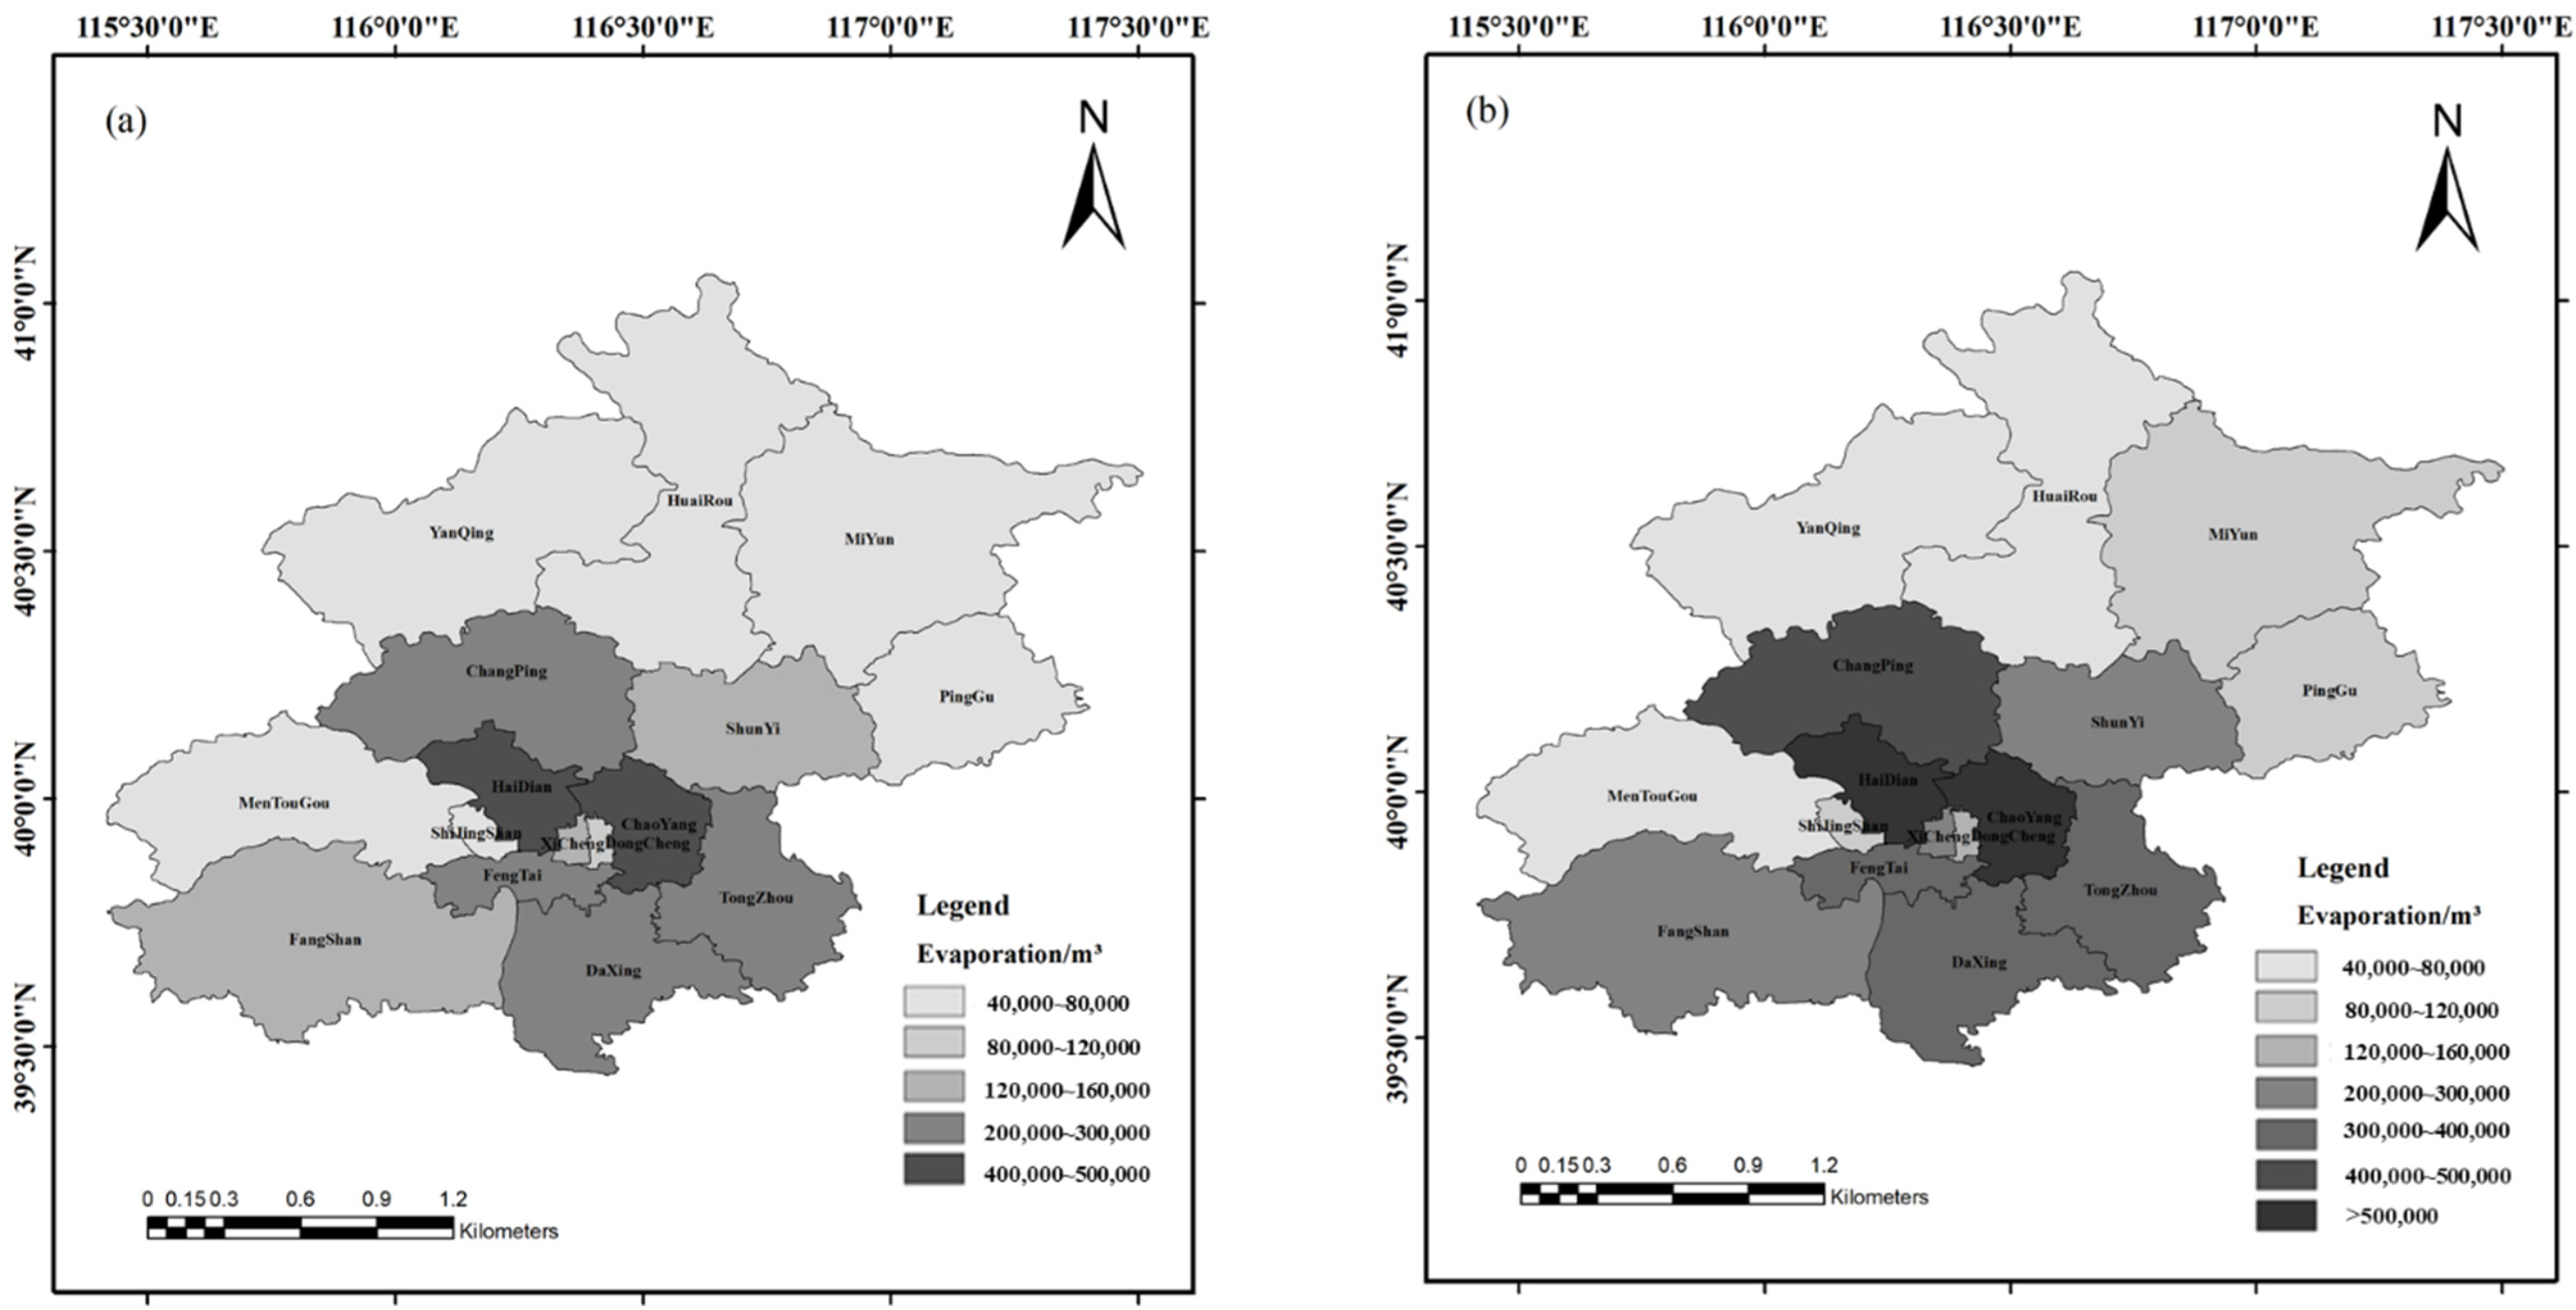
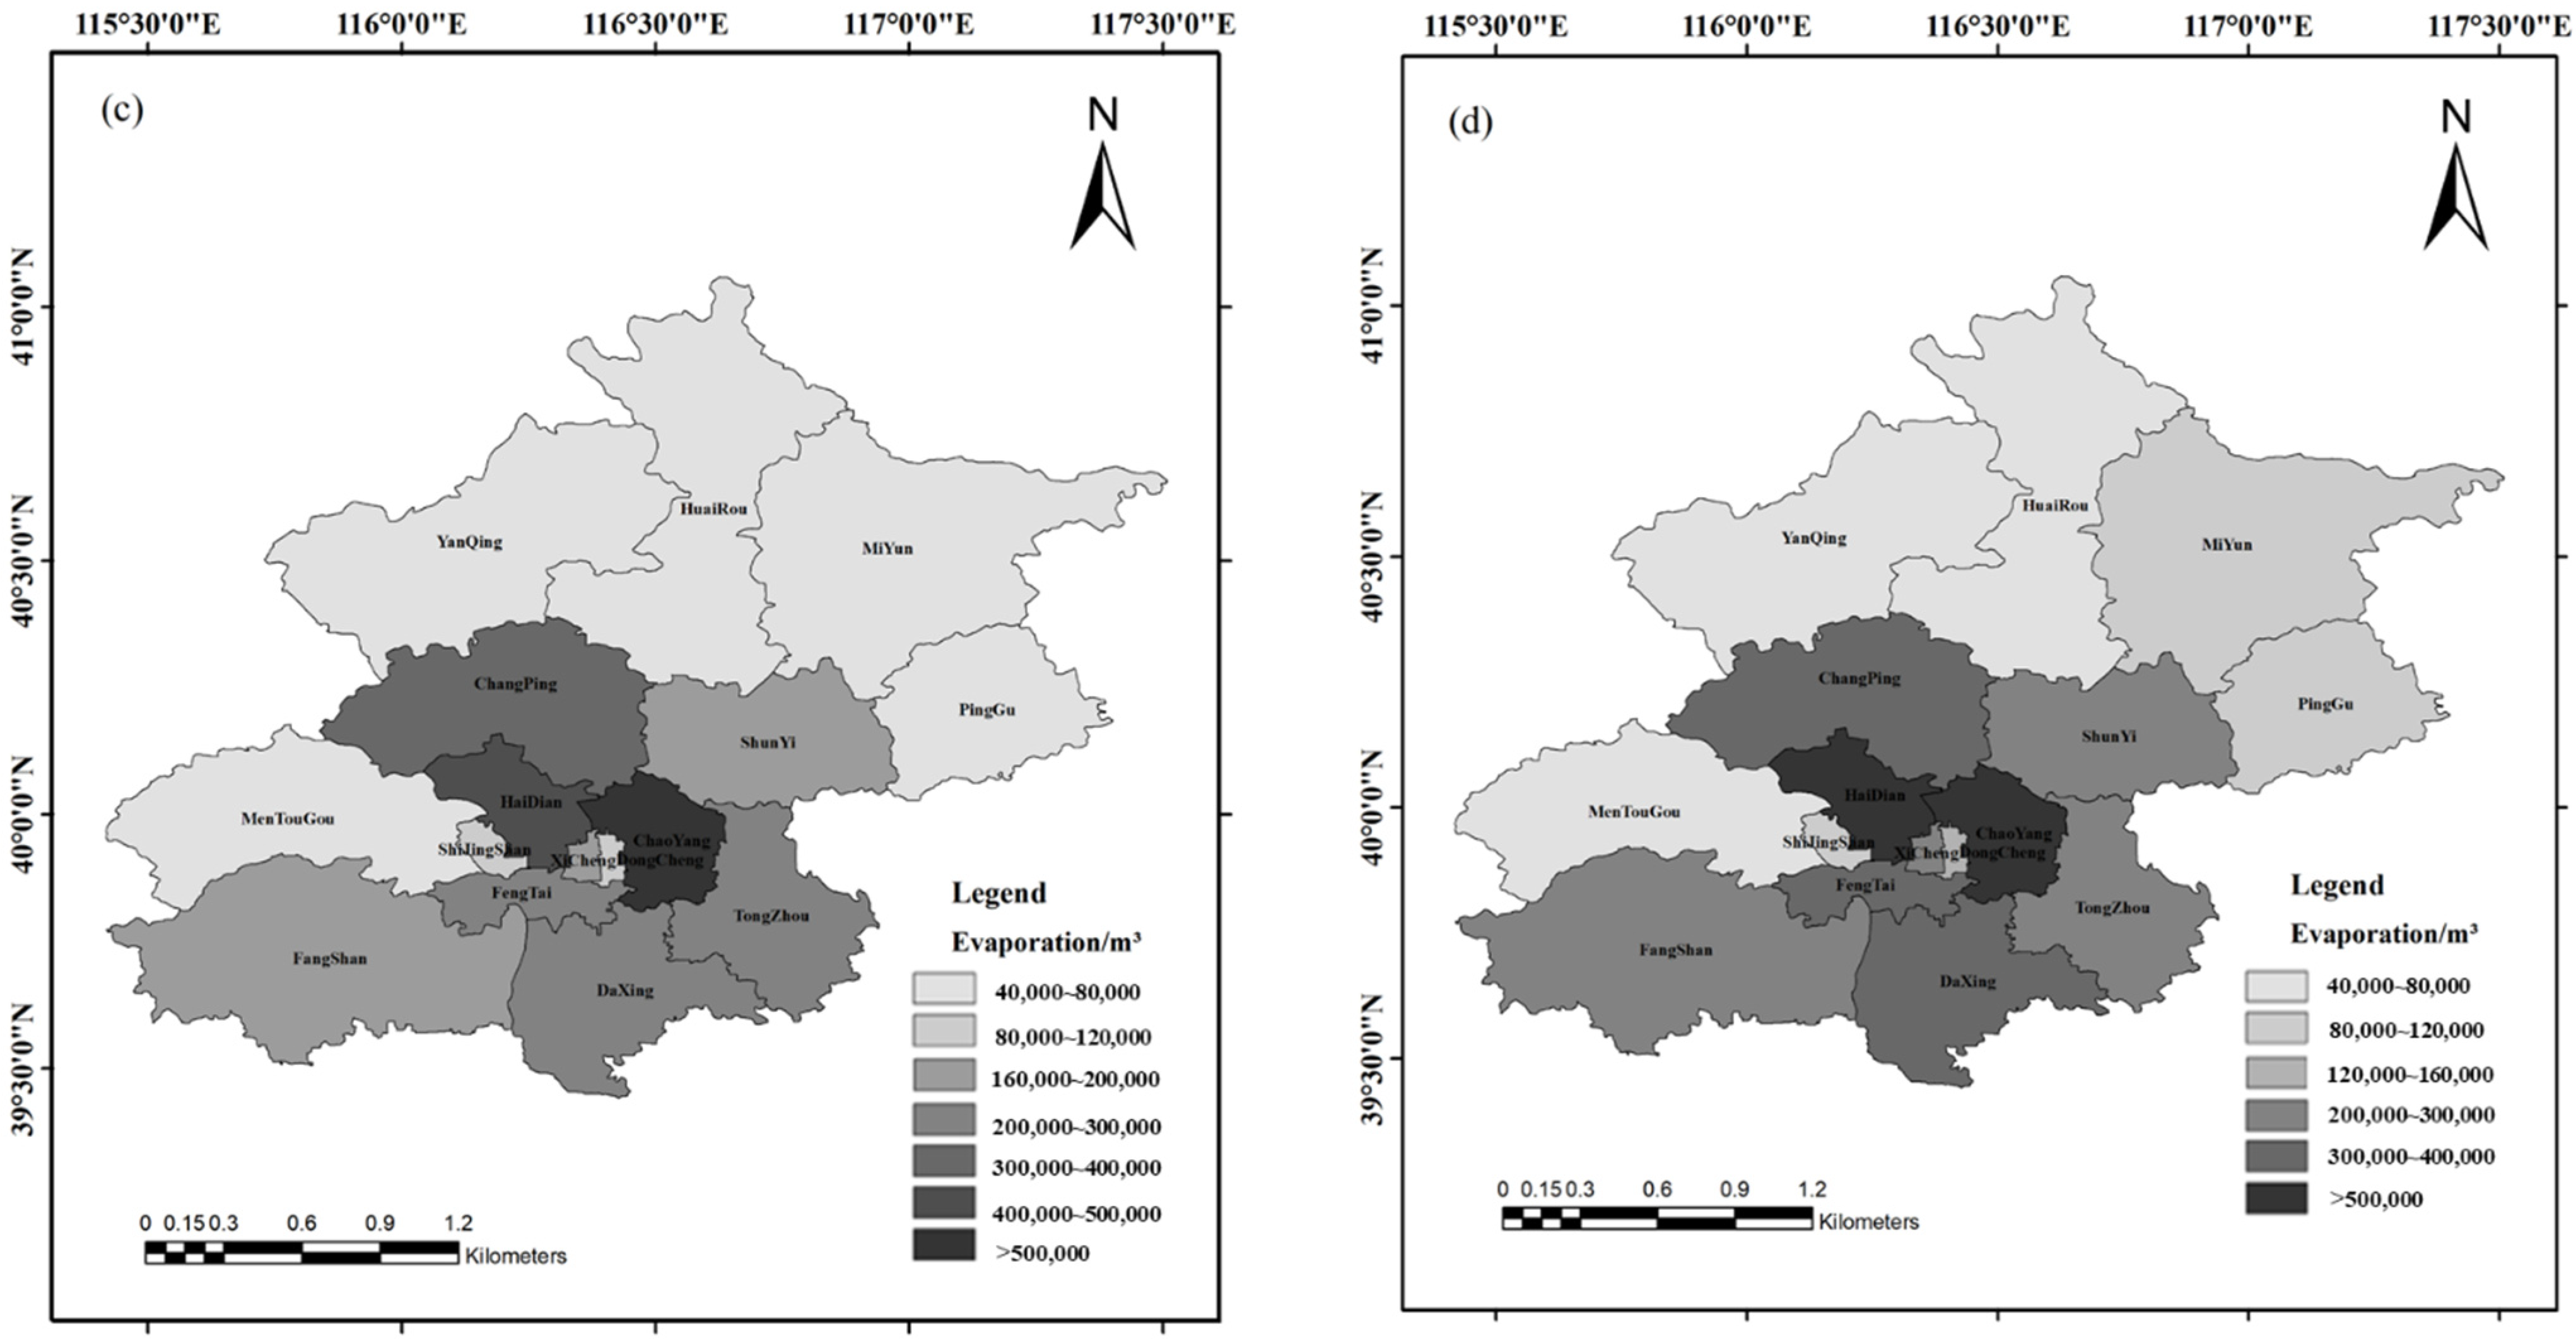
- Affected by factors such as temperature and the clothing worn, there was a significant seasonal difference in the human body evaporation in Beijing. The highest amount occurred in summer, followed by winter, autumn, and spring.
- (2)
- According to the population distribution, the human body evaporation in six core districts of Beijing was converted into the evaporation intensity, which ranged between 0 to 78 mm/year and decreased from the center to the surroundings. Additionally, the amount of evaporation in the six core districts of Beijing reached 5075.2 m3/km2.
- (3)
- The total human body evaporation in Beijing was 14.0 million m3 in 2020, which was equivalent to the annual evapotranspiration of an Acer truncatum forest area of 104.92 km2, comprising trees whose diameters were 15 cm at breast height, with an afforestation density of 800 plants/hm2. This exceeded the annual total water use of some European cities, which shows the huge amount of human body evaporation in megacities. From the comparison between the evaporation of human bodies and that of green spaces in the Xicheng and Shijingshan districts, it was found that the human body evaporation in the two districts reached 52.48% and 17.14% of the green space evaporation, respectively, proving that human body evaporation is considerable.
- (4)
- With the progress of urbanization, the population will continue to congregate in urban areas. In addition, the amount of evaporation produced by the human body should be considered when calculating water vapor balance and water flux for densely populated cities. To calculate the evaporation generated by the human body more precisely, the differences between individuals, such as age and other physiological factors, should be taken into consideration in future research.
Author Contributions
Funding
Institutional Review Board Statement
Informed Consent Statement
Data Availability Statement
Conflicts of Interest
References
- Xia, X.; Li, H.; Kuang, X.; Strauss, J. Spatial–Temporal Features of Coordination Relationship between Regional Urbanization and Rail Transit—A Case Study of Beijing. Int. J. Environ. Res. Public Health 2021, 19, 212. [Google Scholar] [CrossRef] [PubMed]
- Montgomery, M.R. The Urban Transformation of the Developing World. Science 2008, 319, 761–764. [Google Scholar] [CrossRef] [PubMed] [Green Version]
- Zhou, J.; Liu, J.; Chu, Q.; Wang, H.; Shao, W.; Luo, Z.; Zhang, Y. Mechanisms and Empirical Modeling of Evaporation from Hardened Surfaces in Urban Areas. Int. J. Environ. Res. Public Health 2021, 18, 1790. [Google Scholar] [CrossRef]
- Schirmer, M.; Leschik, S.; Musolff, A. Current research in urban hydrogeology—A review. Adv. Water Resour. 2013, 51, 280–291. [Google Scholar] [CrossRef]
- Wang, H.; Jia, Y.; Yang, G.; Zhou, Z.; Qiu, Y.; Niu, C.; Peng, H. Integrated simulation of the dualistic water cycle and its associated processes in the Haihe River Basin. Chin. Sci. Bull. 2013, 58, 3297–3311. [Google Scholar] [CrossRef] [Green Version]
- Hong, Y.; Liu, W.; Khan, S.I.; Huang, M.; Vieux, B.; Caliskan, S.; Grout, T. Actual evapotranspiration estimation for different land use and land cover in urban regions using Landsat 5 data. J. Appl. Remote Sens. 2010, 4, 41873. [Google Scholar] [CrossRef]
- Wang, C.; Yang, J.; Myint, S.W.; Wang, Z.-H.; Tong, B. Empirical modeling and spatio-temporal patterns of urban evapotranspiration for the Phoenix metropolitan area, Arizona. GISci. Remote Sens. 2016, 53, 778–792. [Google Scholar] [CrossRef]
- Zhou, J.; Wang, H.; Liu, J.; Wang, Z.; Zhang, Y. “Nature-Social” dual attribute and seasonal characteristics of urban water dissipation: A case study of Beijing. J. Hydraul. Eng. 2020, 51, 1325–1334. [Google Scholar] [CrossRef]
- Zhou, J.; Liu, J.; Yan, D.; Wang, H.; Wang, Z.; Shao, W.; Luan, Y. Dissipation of water in urban area, mechanism and modelling with the consideration of anthropogenic impacts: A case study in Xiamen. J. Hydrol. 2019, 570, 356–365. [Google Scholar] [CrossRef]
- Chen, S.; Liu, J.; Wang, H. Initial research on the theory and application of urban water demand field. Chin. Sci. Bull. 2016, 61, 1428–1435. [Google Scholar] [CrossRef] [Green Version]
- Grimmond, C.S.B.; Oke, T.R.; Steyn, D.G. Urban Water Balance: 1. A Model for Daily Totals. Water Resour. Res. 1986, 22, 1397–1403. [Google Scholar] [CrossRef] [Green Version]
- Kool, D.; Agam, N.; Lazarovitch, N.; Heitman, J.; Sauer, T.; Ben-Gal, A. A review of approaches for evapotranspiration partitioning. Agric. For. Meteorol. 2014, 184, 56–70. [Google Scholar] [CrossRef]
- Dash, S.S.; Sahoo, B.; Raghuwanshi, N.S. How reliable are the evapotranspiration estimates by Soil and Water Assessment Tool (SWAT) and Variable Infiltration Capacity (VIC) models for catchment-scale drought assessment and irrigation planning? J. Hydrol. 2020, 592, 125838. [Google Scholar] [CrossRef]
- Pereira, L.S.; Perrier, A.; Allen, R.G.; Alves, I. Evapotranspiration: Concepts and Future Trends. J. Irrig. Drain. Eng. 1999, 125, 45–51. [Google Scholar] [CrossRef]
- Chen, H.; Huang, J.J.; Dash, S.S.; Wei, Y.; Li, H. A hybrid deep learning framework with physical process description for simulation of evapotranspiration. J. Hydrol. 2022, 606, 127422. [Google Scholar] [CrossRef]
- Fineberg, S.J.; Nandyala, S.V.; Marquez-Lara, A.; Oglesby, M.; Patel, A.A.; Singh, K. Incidence and risk factors for postoperative delirium after lumbar spine surgery (Phila Pa 1976). Spine 2013, 38, 1790–1796. [Google Scholar] [CrossRef]
- Di Sante, M.; Brianzoni, V.; Mazzieri, F.; Pasqualini, E.; Yesiller, N.; Zekkos, D.; Farid, A.; De, A.; Reddy, K.R. Predicting the Volatilization of Contaminants from Soil: Comparison of Theoretical Models and Direct Measurement of Vapor Emissions. Geo-Chicago 2016, 2016, 340–352. [Google Scholar] [CrossRef]
- Benini, L.; Antonellini, M.; Laghi, M.; Mollema, P.N. Assessment of Water Resources Availability and Groundwater Salinization in Future Climate and Land use Change Scenarios: A Case Study from a Coastal Drainage Basin in Italy. Water Resour. Manag. 2015, 30, 731–745. [Google Scholar] [CrossRef]
- Allen, R.G.; Tasumi, M.; Trezza, R. Satellite-Based Energy Balance for Mapping Evapotranspiration with Internalized Calibration (METRIC)—Model. J. Irrig. Drain. Eng. 2007, 133, 380–394. [Google Scholar] [CrossRef]
- Livesley, S.; McPherson, E.G.; Calfapietra, C. The Urban Forest and Ecosystem Services: Impacts on Urban Water, Heat, and Pollution Cycles at the Tree, Street, and City Scale. J. Environ. Qual. 2016, 45, 119–124. [Google Scholar] [CrossRef]
- Von Allmen, E.I.; Sperry, J.S.; Bush, S.E. Contrasting whole-tree water use, hydraulics, and growth in a co-dominant diffuse-porous vs. ring-porous species pair. Trees 2014, 29, 717–728. [Google Scholar] [CrossRef]
- Zhou, J.; Liu, J.; Wang, H.; Wang, Z.; Mei, C. Water dissipation mechanism of residential and office buildings in urban areas. Sci. China Technol. Sci. 2018, 61, 1072–1080. [Google Scholar] [CrossRef]
- Park, S.J.; Tamura, T. Distribution of Evaporation Rate on Human Body Surface. Ann. Physiol. Anthr. 1992, 11, 593–609. [Google Scholar] [CrossRef] [PubMed] [Green Version]
- Spruit, D.; Herweyer, H. The Ability of the Skin to Change its Insensible Perspiration. Dermatology 1967, 134, 364–370. [Google Scholar] [CrossRef] [PubMed]
- Gagge, A.P. A new physiological variable associated with sensible and insensible perspiration. Am. J. Physiol. Content 1937, 120, 277–287. [Google Scholar] [CrossRef]
- Gonzalez, R.R.; Cheuvront, S.N.; Montain, S.J.; Goodman, D.A.; Blanchard, L.A.; Berglund, L.G.; Sawka, M.N. Expanded prediction equations of human sweat loss and water needs. J. Appl. Physiol. 2009, 107, 379–388. [Google Scholar] [CrossRef] [Green Version]
- Consolazio, C.F.; Matoush, L.R.O.; Nelson, R.A.; Isaac, G.J.; Canham, J.E. Comparisons of Nitrogen, Calcium and Iodine Excretion in Arm and Total Body Sweat. Am. J. Clin. Nutr. 1966, 18, 443–448. [Google Scholar] [CrossRef]
- Verde, T.; Shephard, R.J.; Corey, P.; Moore, R. Sweat composition in exercise and in heat. J. Appl. Physiol. 1982, 53, 1540–1545. [Google Scholar] [CrossRef]
- Machado-Moreira, C.A.; Smith, F.M.; Heuvel, A.M.J.V.D.; Mekjavic, I.B.; Taylor, N.A.S. Sweat secretion from the torso during passively-induced and exercise-related hyperthermia. Eur. J. Appl. Physiol. 2007, 104, 265–270. [Google Scholar] [CrossRef]
- Havenith, G.; Fogarty, A.; Bartlett, R.; Smith, C.J.; Ventenat, V. Male and female upper body sweat distribution during running measured with technical absorbents. Eur. J. Appl. Physiol. 2007, 104, 245–255. [Google Scholar] [CrossRef] [Green Version]
- Schwartz, I.L.; Thaysen, J.H.; Dole, V.P. Urea excretion in human sweat as a tracer for movement of water within the secreting gland. J. Exp. Med. 1953, 97, 429–437. [Google Scholar] [CrossRef] [PubMed] [Green Version]
- Shapiro, Y.; Pandolf, K.B.; Goldman, R.F. Predicting sweat loss response to exercise, environment and clothing. Eur. J. Appl. Physiol. 1982, 48, 83–96. [Google Scholar] [CrossRef] [PubMed]
- Cong, Z.; Shen, Q.; Zhou, L.; Sun, T.; Liu, J. Evapotranspiration estimation considering anthropogenic heat based on remote sensing in urban area. Sci. China Earth Sci. 2017, 60, 659–671. [Google Scholar] [CrossRef]
- Saltin, B.; Gagge, A.P.; Stolwijk, J.A. Body temperatures and sweating during thermal transients caused by exercise. J. Appl. Physiol. 1970, 28, 318–327. [Google Scholar] [CrossRef] [PubMed]
- Zhou, Y. Potential Annual Water Consumption Estimation of Green Plants in Beijing; Beijing Forestry University: Beijing, China, 2020. [Google Scholar]
- Wang, R. Research on Water Consumption and Irrigation Regime of Main Landscape Tree Species in Beijing City; Beijing Forestry University: Beijing, China, 2006. [Google Scholar]
- GB/T 15776-2016; The State Forestry Administration of the People’s Republic of China. Afforestation Technical Regulations: Beijing, China, 2016.
- Li, Y.; Rodriguez, F.; Berthier, E. Development and Evaluation of a Saturated Zone Module in an Integrated Urban Hydrological Model. Water 2022, 14, 1030. [Google Scholar] [CrossRef]
- Grimmond, C.S.B.; Oke, T.R. An evapotranspiration-interception model for urban areas. Water Resour. Res. 1991, 27, 1739–1755. [Google Scholar] [CrossRef]
- Cao, R.X.; Li, F.W.; Li, J.Z.; Feng, P. Exploring evapotranspiration characteristics in urbanized areas of Tianjin plain (in Chinese). Adv. Water. Sci. 2021, 32, 366–375. [Google Scholar] [CrossRef]
- Statistics Sweden. Water Withdrawal and Water Use in SWEDEN. 2021. Available online: http://www.scb.se (accessed on 10 December 2021).
- Statistics Denmark. Geography, Environment and Energy. 2021. Available online: https://www.statbank.dk (accessed on 10 December 2021).
- Statistics Norway. Municaipal Water Supply. 2021. Available online: https://www.ssb.no (accessed on 10 December 2021).
- Statistics Estonia. Water Use by County and Field of Water Use. 2021. Available online: https://andmed.stat.ee (accessed on 10 December 2021).
- White-Newsome, J.L.; Sánchez, B.N.; Jolliet, O.; Zhang, Z.; Parker, E.A.; Dvonch, J.T.; O’Neill, M.S. Climate change and health: Indoor heat exposure in vulnerable populations. Environ. Res. 2011, 112, 20–27. [Google Scholar] [CrossRef] [Green Version]
- Krishnamachari, B.; Iyengar, S. Distributed Bayesian algorithms for fault-tolerant event region detection in wireless sensor networks. IEEE Trans. Comput. 2004, 53, 241–250. [Google Scholar] [CrossRef]
- Wang, B.; Yu, J.; Ye, H.; Yunxi, L.; Guo, H.; Tian, L. Study on present situation and optimization strategy of infiltration air in a train station in winter. Procedia Eng. 2017, 205, 2517–2523. [Google Scholar] [CrossRef]
- French, L.; Camilleri, M.; Isaacs, N.; Pollard, A. Temperatures and heating energy in New Zealand houses from a nationally representative study—HEEP. Energy Build. 2007, 39, 770–782. [Google Scholar] [CrossRef]
- Yam, J.; Li, Y.; Zheng, Z. Nonlinear coupling between thermal mass and natural ventilation in buildings. Int. J. Heat Mass Transf. 2003, 46, 1251–1264. [Google Scholar] [CrossRef]
- Ogoli, D.M. Predicting indoor temperatures in closed buildings with high thermal mass. Energy Build. 2003, 35, 851–862. [Google Scholar] [CrossRef]
- Benedict, F.G.; Benedict, C.G. The Nature of the Insensible Perspiration. Proc. Natl. Acad. Sci. USA 1927, 13, 364–369. [Google Scholar] [CrossRef] [PubMed] [Green Version]
- Hertzman, A.B.; Randall, W.C.; Peiss, C.N.; Seckendorf, R. Regional Rates of Evaporation from the Skin at Various Environmental Temperatures. J. Appl. Physiol. 1952, 5, 153–161. [Google Scholar] [CrossRef] [PubMed]
- Reithner, L.; Johansson, H.; Strouth, L. Insensible Perspiration during Anaesthesia and Surgery. Acta Anaesthesiol. Scand. 1980, 24, 362–366. [Google Scholar] [CrossRef]
- Dosios, T.; Billis, A.; Skalkeas, G. Evaporative water loss of adult surgical patients in Greece. Am. J. Surg. 1974, 128, 15–18. [Google Scholar] [CrossRef]
- Cox, P. Insensible water loss and its assessment in adult patients: A review. Acta Anaesthesiol. Scand. 1987, 31, 771–776. [Google Scholar] [CrossRef]


| Type of Activity | M (W/m2) | hc (W/(m2·K)) | fr |
| Sleep | 40 | 2.7 | 0.35 |
| Light work | 75 | 4.0 | 0.7 |
| Moderate work | 220 | 8.2 | 0.73 |
| Season | fcl | Icl (m2·K/W) | icl |
| Spring | 1.22 | 0.89 | 0.5 |
| Summer | 1.1 | 0.36 | 0.55 |
| Autumn | 1.28 | 1.01 | 0.48 |
| Winter | 1.33 | 1.20 | 0.43 |
| Diameter at Breast Height (cm) | Afforestation Density (Plants/hm2) | Evapotranspiration per Plant (kg/year) | Evapotranspiration (m3/km2) |
|---|---|---|---|
| 15 | 800 | 1667.6 | 133,408 |
| City | Kronoberg | Esbjerg | Aust-Agder | Tartu |
|---|---|---|---|---|
| Country | Sweden | Denmark | Norway | Estonia |
| Total water use (million m3) | 17.42 | 14.30 | 15.67 | 6.75 |
Publisher’s Note: MDPI stays neutral with regard to jurisdictional claims in published maps and institutional affiliations. |
© 2022 by the authors. Licensee MDPI, Basel, Switzerland. This article is an open access article distributed under the terms and conditions of the Creative Commons Attribution (CC BY) license (https://creativecommons.org/licenses/by/4.0/).
Share and Cite
Liu, C.; Liu, J.; Shao, W.; Lu, J.; Gao, H. The Considerable Water Evaporation Induced by Human Perspiration and Respiration in Megacities: Quantifying Method and Case Study in Beijing. Int. J. Environ. Res. Public Health 2022, 19, 8638. https://doi.org/10.3390/ijerph19148638
Liu C, Liu J, Shao W, Lu J, Gao H. The Considerable Water Evaporation Induced by Human Perspiration and Respiration in Megacities: Quantifying Method and Case Study in Beijing. International Journal of Environmental Research and Public Health. 2022; 19(14):8638. https://doi.org/10.3390/ijerph19148638
Chicago/Turabian StyleLiu, Chuang, Jiahong Liu, Weiwei Shao, Jiahui Lu, and Han Gao. 2022. "The Considerable Water Evaporation Induced by Human Perspiration and Respiration in Megacities: Quantifying Method and Case Study in Beijing" International Journal of Environmental Research and Public Health 19, no. 14: 8638. https://doi.org/10.3390/ijerph19148638